Franklin Financial Network Inc
Franklin Financial Network — Q3 2018 Earnings Presentation
16 slides from Franklin Financial Network's earnings presentation, Oct 24, 2018
Slide 1: Third Quarter 2018 Investor Call
Franklin Financial Network, Inc. (NYSE:FSB) Third Quarter 2018 Investor Call October 25, 2018
Slide 2: Forward-Looking Statements
Forward - Looking Statements Except for the historical information contained herein, this presentation contains forward - looking statements within the meaning of Section 27A of the Securities Act of 1933, as amended, and Section 21E of the Securities Exchange Act of 1934, as amended. The forward -
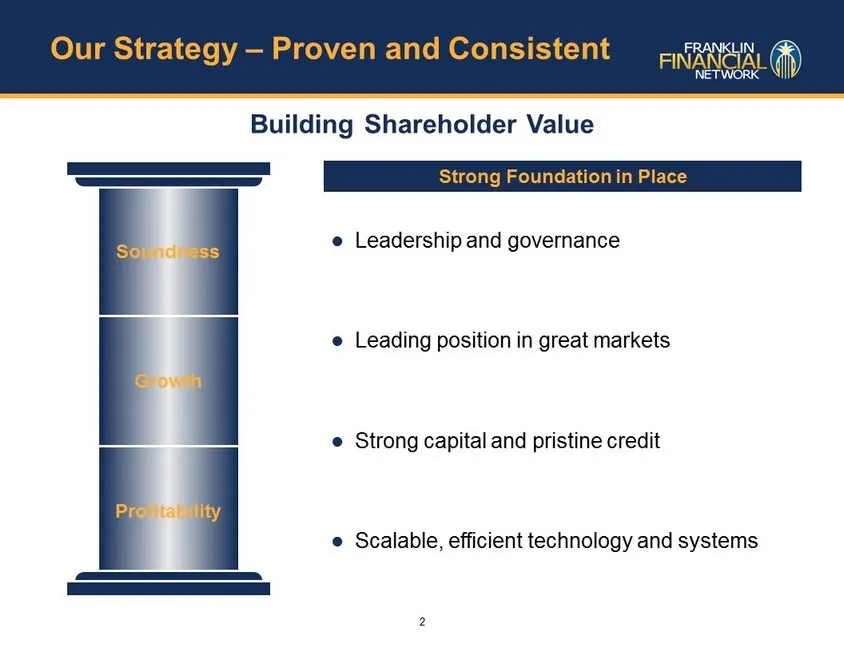
Slide 3: Our Strategy – Proven and Consistent
Our Strategy – Proven and Consistent Strong Foundation in Place Leadership and governance Leading position in great markets Strong capital and pristine credit Scalable, efficient technology and systems Building Shareholder Value Soundness Growth Profitability 2
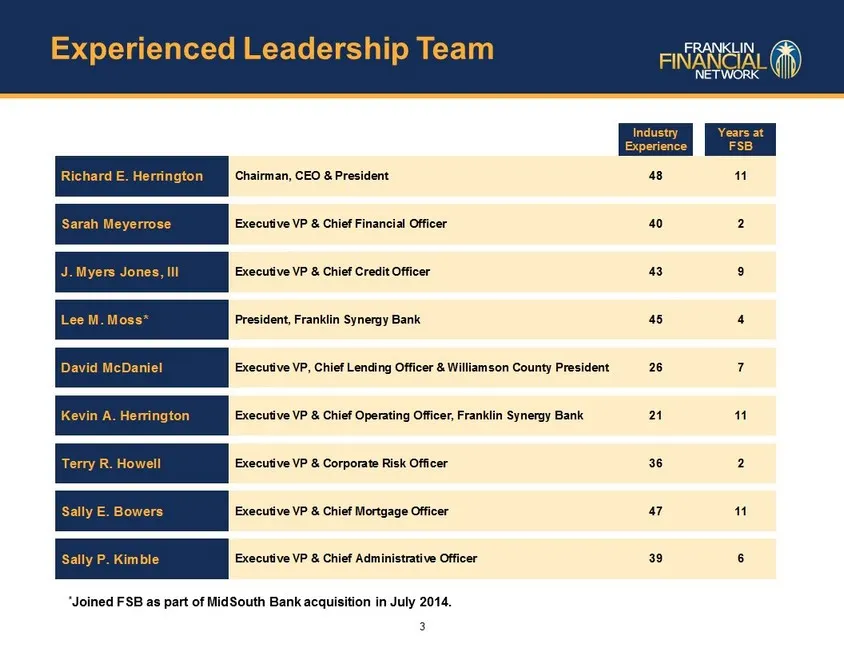
Slide 4: Experienced Leadership Team
Experienced Leadership Team Industry Experience Years at FSB Richard E. Herrington Chairman, CEO & President 48 11 Sarah Meyerrose Executive VP & Chief Financial Officer 40 2 J. Myers Jones, III Executive VP & Chief Credit Officer 43 9 Lee M. Moss* President, Franklin Synergy Bank 45 4 David McDanie
Slide 5: Nashville market overview
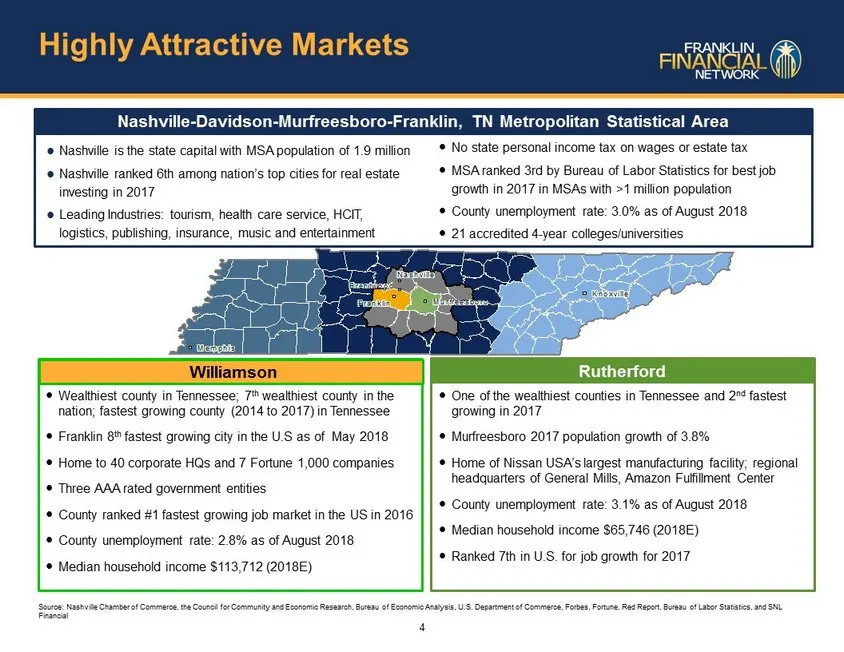
Ranked 30 th in Forbes 2016 Best Places for Business and Careers Nashville is the state capital with MSA population of 1.9 million Nashville ranked 6th among nation’s top cities for real estate investing in 2017 Leading Industries: tourism, health care service, HCIT, logistics, publishing, ins
Slide 6: Financial Highlights and Recent Developments for Third Quarter 2018
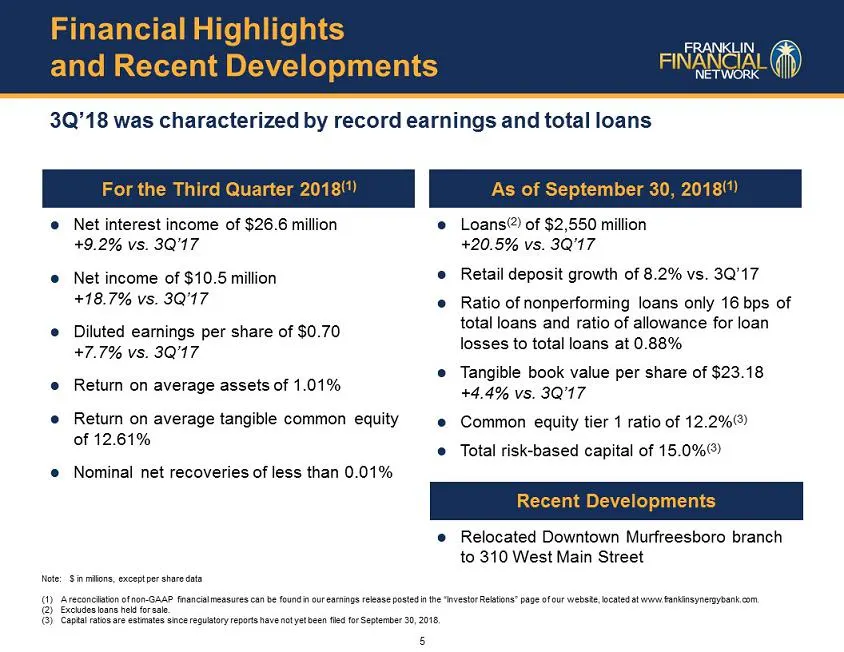
Financial Highlights and Recent Developments For the Third Quarter 2018 (1) As of September 30, 2018 (1) Net interest income of $26 . 6 million +9.2% vs. 3Q’17 Net income of $10.5 million +18.7% vs. 3Q’17 Diluted earnings per share of $0.70 +7.7% vs. 3Q’17 Return on average assets of 1.01%
Slide 7: Solid Credit and Low Risk Balance Sheet
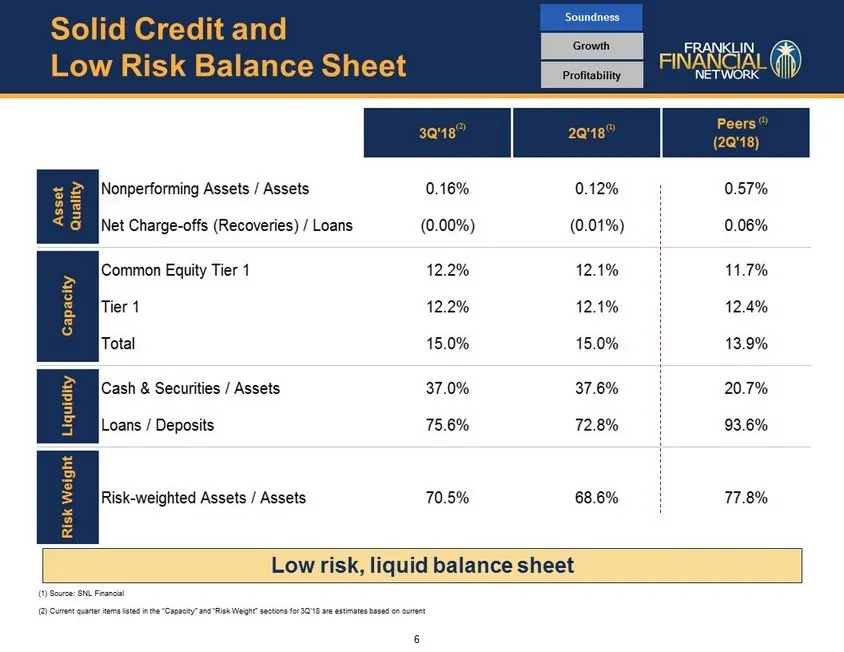
Solid Credit and Low Risk Balance Sheet (1) Source: SNL Financial (2) Current quarter items listed in the “Capacity” and “Risk Weight” sections for 3Q’18 are estimates based on current Low risk, liquid balance sheet Growth Profitability Soundness (1) 6 (1) (2)
Slide 8: ALLL as % of Nonperforming Assets
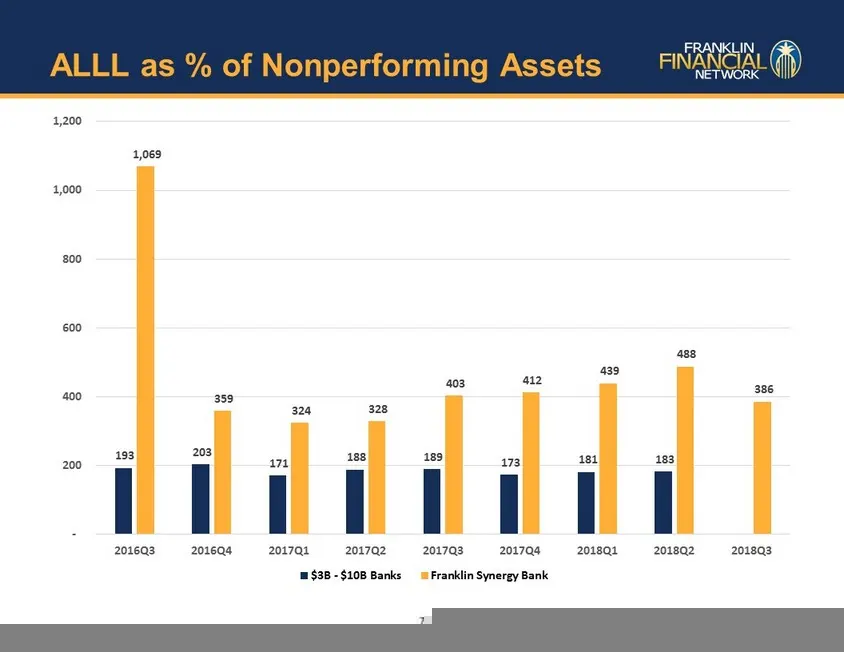
ALLL as % of Nonperforming Assets 7 193 203 171 188 189 173 181 183 1,069 359 324 328 403 412 439 488 386 - 200 400 600 800 1,000 1,200 2016Q3 2016Q4 2017Q1 2017Q2 2017Q3 2017Q4 2018Q1 2018Q2 2018Q3 $3B - $10B Banks Franklin Synergy Bank
Slide 9: Well Diversified Loan Portfolio
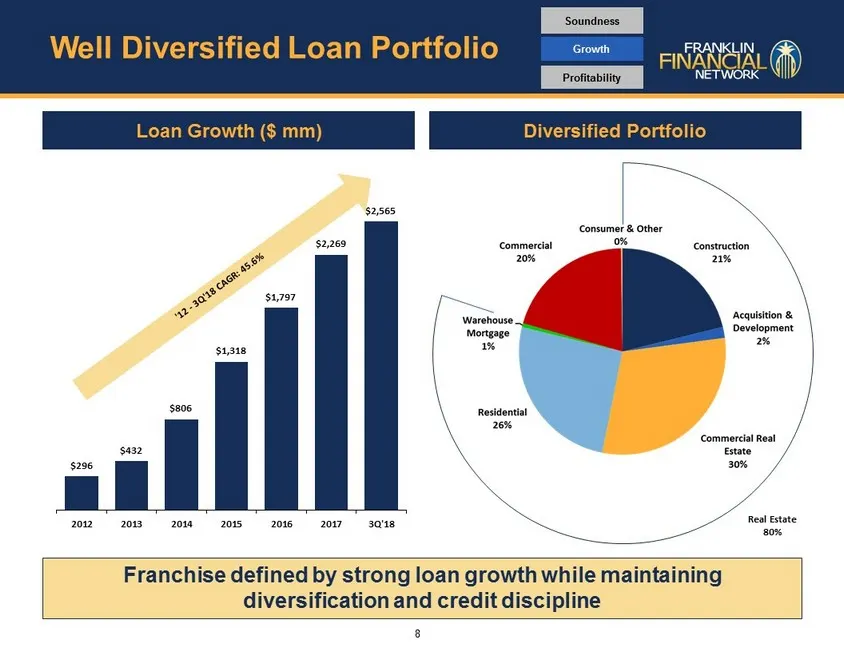
Well Diversified Loan Portfolio Loan Growth ($ mm) Diversified Portfolio Real Estate 80% Franchise defined by strong loan growth while maintaining diversification and credit discipline Growth Profitability Soundness $296 $432 $806 $1,318 $1,797 $2,269 $2,565 2012 2013 2014 2015 2016 2017 3Q'18 8
Slide 10: Year-Over-Year Loan Growth
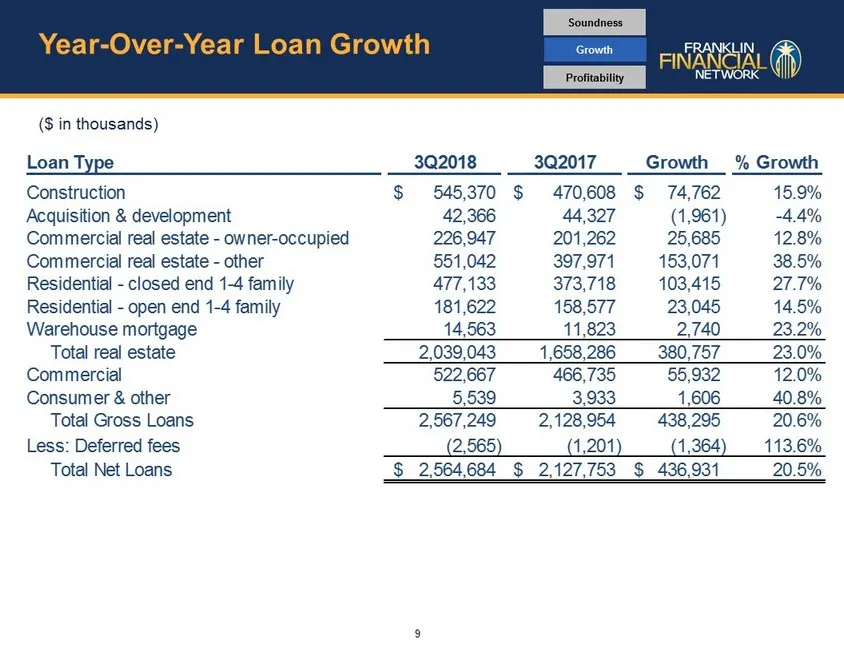
Year - Over - Year Loan Growth Loan Type 3Q2018 3Q2017 Growth % Growth Construction 545,370$ 470,608$ 74,762$ 15.9% Acquisition & development 42,366 44,327 (1,961) -4.4% Commercial real estate - owner-occupied 226,947 201,262 25,685 12.8% Commercial real estate - other 551,042 397,971 153,071 38.5%
Slide 11: Strategic Deposit Sources
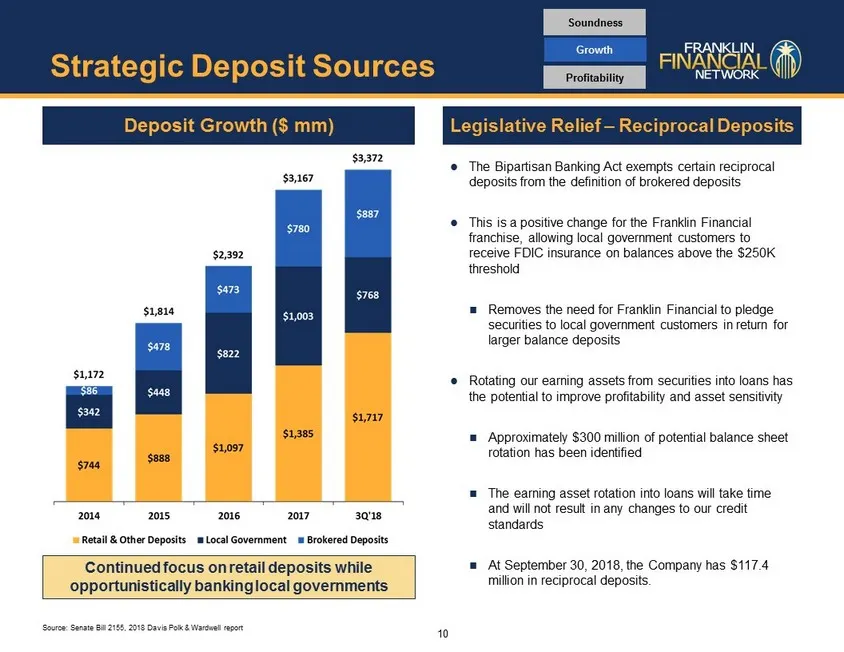
Strategic Deposit Sources Source: Senate Bill 2155, 2018 Davis Polk & Wardwell report Legislative Relief – Reciprocal Deposits Deposit Growth ($ mm) Continued focus on retail deposits while opportunistically banking local governments Growth Profitability Soundness The Bipartisan Banking Act exempt
Slide 12: Building Earnings Momentum and Tangible Book Value
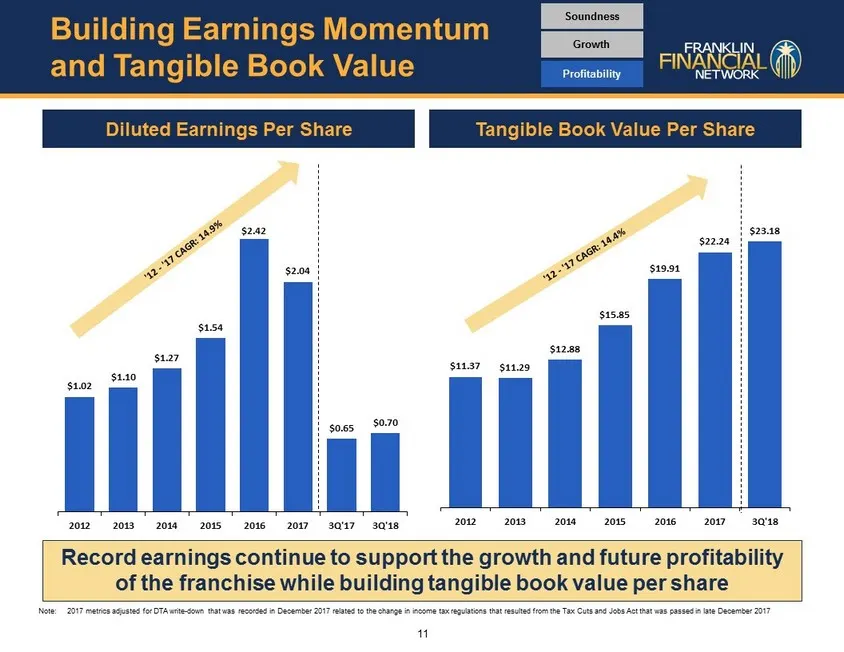
Building Earnings Momentum and Tangible Book Value Diluted Earnings Per Share Tangible Book Value Per Share Note: 2017 metrics adjusted for DTA write - down that was recorded in December 2017 related to the change in income tax regula tions that resulted from the Tax Cuts and Jobs Act that was passe
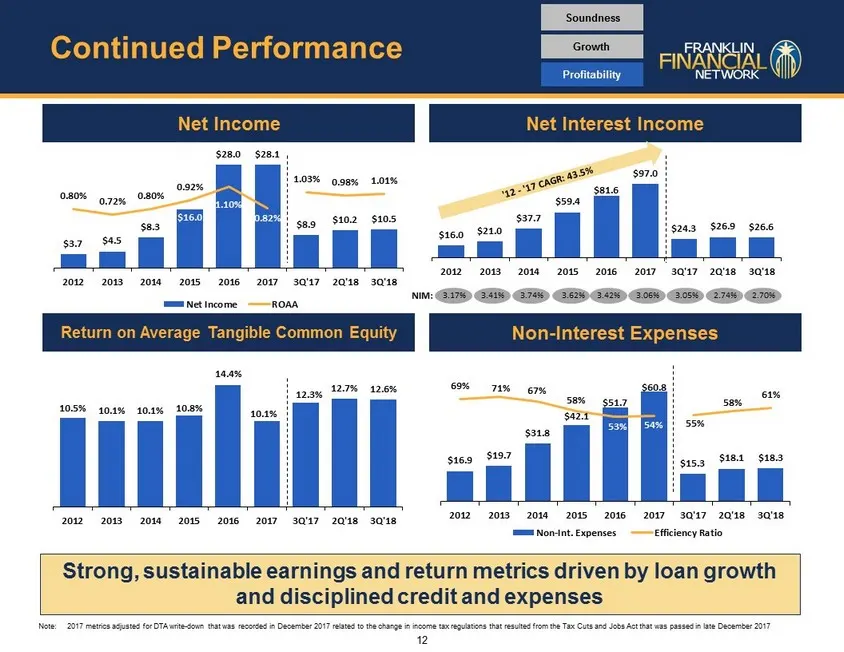
Slide 13: Continued Performance
Continued Performance Net Income Net Interest Income Note: 2017 metrics adjusted for DTA write - down that was recorded in December 2017 related to the change in income tax regula tions that resulted from the Tax Cuts and Jobs Act that was passed in late December 2017 NIM: 3.17% 3.41% 3.74% 3.62% 3.
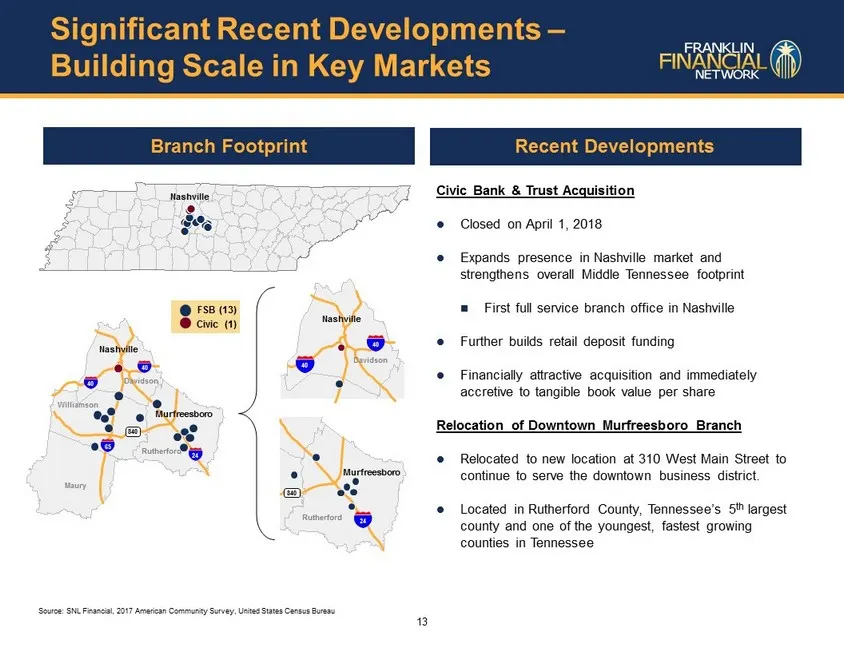
Slide 14: Significant Recent Developments – Building Scale in Key Markets
l l l l l l l l l l l l l l l l l l l l l l l l l l l l l l l l l l l l l l l l l l l l l l l l l l l l l l l l l l l l l l l l l l l l l l l l l l l l l l l l l l l l l l l l l ll l l l l l l l l l l l l l l l l l l l l l l l l l l l l l l l l l l l l l l l l l l l l F:\Word Processing\MapInfo\MapI
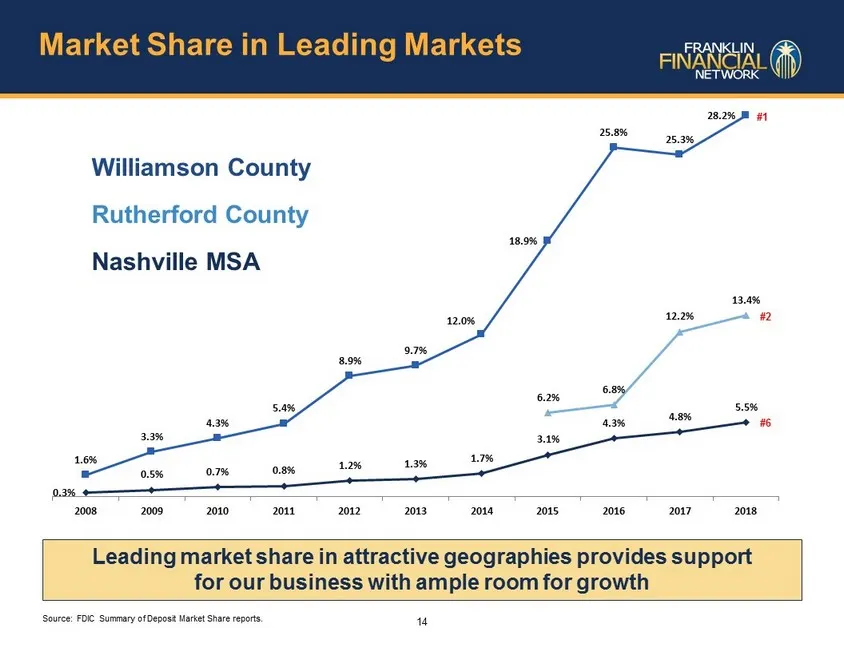
Slide 15: Market Share in Leading Markets
Market Share in Leading Markets 0.3% 0.5% 0.7% 0.8% 1.2% 1.3% 1.7% 3.1% 4.3% 4.8% 5.5% 1.6% 3.3% 4.3% 5.4% 8.9% 9.7% 12.0% 18.9% 25.8% 25.3% 28.2% 6.2% 6.8% 12.2% 13.4% 2008 2009 2010 2011 2012 2013 2014 2015 2016 2017 2018 #1 #2 #6 Williamson County Rutherford County Nashville MSA Leading market sh
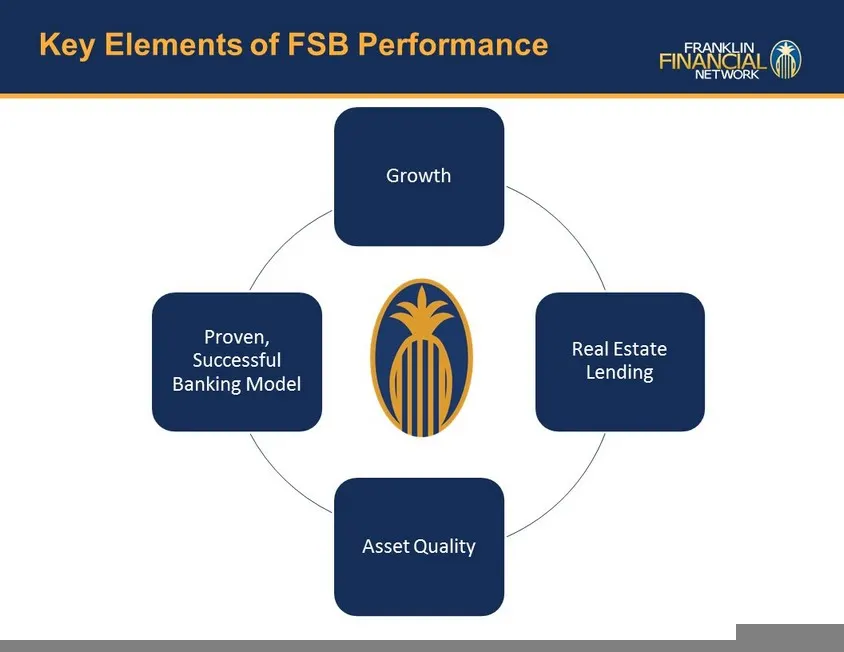
Slide 16: Key Elements of FSB Performance
Growth Real Estate Lending Asset Quality Proven, Successful Banking Model Key Elements of FSB Performance
Source: SEC EDGAR · 8-K filed Oct 24, 2018
More decks from Franklin Financial Network Inc
 Merger or Acquisition (January 2020)17 slides · Jan 21, 2020
 Q3 2019 Earnings Presentation21 slides · Nov 1, 2019
 Q3 2019 Earnings Presentation15 slides · Oct 23, 2019
 Q2 2019 Earnings Presentation19 slides · Jul 26, 2019
 Q2 2019 Earnings Presentation15 slides · Jul 24, 2019
 Q1 2019 Earnings Presentation19 slides · May 10, 2019