Inland Real Estate — Investor Presentation (May 2004)
37 slides from Inland Real Estate's investor presentation, May 24, 2004
Slide 1: Inland Real Estate Corporation
Inland Real Estate Corporation May 2004
Slide 2: Forward Looking Statement Disclosure
Forward Looking Statement Disclosure . This document may contain forward-looking statements. Forward-looking statements are statements that are not historical, including statements regarding management's intentions, beliefs, expectations, representations, plans or predictions of the future, and are
Slide 3: Company Overview
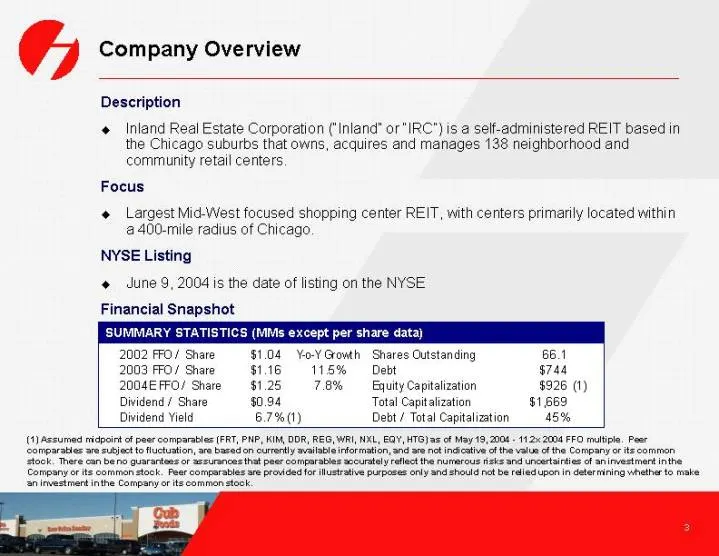
Company Overview Description + Inland Real Estate Corporation (‘Inland” or"IRC’) is a self-administered REIT based in the Chicago suburbs that owns, acquires and manages 138 neighborhood and community retail centers, Focus ¢ Largest Mid:West focused shopping center REIT, with centers primarily locat
Slide 4: Company Overview: Market Leading Operator with Over 35 Years Experience
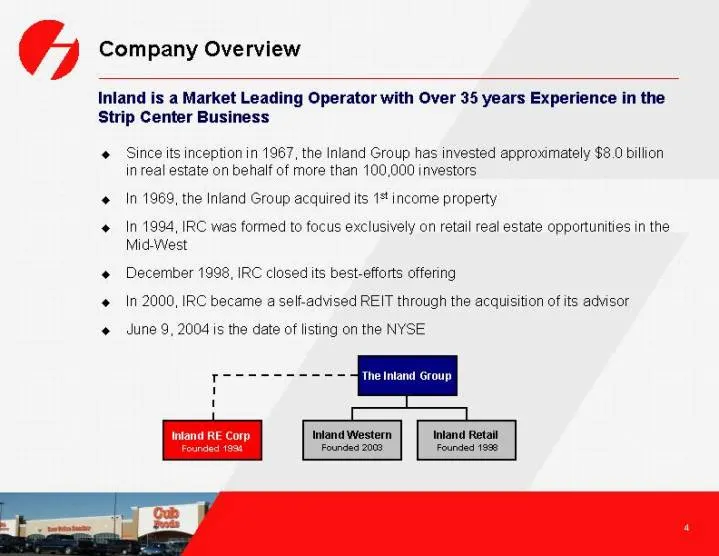
Company Overview Inland is a Market Leading Operator with Over 35 years Experience in the Strip Center Business ¢ Since its inception in 1967, the Inland Group has invested approximately $8.0 billion in real estate on behalf of more than 100,000 investors In 1969, the Inland Group acquired its 1 inc
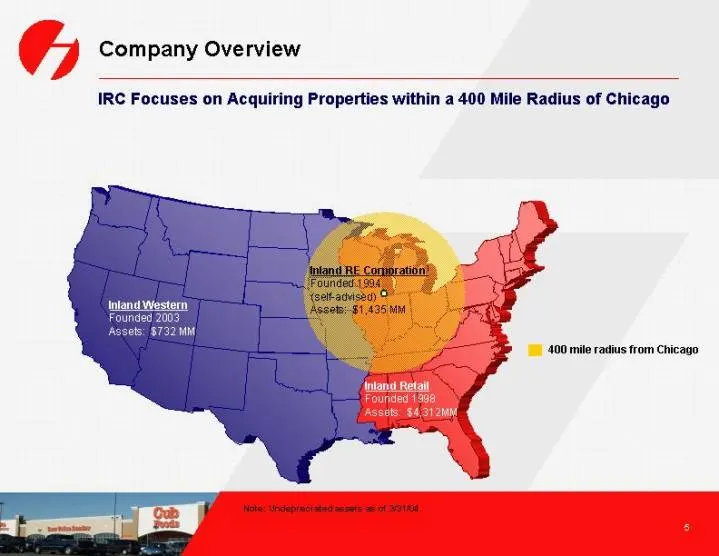
Slide 5: IRC Focuses on Acquiring Properties within a 400 Mile Radius of Chicago
G Company Overview IRC Focuses on Acquiring Properties within a 400 Mile Radius of Chicago 1) 400 mite radius from Chicago (land Retail Founded 1 ee $4.31
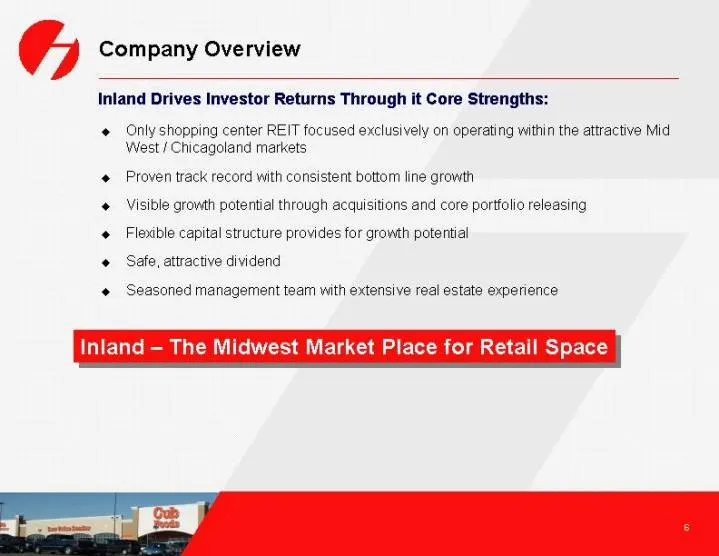
Slide 6: Inland Drives Investor Returns Through its Core Strengths
Company Overview Inland Drives Investor Returns Through it Core Strengths: . oe ee . Only shopping center REIT focused exclusively on operating within the attractive Mid West / Chicagoland markets Proven track record with consistent bottom line growth Visible growth potential through acquisitions an
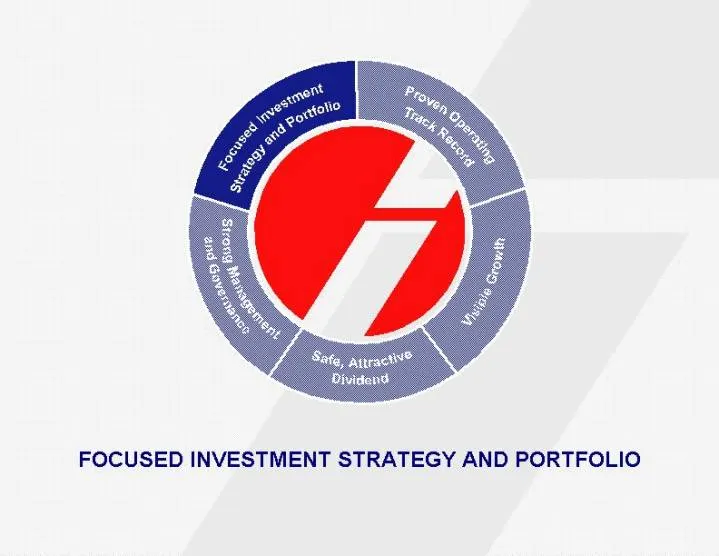
Slide 7: Focused Investment Strategy and Portfolio
“ % "ey, Sate, attract" Dividend FOCUSED INVESTMENT STRATEGY AND PORTFOLIO
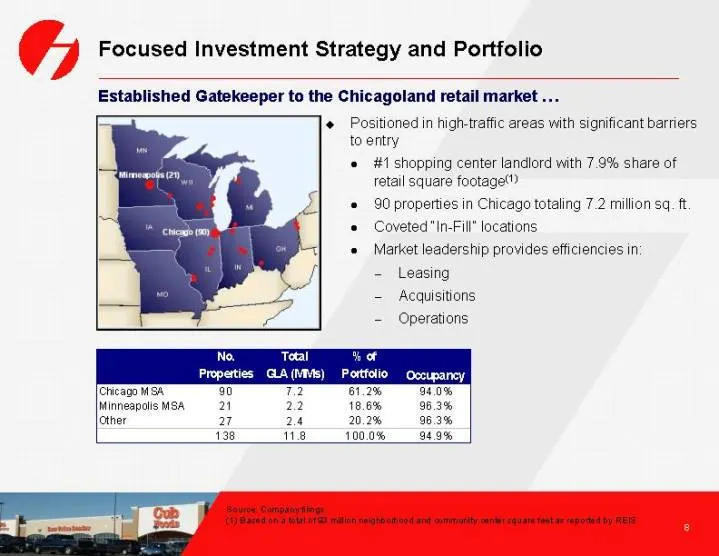
Slide 8: Established Gatekeeper to the Chicagoland Retail Market
Focused Investment Strategy and Portfolio Established Gatekeeper to the Chicagoland retail market ... ¢ Positioned in high-traffic areas with significant barriers to entry #1 shopping center landlord with 7.9% share of retail square footage” 90 properties in Chicago totaling 7.2 million sq. ft © Cov
Slide 9: Which is the Premier Mid-West Economy
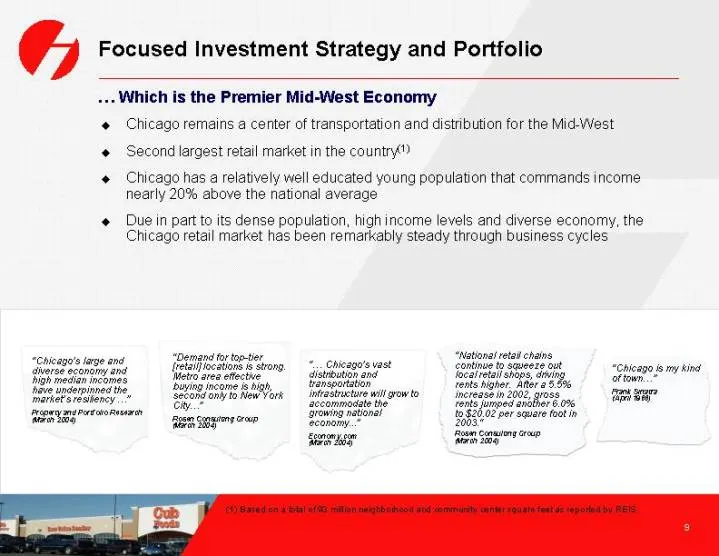
Fo cused Investment Strategy and Portfolio ... Which is the Premier Mid-West Economy . “Chicago's lage and Chicago remains a center of transportation and distribution for the Mid-West Second largest retail market in the country”) Chicago has a relatively well educated young population that commands
Slide 10: Superior Demographics
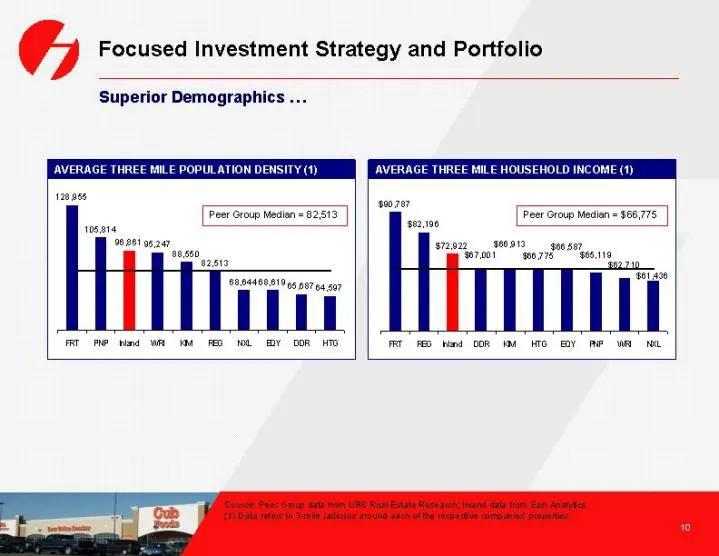
G Focused Investment Strategy and Portfolio Superior Demographics ... AVERAGE THREE MLE POPULATION DENSITY (1) AVERAGE THREE MILE HOUSEHOLD INCOME (1) ages Ls seore7 Peer Group Madi — $22.08 onast osa47 s729 $08919_sgne7 wero geor7e 96.119 009640021945 56794507 FAT Phe hind wR wR FED YOR Y COR HTD F
Slide 11: Produce 'Top Three' Aggregate Income Among the Peer Group
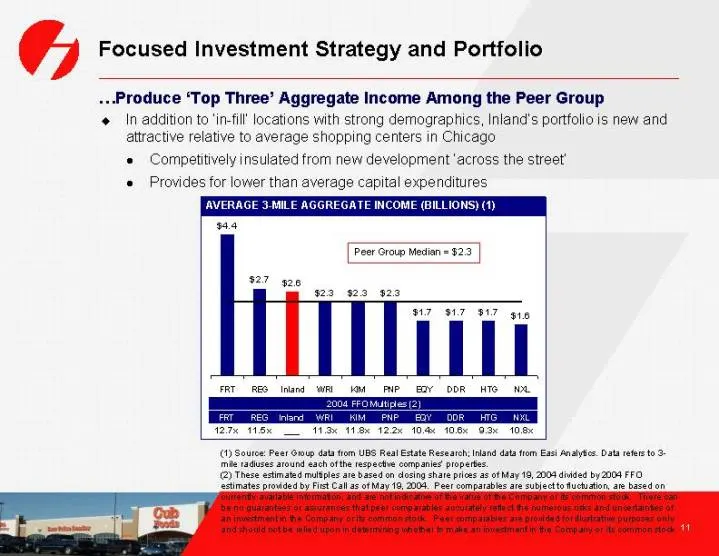
Focused Investment Strategy and Portfolio ...Produce ‘Top Three’ Aggregate Income Among the Peer Group In. addition to ‘in-fill locations with strong demographics, Inland's portfolio is new and attractive relative to average shopping centers in Chicago © Competitively insulated from new development
Slide 12: High Quality Diversified Tenant Base
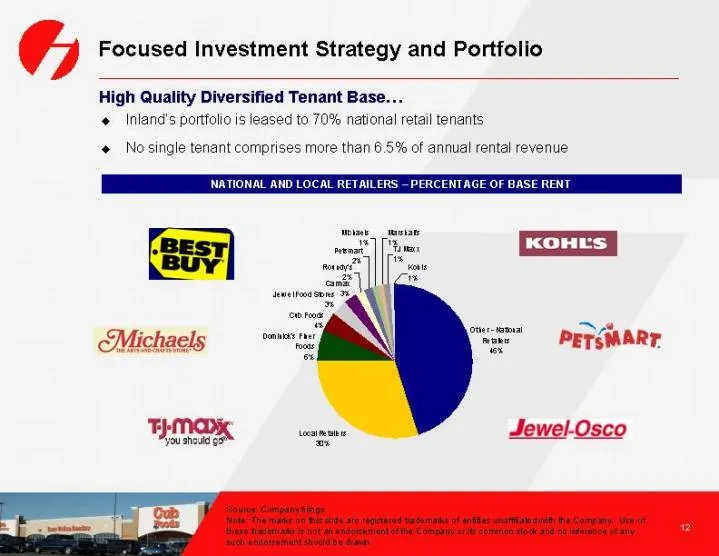
G Focused Investment Strategy and Portfolio High Quality Diversified Tenant Base... ¢ Inland’s portfolio is leased to 70% national retail tenants ¢ No single tenant comprises more than 6.5% of annual rental revenue NATION: AND LOCAL RETAILERS ~ PERCENTAGE OF BASE RENT Michaels 22 war" PETsMART, JSew
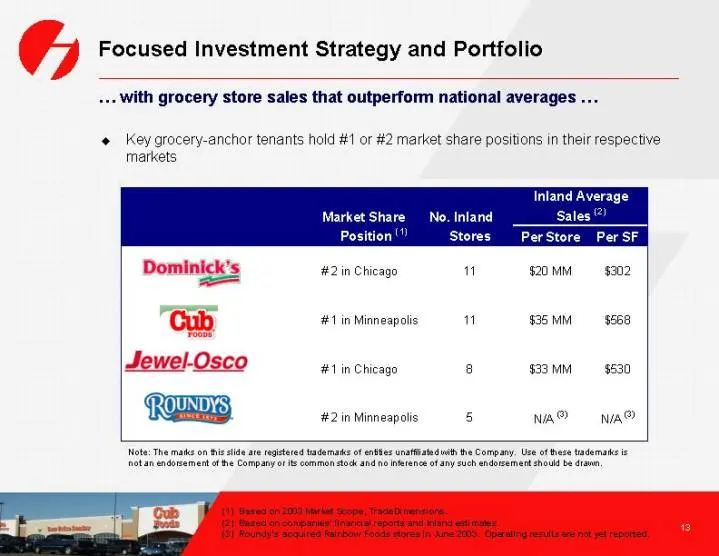
Slide 13: Grocery Store Sales that Outperform National Averages
Focused Investment Strategy and Portfolio .+. with grocery store sales that outperform national averages ... « Key grocery-anchor tenants hold #1 or #2 market share positions in their respective markets Inland Average Market Share No. Inland Sales @ Position |”) Stores PerStore Per SF Dominick's #2
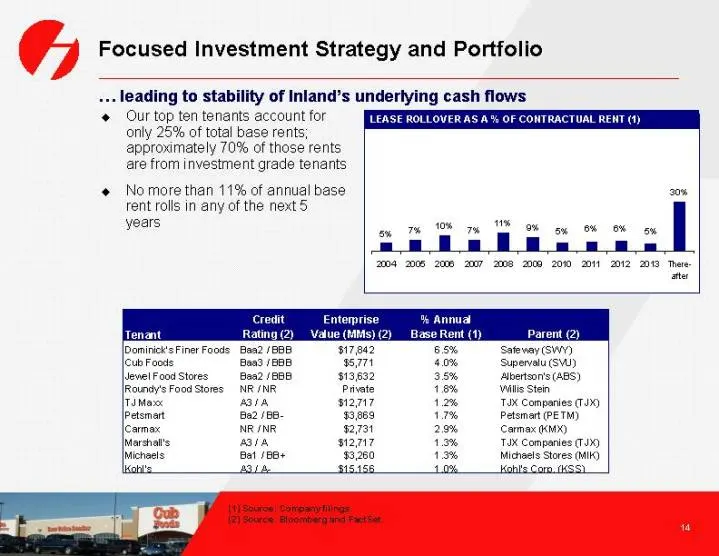
Slide 14: Stability of Inland's Underlying Cash Flows
Focused Investment Strategy and Portfolio leading to stability of Inland’s underlying cash flows Our top ten tenants account for LEASE ROLLOVER AS A‘ OF CONTRACTUAL RENT (1) only 25% of total base rents; approximately 70% of those rents are from investment grade tenants + No more than 11% of annual
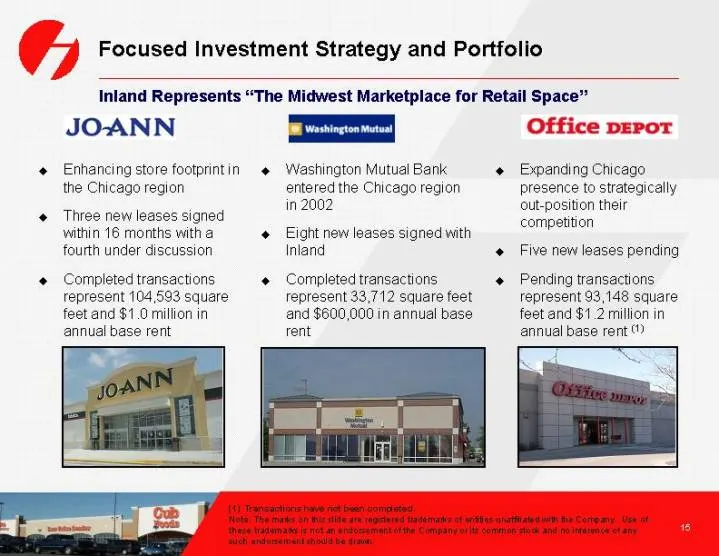
Slide 15: Inland Represents The Midwest Marketplace for Retail Space
Focused Investment Strategy and Portfolio Inland Represents “The Midwest Marketplace for Retail Space” JO-ANN == ff Enhancing store footprintin Washington Mutual Bank + Expanding Chicago the Chicago region entered the Chicago region presence to strategically in 2002 out-position their @ Three new le
Slide 16: Proven Operating Track Record
PROVEN OPERATING TRACK RECORD
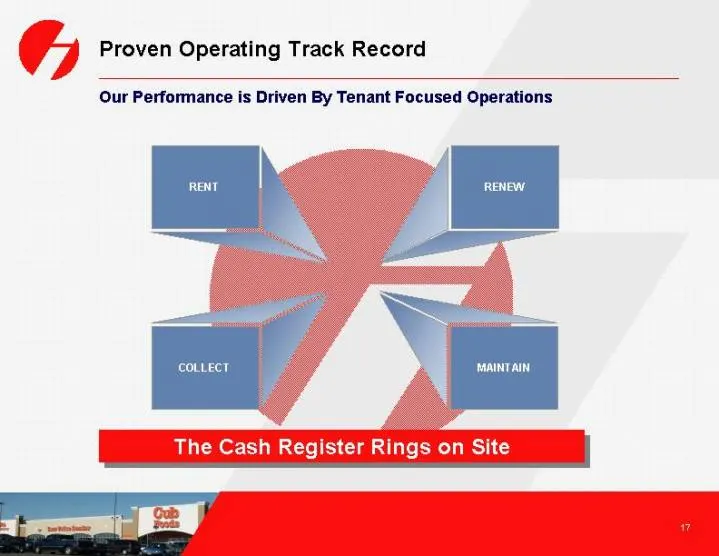
Slide 17: Our Performance is Driven By Tenant Focused Operations
G Proven Operating Track Record Our Performance is Driven By Tenant Focused Operations The Cash Register Rings on Site
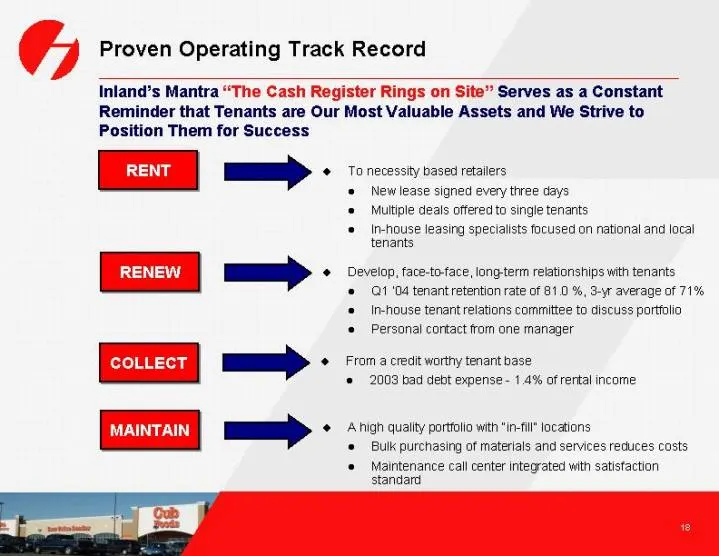
Slide 18: The Cash Register Rings on Site
Proven Operating Track Record Inland’s Mantra “The Cash Register Rings on Site” Serves as a Constant Reminder that Tenants are Our Most Valuable Assets and We Strive to Position Them for Success RENT => # Tonecessty based retailers © New lease signed every three days '* Multiple deals offered to sin
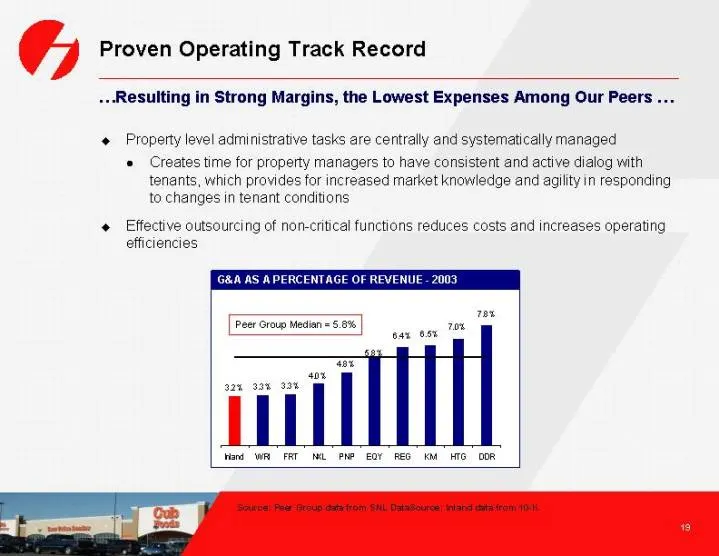
Slide 19: Strong Margins, the Lowest Expenses Among Our Peers
Proven Operating Track Record ...Resulting in Strong Margins, the Lowest Expenses Among Our Peers . + Property level administrative tasks are centrally and systematically managed © Creates time for property managers to have consistent and active dialog with tenants, which provides for increased mark
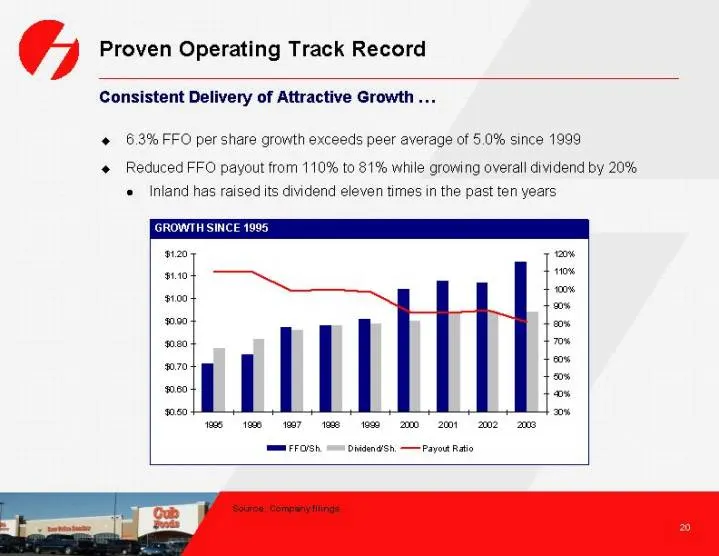
Slide 20: Consistent Delivery of Attractive Growth
Proven Operating Track Record Consistent Delivery of Attractive Growth ... @ 6.3% FFO per share growth exceeds peer average of 5.0% since 1999. + Reduced FFO payout from 110% to 81% while growing overall dividend by 20% «Inland has raised its dividend eleven times in the past ten years eo 7% 70 a os
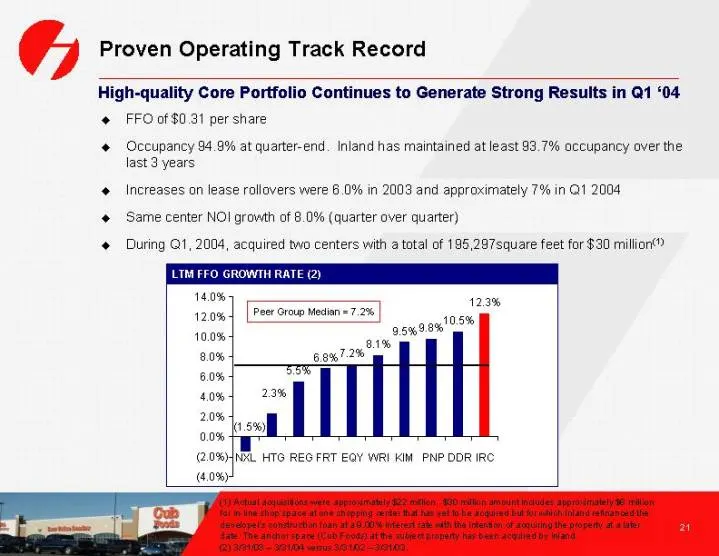
Slide 21: High-quality Core Portfolio Continues to Generate Strong Results in Q1 '04
Proven Operating Track Record High-quality Core Portfolio Continues to Generate Strong Results in Q1 ‘04 @ FFO of $0.31 per share @ Occupancy 94.9% at quarter-end. Inland has maintained at least 83.7% occupancy over the last 3 years + Increases on lease rollovers were 6.0% in 2003 and approximately
Slide 22: Visible Growth
VISIBLE GROWTH
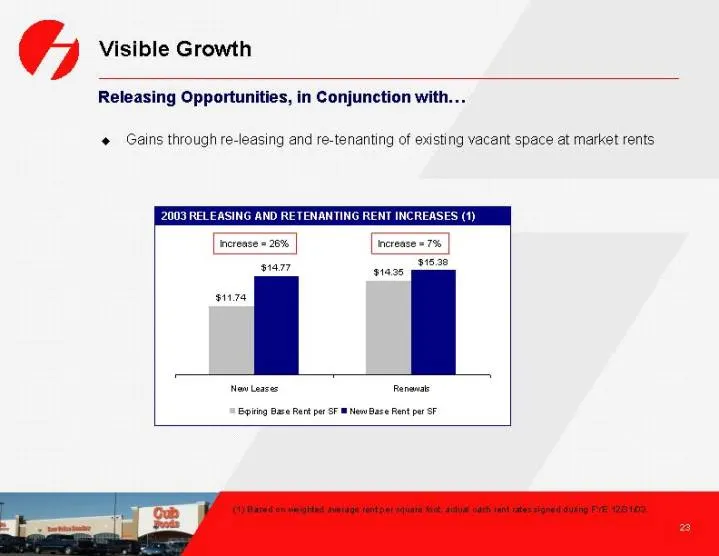
Slide 23: Releasing Opportunities
Visible Growth Releasing Opportunities, in Conjunction with. ¢ Gains through re-leasing and re-tenanting of existing vacant space at market rents 2003 RELEASING AND RETENANTING RENT INCREASES (1) [erence = 26% [erence «7% 31538 3147 ease : J Now Learee ananat [Sping Bae ert par SF New Base Rent pr S
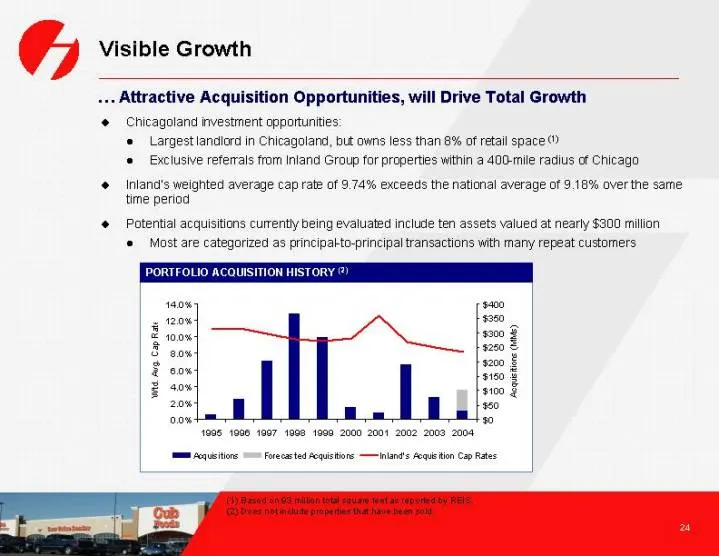
Slide 24: Attractive Acquisition Opportunities Will Drive Total Growth
Visible Growth Attractive Acquisition Opportunities, will Drive Total Growth @ Chicagoland investment opportuntties: © Largest landlord in Chicagoland, but owns less than 8% of retail space © Exclusive referrals from Inland Group for properties within a 400-mile radius of Chicago ¢ Inlana’s weighted
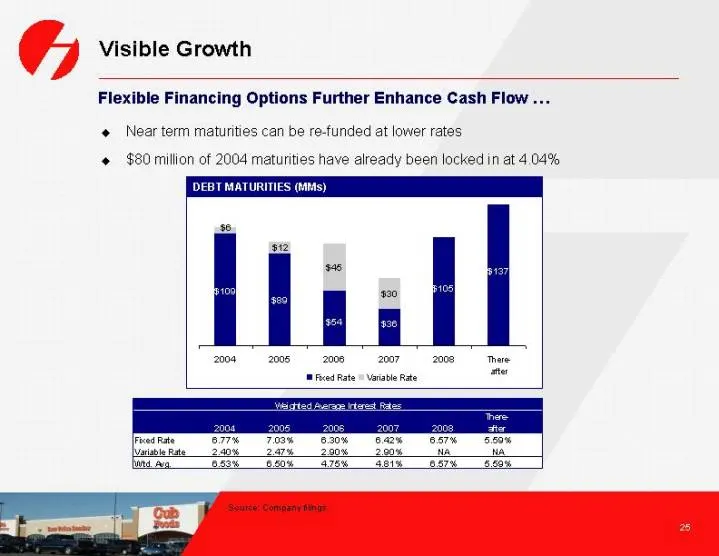
Slide 25: Flexible Financing Options Further Enhance Cash Flow
Visible Growth Flexible Financing Options Further Enhance Cash Flow ... ¢ Near term maturities can be re-funded at lower rates $80 million of 2004 maturities have already been locked in at 4.04%
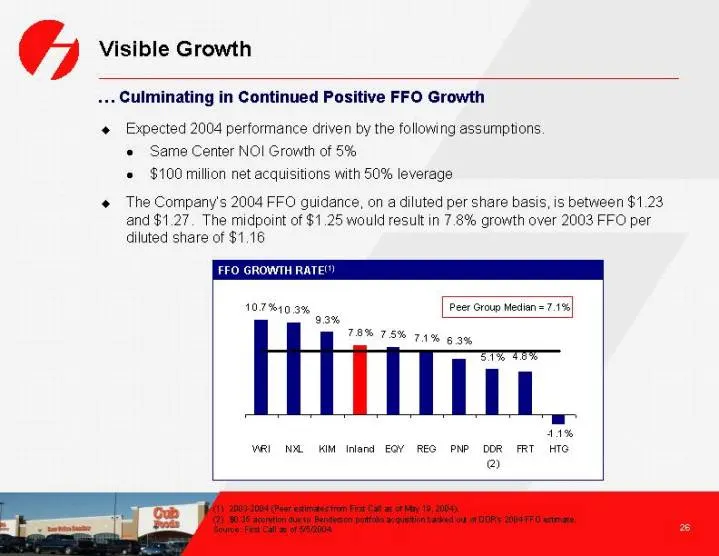
Slide 26: Culminating in Continued Positive FFO Growth
Visible Growth ... Culminating in Continued Positive FFO Growth + Expected 2004 performance driven by the following assumptions Same Center NOI Growth of 5% ¢ $100 million net acquisitions with 50% leverage The Company's 2004 FFO guidance, on a diluted per share basis, is between $1.23 and $1.27. Th
Slide 27: Safe, Attractive Dividend
SAFE, ATTRACTIVE DIVIDEND
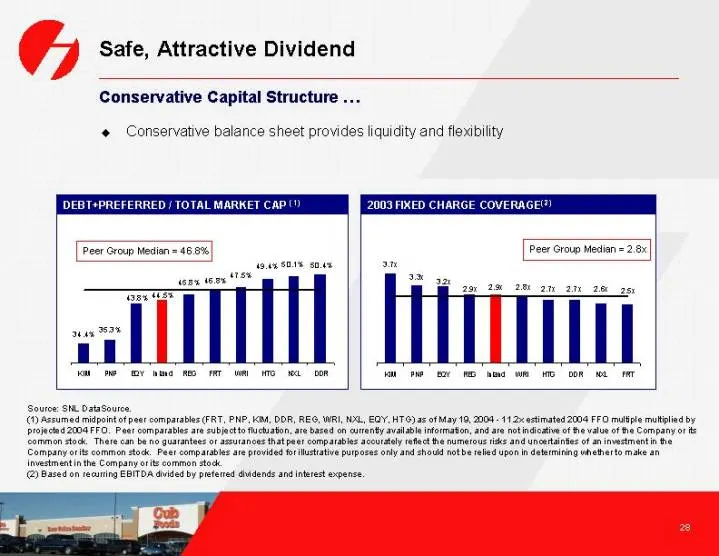
Slide 28: Conservative Capital Structure
Safe, Attractive Dividend Conservative Capital Structure . ¢ Conservative balance sheet provides liquidity and flexibility DEBT+PREFERRED / TOTAL MARKET CAP” 2003 FIKED CHARGE COVERAGE) Peer Group Medion = 465% Peer Group Meck Source: SM. OataSoures. (Gh Assumed midpoint ot post comparables (FRT, PN
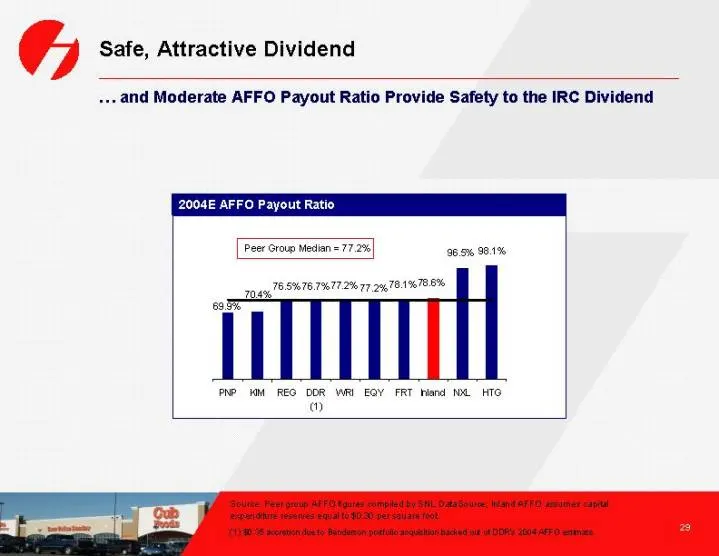
Slide 29: Moderate AFFO Payout Ratio Provides Safety to the Dividend
G Safe, Attractive Dividend ... and Moderate AFFO Payout Ratio Provide Safety to the IRC idend 2004E AFFO Payout Ratio 765% 767%77 2% 77. 74,70.1%TES% roe! Tz PNPM REG OOR WRI EQY FRT Nand WL HTC o
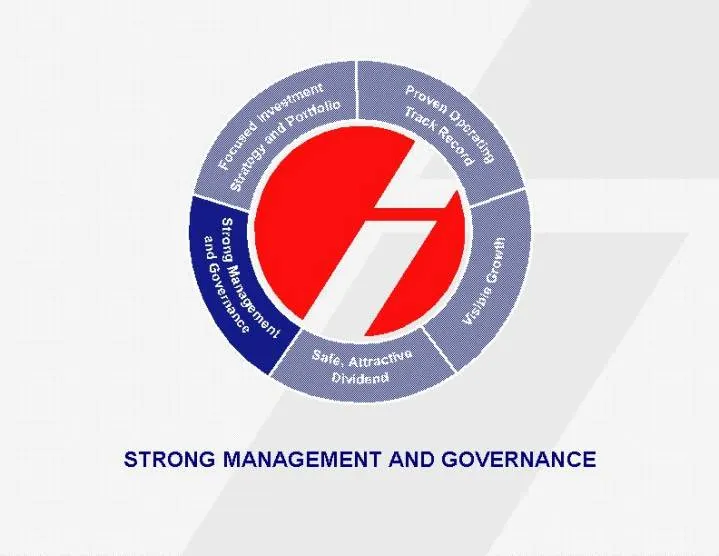
Slide 30: Strong Management and Governance
STRONG MANAGEMENT AND GOVERNANCE
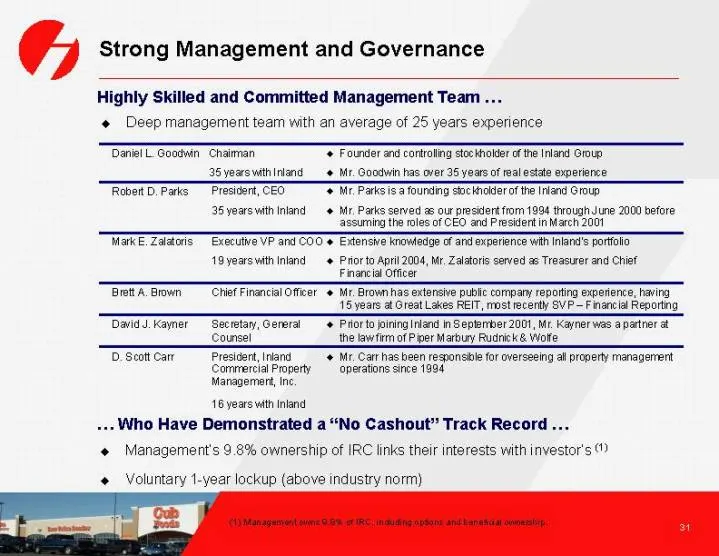
Slide 31: Highly Skilled and Committed Management Team
Strong Management and Governance Highly Skilled and Committed Management Team ¢ Deep management team with an average of 25 years experience ‘Dani Goodwin Chaimnan 36 years with inland Robot b, Parks Presigent, CEO 36 years vith Inland Founder and cortraling storsnolder ofthe Inland Group Mr. Goodwin
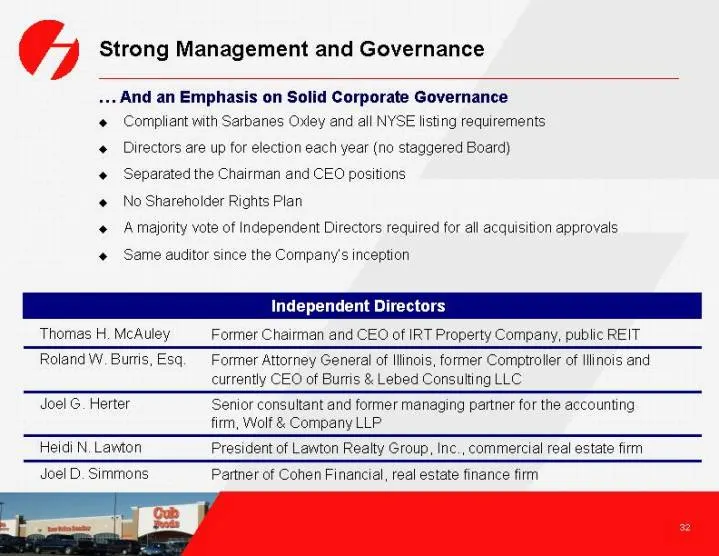
Slide 32: Emphasis on Solid Corporate Governance
Strong Management and Governance ... And an Emphasis on Solid Corporate Governance ¢ Compliant with Sarbanes Oxley and all NYSE listing requirements + Directors are up for election each year (no staggered Board) Separated the Chairman and CEO positions . ‘ No Shareholder Rights Plan rs A majority vo
Slide 33: Conclusions / Investment Highlights
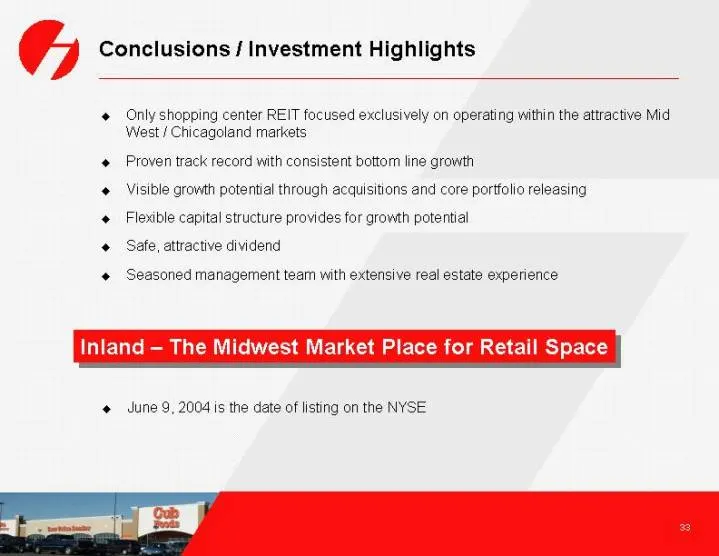
Conclusions / Investment Highlights Only shopping center REIT focused exclusively on operating within the attractive Mid West / Chicagoland markets Proven track record with consistent bottom line growth Visible growth potential through acquisitions and core portfolio releasing Flexible capital struc

Slide 34: Appendix
APPENDIX
Slide 35: Reconciliation of Non-GAAP Financial Metrics
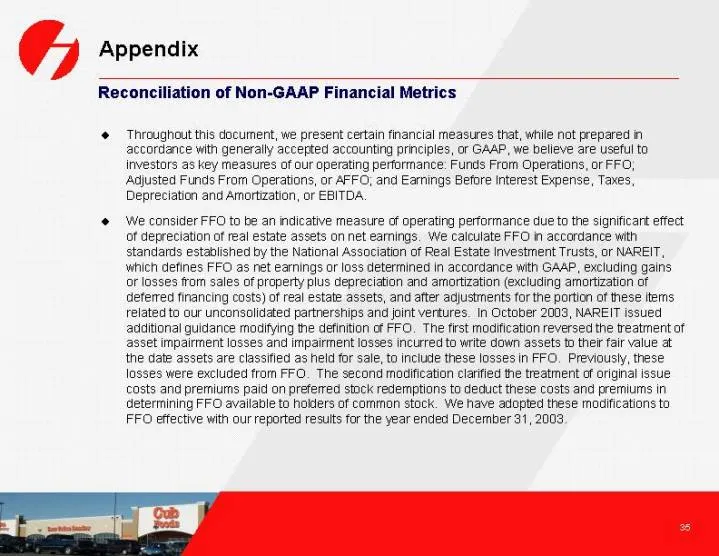
Appendix Reconciliation of Non-GAAP Financial Metrics @ Throughout this document, we present certain financial measures that, while nat prepared in accordance with generally accepted accounting principles, or GAAP, we believe are useful to Investors as key measures of our operating performance. Fund
Slide 36: Reconciliation of Non-GAAP Financial Metrics
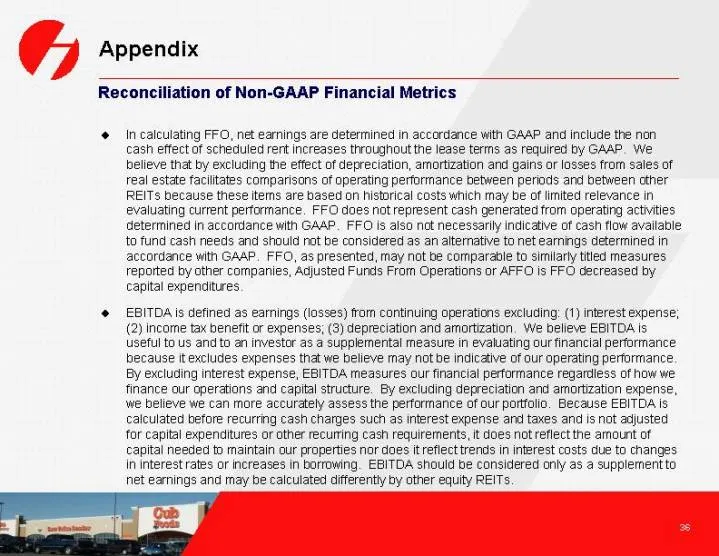
Appendix Reconciliation of Non-GAAP Financial Metrics ‘@ Incalculating FO, net earnings are determined in accordance with GAAP and include the non cash effect of scheduled rent increases throughout the lease terms as required by GAAP. We believe that by excluding the effect of depreciation, amortiza
Slide 37: Searchable text section of graphics
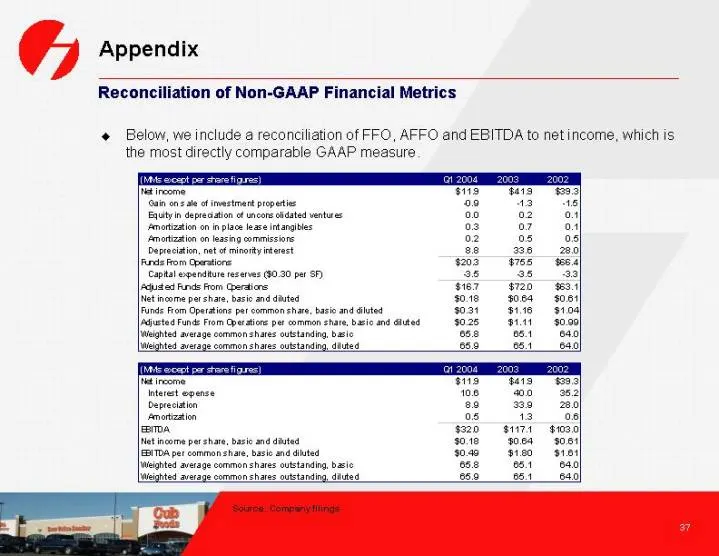
Searchable text section of graphics shown above [ LOG O] Inland Real Estate Corporation May 2004 For ward Looking Statement Disclosure • This document may contain forward-looking statements. Forward-looking statements are statements that are not historical, including statements regarding management’
Source: SEC EDGAR · 8-K filed May 24, 2004
More decks from Inland Real Estate Corp
 Investor Presentation (November 2015)30 slides · Nov 17, 2015
 Investor Presentation (September 2015)29 slides · Sep 16, 2015
 Investor Presentation (June 2015)29 slides · Jun 9, 2015
 Investor Presentation (May 2015)26 slides · May 15, 2015
 Investor Presentation (February 2015)26 slides · Feb 24, 2015
 Investor Presentation (November 2014)26 slides · Nov 5, 2014