Teppco Partners LP — Investor Presentation (June 2003)
37 slides from Teppco Partners LP's investor presentation, Jun 13, 2003
Slide 1: Investor Presentation June 2003
Investor Presentation June 2003
Slide 2: Forward-looking Statements
Forward-looking Statements The material and information furnished in this presentation contains forward-looking statements as such are described within various provisions of the Federal Securities Laws. Forward-looking statements include projections, estimates, forecasts, plans and objectives and as
Slide 3: Non-GAAP Financial Measures Disclosure
Non-GAAP Financial Measures Disclosure This presentation contains non-GAAP financial measures. We have attached to this presentation a reconciliation of EBITDA, which is used in this presentation, to net income and operating income.
Slide 4: TEPPCO Partners, L.P.
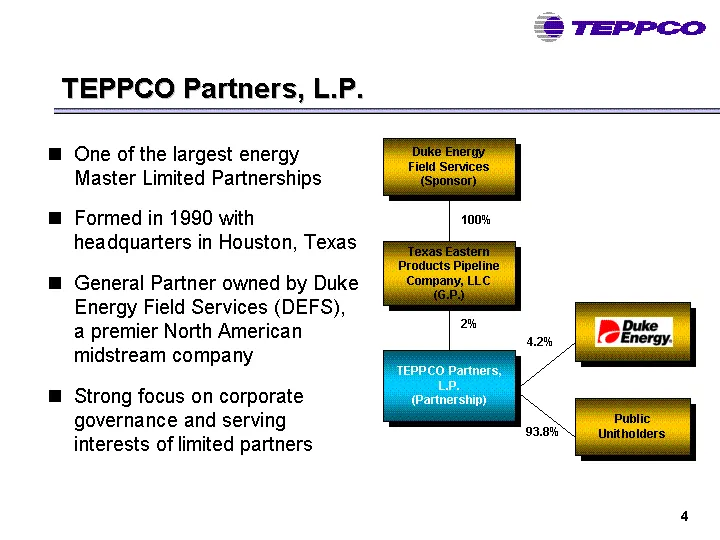
TEPPCO Partners, L.P. One of the largest energy Master Limited Partnerships Formed in 1990 with headquarters in Houston, Texas General Partner owned by Duke Energy Field Services (DEFS), a premier North American midstream company Strong focus on corporate governance and serving interests of limited
Slide 5: The Sponsor: Duke Energy Field Services
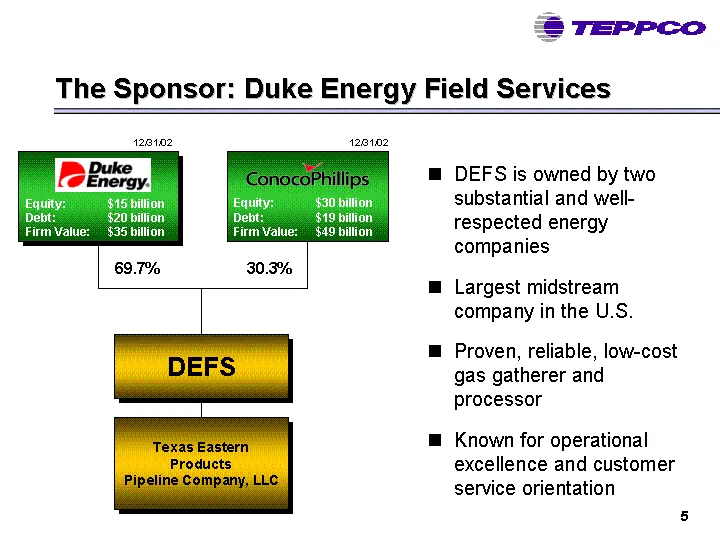
The Sponsor: Duke Energy Field Services DEFS is owned by two substantial and well- respected energy companies Largest midstream company in the U.S. Proven, reliable, low-cost gas gatherer and processor Known for operational excellence and customer service orientation DEFS 69.7% 30.3% Equity: $30 bil
Slide 6: TEPPCO's asset base has quadrupled over the last five years
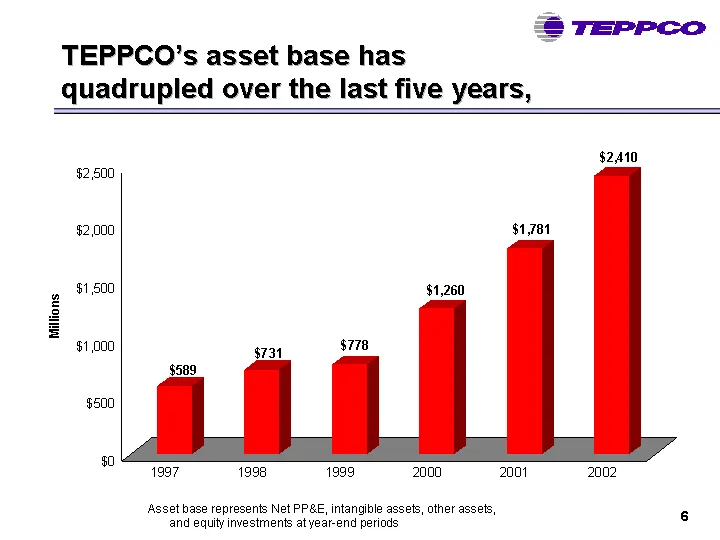
TEPPCO's asset base has quadrupled over the last five years, Assets 1990 549.9 1991 550.9 1992 552.2 1993 543.6 1994 557.5 1995 550.2 1996 561 1997 589 1998 731 1999 778 2000 1260 2001 1781 2002 2410 Asset base represents Net PP&E, intangible assets, other assets, and equity investments at year-end
Slide 7: and volumes have grown significantly
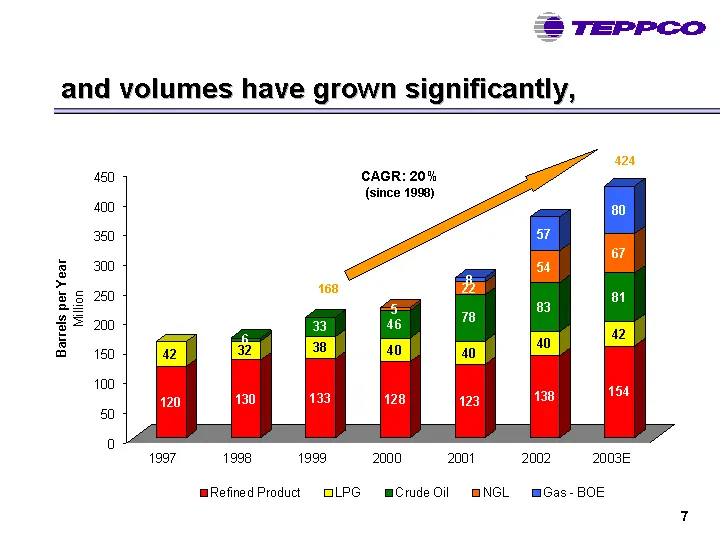
and volumes have grown significantly, 1991 1992 1993 1994 1995 1996 1997 1998 1999 2000 2001 2002 2003E Refined Product 89.203 87.616 90.712 107.271 110.234 115.262 119.971 130.467 132.642 128.151 122.9 138.2 154.2 LPG 34.652 34.821 38.813 36.636 38.237 41.64 41.991 32.048 37.575 39.633 40 40.49 41.
Slide 8: resulting in substantial EBITDA growth
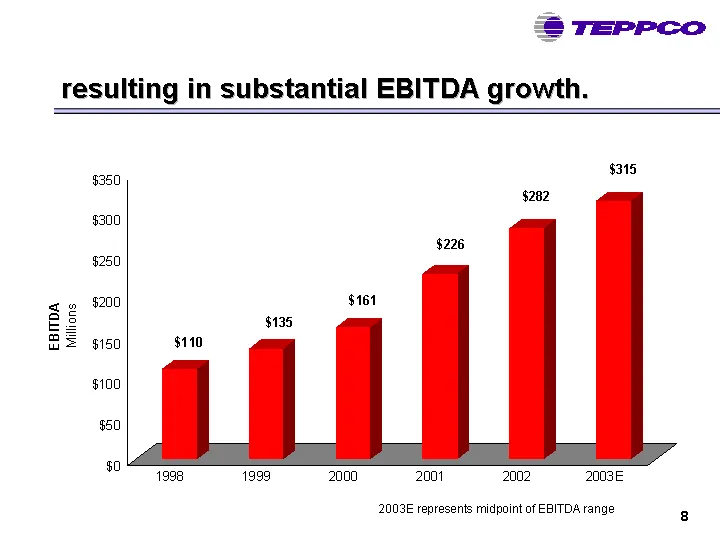
resulting in substantial EBITDA growth. 1998 1999 2000 2001 2002 2003E EBITDA 110 134.9 161.2 226.2 281.9 315 2003E represents midpoint of EBITDA range
Slide 9: 2003 Update
2003 Update Strong 1st quarter performance likely to continue throughout 2003 Firm LPG demand expected to continue through normally slow summer season due to low regional inventories Favorable outlook for long-haul volumes with increased cargoes arriving in Gulf Coast Purchase of additional Centenni
Slide 10: 2003 Update
2003 Update Strong upstream gathering, marketing and transportation results Solid performance in light of world oil disruptions Improved Seaway Pipeline performance and continued high Texas City terminal utilization Growth and optimization strategies continue to produce benefits Substantial midstrea
Slide 11: The TEPPCO Systems
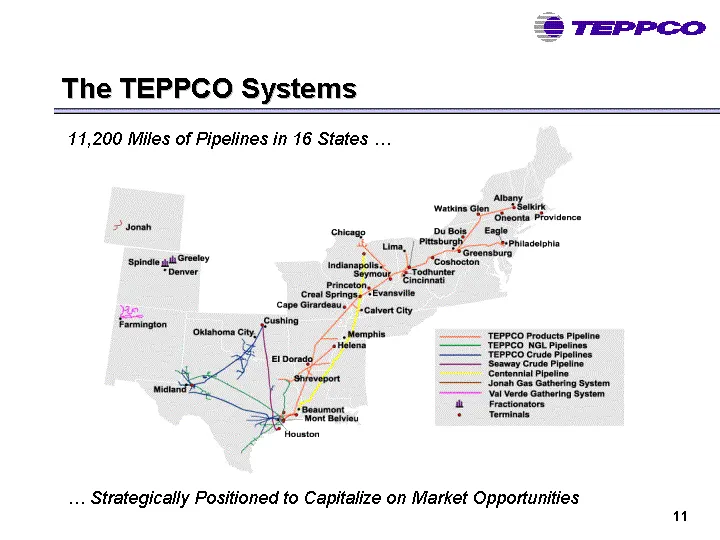
The TEPPCO Systems 11,200 Miles of Pipelines in 16 States ... .... Strategically Positioned to Capitalize on Market Opportunities
Slide 12: TEPPCO's Three Business Segments
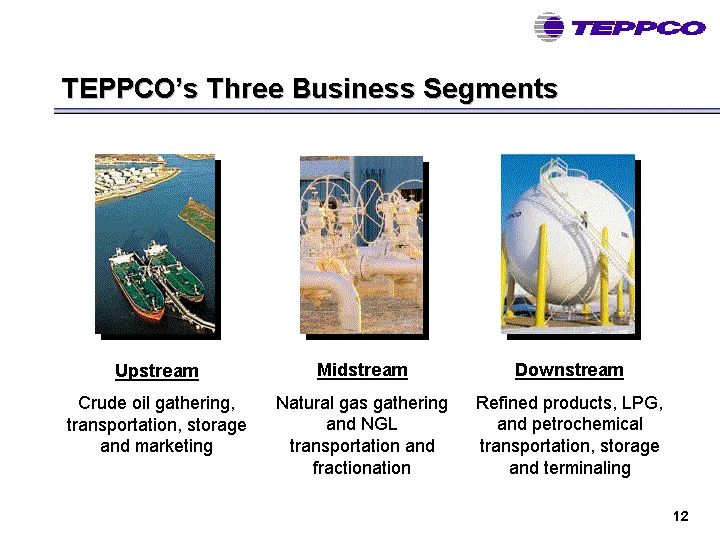
TEPPCO's Three Business Segments Midstream Natural gas gathering and NGL transportation and fractionation Upstream Crude oil gathering, transportation, storage and marketing Downstream Refined products, LPG, and petrochemical transportation, storage and terminaling
Slide 13: EBITDA Contribution by Segment - 2003E
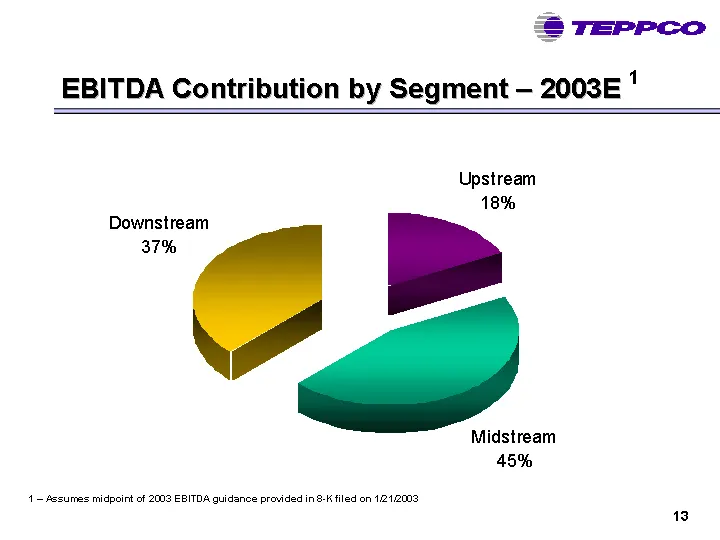
EBITDA Contribution by Segment - 2003E 1 NGL Natural Gas 1 - Assumes midpoint of 2003 EBITDA guidance provided in 8-K filed on 1/21/2003 Upstream Midstream Downstream 17.46 45.08 37.46
Slide 14: TEPPCO Corporate Strategy
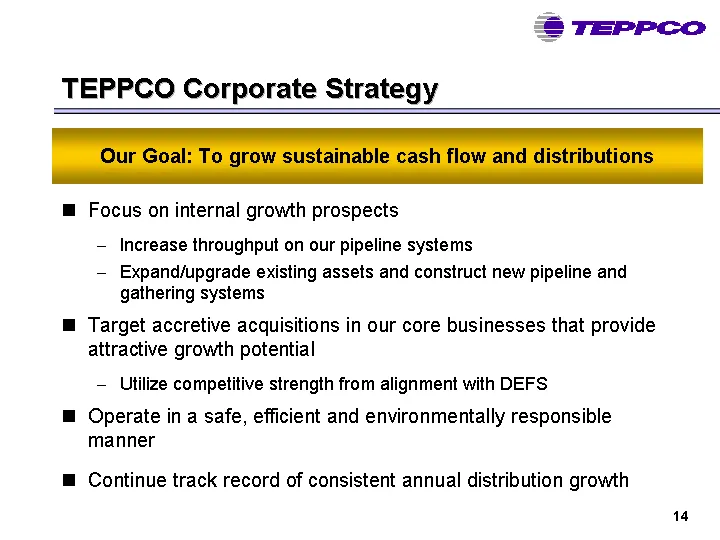
TEPPCO Corporate Strategy Focus on internal growth prospects Increase throughput on our pipeline systems Expand/upgrade existing assets and construct new pipeline and gathering systems Target accretive acquisitions in our core businesses that provide attractive growth potential Utilize competitive s
Slide 15: TEPPCO's Upstream Business
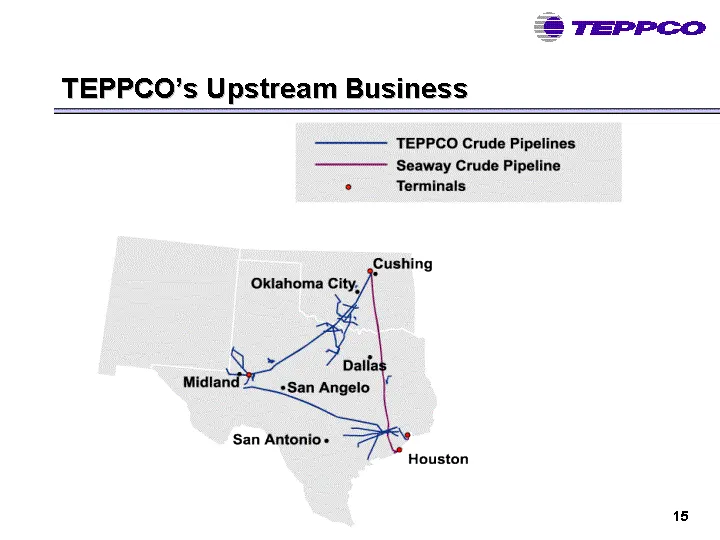
TEPPCO’s Upstream Business TEPPCO Crude Pipelines Seaway Crude Pipeline ° Terminals San Antonio+ Houston
Slide 16: Upstream Strategy
Upstream Strategy Strengthen market position around existing asset base Focus activity in West Texas, South Texas and Red River areas Increase margins by improving/expanding services and reducing costs through asset optimization Pursue strategic acquisitions to leverage existing market presence Real
Slide 17: TEPPCO's Downstream Business
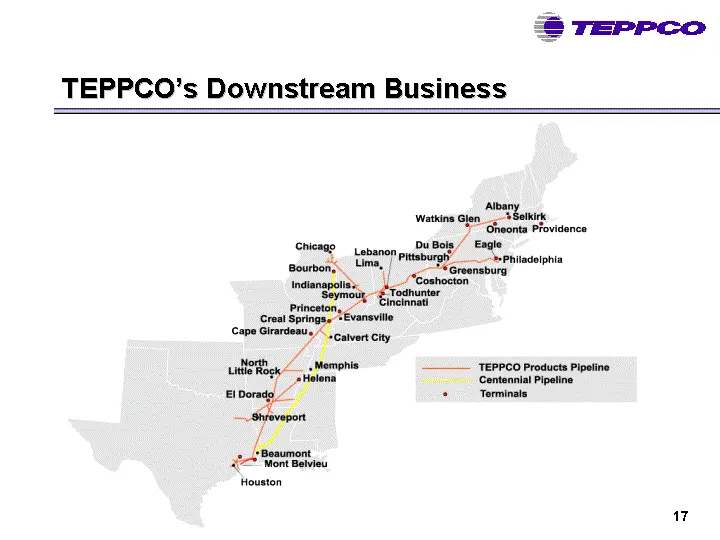
TEPPCO's Downstream Business
Slide 18: Midwest Refined Products Supply
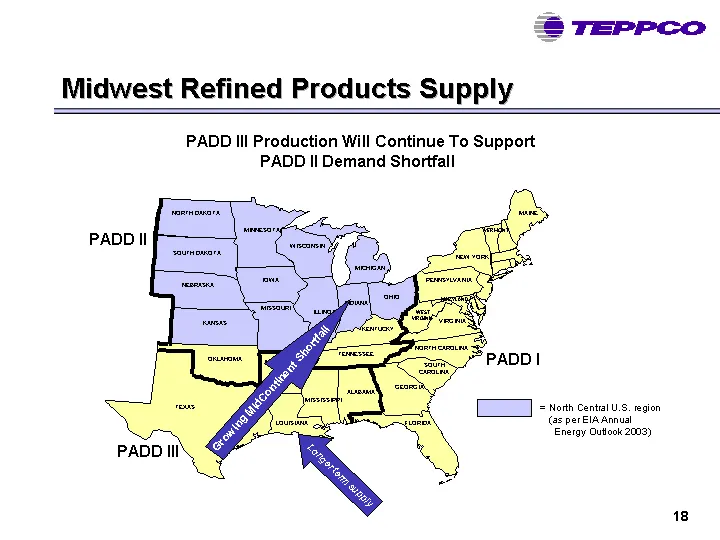
Midwest Refined Products Supply PADD III Production Will Continue To Support PADD II Demand Shortfall = North Central U.S. region (as per EIA Annual Energy Outlook 2003) NORTH DAKOTA SOUTH DAKOTA NEBRASKA KANSAS OKLAHOMA TEXAS MINNESOTA IOWA MISSOURI ALABAMA FLORIDA GEORGIA SOUTH CAROLINA NORTH CARO
Slide 19: Downstream Strategy
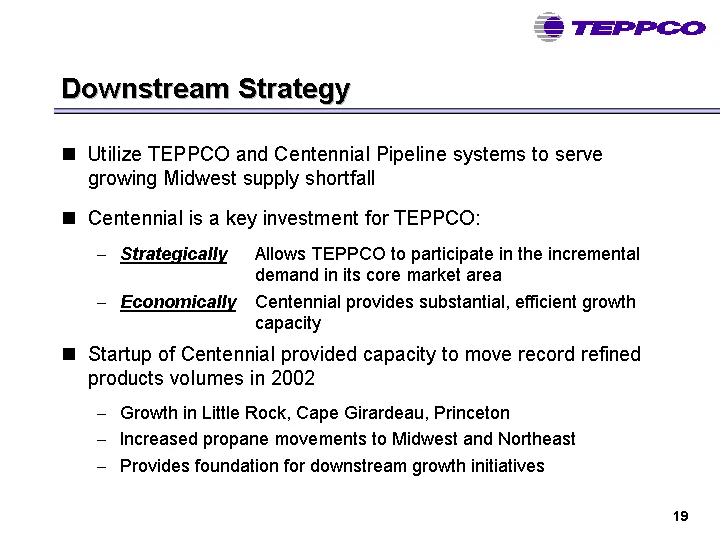
Downstream Strategy Utilize TEPPCO and Centennial Pipeline systems to serve growing Midwest supply shortfall Centennial is a key investment for TEPPCO: Strategically Allows TEPPCO to participate in the incremental demand in its core market area Economically Centennial provides substantial, efficient
Slide 20: Midwest Refined Products Demand
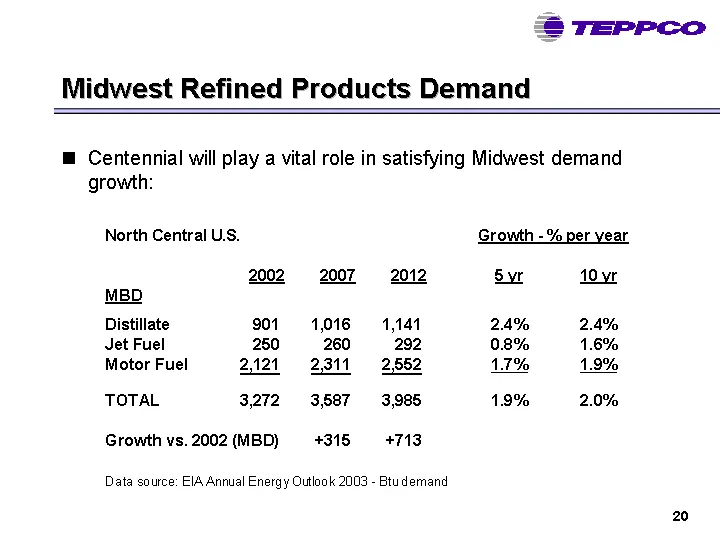
Midwest Refined Products Demand Centennial will play a vital role in satisfying Midwest demand growth:
Slide 21: Recent Centennial Pipeline Developments
Recent Centennial Pipeline Developments TEPPCO purchased additional 1/6 interest in Centennial Pipeline from CMS for $20 million Attractive price due to CMS restructuring TEPPCO and Marathon Ashland each own 50% interests TEPPCO has obtained 5-year capacity lease which benefits both Centennial and T
Slide 22: Downstream Segment Growth Potential
Downstream Segment Growth Potential Centennial provides excellent platform for long-term growth Serves chronically short Midwest market Supply imbalance increases if additional refineries close Potential to displace river movements Provides capacity to allow growth in propane movements Substantial c
Slide 23: TEPPCO's Midstream Business
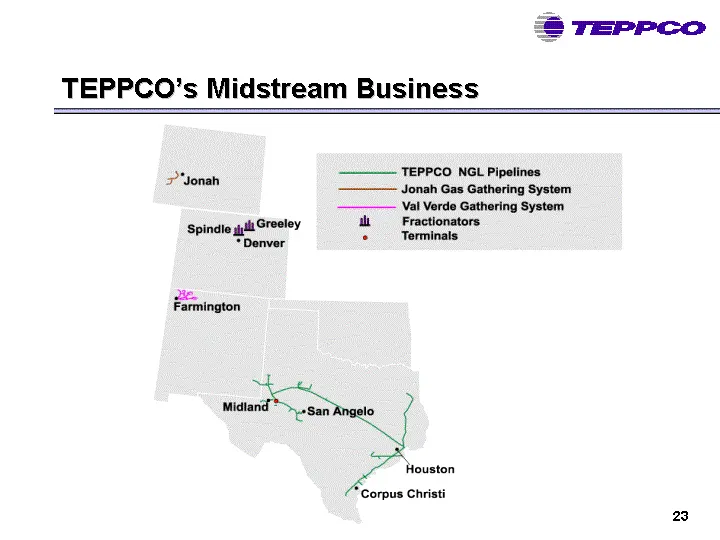
TEPPCO's Midstream Business
Slide 24: Midstream Strategy
Midstream Strategy Attractive portfolio of high quality assets in prolific gas producing basins Assets positioned in basins playing an increasingly vital role in the United States' domestic gas supply Realize full potential of existing assets Increase throughput on Val Verde, Jonah and Chaparral sys
Slide 25: Val Verde Gas Gathering System
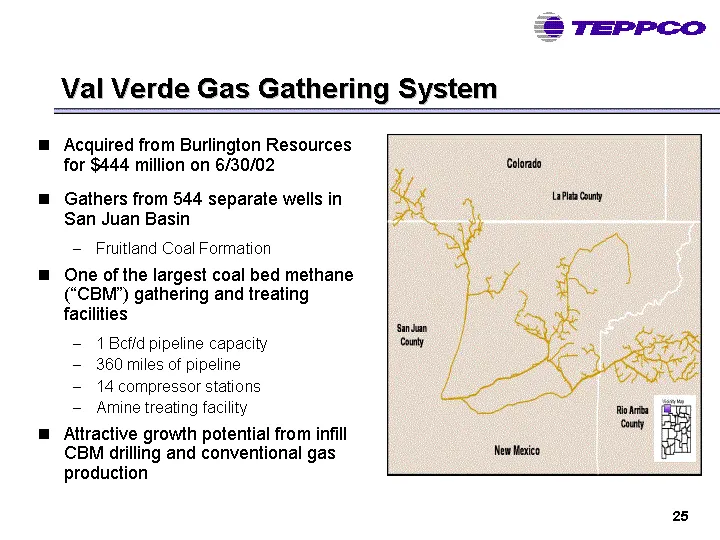
Val Verde Gas Gathering System Acquired from Burlington Resources for $444 million on 6/30/02 Gathers from 544 separate wells in San Juan Basin Fruitland Coal Formation One of the largest coal bed methane ("CBM") gathering and treating facilities 1 Bcf/d pipeline capacity 360 miles of pipeline 14 co
Slide 26: Val Verde Growth Potential
Val Verde Growth Potential Near-term volume growth from CBM infill drilling New Mexico Oil Conservation Division issued order in October, 2002 approving 160-acre spacing in 'Low Productivity Area' Well density increase will spur new drilling Initial phase of drilling underway with first wells connec
Slide 27: Jonah Gas Gathering System
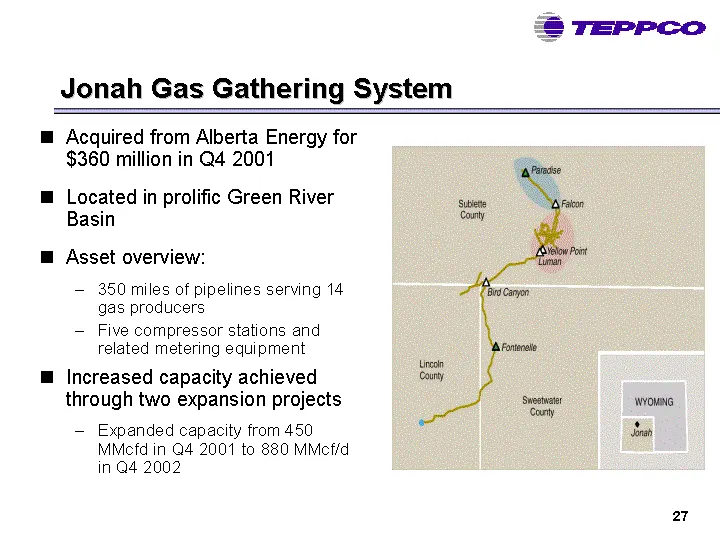
Jonah Gas Gathering System Acquired from Alberta Energy for $360 million in Q4 2001 Located in prolific Green River Basin Asset overview: 350 miles of pipelines serving 14 gas producers Five compressor stations and related metering equipment Increased capacity achieved through two expansion projects
Slide 28: Phase III Expansion and Pioneer Plant
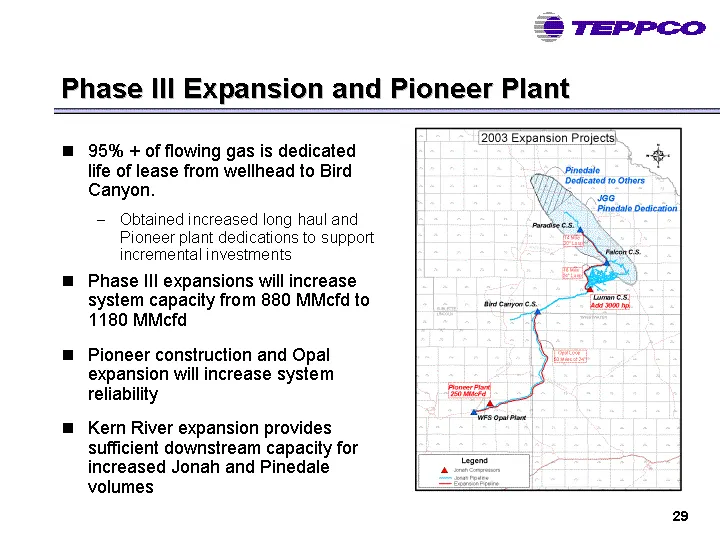
Phase III Expansion and Pioneer Plant 95% + of flowing gas is dedicated life of lease from wellhead to Bird Canyon. Obtained increased long haul and Pioneer plant dedications to support incremental investments Phase III expansions will increase system capacity from 880 MMcfd to 1180 MMcfd Pioneer co
Slide 29: Jonah Growth Potential
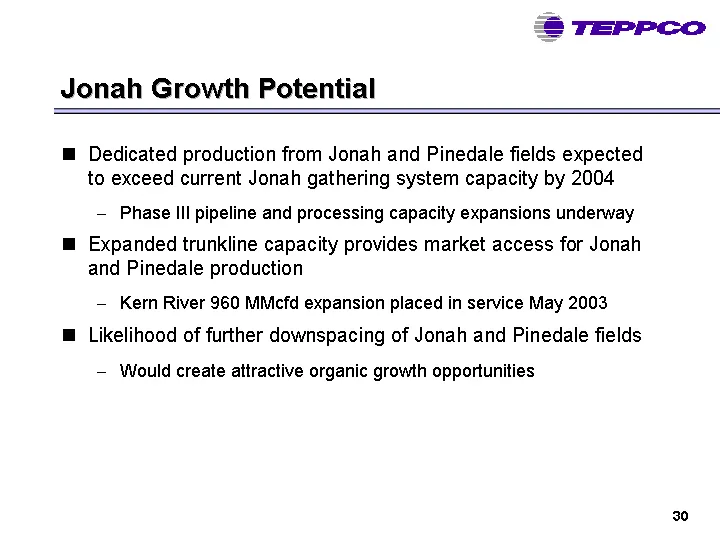
Jonah Growth Potential Dedicated production from Jonah and Pinedale fields expected to exceed current Jonah gathering system capacity by 2004 Phase III pipeline and processing capacity expansions underway Expanded trunkline capacity provides market access for Jonah and Pinedale production Kern River
Slide 30: Balance Sheet and Distribution Coverage
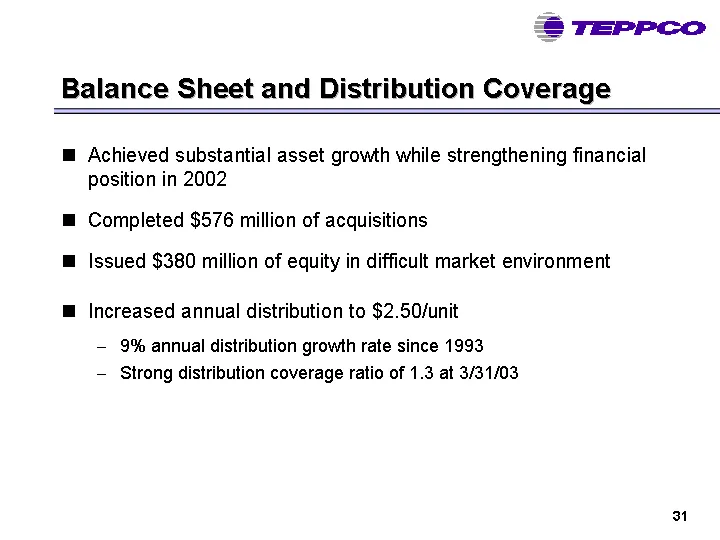
Balance Sheet and Distribution Coverage Achieved substantial asset growth while strengthening financial position in 2002 Completed $576 million of acquisitions Issued $380 million of equity in difficult market environment Increased annual distribution to $2.50/unit 9% annual distribution growth rate
Slide 31: Debt and Equity Update
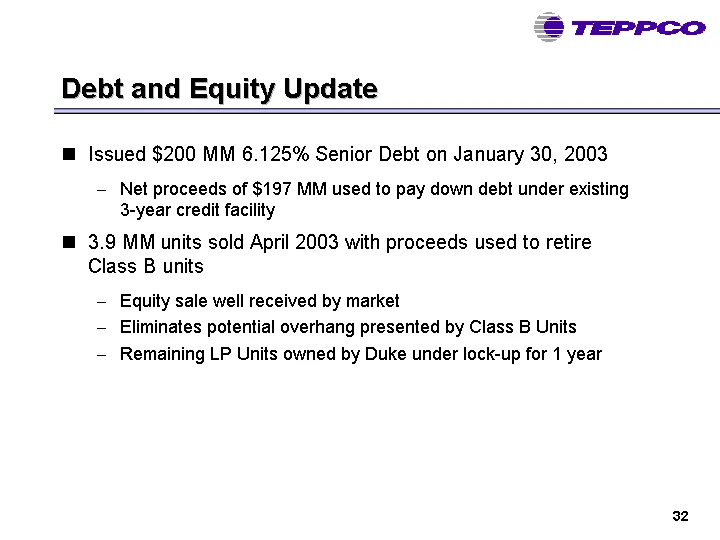
Debt and Equity Update Issued $200 MM 6.125% Senior Debt on January 30, 2003 Net proceeds of $197 MM used to pay down debt under existing 3-year credit facility 3.9 MM units sold April 2003 with proceeds used to retire Class B units Equity sale well received by market Eliminates potential overhang p
Slide 32: Distributions have shown steady growth
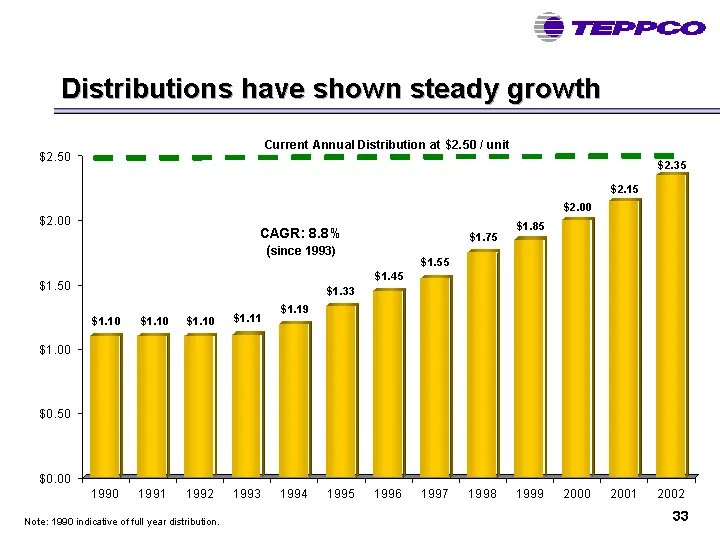
Distributions have shown steady growth Note: 1990 indicative of full year distribution. Note: 1990 indicative of full year distribution. CAGR: 8.8% (since 1993)
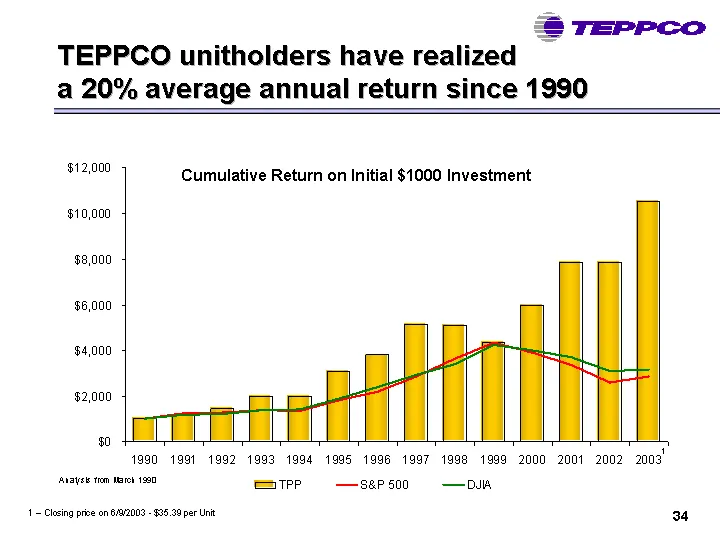
Slide 33: TEPPCO unitholders have realized a 20% average annual return since 1990
TEPPCO unitholders have realized a 20% average annual return since 1990 TPP S&P 500 DJIA 1990 1000 1000 1000 1991 1182 1227 1171 1992 1454 1282 1219 1993 1986 1372 1387 1994 1983 1351 1416 1995 3081 1811 1890 1996 3815 2179 2382 1997 5150 2855 2921 1998 5104 3615 3391 1999 4321 4321 4246 2000 5997 3
Slide 34: TEPPCO's Governance
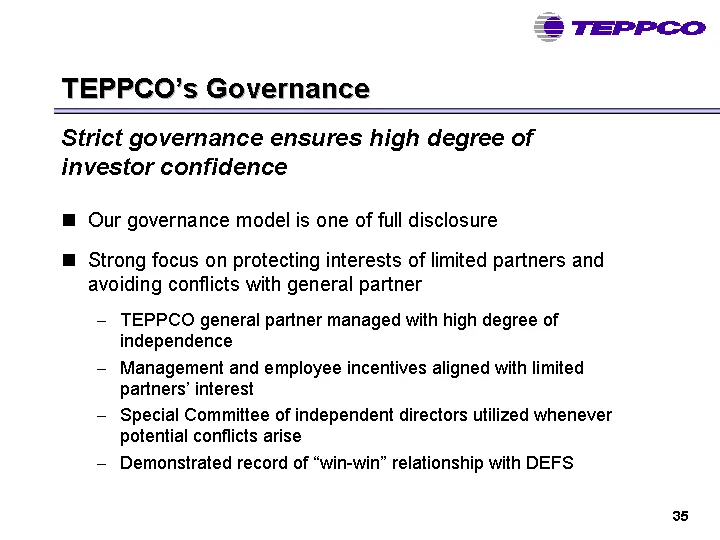
TEPPCO's Governance Our governance model is one of full disclosure Strong focus on protecting interests of limited partners and avoiding conflicts with general partner TEPPCO general partner managed with high degree of independence Management and employee incentives aligned with limited partners' in
Slide 35: Reconciliation of Non-GAAP Measures
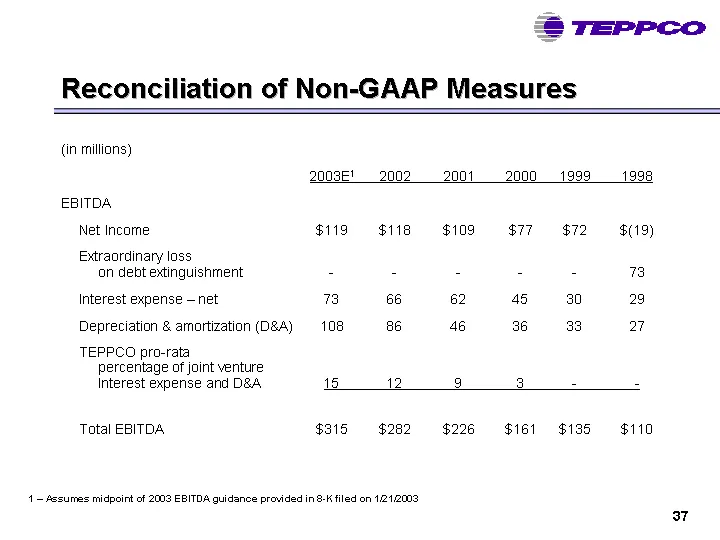
Reconciliation of Non-GAAP Measures (in millions) 2003E1 2002 2001 2000 1999 1998 EBITDA Net Income $119 $118 $109 $77 $72 $(19) Extraordinary loss on debt extinguishment - - - - - 73 Interest expense - net 73 66 62 45 30 29 Depreciation & amortization (D&A) 108 86 46 36 33 27 TEPPCO pro-rata percen
Slide 36: Reconciliation of Non-GAAP Measures (continued)
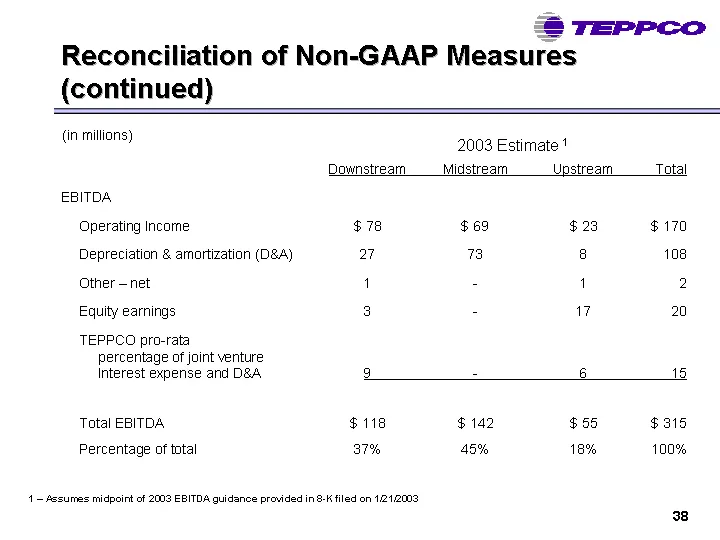
Reconciliation of Non-GAAP Measures (continued) Downstream Midstream Upstream Total EBITDA Operating Income $ 78 $ 69 $ 23 $ 170 Depreciation & amortization (D&A) 27 73 8 108 Other - net 1 - 1 2 Equity earnings 3 - 17 20 TEPPCO pro-rata percentage of joint venture Interest expense and D&A 9 - 6 15 T
Slide 37: fs fh)
fs fh) NYSE: TPP
Source: SEC EDGAR · 8-K filed Jun 13, 2003
More decks from Teppco Partners LP
 Morgan Stanley MLP Reception (October 2009)26 slides · Oct 7, 2009
 Master Limited Partnerships Investor Conference (September 2009)27 slides · Sep 16, 2009
 Wells Fargo Retail Meeting (September 2009)27 slides · Sep 15, 2009
 Barclays Capital CEO Energy/Power Conference 200929 slides · Sep 9, 2009
 Merger or Acquisition (August 2009)29 slides · Aug 26, 2009
 Wachovia Securities Investor Presentation (June 2007)51 slides · Jun 1, 2007