Teppco Partners LP — Barclays Capital CEO Energy/Power Conference 2009
29 slides from Teppco Partners LP's conference presentation, Sep 9, 2009
Slide 1: Barclays Capital CEO Energy/Power Conference
Barclays Capital CEO Energy/Power Conference September 9, 2009 W. Randall Fowler Executive Vice President & CFO © Allrights reserved. Enterprise Products Partners L.P.
Slide 2: Forward Looking Statements
Forward Looking Statements This presentation contains forward-looking statements and information based on Enterprise's beliefs and those of its general partner, as well as assumptions made by and information currently available to them. When used in this presentation, words such as “anticipate,” “pr
Slide 3: Investor Notice
Investor Notice In connection with the proposed merger, Enterprise has filed a registration statement on Form S-4 (Registration No. 333-161185), which includes a prospectus of Enterprise and a proxy statement of TEPPCO and other materials, with the Securities and Exchange Commission (“SEC”). INVESTO
Slide 4: Key Investment Considerations
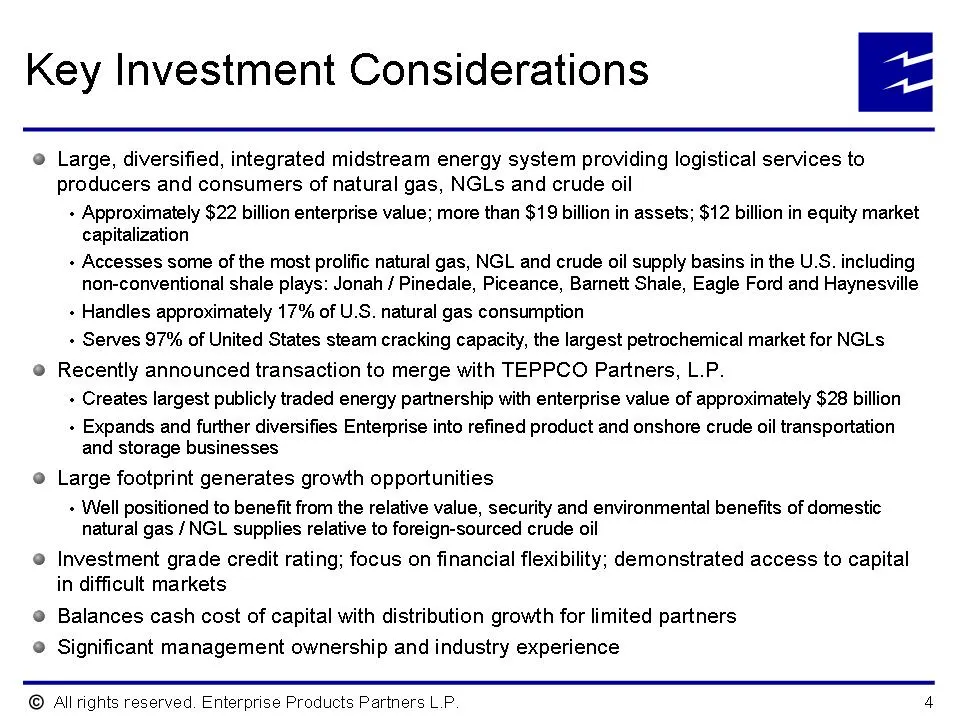
Key Investment Considerations ® Large, diversified, integrated midstream energy system providing logistical services to producers and consumers of natural gas, NGLs and crude oil + Approximately $22 billion enterprise value; more than $19 billion in assets; $12 billion in equity market capitalizatio
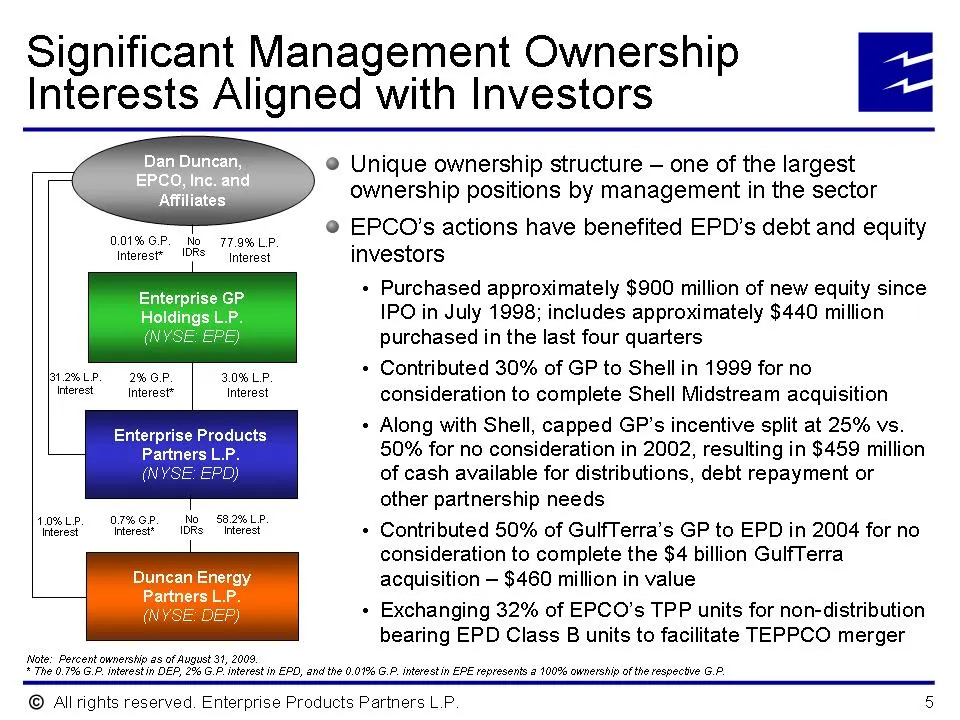
Slide 5: Significant Management Ownership
Significant Management Ownership Interests Aligned with Investors O01%GP. No 77.9%LP. Interest* 'ORS Interest Enterprise GP Holdings L.P. Bi2%LP. 2%GP. Interest interest” 3.0% LP. Interest No $8.2%LP. 10%LP. O7%GP. IDRs Interest Interest’ Interest" Duncan Energy Partners L.P. Note: Percent avnership
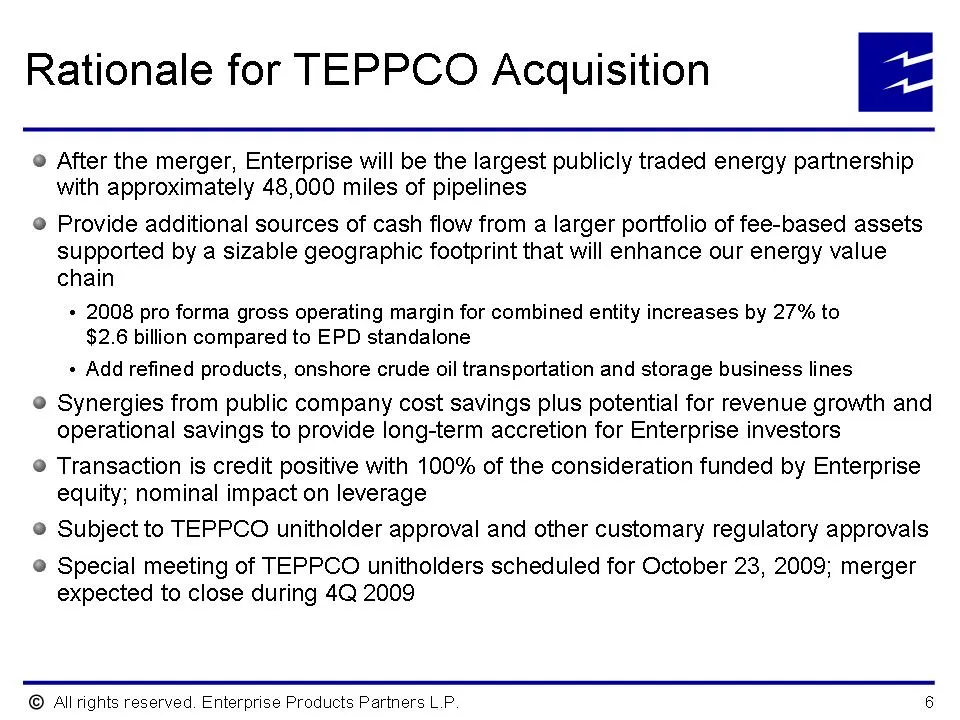
Slide 6: Rationale for TEPPCO Acquisition
Rationale for TEPPCO Acquisition [Ez e After the merger, Enterprise will be the largest publicly traded energy partnership with approximately 48,000 miles of pipelines @ Provide additional sources of cash flow from a larger portfolio of fee-based assets supported by a sizable geographic footprint th
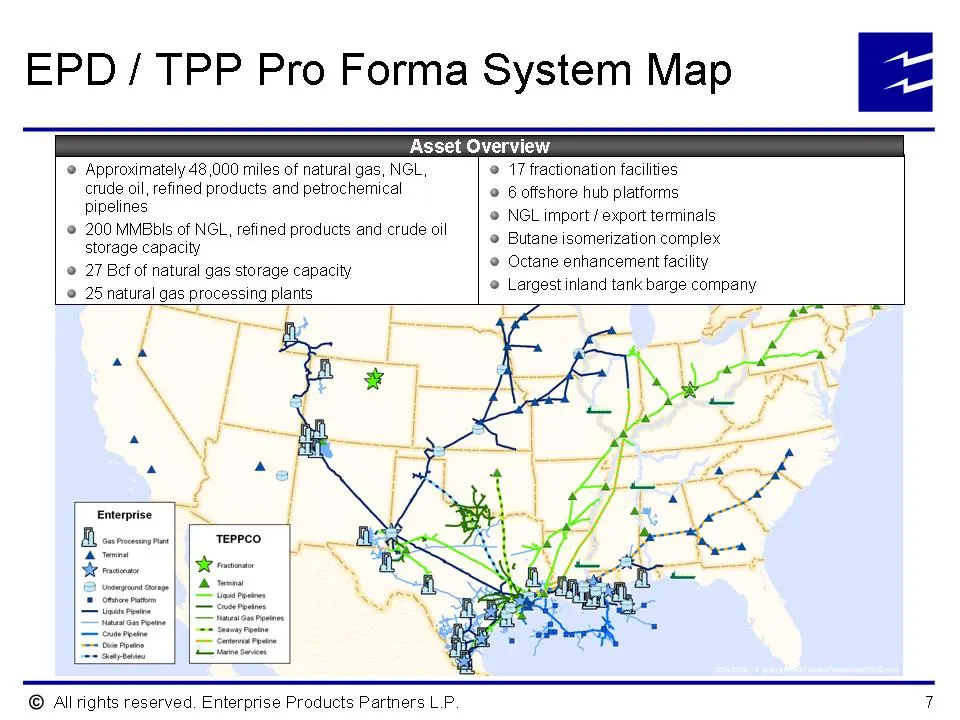
Slide 7: EPD / TPP Pro Forma System Map
EPD / TPP Pro Forma System Map Asset Overview Approximately 48,000 miles of natural gas, NGL, 17 fractionation facilities crude oil, refined products and petrochemical 6 offshore hub platforms ° Pipelines © NGL import / export terminals © 200 MMBbIs of NGL, refined products and crude cil | tang isom
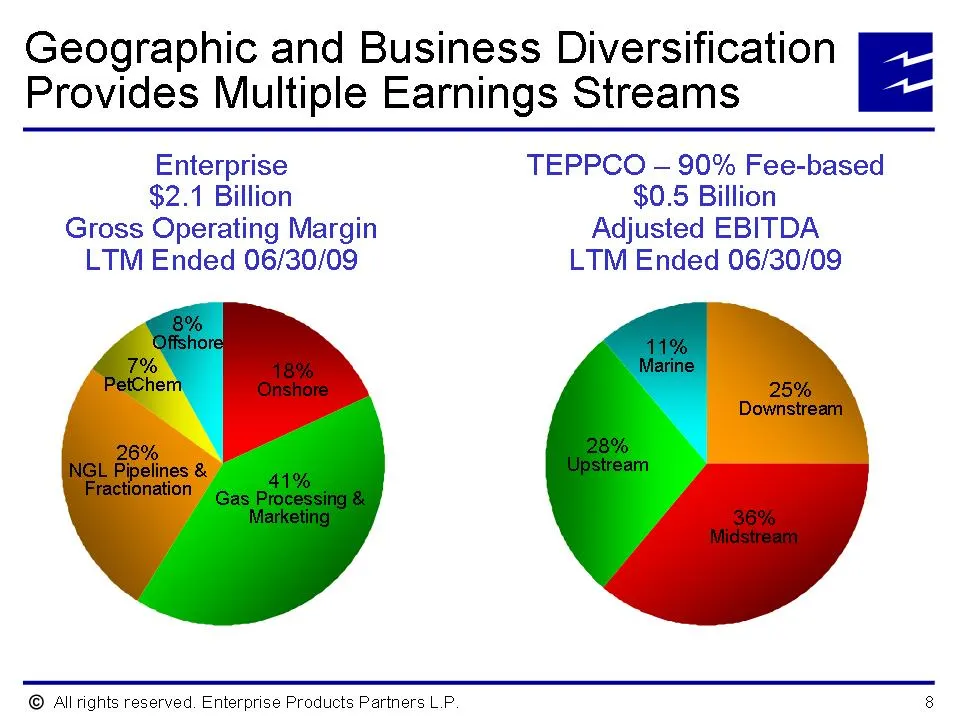
Slide 8: Geographic and Business Diversification
Geographic and Business Diversification [ Provides Multiple Earnings Streams Enterprise TEPPCO — 90% Fee-based $2.1 Billion $0.5 Billion Gross Operating Margin Adjusted EBITDA LTM Ended 06/30/09 LTM Ended 06/30/09 © Allrights reserved. Enterprise Products Partners L.P. 8
Slide 9: Major Growth Projects
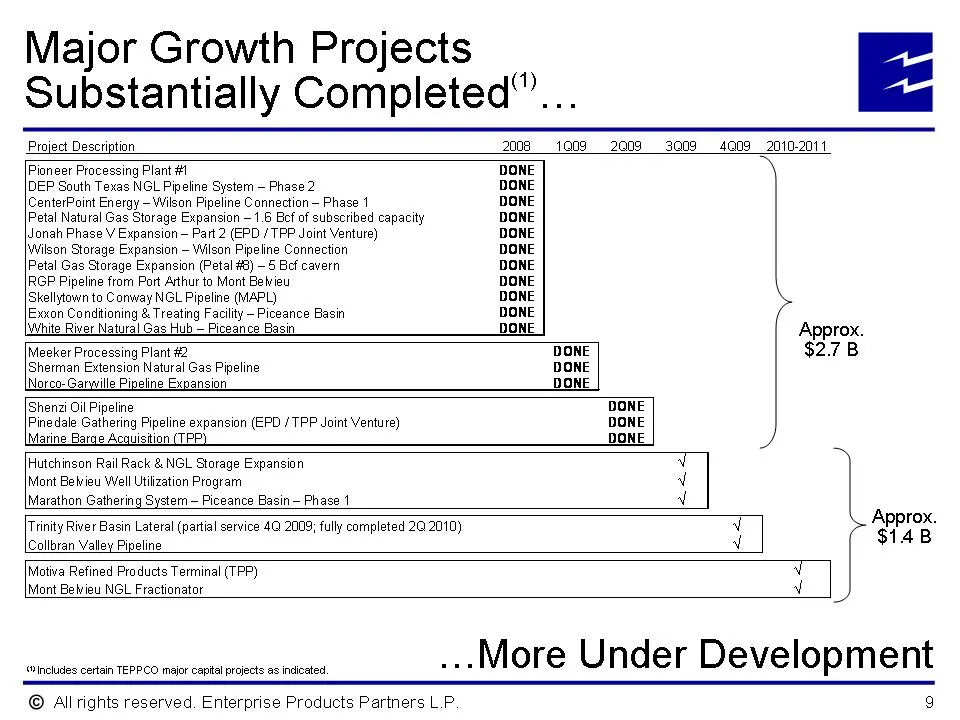
Major Growth Projects Substantially Completed”... Project Description 20081008 __2G09 3009 4008 _2010-2011 Pioneer Processing Plant #1 DONE DEP South Texas NGL Pipeline System — Phase 2 DONE JCenterPoint Energy — Wilson Pipeline Connection — Phase 1 DONE Petal Natural Gas Storage Expansion — 1.8 Bcf
Slide 10: Record Operating Performance
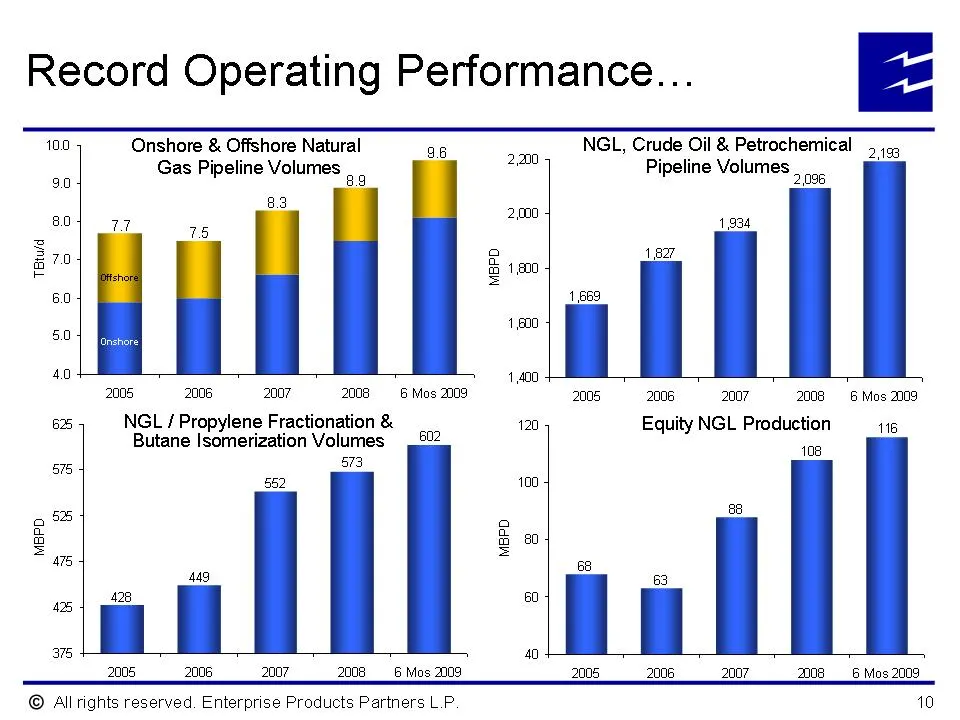
Record Operating Performance... 100 Onshore & Offshore Natural NGL, Crude Oil & Petrochemical 5 jo Gas Pipeline Volumes Pipeline Volumes 89 2,096 é e 2005 2008 2007 2008 6 Mos 2009 2005 2008 2007 2008/6 Mos 2009 65 NGL / Propylene Fractionation & 120 Equity NGL Production 116 Butane Isomerization Vo
Slide 11: Drives Strong Financial Results
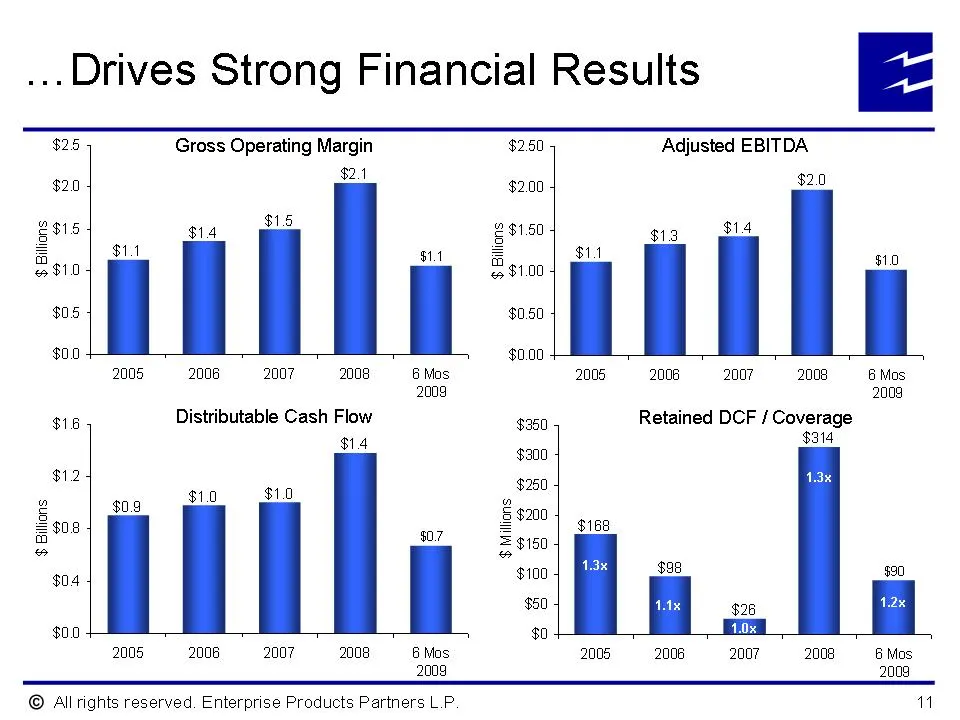
...Drives Strong Financial Results $25 Gross Operating Margin $260 Adjusted EBITDA $2.4 $20 $2.00 S20 gis $4 Cus 2 $1.60 = $14 sit 2910 $05 $00 2008 2008 = 2007 2008 = & Mos 20052008.» 2007 = 2008S Mos 2009 2009 $168 Distributable Cash Flow Retained DCF / Coverage $4 $314 $12 $1.0 2 we $1.0 aie 907
Slide 12: NGL Feedstock Demand by Ethylene Producers has Rebounded
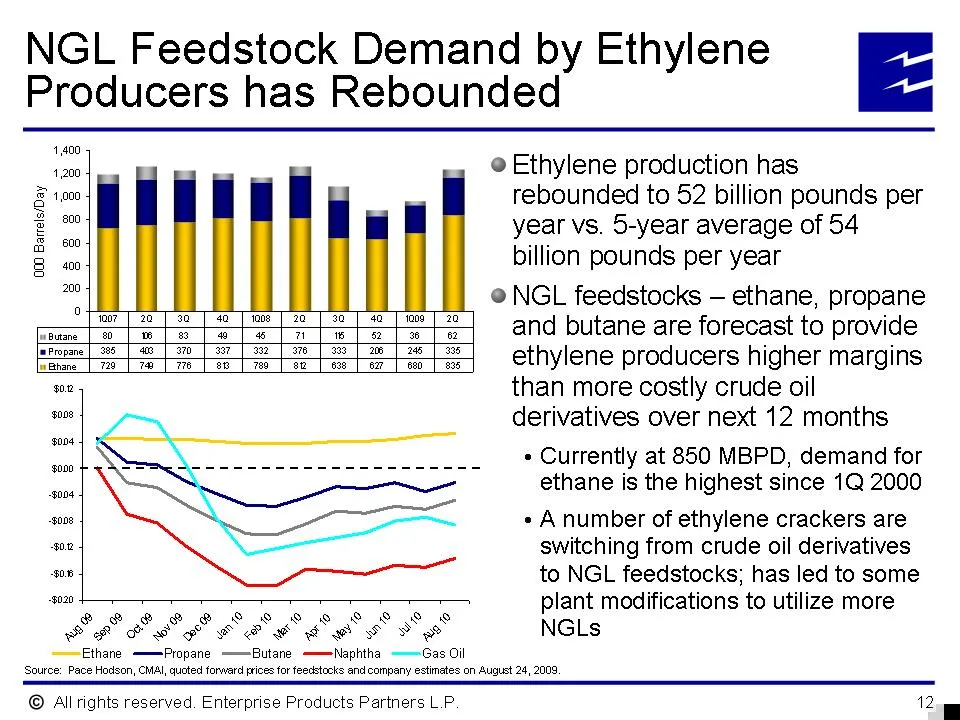
NGL Feedstock Demand by Ethylene [Ez Producers has Rebounded 200 @ Ethylene production has E10 rebounded to 52 billion pounds per a year vs. 5-year average of 54 3 > billion pounds per year ” @NGL feedstocks — ethane, propane qe EE Ee and butane are forecast to provide faa teteletetetetetetets| ethy
Slide 13: Rockies Overview
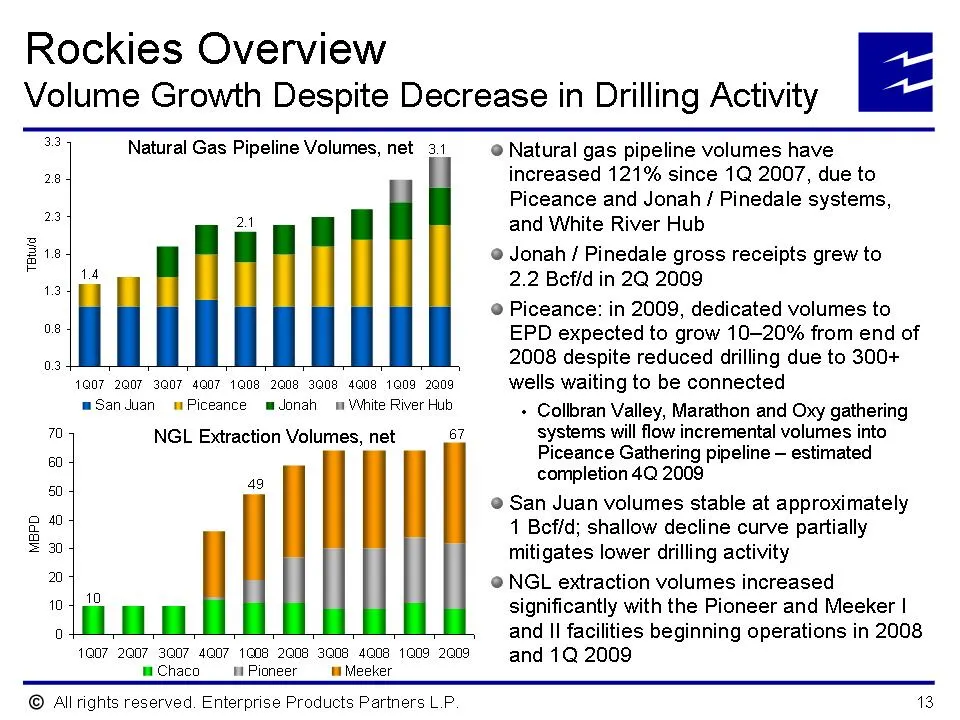
Rockies Overview Volume Growth Despite Decrease in Drilling Activity Natural Gas Pipeline Volumes, net 3.1 24 1Q07 2007 3007 4007 108 2008 3008 4@08 1009 2009 mSanJuan = Piceance mJonah = White River Hub 70 NGL Extraction Volumes, net 67 ee 49 MBPD 1007 2Q07 3007 4Q07 1008 2008 3q0e aan 1009 2009 Ch
Slide 14: Barnett Shale
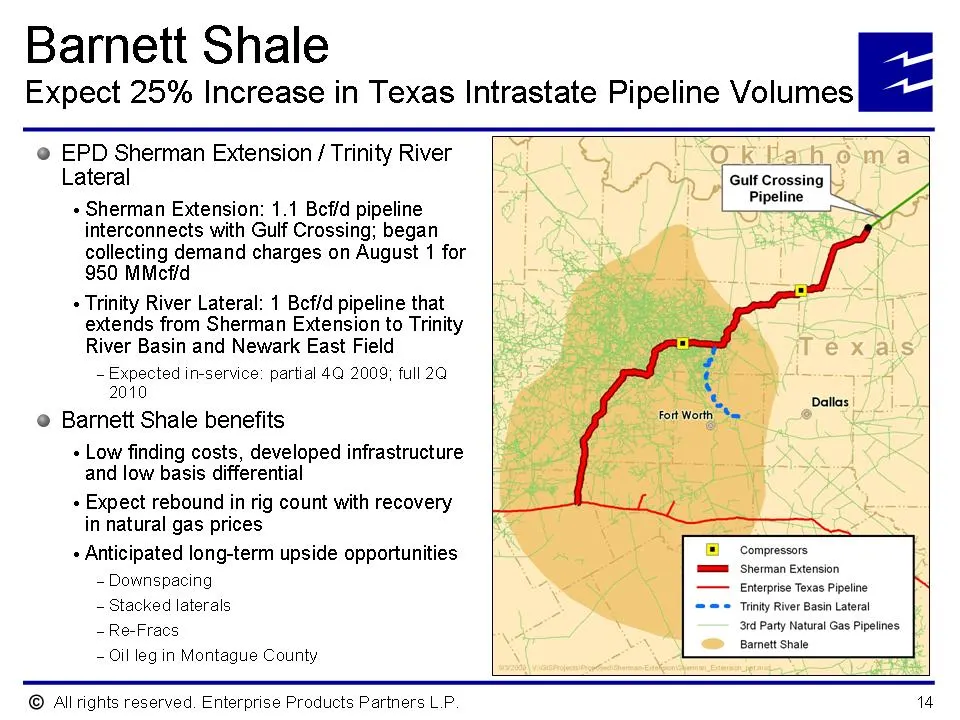
Barnett Shale Expect 25% Increase in Texas Intrastate Pipeline Volumes @ EPD Sherman Extension / Trinity River Lateral L Gulf Crossing |) J ; ! Pipeline + Sherman Extension: 1.1 Beffd pipeline interconnects with Gulf Crossing; began collecting demand charges on August 1 for 950 MMcfid + Trinity Rive
Slide 15: Eagle Ford Shale Opportunities Adjacent to EPD System
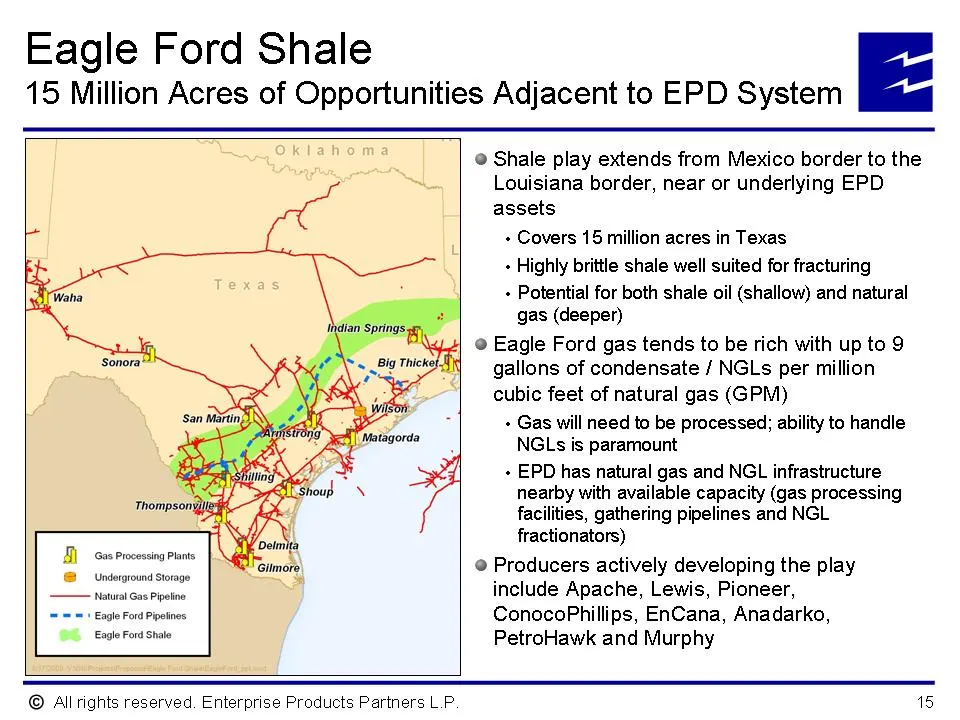
Eagle Ford Shale 15 Million Acres of Opportunities Adjacent to EPD System Oklahoma Wana Coie = Big Thick i San Matin, e ‘: orig AT olagorda ling v3 . Shoup \ Thompson 3 ‘Delmita i Gilmor © Underground storage ey! Natura Gas Pipeline = = = + Eagle Ford Pipelines Eagle Ford Shale © Allrights reserved.
Slide 16: EPD NGL Fractionation
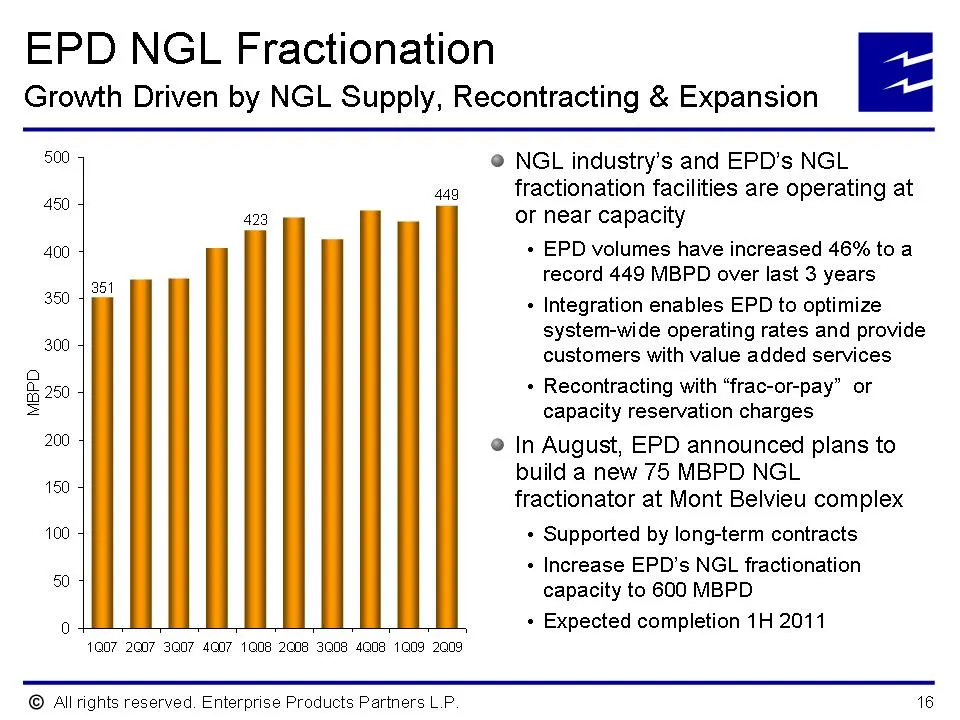
EPD NGL Fractionation Growth Driven by NGL Supply, Recontracting & Expansion 500 450 449 423 400 351 1007 2007 3Q07 4007 1008 2c08 3a08 4q08 1¢09 2009 © Allrights reserved. Enterprise Products Partners L.P. @ NGL industry’s and EPD’s NGL fractionation facilities are operating at or near capacity + E
Slide 17: Offshore Assets
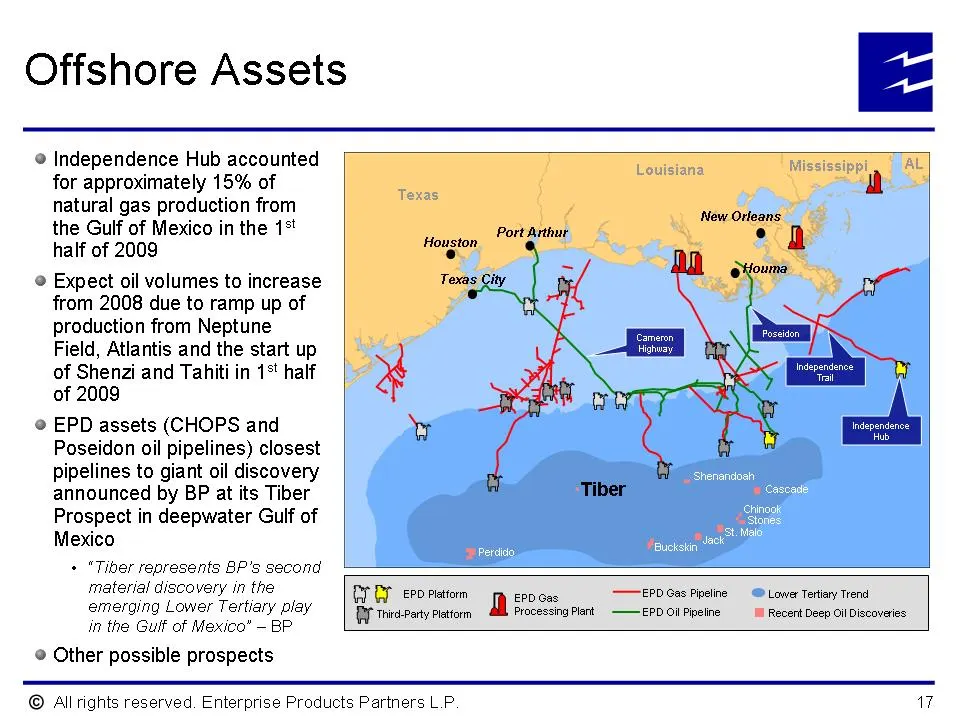
Offshore Assets @ Independence Hub accounted for approximately 15% of natural gas production from the Gulf of Mexico in the 1% half of 2009 @ Expect oil volumes to increase from 2008 due to ramp up of production from Neptune Field, Atlantis and the start up of Shenzi and Tahiti in 1% half of 2009 @
Slide 18: Financial Snapshot
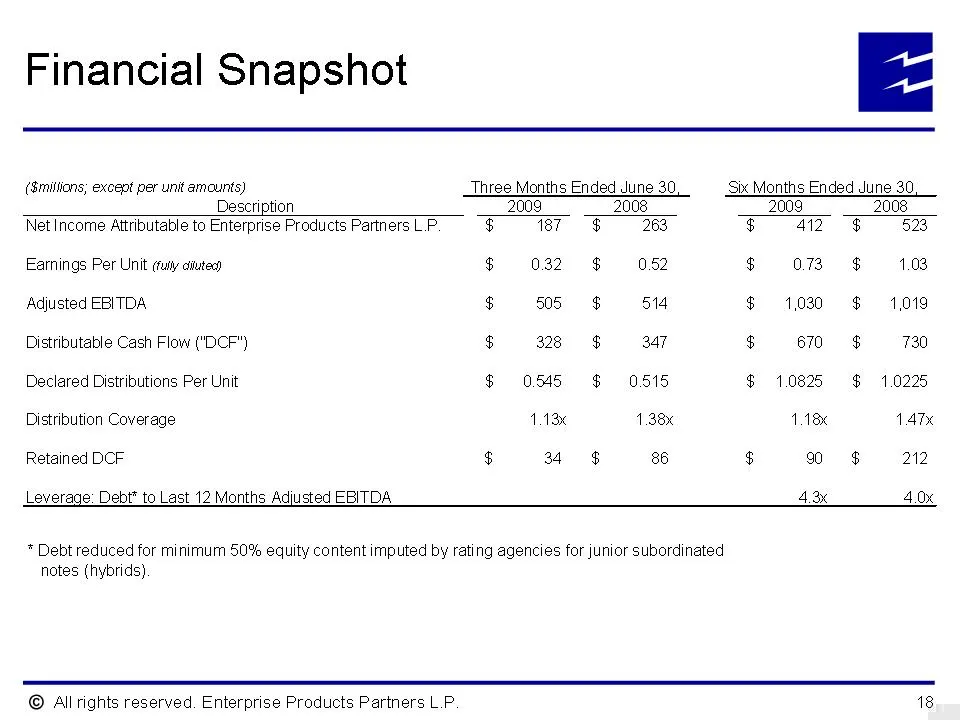
Financial Snapshot (millions; except per unit amounts) Three Months Ended June 30, ‘Six Months Ended June 30, Description 2009 2008 2009 2008 Net Income Attributable to Enterprise Products Partners LP. $ 87 $ 263 $ 412 ¢ 523 Earnings Per Unit ¢ruty ciiutes) $ 032 ¢ 0.52 $ 073 $ 1.03 Adjusted EBITDA.
Slide 19: Substantial Financial Flexibility Added by Eliminating GP's 50% IDR
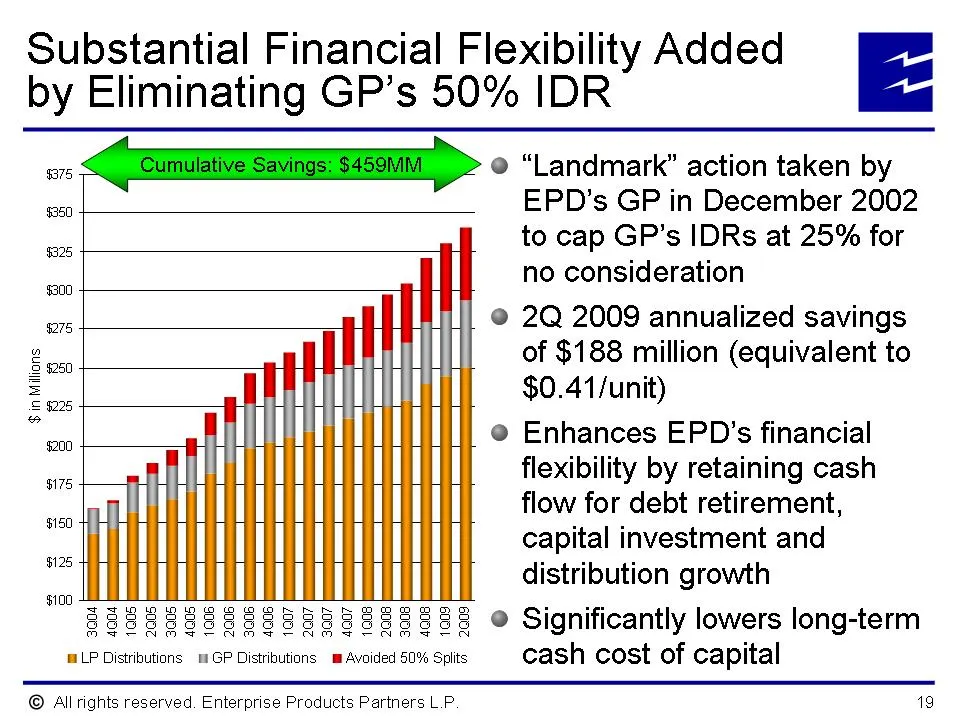
Substantial Financial Flexibility Added by Eliminating GP’s 50% IDR 575 Gham,» @ “Landmark” action taken by EPD’s GP in December 2002 $350 $ in Millions, 6 8 $200 + 5175 4 $150 $125, $100 Avoided 50% Splits LP Distributions 1m GP Distributions © Allrights reserved. Enterprise Products Partners L.P.
Slide 20: History of Managing Cash Cost of Equity Capital
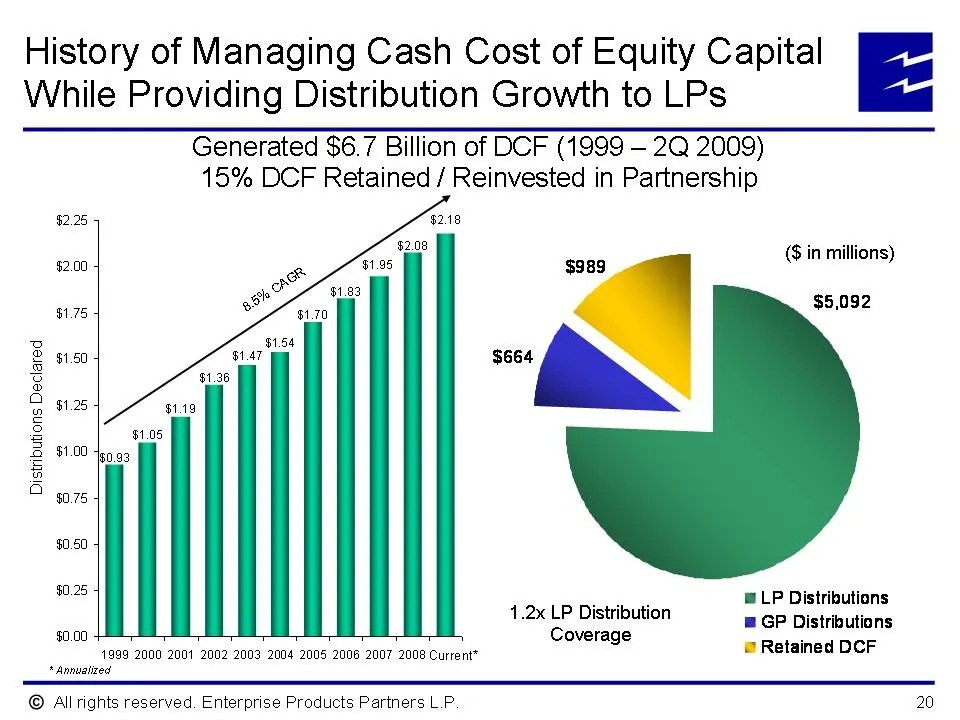
History of Managing Cash Cost of Equity Capital [Ez While Providing Distribution Growth to LPs Generated $6.7 Billion of DCF (1999 — 2Q 2009) 15% DCF Retained / Reinvested in Partnership $2.25 in millions $2.00 é ) $1.75 $5,092 $1.60 $1.25 $1.00 Distributions Declared $0.75 $0.50 30.25 @ LP Distribu
Slide 21: Proven Track Record
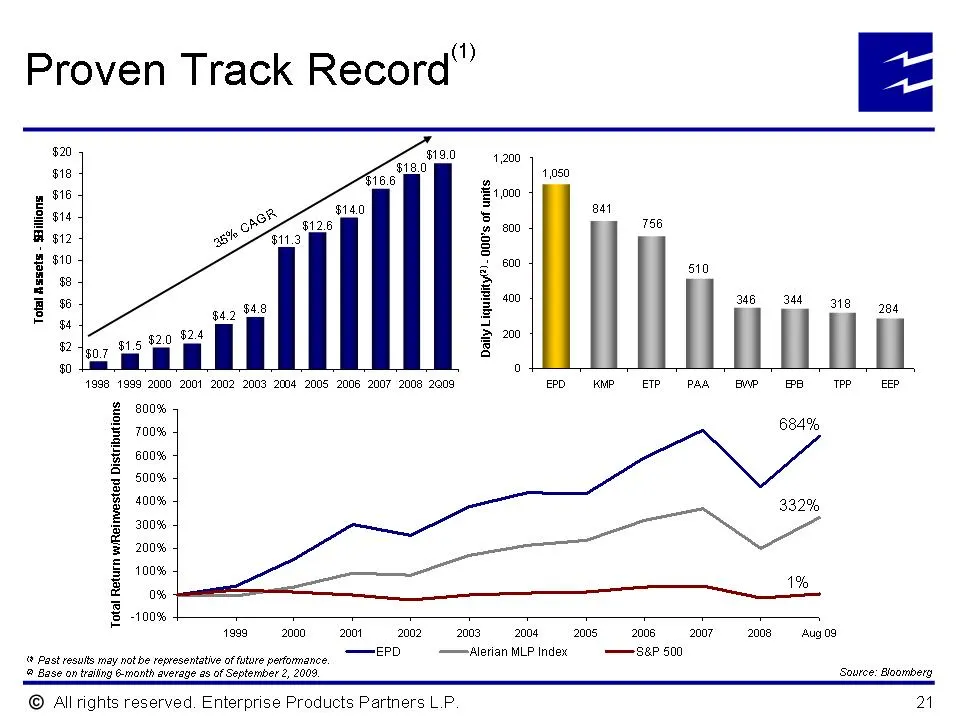
Proven Track Record” $20 $18 4 16 i 5 14 5 B siz g gs bd ge $ ge 2 r s4 B #2 s 0 ‘886 4860 2000 20012002” 2008 2004 2005 2006” 2007 20082008 0 KW OETP PAA BAP ORT 2 800% = 700% $ sox S 500% % 400% E aca% $ rn0% 5 100% 2 ow 1%, E soos | ‘eso 2000 «oot_~=«ieD=S«C«OO]:=SC«OSC*«OSCSC«OHSC«SCHSC erp ——Al
Slide 22: Key Investment Considerations
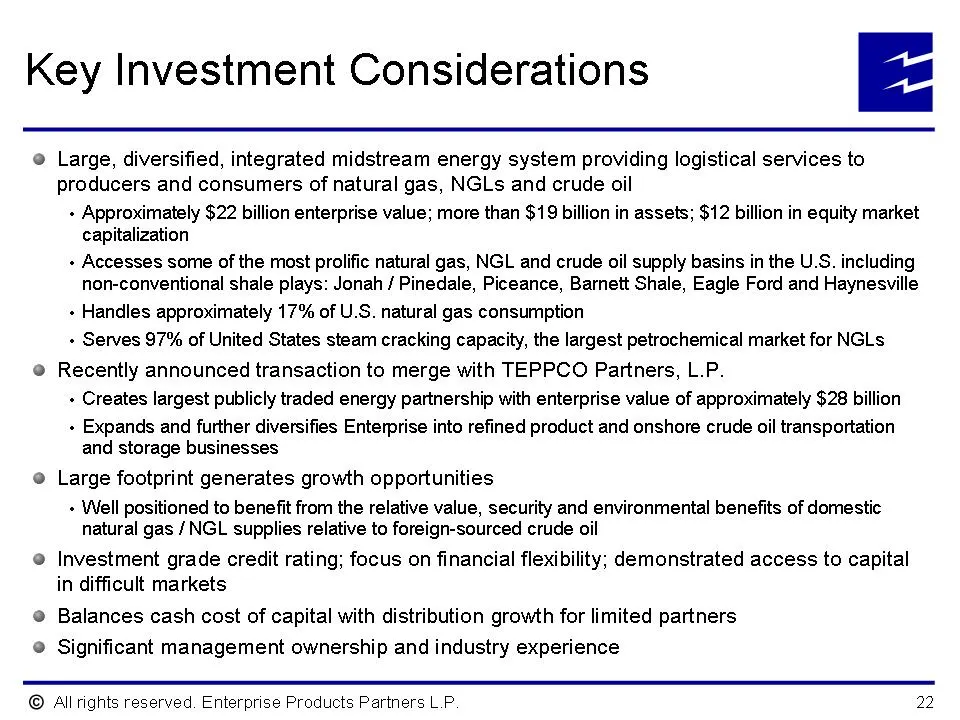
Key Investment Considerations ® Large, diversified, integrated midstream energy system providing logistical services to producers and consumers of natural gas, NGLs and crude oil + Approximately $22 billion enterprise value; more than $19 billion in assets; $12 billion in equity market capitalizatio
Slide 23: Non-GAAP Reconciliations
Non-GAAP Reconciliations © Allrights reserved. Enterprise Products Partners L.P.
Slide 24: Non-GAAP Financial Measures
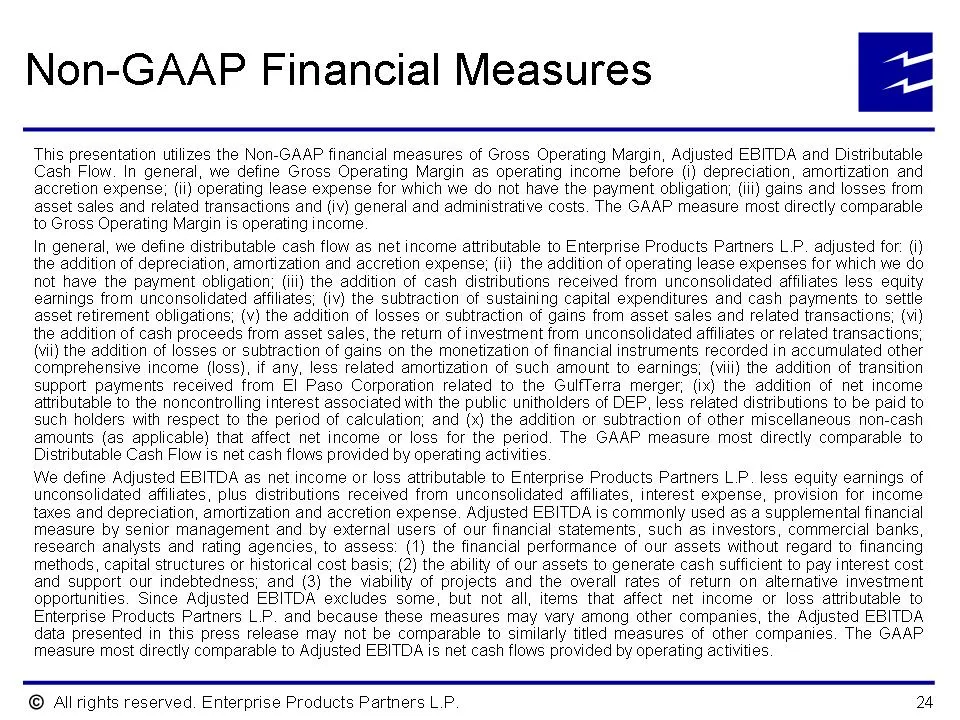
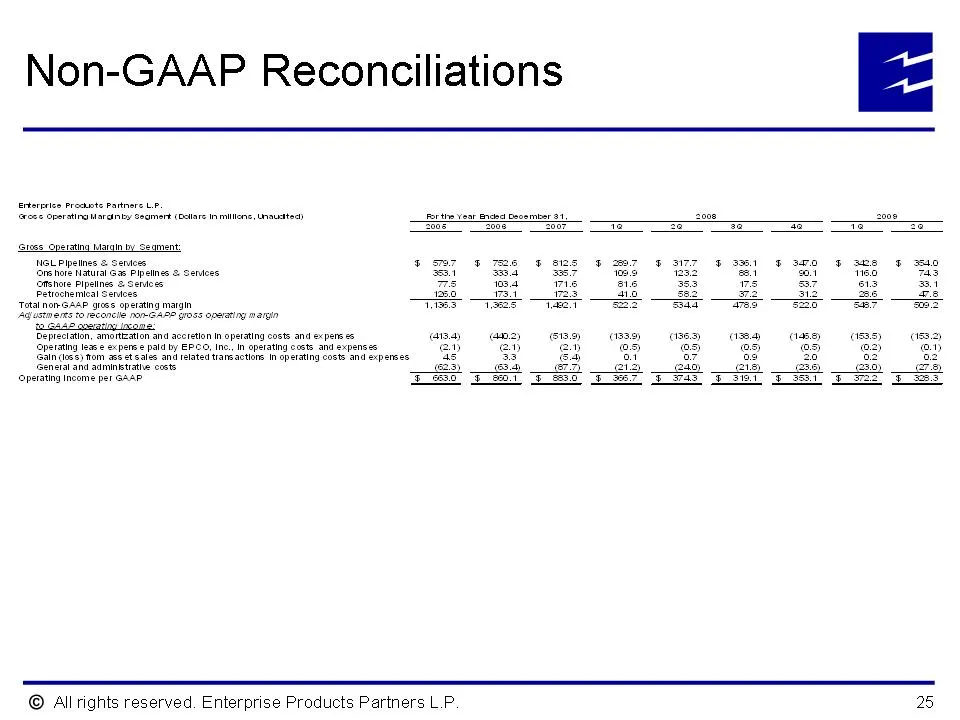
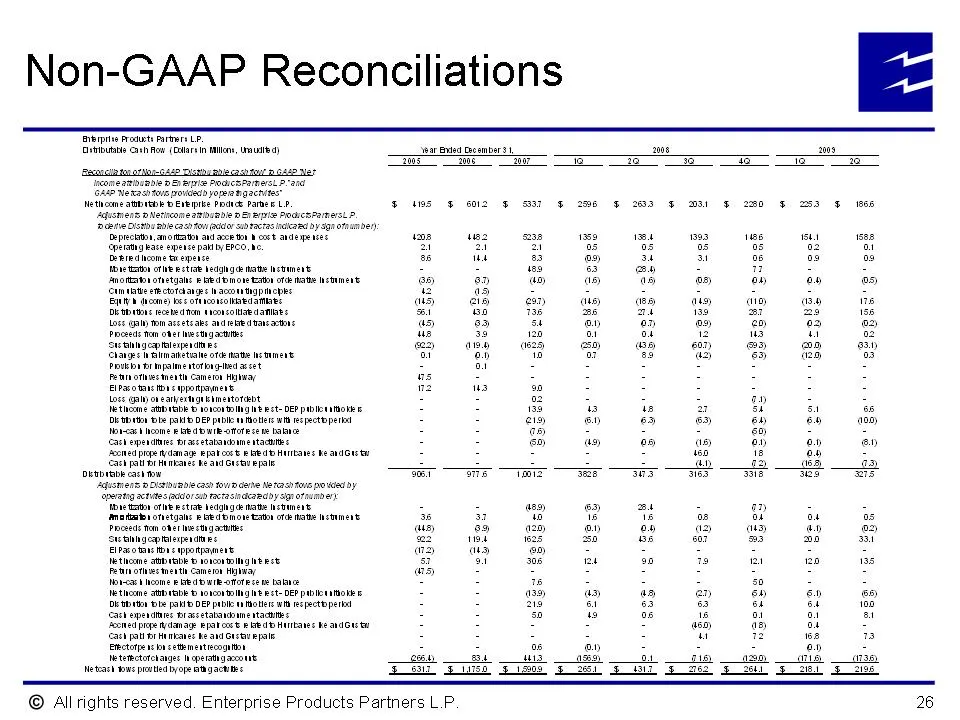
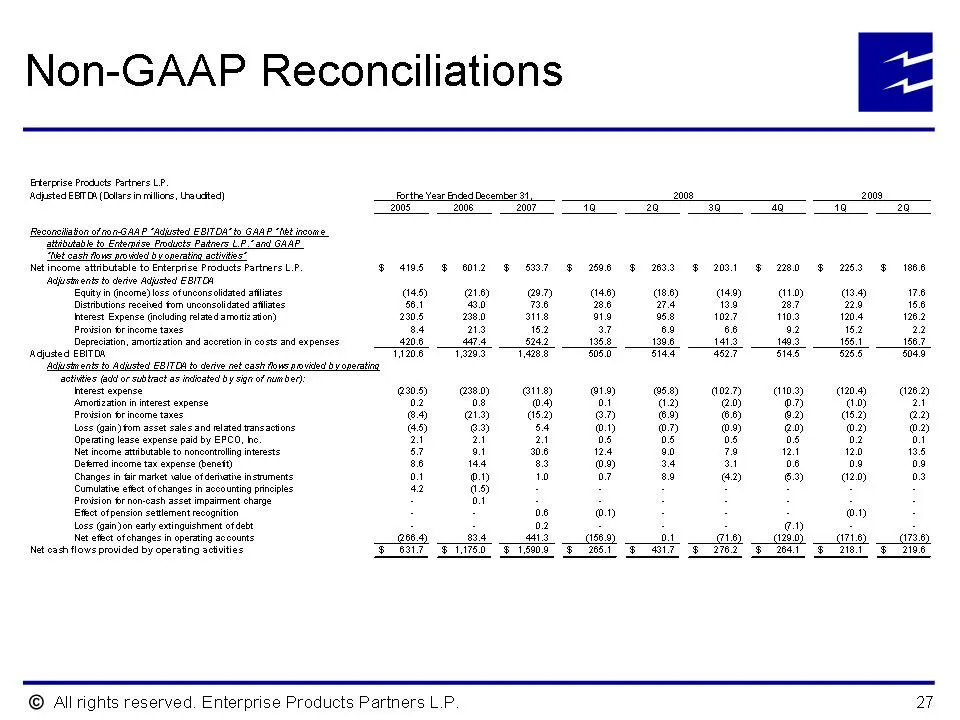
Non-GAAP Financial Measures This presentation utilizes the Non-GAAP financial measures of Gross Operating Margin, Adjusted EBITDA and Distributable Cash Flow. In general, we define Gross Operating Margin as operating income before (i) depreciation, amortization and accretion expense; (ii) operating
Slide 25: Non-GAAP Reconciliations
Non-GAAP Reconciliations ieee operating Man by Seument NGL Ppatnes & Sertoss ‘ore hoe Natural Gas Pipelines & Sences apap carne Depreciation, amorteation and aoctetion in opetating costs and e< pes 2s ating lee 2:panee pad by EPCS, Ino. n operating costs and spans es is) Rosette an sate ase In opaat
Slide 26: Non-GAAP Reconciliations
Non-GAAP Reconciliations There heat rar LP. (Guts Hera) ve powcads yore mgacnsts netucane aabeepk beverpike Pace Famer LP $495 § oO? § SBF § 25 F aHs $F mS F 2D B53 FHS ‘ecto anomto ad soto heart andes cee ios te es nT no) perma eave opens pally E20, 4c 2 21 0 os 08 0s 02 Dreiedicone tremens es ua 9
Slide 27: Non-GAAP Reconciliations
Non-GAAP Reconciliations Erterprise Products Partrers LP. Adjsted EBTOA (Dallas in illers, Urauted) forthe Vear Ended Dasember $1 2009 2009 200s 2008 2007 rT 2 3 ro} rT 2 econsilaion of 00-6 AAP “Aused! EBITDA” ty GAAP “tt income saidutable to Entemice Prcuots Patrers UP." and GAAP "At cash four ars
Slide 28: TPP Non-GAAP Financial Measures
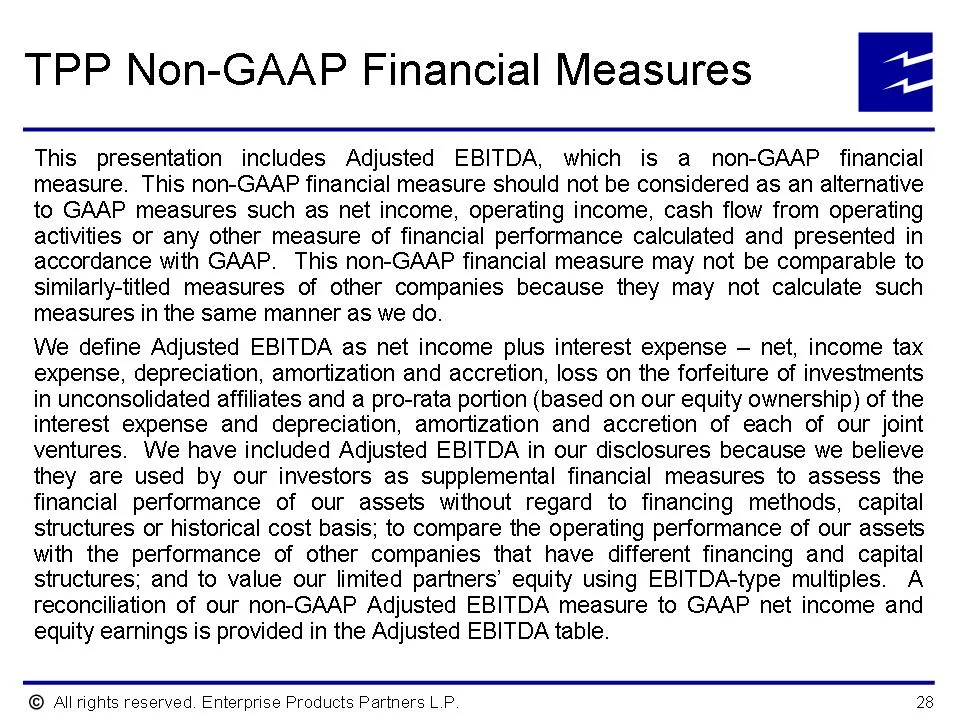
TPP Non-GAAP Financial Measures [Ez This presentation includes Adjusted EBITDA, which is a non-GAAP financial measure. This non-GAAP financial measure should not be considered as an alternative to GAAP measures such as net income, operating income, cash flow from operating activities or any other me
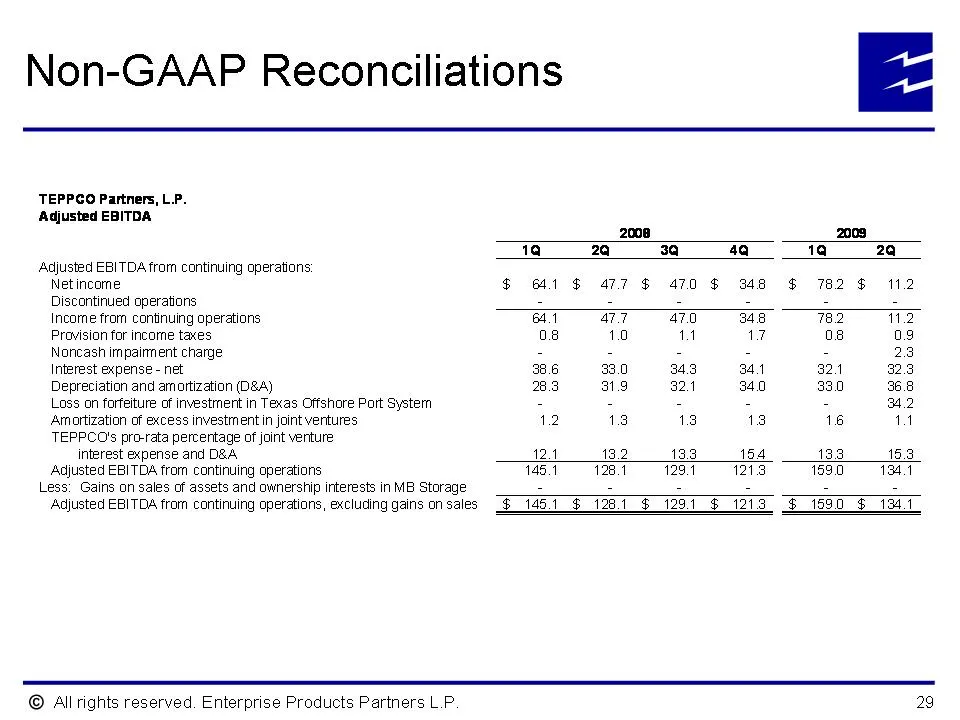
Slide 29: Non-GAAP Reconciliations
Non-GAAP Reconciliations TEPPGO Partners, LP. Adjusted EBITDA Adjusted EBITDA from continuing operations: Net income Discontinued operations Income fram continuing operations Provision for incame taxes Noncash impairment charge Interest expense - net Depreciation and amartization (D&A) Loss on forfe
Source: SEC EDGAR · 425 filed Sep 9, 2009
More decks from Teppco Partners LP
 Morgan Stanley MLP Reception (October 2009)26 slides · Oct 7, 2009
 Master Limited Partnerships Investor Conference (September 2009)27 slides · Sep 16, 2009
 Wells Fargo Retail Meeting (September 2009)27 slides · Sep 15, 2009
 Merger or Acquisition (August 2009)29 slides · Aug 26, 2009
 Wachovia Securities Investor Presentation (June 2007)51 slides · Jun 1, 2007
 Investor Day (March 2007)75 slides · Mar 29, 2007