Teppco Partners LP — Wachovia Securities Investor Presentation (June 2007)
51 slides from Teppco Partners LP's conference presentation, Jun 1, 2007
Slide 1: TEPPCO Partners, L.P. Wachovia Securities Investor Presentation
TEPPCO Partners, L.P. Wachovia Securities Investor Presentation June 1, 2007
Slide 2: Forward-looking Statements
Forward-looking Statements The material and information furnished in this presentation includes “forward-looking statements.” All statements that express belief, expectation, estimates or intentions, as well as those that are not statements of historical facts are forward-looking statements. Without
Slide 3: Forward-looking Statements (continued)
Forward-looking Statements …trucking and railroad freight, agricultural usage and military usage; the demand for propane is sensitive to the weather and prevailing economic conditions; the demand for petrochemicals is dependent upon prices for products produced from petrochemicals; the demand for cr
Slide 4: TEPPCO Partners, L.P.
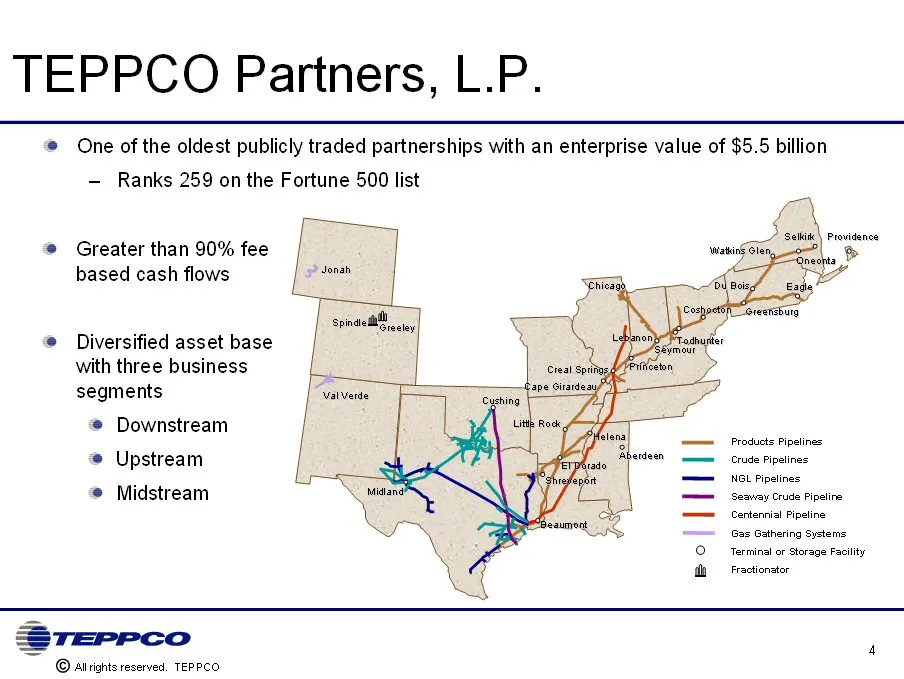
TEPPCO Partners, L.P. One of the oldest publicly traded partnerships with an enterprise value of $5.5 billion Ranks 259 on the Fortune 500 list Greater than 90% fee based cash flows Diversified asset base with three business segments Downstream Upstream Midstream Products Pipelines Crude Pipelines N
Slide 5: Investment Highlights
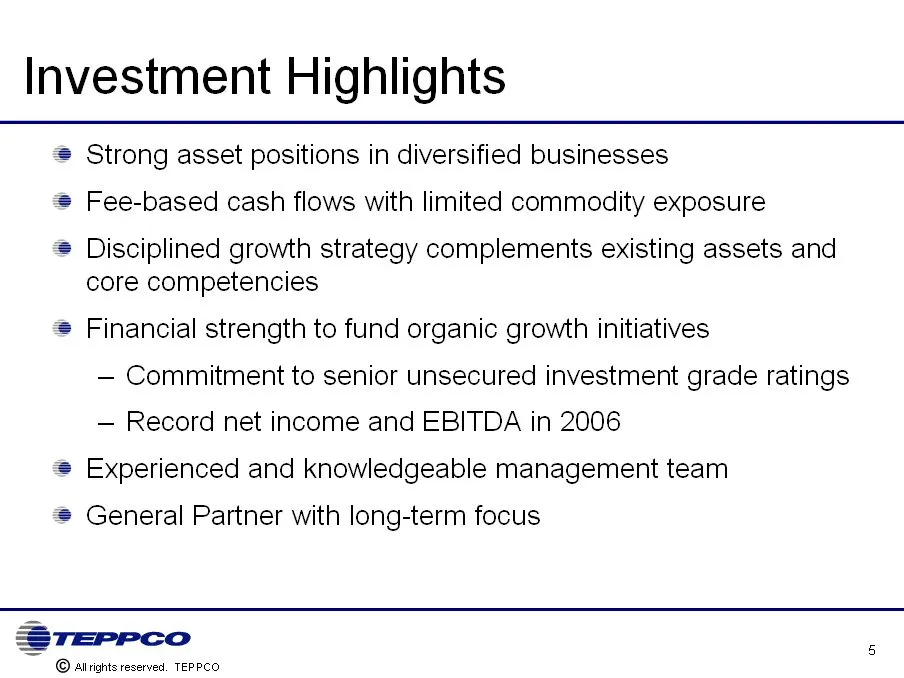
Investment Highlights Strong asset positions in diversified businesses Fee-based cash flows with limited commodity exposure Disciplined growth strategy complements existing assets and core competencies Financial strength to fund organic growth initiatives – Commitment to senior unsecured investment
Slide 6: Record EBITDA from Diversified Base of Assets
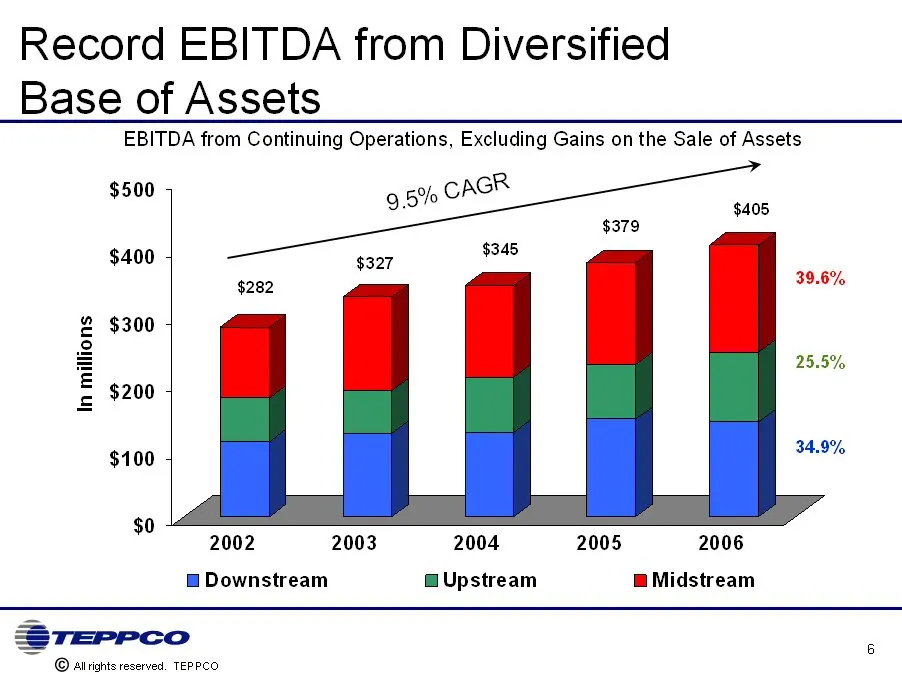
Record EBITDA from Diversified Base of Assets EBITDA from Continuing Operations, Excluding Gains on the Sale of Assets
Slide 7: Supportive General Partner
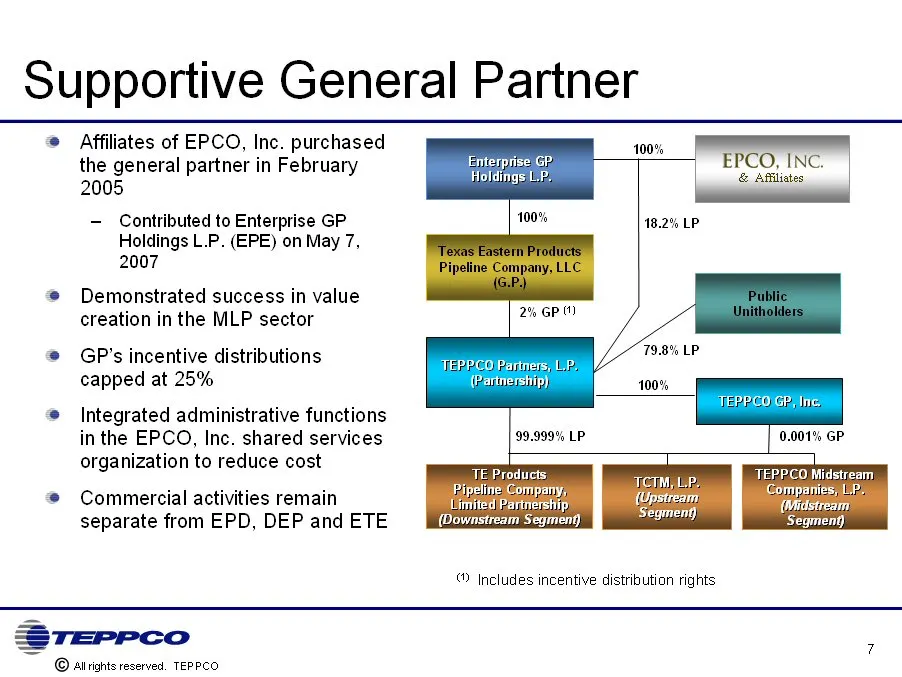
Supportive General Partner Affiliates of EPCO, Inc. purchased the general partner in February 2005 – Contributed to Enterprise GP Holdings L.P. (EPE) on May 7, 2007 Demonstrated success in value creation in the MLP sector GP’s incentive distributions capped at 25% Integrated administrative functions
Slide 8: 2006 Initiatives Position TEPPCO for Continued Growth
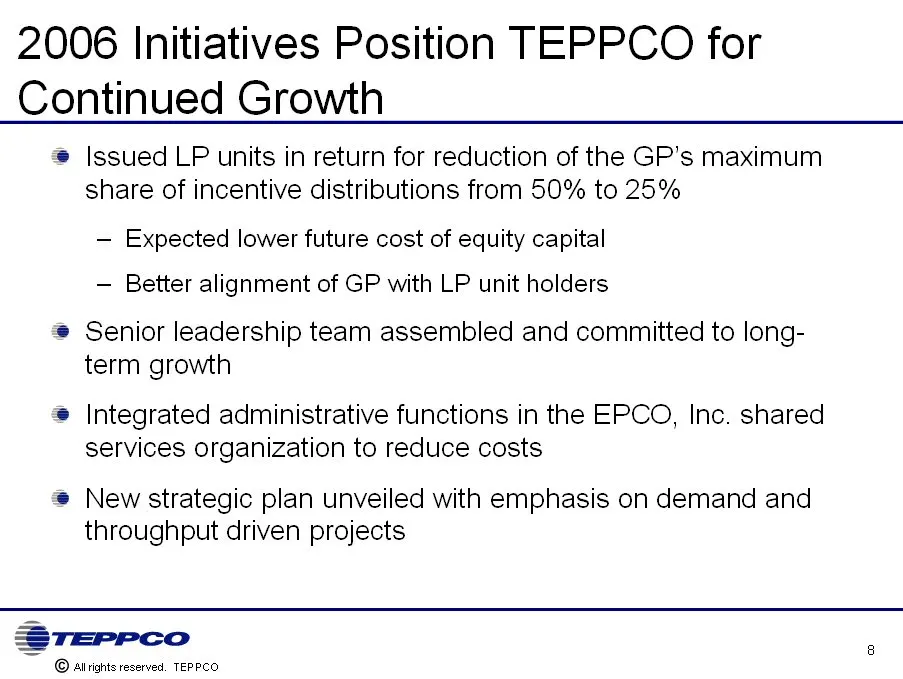
2006 Initiatives Position TEPPCO for Continued Growth Issued LP units in return for reduction of the GP’s maximum share of incentive distributions from 50% to 25% – Expected lower future cost of equity capital – Better alignment of GP with LP unit holders Senior leadership team assembled and committ
Slide 9: Downstream Business Review
Downstream Business Review
Slide 10: TEPPCO's Downstream Business
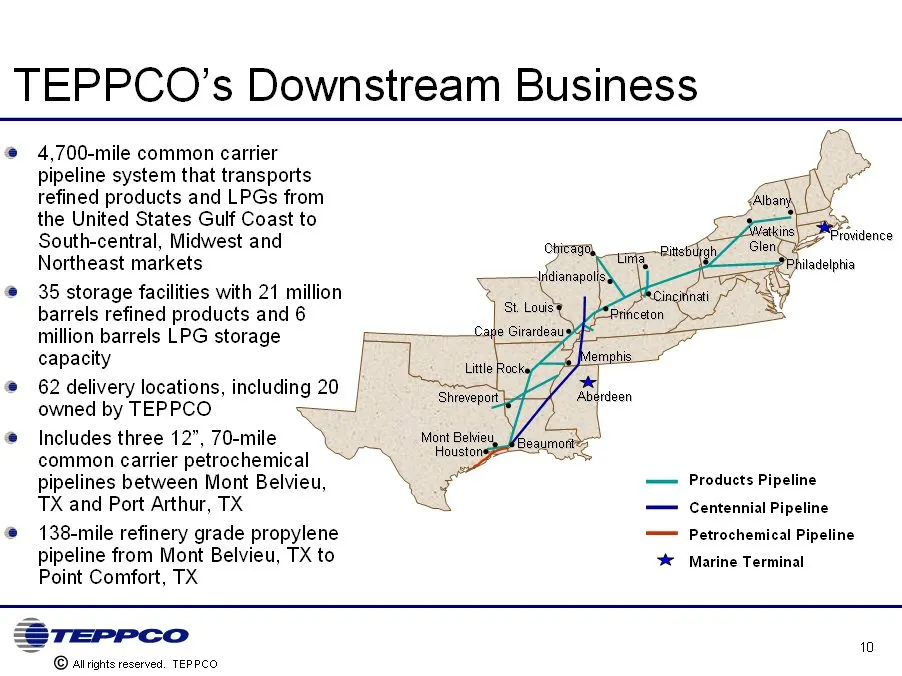
TEPPCO’s Downstream Business 4,700-mile common carrier pipeline system that transports refined products and LPGs from the United States Gulf Coast to South-central, Midwest and Northeast markets 35 storage facilities with 21 million barrels refined products and 6 million barrels LPG storage capacity
Slide 11: Investment in Centennial Joint Venture has Enabled Volume Growth
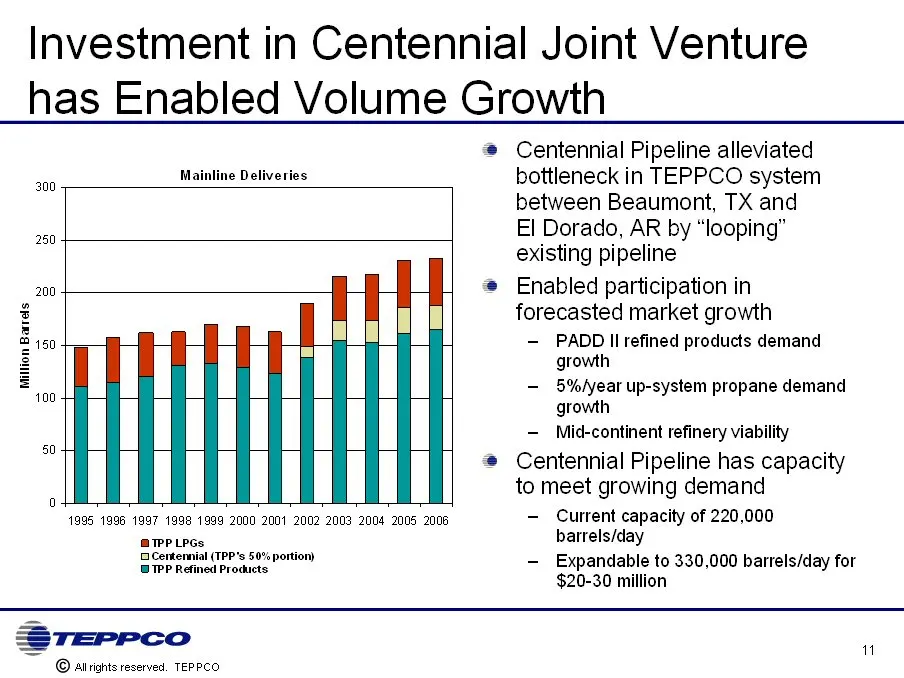
Investment in Centennial Joint Venture has Enabled Volume Growth Centennial Pipeline alleviated bottleneck in TEPPCO system between Beaumont, TX and El Dorado, AR by “looping” existing pipeline Enabled participation in forecasted market growth PADD II refined products demand growth 5%/year up-system
Slide 12: Downstream Growth Opportunities
Downstream Growth Opportunities Demand for refined products expected to increase, resulting in higher imports and refinery expansions Ethanol composition in motor gasoline is mandated, and consumption is expected to double from 2005 levels by 2012 Demand for storage and additional logistic capacity
Slide 13: Motiva Refined Products Terminal
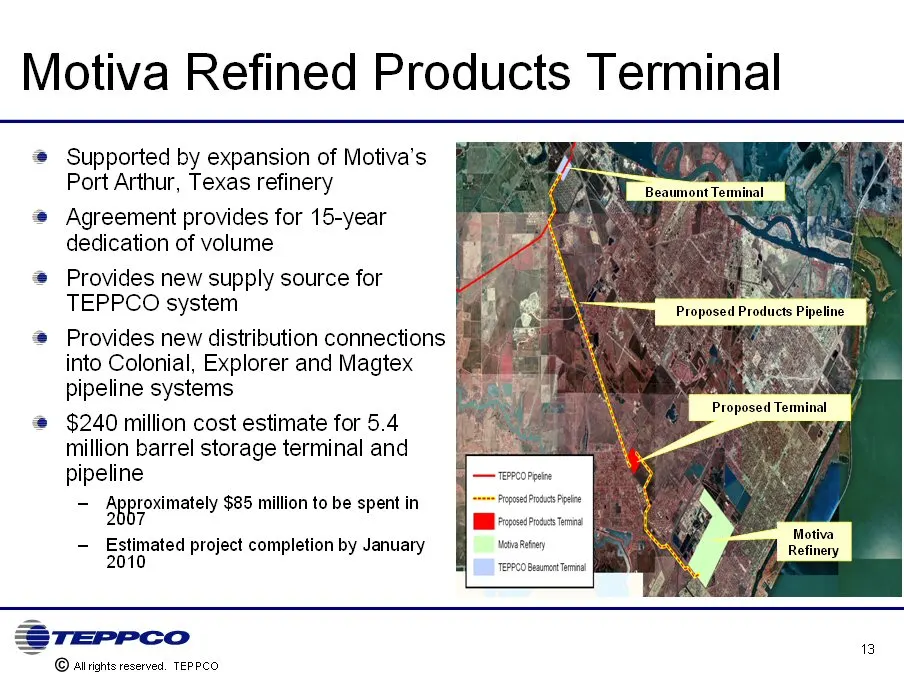
Motiva Refined Products Terminal Supported by expansion of Motiva’s Port Arthur, Texas refinery Agreement provides for 15-year dedication of volume Provides new supply source for TEPPCO system Provides new distribution connections into Colonial, Explorer and Magtex pipeline systems $240 million cost
Slide 14: Incremental Organic Growth Projects from Acquired Genco Assets
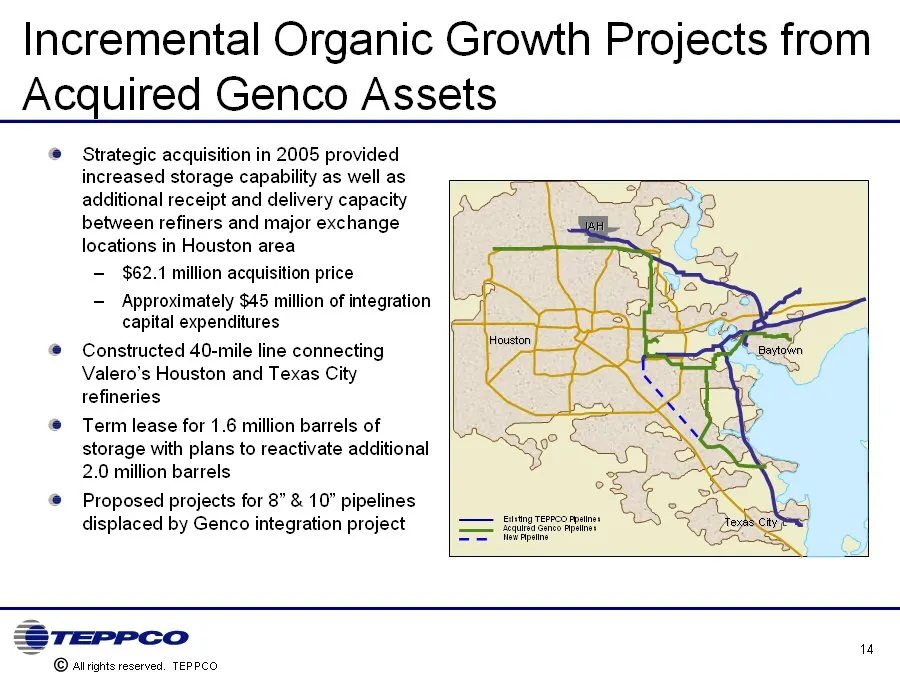
Incremental Organic Growth Projects from Acquired Genco Assets Strategic acquisition in 2005 provided increased storage capability as well as additional receipt and delivery capacity between refiners and major exchange locations in Houston area $62.1 million acquisition price Approximately $45 milli
Slide 15: Memphis/FedEx Connection
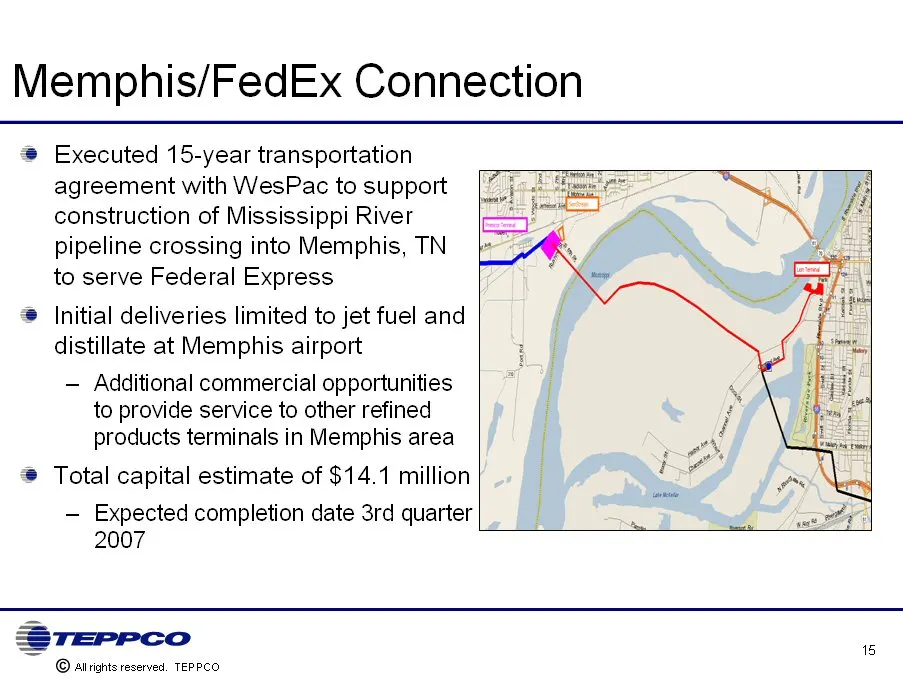
Memphis/FedEx Connection Executed 15-year transportation agreement with WesPac to support construction of Mississippi River pipeline crossing into Memphis, TN to serve Federal Express Initial deliveries limited to jet fuel and distillate at Memphis airport – Additional commercial opportunities to pr
Slide 16: Refined Products Terminals Provide Expansion into New Markets
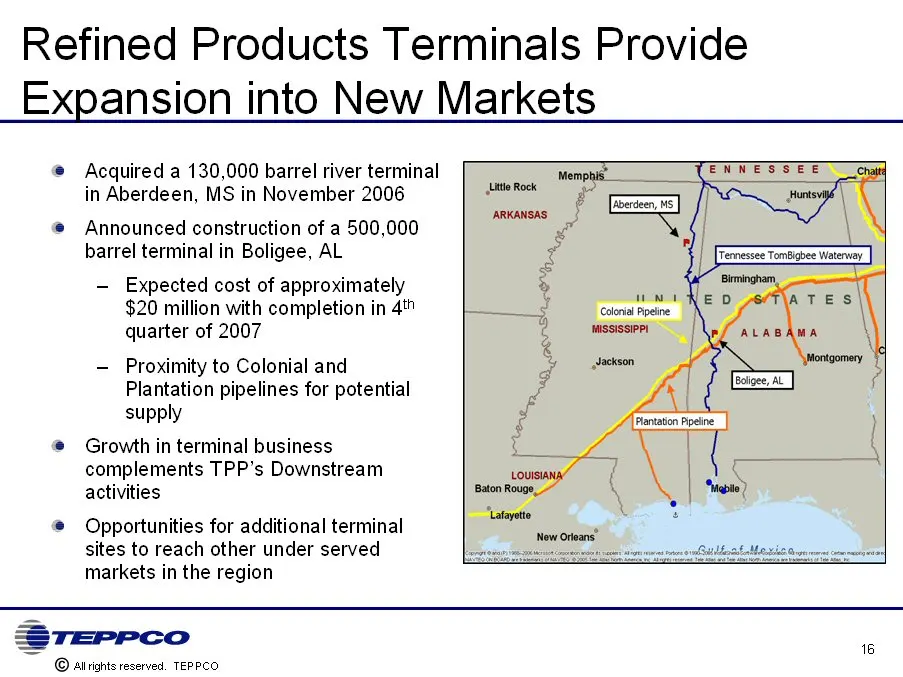
Refined Products Terminals Provide Expansion into New Markets Acquired a 130,000 barrel river terminal in Aberdeen, MS in November 2006 Announced construction of a 500,000 barrel terminal in Boligee, AL – Expected cost of approximately $20 million with completion in 4th quarter of 2007 – Proximity t
Slide 17: Upstream Business Review
Upstream Business Review TEPPCO © Alrights reserve sd, TEPPCO id
Slide 18: TEPPCO's Upstream Pipeline Assets
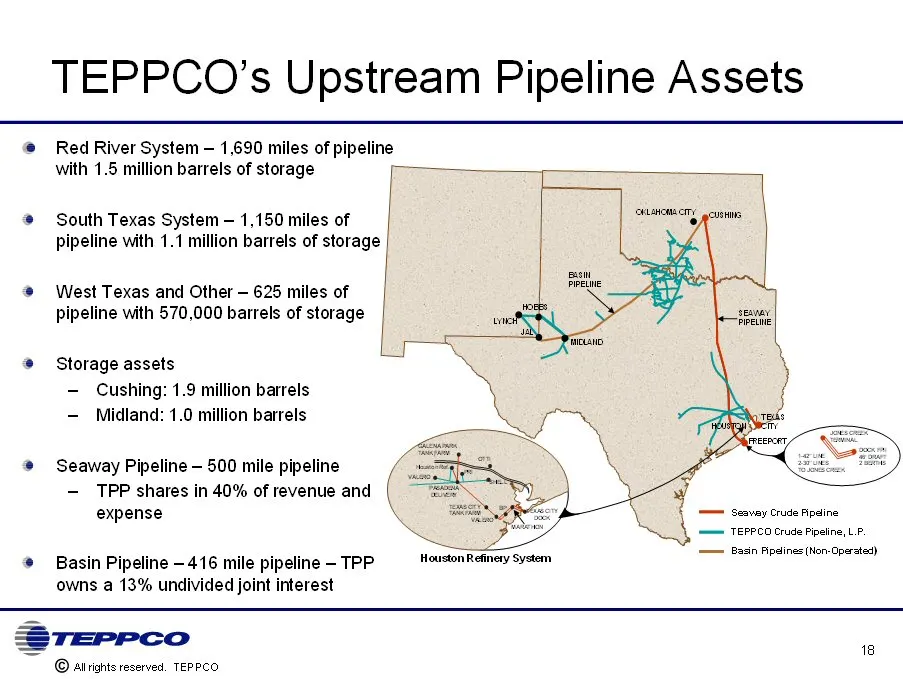
TEPPCO’s Upstream Pipeline Assets Red River System – 1,690 miles of pipeline with 1.5 million barrels of storage South Texas System – 1,150 miles of pipeline with 1.1 million barrels of storage West Texas and Other – 625 miles of pipeline with 570,000 barrels of storage Storage assets – Cushing: 1.9
Slide 19: TEPPCO Crude Gathering and Marketing
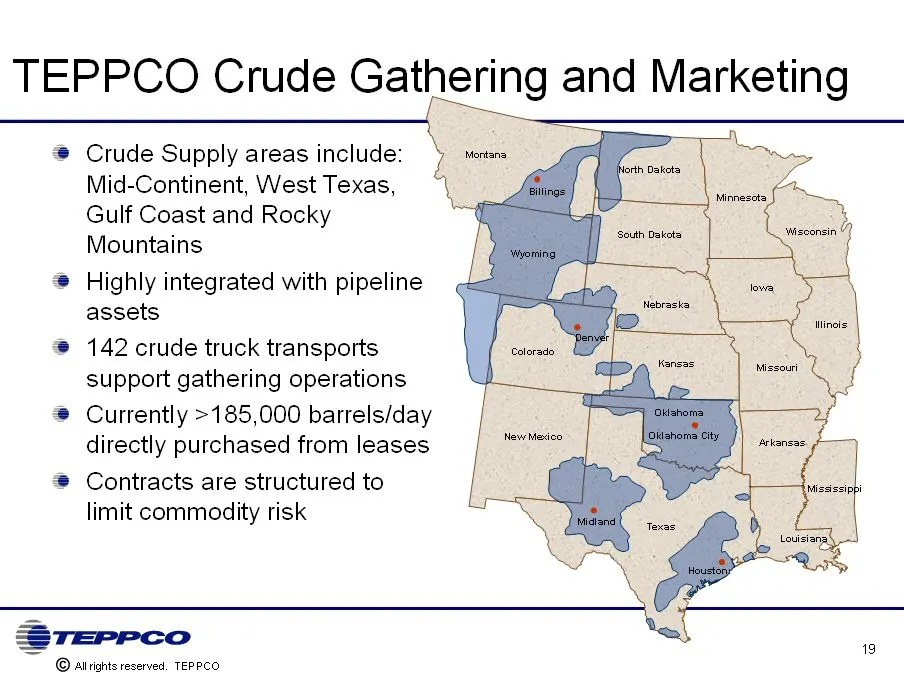
TEPPCO Crude Gathering and Marketing Crude Supply areas include: Mid-Continent, West Texas, Gulf Coast and Rocky Mountains Highly integrated with pipeline assets 142 crude truck transports support gathering operations Currently >185,000 barrels/day directly purchased from leases Contracts are struct
Slide 20: Seaway Crude Pipeline
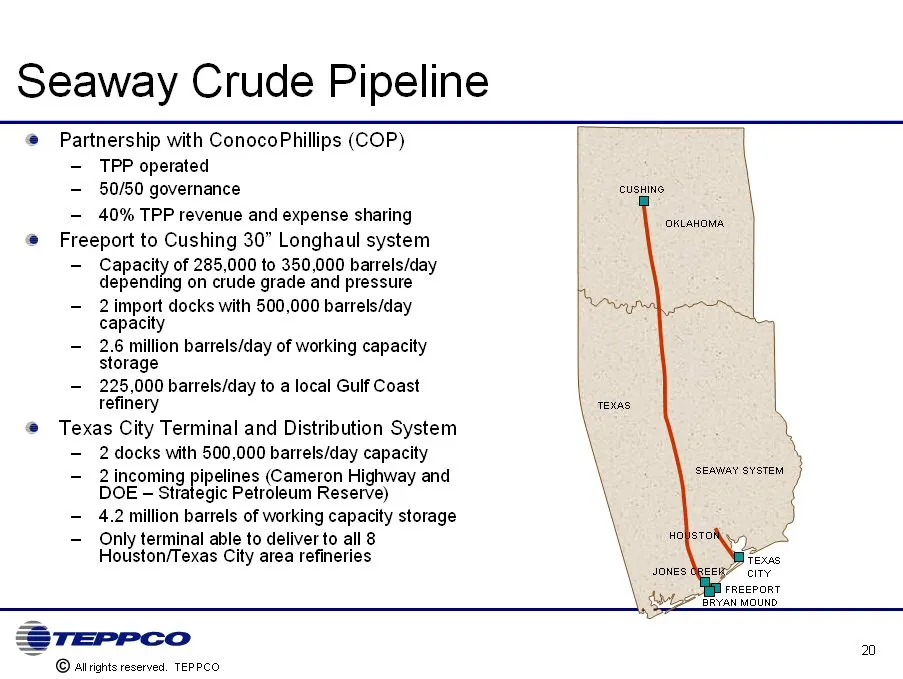
Seaway Crude Pipeline Partnership with ConocoPhillips (COP) – TPP operated – 50/50 governance – 40% TPP revenue and expense sharing Freeport to Cushing 30” Longhaul system – Capacity of 285,000 to 350,000 barrels/day depending on crude grade and pressure – 2 import docks with 500,000 barrels/day cap
Slide 21: Upstream Growth Opportunities
Upstream Growth Opportunities Expected growth in Canadian crude oil sands production creates an opportunity to provide a competitive option to move the oil to U.S. refining customers through an optimum combination of new pipeline construction and/or existing pipeline assets (TEPPCO and 3rd party) Ex
Slide 22: Expansion of Cushing Storage Assets
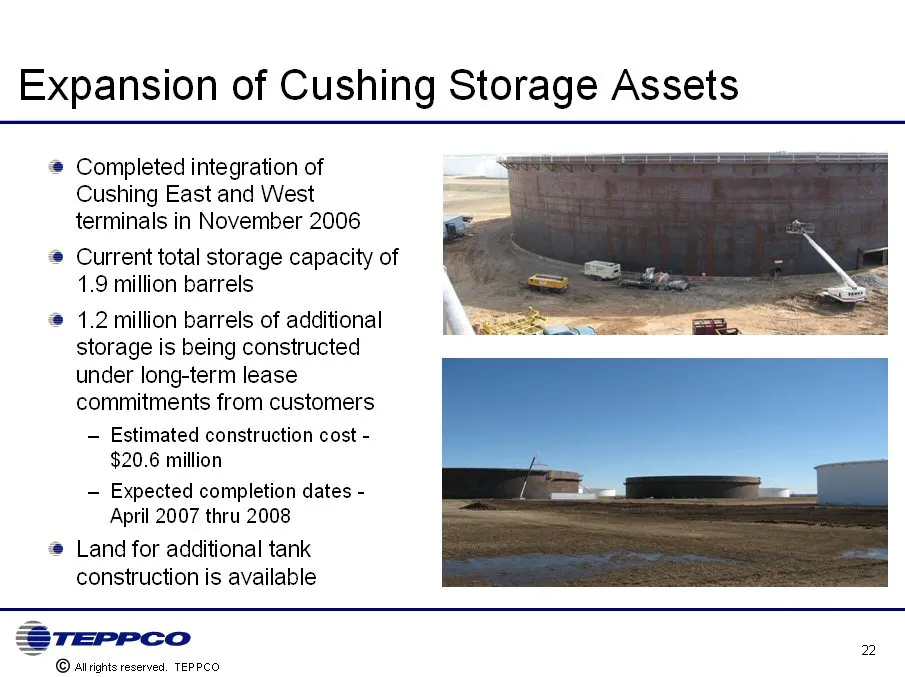
Expansion of Cushing Storage Assets Completed integration of Cushing East and West terminals in November 2006 Current total storage capacity of 1.9 million barrels 1.2 million barrels of additional storage is being constructed under long-term lease commitments from customers – Estimated construction
Slide 23: Other Projects
Other Projects Project completions throughout 2007 are expected to provide attractive returns and generate incremental cash flow in 2007 – Numerous lease supply extensions in the West Texas, New Mexico, and Mid-continent regions – expected completion dates throughout 2007 – Pipeline supply connectio
Slide 24: Midstream Business Review
Midstream Business Review 24
Slide 25: TEPPCO's Midstream Business
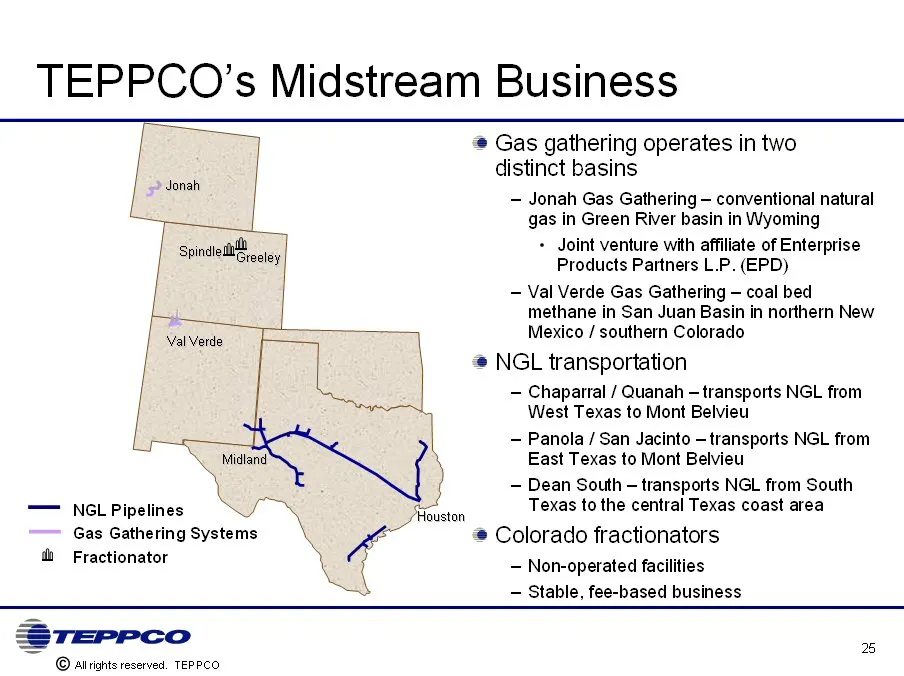
TEPPCO’s Midstream Business Gas gathering operates in two distinct basins Jonah Gas Gathering – conventional natural gas in Green River basin in Wyoming Joint venture with affiliate of Enterprise Products Partners L.P. (EPD) Val Verde Gas Gathering – coal bed methane in San Juan Basin in northern Ne
Slide 26: Jonah Gas Gathering System Overview
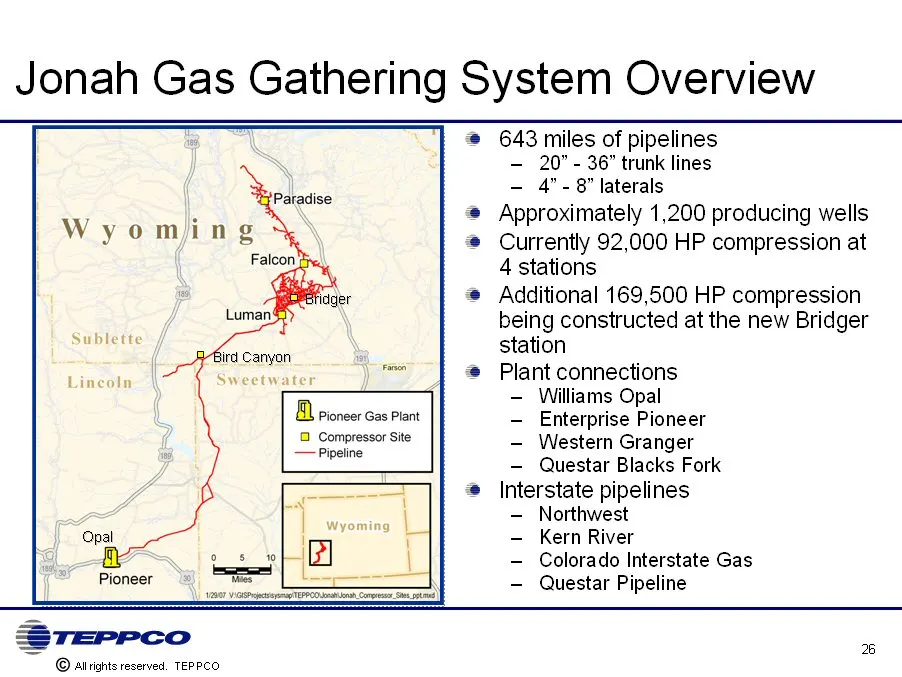
Jonah Gas Gathering System Overview 643 miles of pipelines – 20” - 36” trunk lines – 4” - 8” laterals Approximately 1,200 producing wells Currently 92,000 HP compression at 4 stations Additional 169,500 HP compression being constructed at the new Bridger station Plant connections – Williams Opal – E
Slide 27: Jonah Gas Gathering Volume Growth
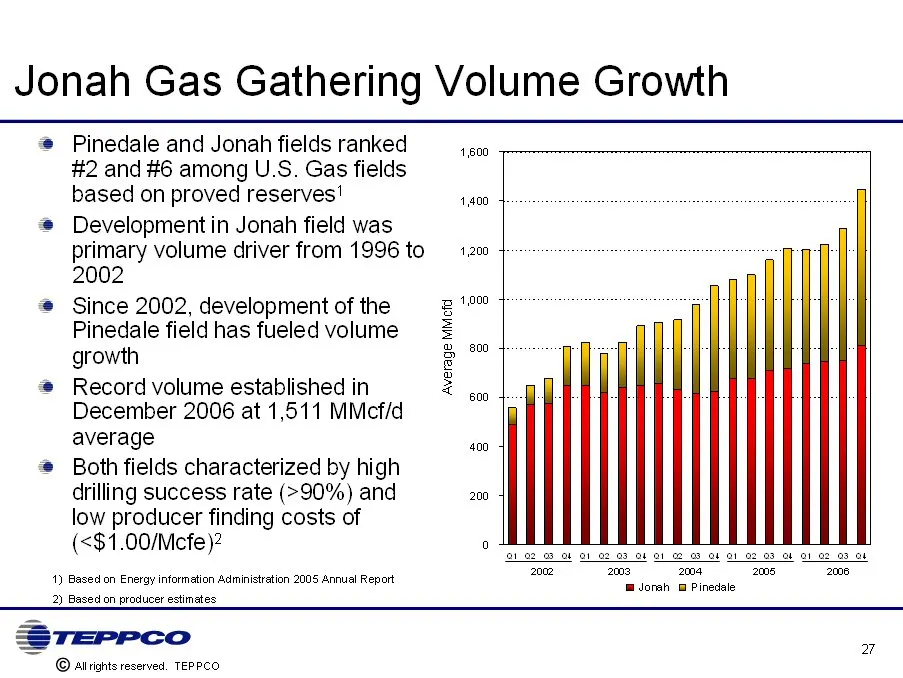
Jonah Gas Gathering Volume Growth Pinedale and Jonah fields ranked #2 and #6 among U.S. Gas fields based on proved reserves1 Development in Jonah field was primary volume driver from 1996 to 2002 Since 2002, development of the Pinedale field has fueled volume growth Record volume established in Dece
Slide 28: Pinedale Supplemental Environmental Impact Statement (SEIS)
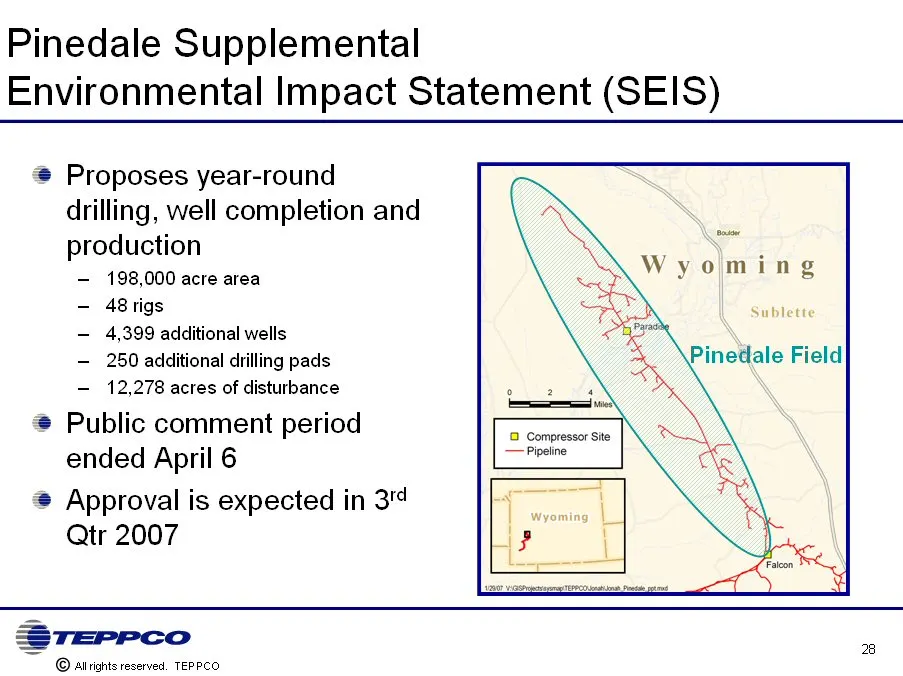
Pinedale Supplemental Environmental Impact Statement (SEIS) Proposes year-round drilling, well completion and production 198,000 acre area 48 rigs 4,399 additional wells 250 additional drilling pads 12,278 acres of disturbance Public comment period ended April 6 Approval is expected in 3rd Qtr 2007
Slide 29: Val Verde Gas Gathering System
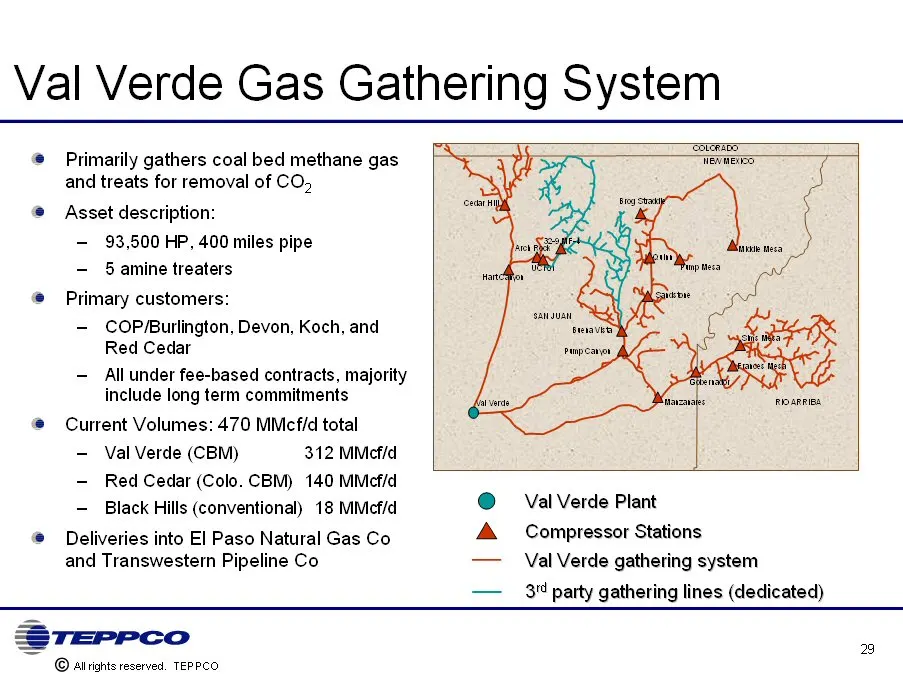
Val Verde Gas Gathering System Primarily gathers coal bed methane gas and treats for removal of CO2 Asset description: – 93,500 HP, 400 miles pipe – 5 amine treaters Primary customers: – COP/Burlington, Devon, Koch, and Red Cedar – All under fee-based contracts, majority include long term commitment
Slide 30: NGL Pipelines Overview
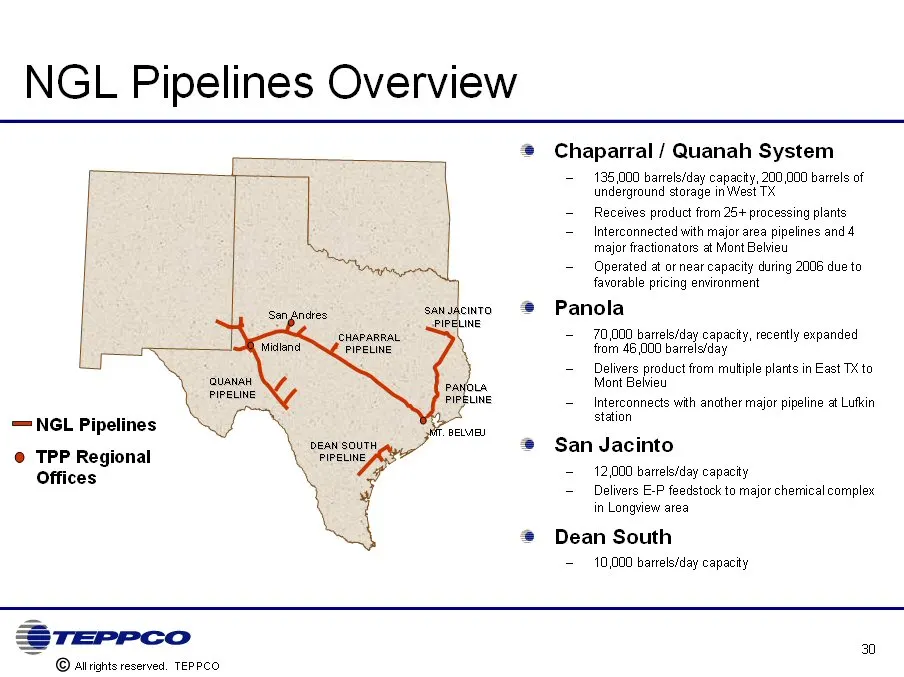
NGL Pipelines Overview Chaparral / Quanah System 135,000 barrels/day capacity, 200,000 barrels of underground storage in West TX Receives product from 25+ processing plants Interconnected with major area pipelines and 4 major fractionators at Mont Belvieu Operated at or near capacity during 2006 due
Slide 31: Midstream Growth Opportunities
Midstream Growth Opportunities Drilling/development in the Jonah and Pinedale fields are expected to remain active – Both fields characterized by high drilling success rates, low finding costs, with significant remaining recoverable reserves – Anticipated volume growth should result in further expan
Slide 32: Jonah Gas Gathering Phase V Expansion
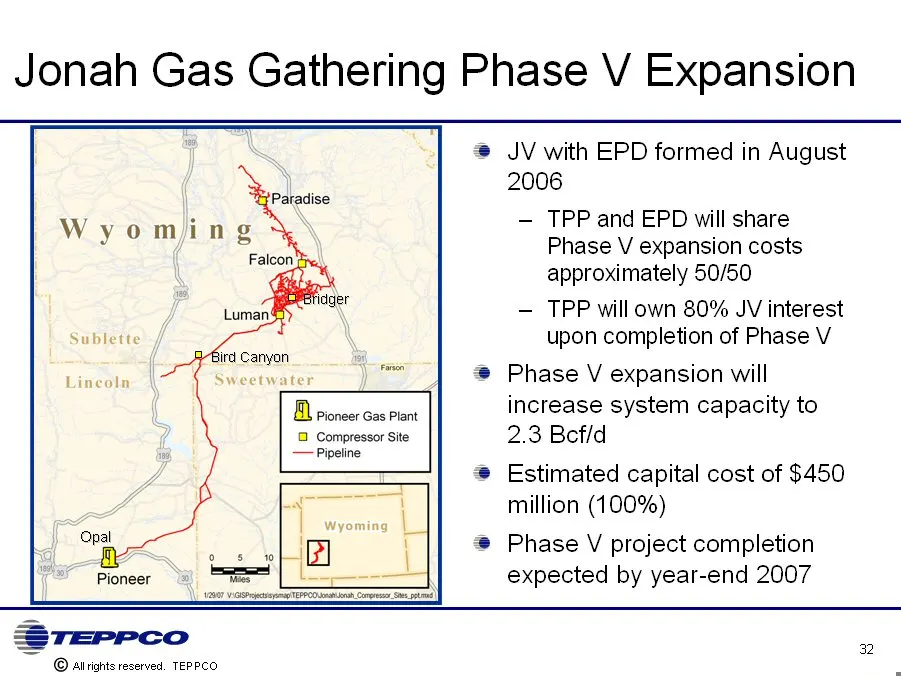
Jonah Gas Gathering Phase V Expansion JV with EPD formed in August 2006 TPP and EPD will share Phase V expansion costs approximately 50/50 TPP will own 80% JV interest upon completion of Phase V Phase V expansion will increase system capacity to 2.3 Bcf/d Estimated capital cost of $450 million (100%
Slide 33: Financial Overview
Financial Overview 3B
Slide 34: Financial Strategy
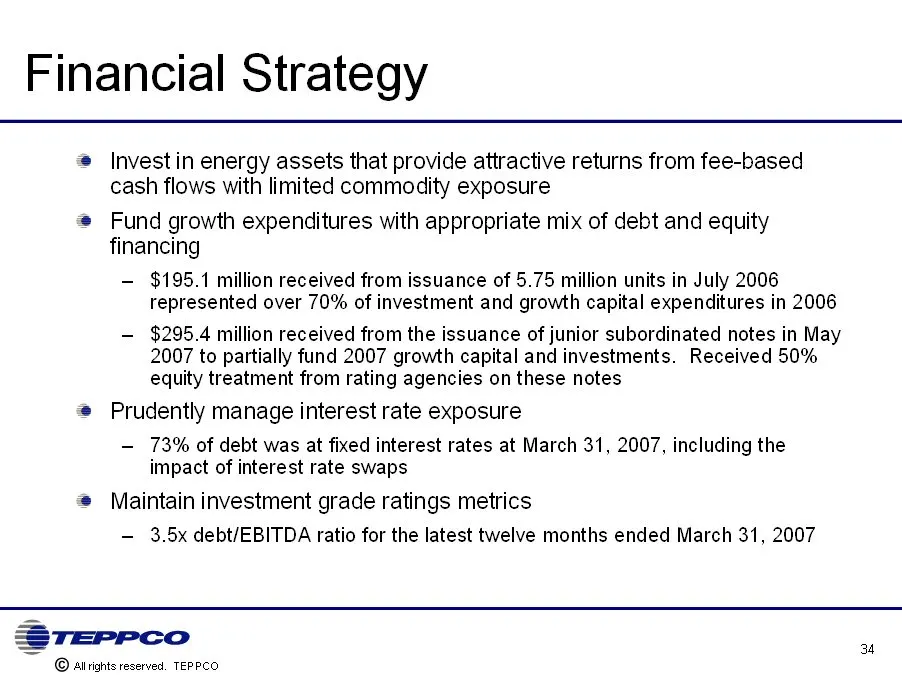
Financial Strategy Invest in energy assets that provide attractive returns from fee-based cash flows with limited commodity exposure Fund growth expenditures with appropriate mix of debt and equity financing – $195.1 million received from issuance of 5.75 million units in July 2006 represented over
Slide 35: Record 2006 Performance
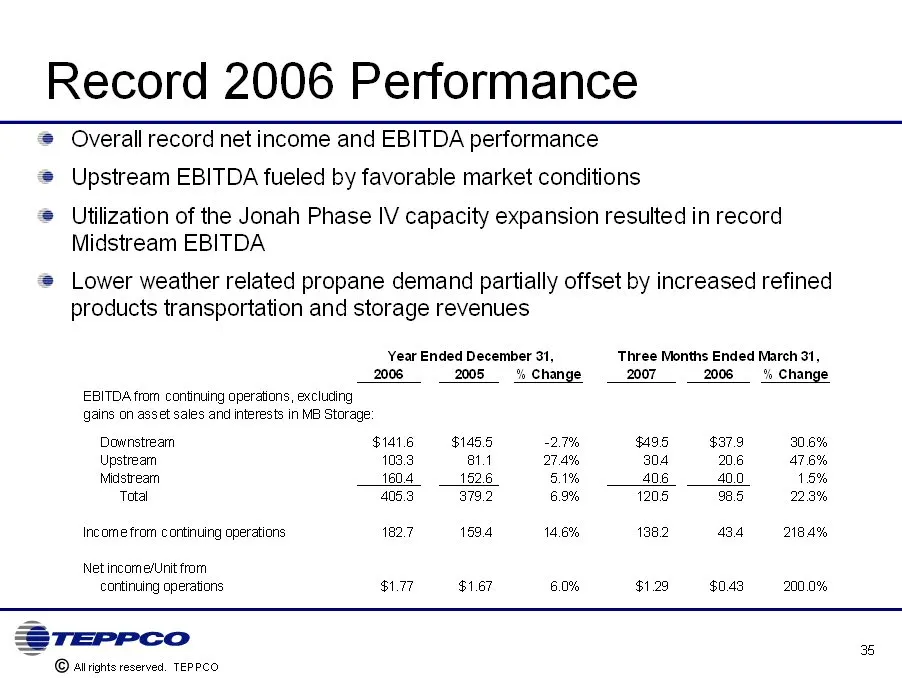
Record 2006 Performance Overall record net income and EBITDA performance Upstream EBITDA fueled by favorable market conditions Utilization of the Jonah Phase IV capacity expansion resulted in record Midstream EBITDA Lower weather related propane demand partially offset by increased refined products
Slide 36: Outlook
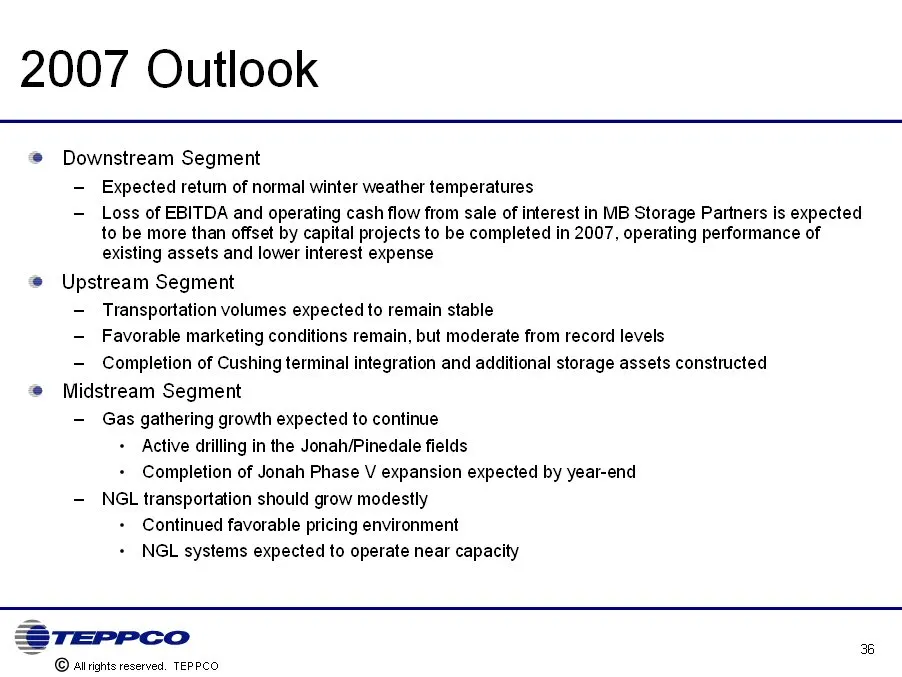
Outlook Downstream Segment – Expected return of normal winter weather temperatures – Loss of EBITDA and operating cash flow from sale of interest in MB Storage Partners is expected to be more than offset by capital projects to be completed in 2007, operating performance of existing assets and lower
Slide 37: Increased Level of Organic Growth in 2007
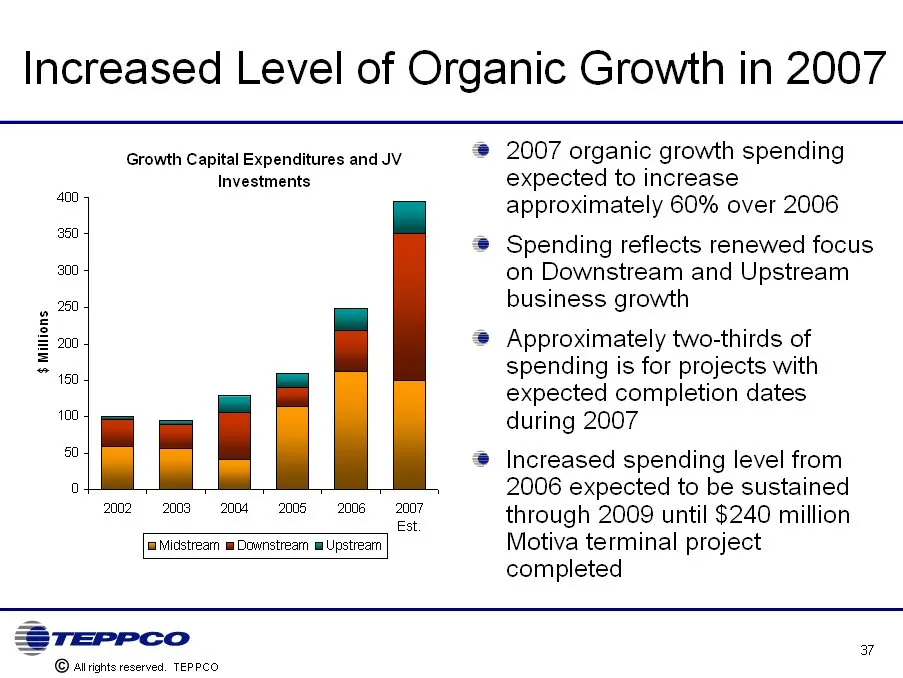
Increased Level of Organic Growth in 2007 2007 organic growth spending expected to increase approximately 60% over 2006 Spending reflects renewed focus on Downstream and Upstream business growth Approximately two-thirds of spending is for projects with expected completion dates during 2007 Increased
Slide 38: Capital Spending Detail
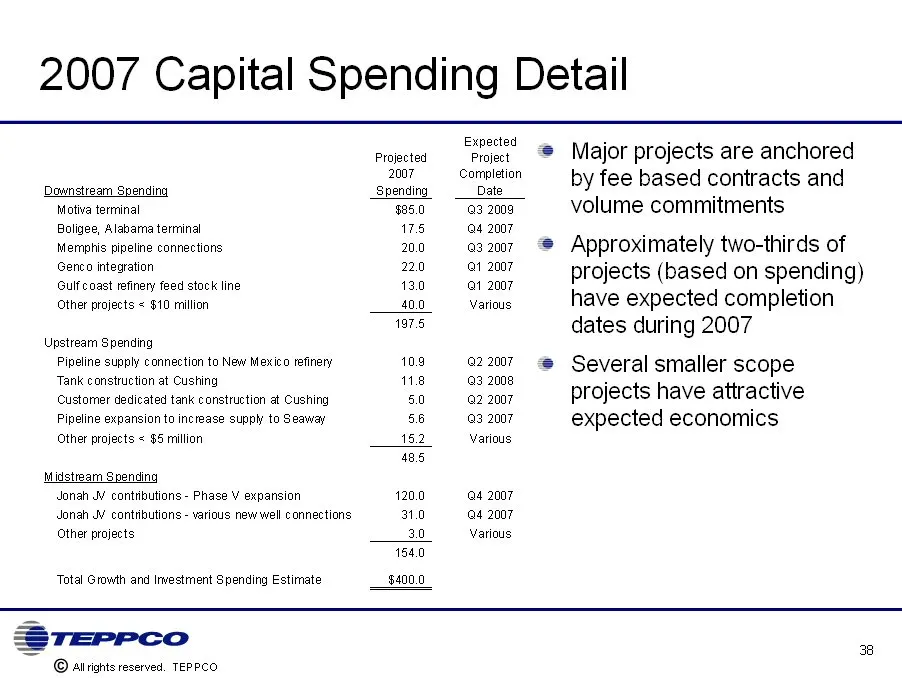
Capital Spending Detail Major projects are anchored by fee based contracts and volume commitments Approximately two-thirds of projects (based on spending) have expected completion dates during 2007 Several smaller scope projects have attractive expected economics
Slide 39: Consistent Investment Grade Financial Metrics
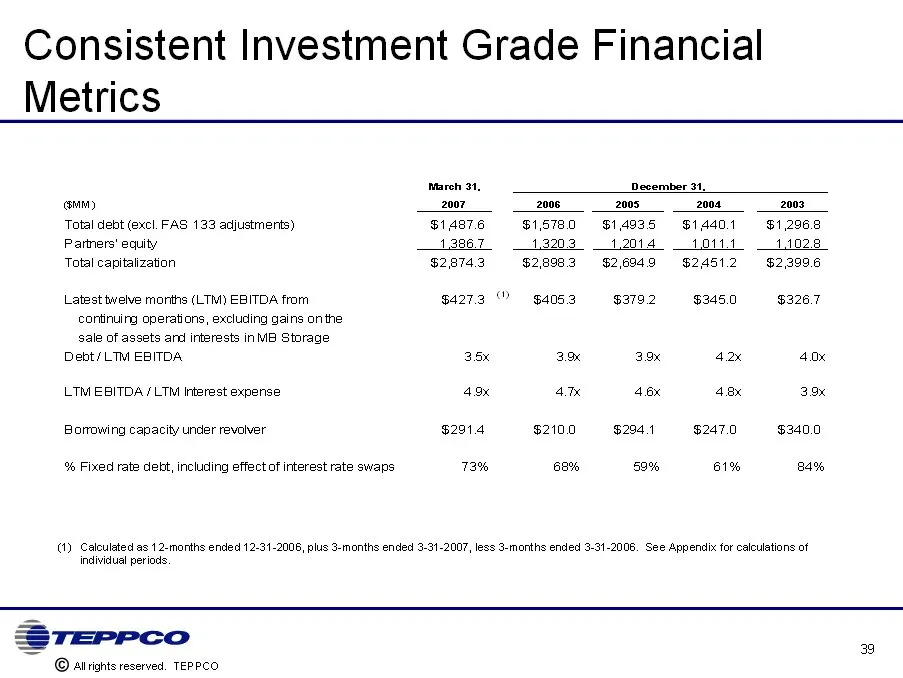
Consistent Investment Grade Financial Metrics
Slide 40: Reduced GP Incentive Distribution Structure Lowers Equity Cost of Capital
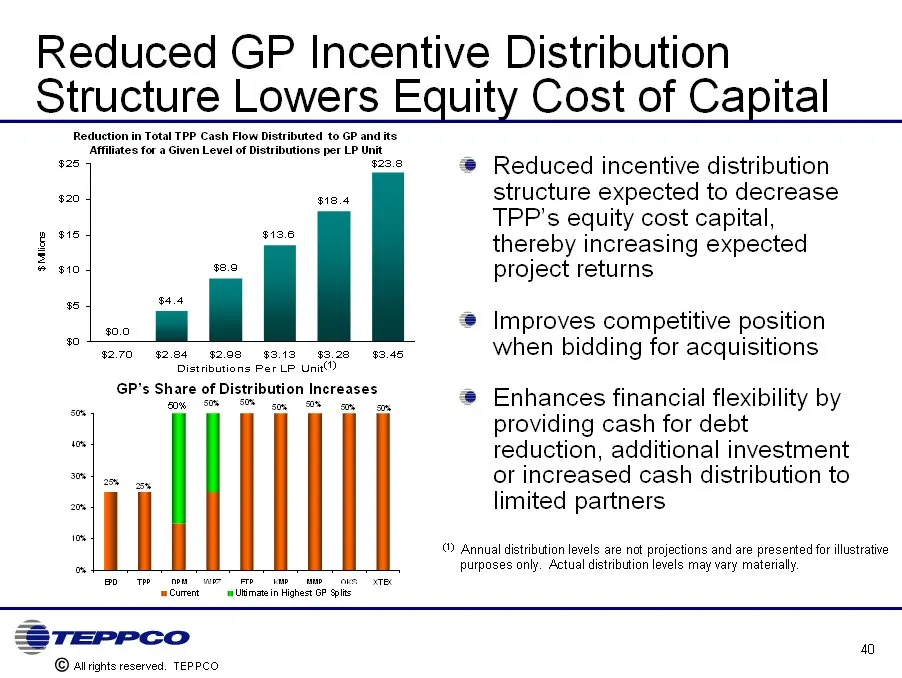
Reduced GP Incentive Distribution Structure Lowers Equity Cost of Capital Reduced incentive distribution structure expected to decrease TPP’s equity cost capital, thereby increasing expected project returns Improves competitive position when bidding for acquisitions Enhances financial flexibility by
Slide 41: Financial Strengths
Financial Strengths Fee-based cash flows with limited commodity exposure Diversified assets provide greater stability of earnings Investment grade ratings from S&P and Moody’s Financial metrics to support future growth opportunities Growth strategy that complements existing assets and core competenc
Slide 42: Questions and Answers
Questions and Answers NYSE: TPP www.teppco.com (800) 659-0059
Slide 43: Appendix
Appendix a
Slide 44: Reconciliation of Non-GAAP Measures
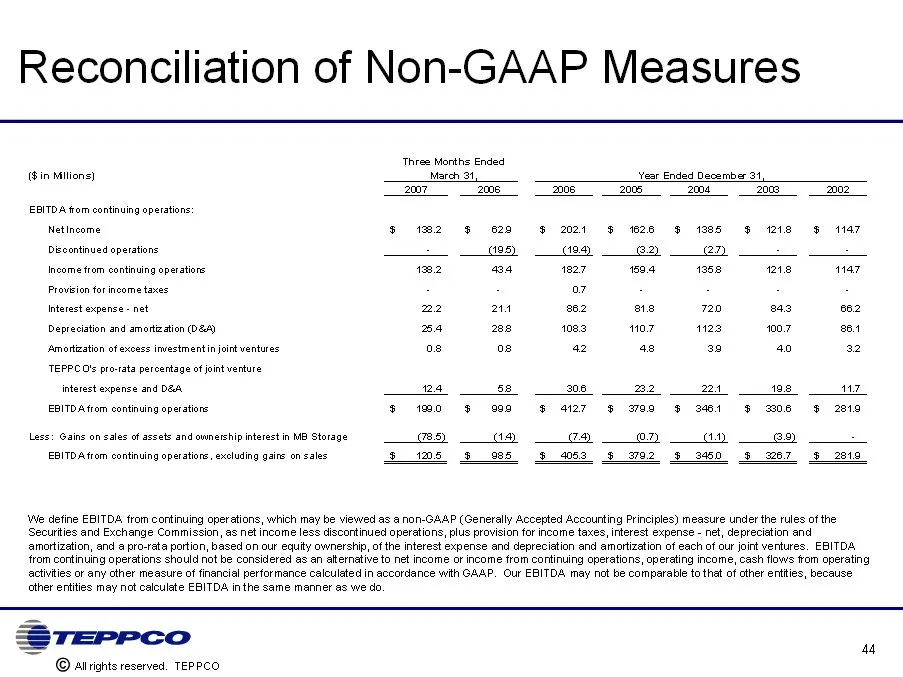
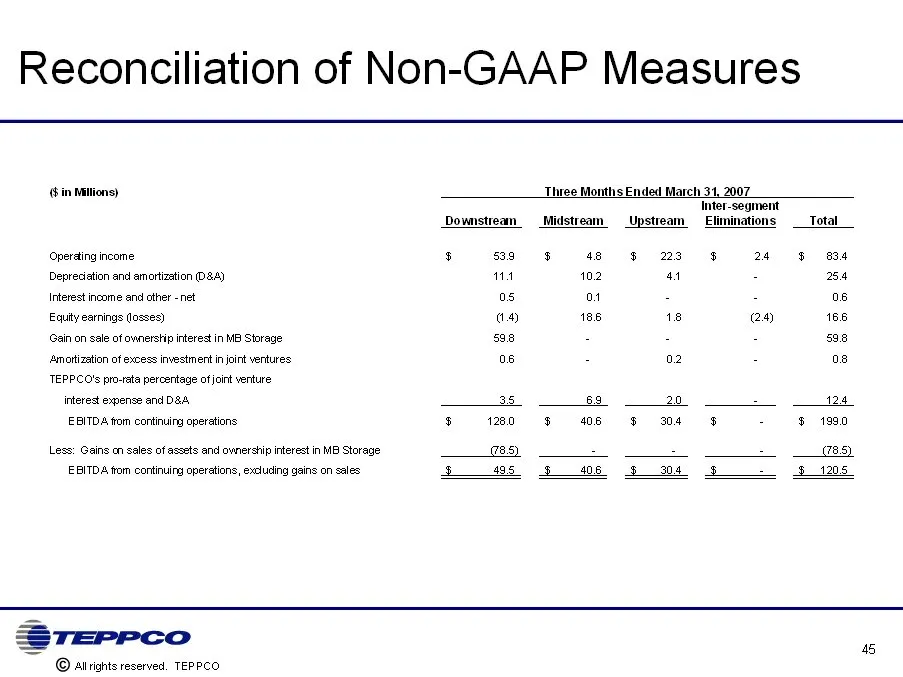
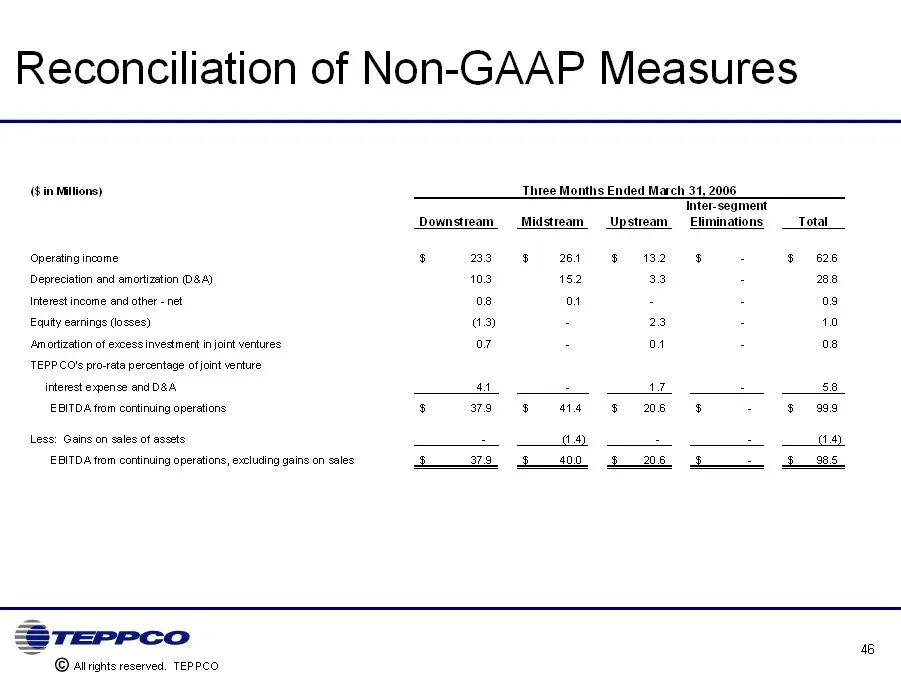
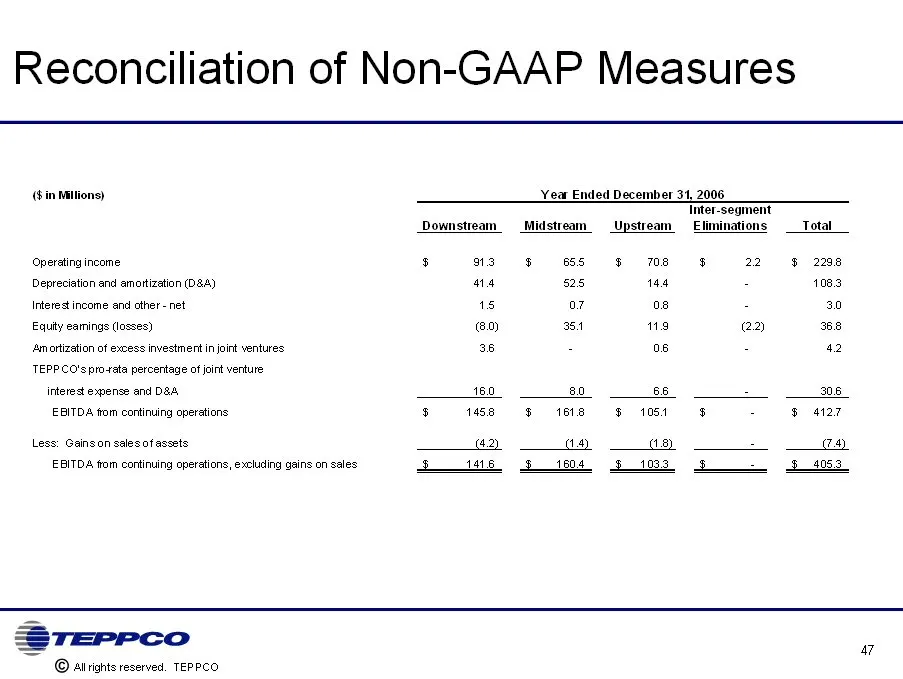
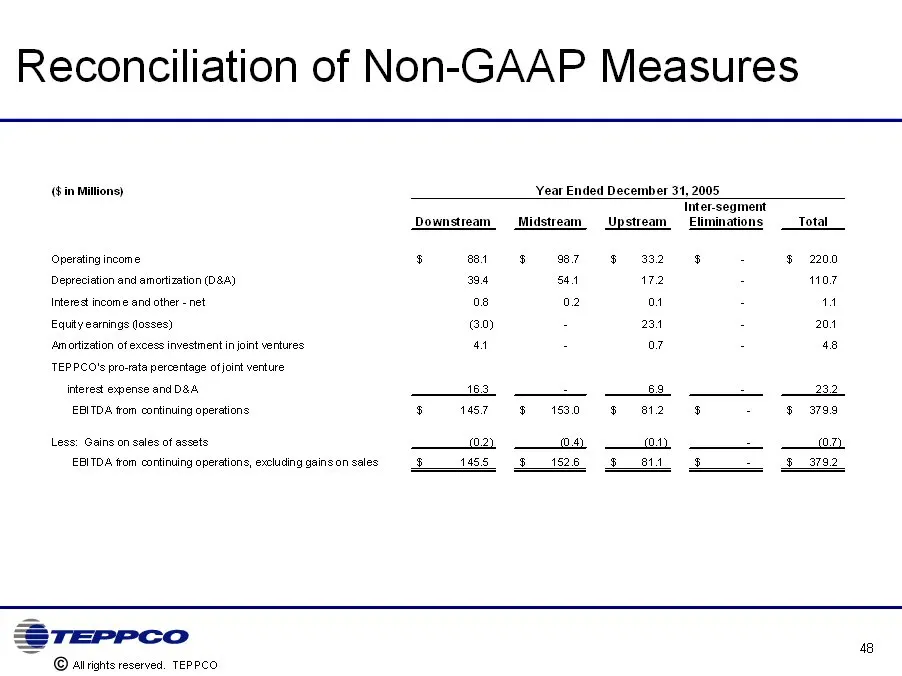
Reconciliation of Non-GAAP Measures We define EBITDA from continuing operations, which may be viewed as a non-GAAP (Generally Accepted Accounting Principles) measure under the rules of the Securities and Exchange Commission, as net income less discontinued operations, plus provision for income taxes
Slide 45: Reconciliation of Non-GAAP Measures
Reconciliation of Non-GAAP Measures
Slide 46: Reconciliation of Non-GAAP Measures
Reconciliation of Non-GAAP Measures
Slide 47: Reconciliation of Non-GAAP Measures
Reconciliation of Non-GAAP Measures
Slide 48: Reconciliation of Non-GAAP Measures
Reconciliation of Non-GAAP Measures
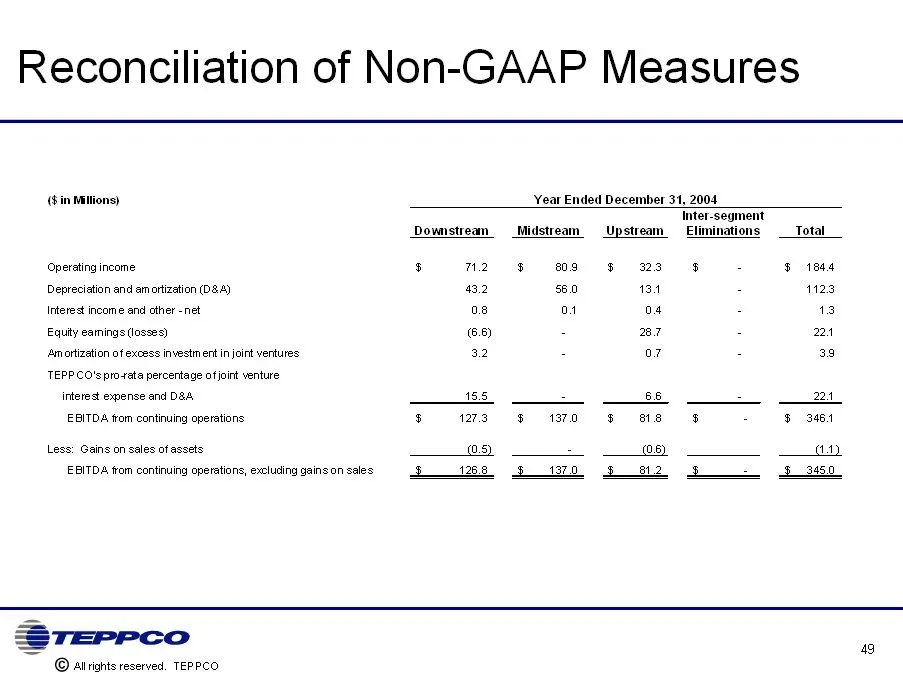
Slide 49: Reconciliation of Non-GAAP Measures
Reconciliation of Non-GAAP Measures
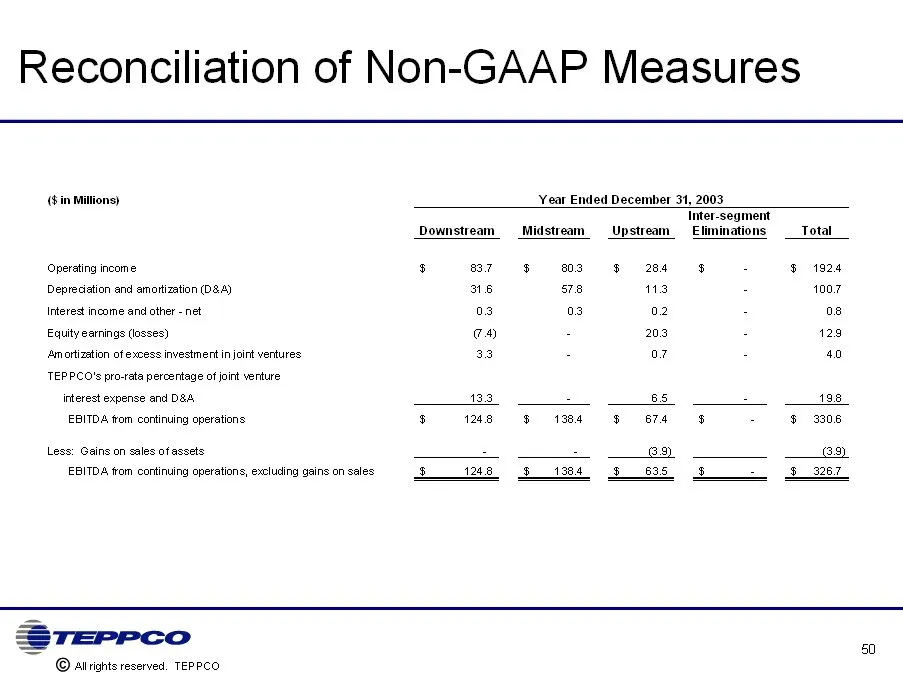
Slide 50: Reconciliation of Non-GAAP Measures
Reconciliation of Non-GAAP Measures
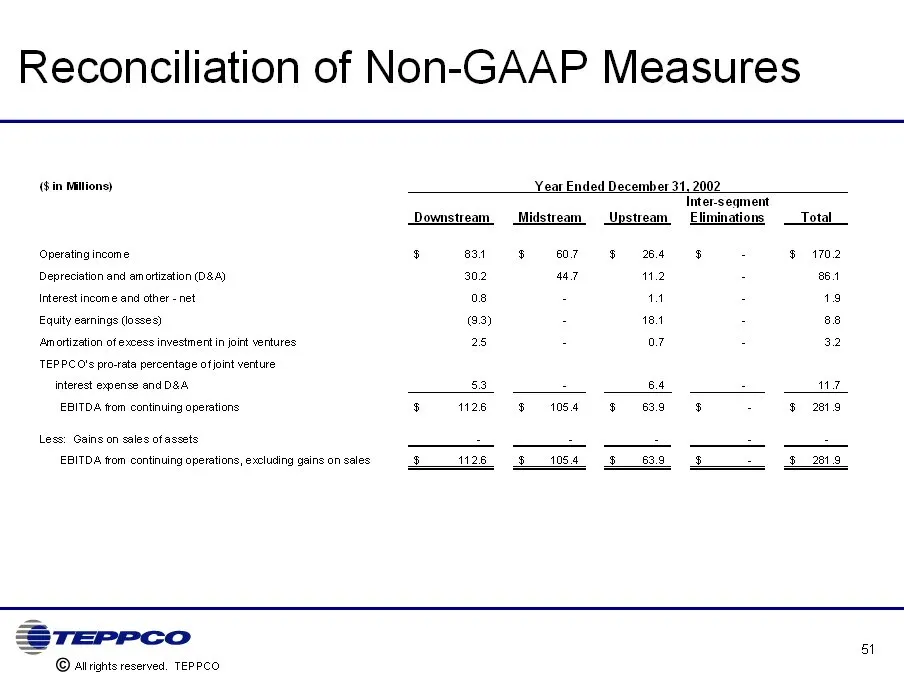
Slide 51: Reconciliation of Non-GAAP Measures
Reconciliation of Non-GAAP Measures
Source: SEC EDGAR · 8-K filed Jun 1, 2007
More decks from Teppco Partners LP
 Morgan Stanley MLP Reception (October 2009)26 slides · Oct 7, 2009
 Master Limited Partnerships Investor Conference (September 2009)27 slides · Sep 16, 2009
 Wells Fargo Retail Meeting (September 2009)27 slides · Sep 15, 2009
 Barclays Capital CEO Energy/Power Conference 200929 slides · Sep 9, 2009
 Merger or Acquisition (August 2009)29 slides · Aug 26, 2009
 Investor Day (March 2007)75 slides · Mar 29, 2007