Pharsight — Investor Presentation (January 2007)
41 slides from Pharsight's investor presentation, Jan 26, 2007
Slide 1: Pharsight Investor Update, Third Quarter Fiscal 2007
Exhibit 99.1 Pharsight Investor 3rd December Shawn President, Will Confidential CFO Quarter Frederick O’Connor Presentation Corporation Chairman 31, Fiscal ©2006 Pharsight 2007 andUpdate CEO Corporation
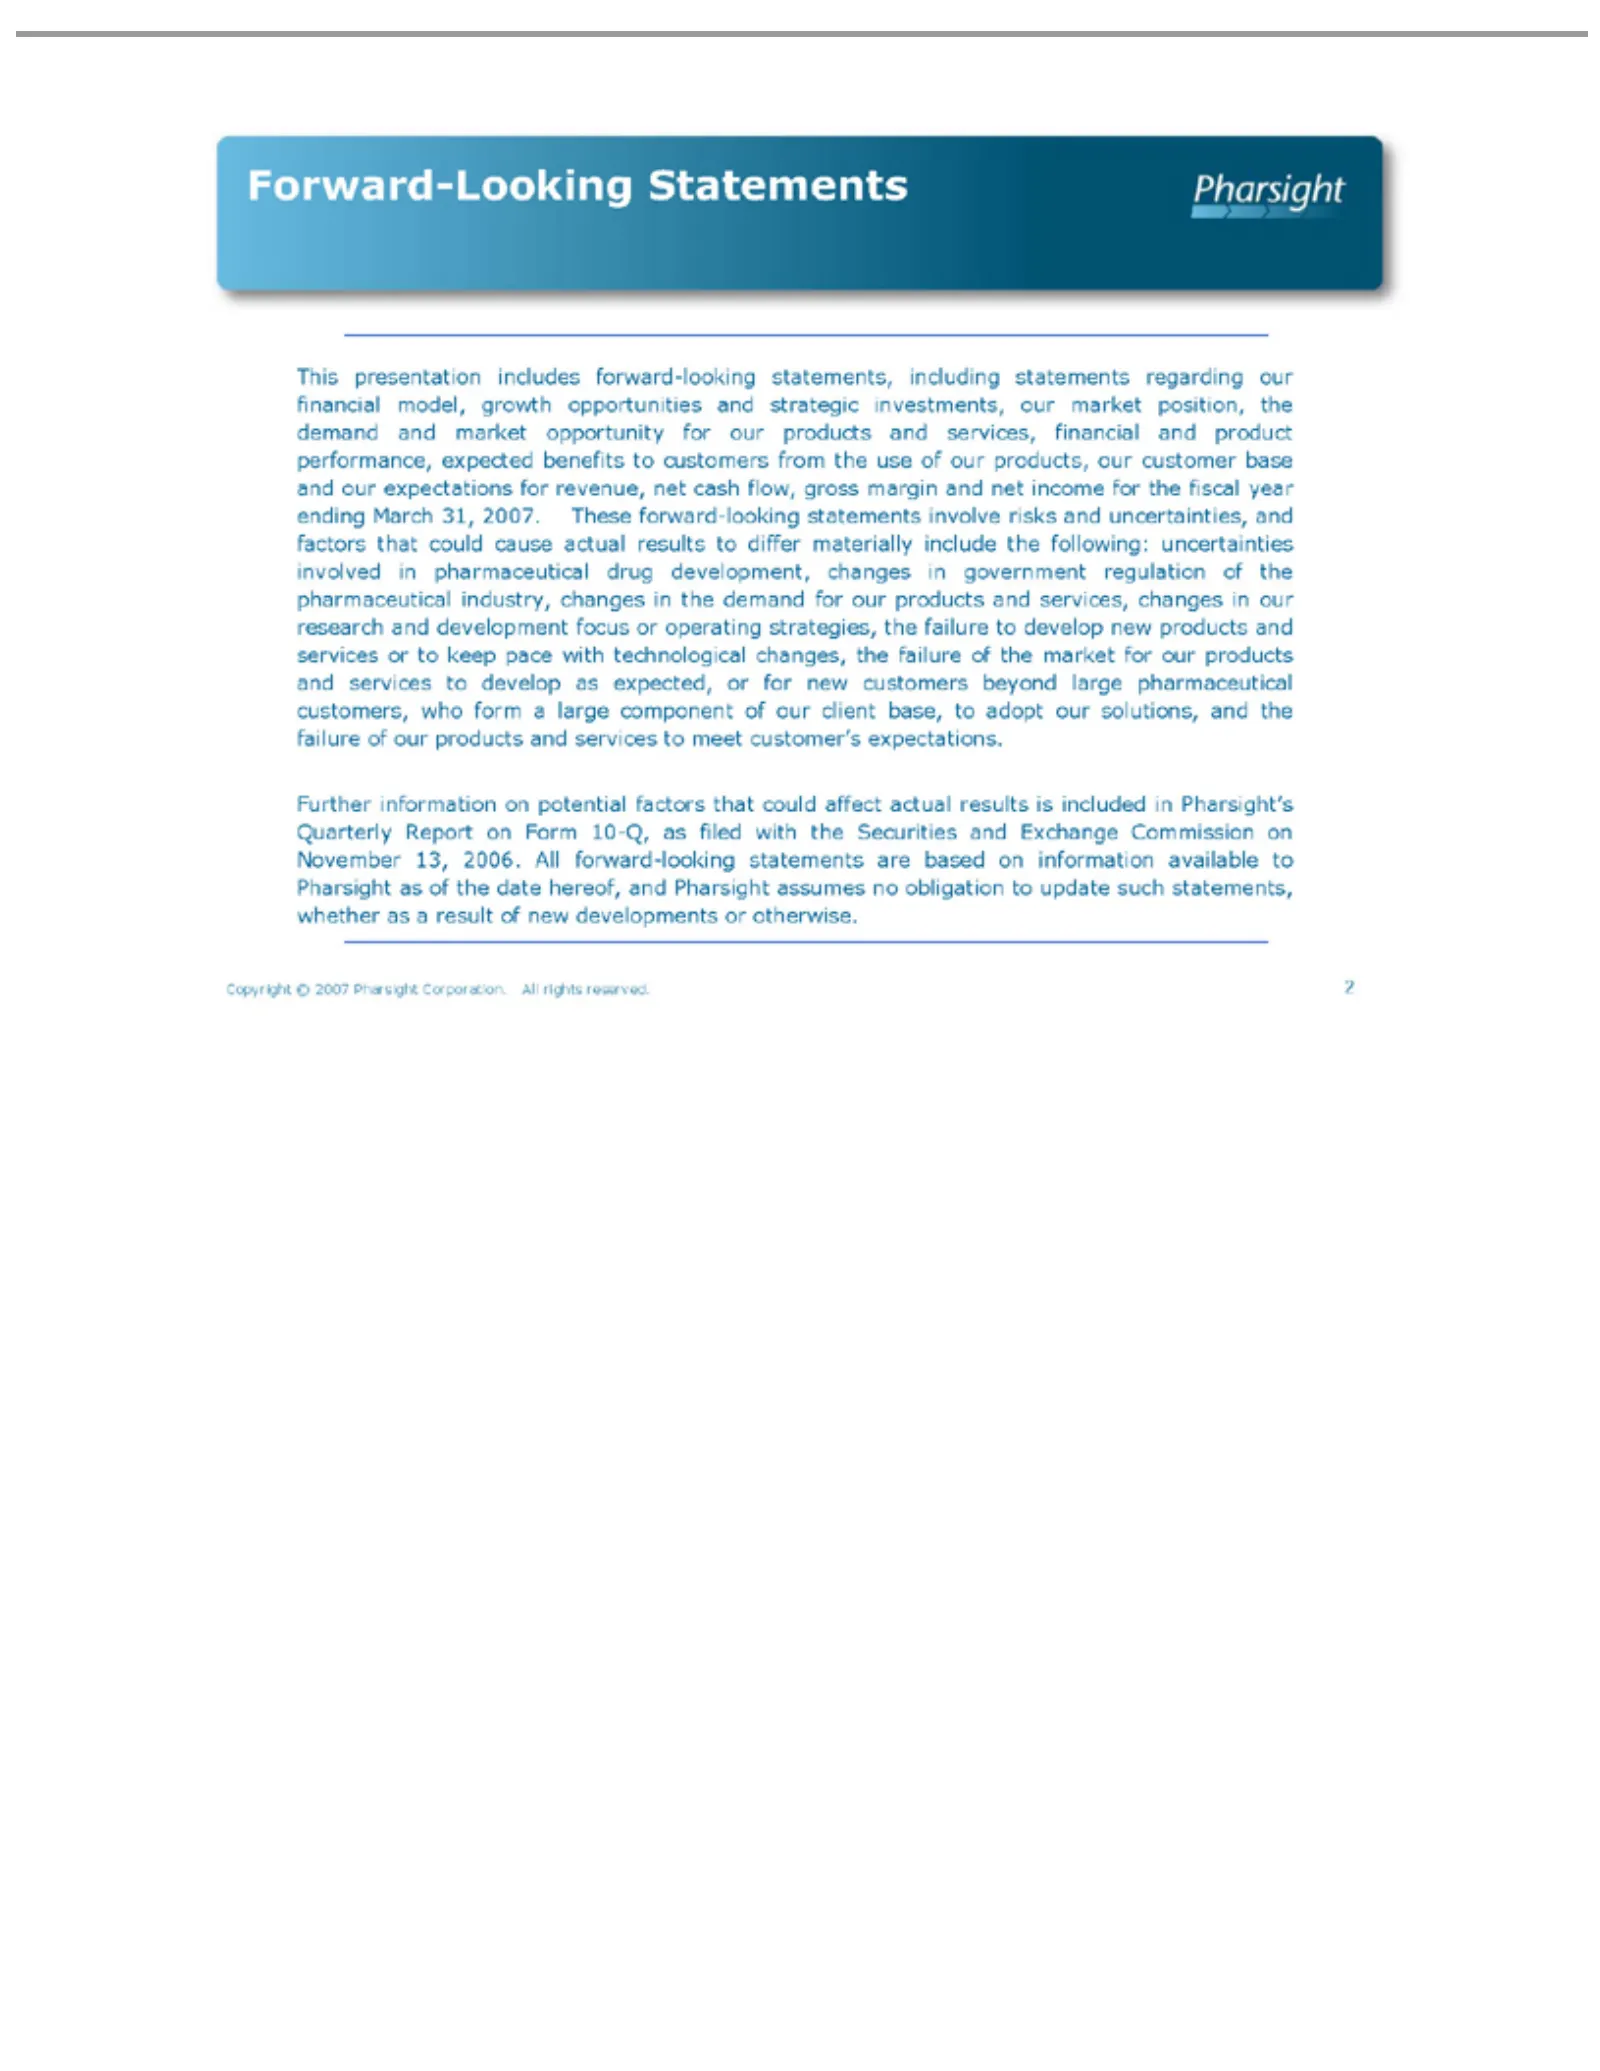
Slide 2: Forward-Looking Statements
Forward-Looking This market net differ products of solutions, Further November result Copyright 2 the cash presentation materially of market opportunity information flow, new and and ©13,2007 services, developments for gross the 2006. include our includes failure Statements Pharsight for margin on A
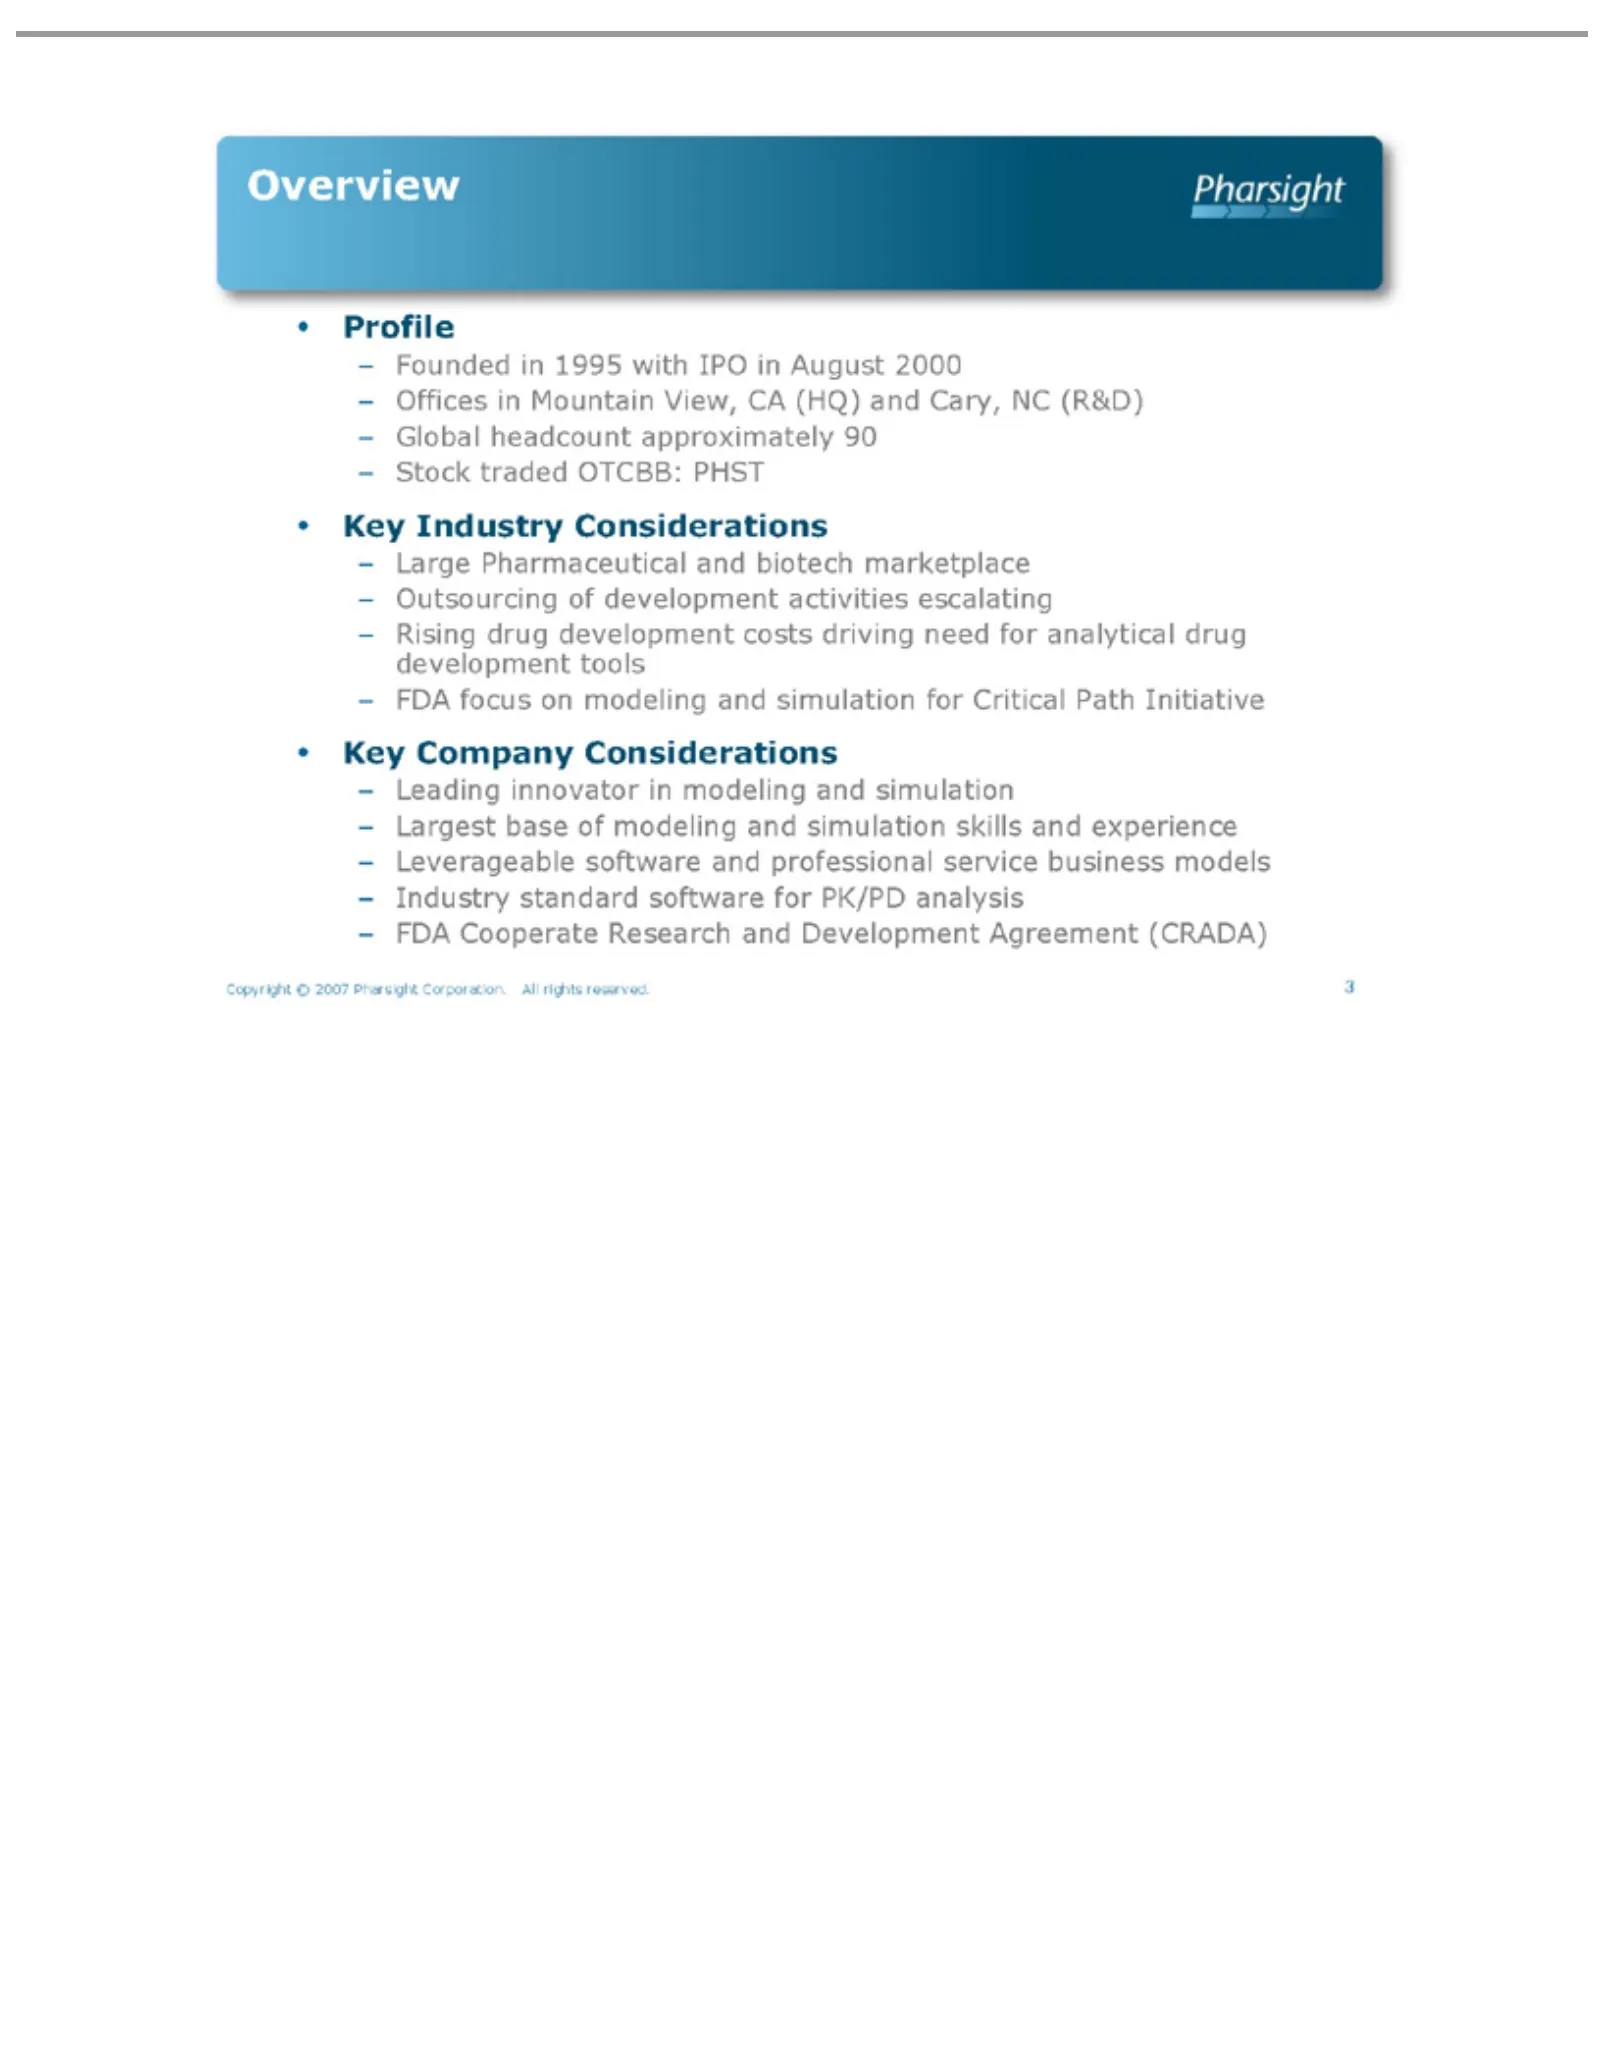
Slide 3: Company Overview and Profile
•Overview – Copyright 3 Profile Key Founded Offices Global Stock Large Outsourcing Rising Leading Largest Leverageable Industry FDA Industry Company focus Cooperate traded Pharmaceutical drug headcount in base innovator © standard inMountain 2007 on 1995 development of OTCBB: Considerations software
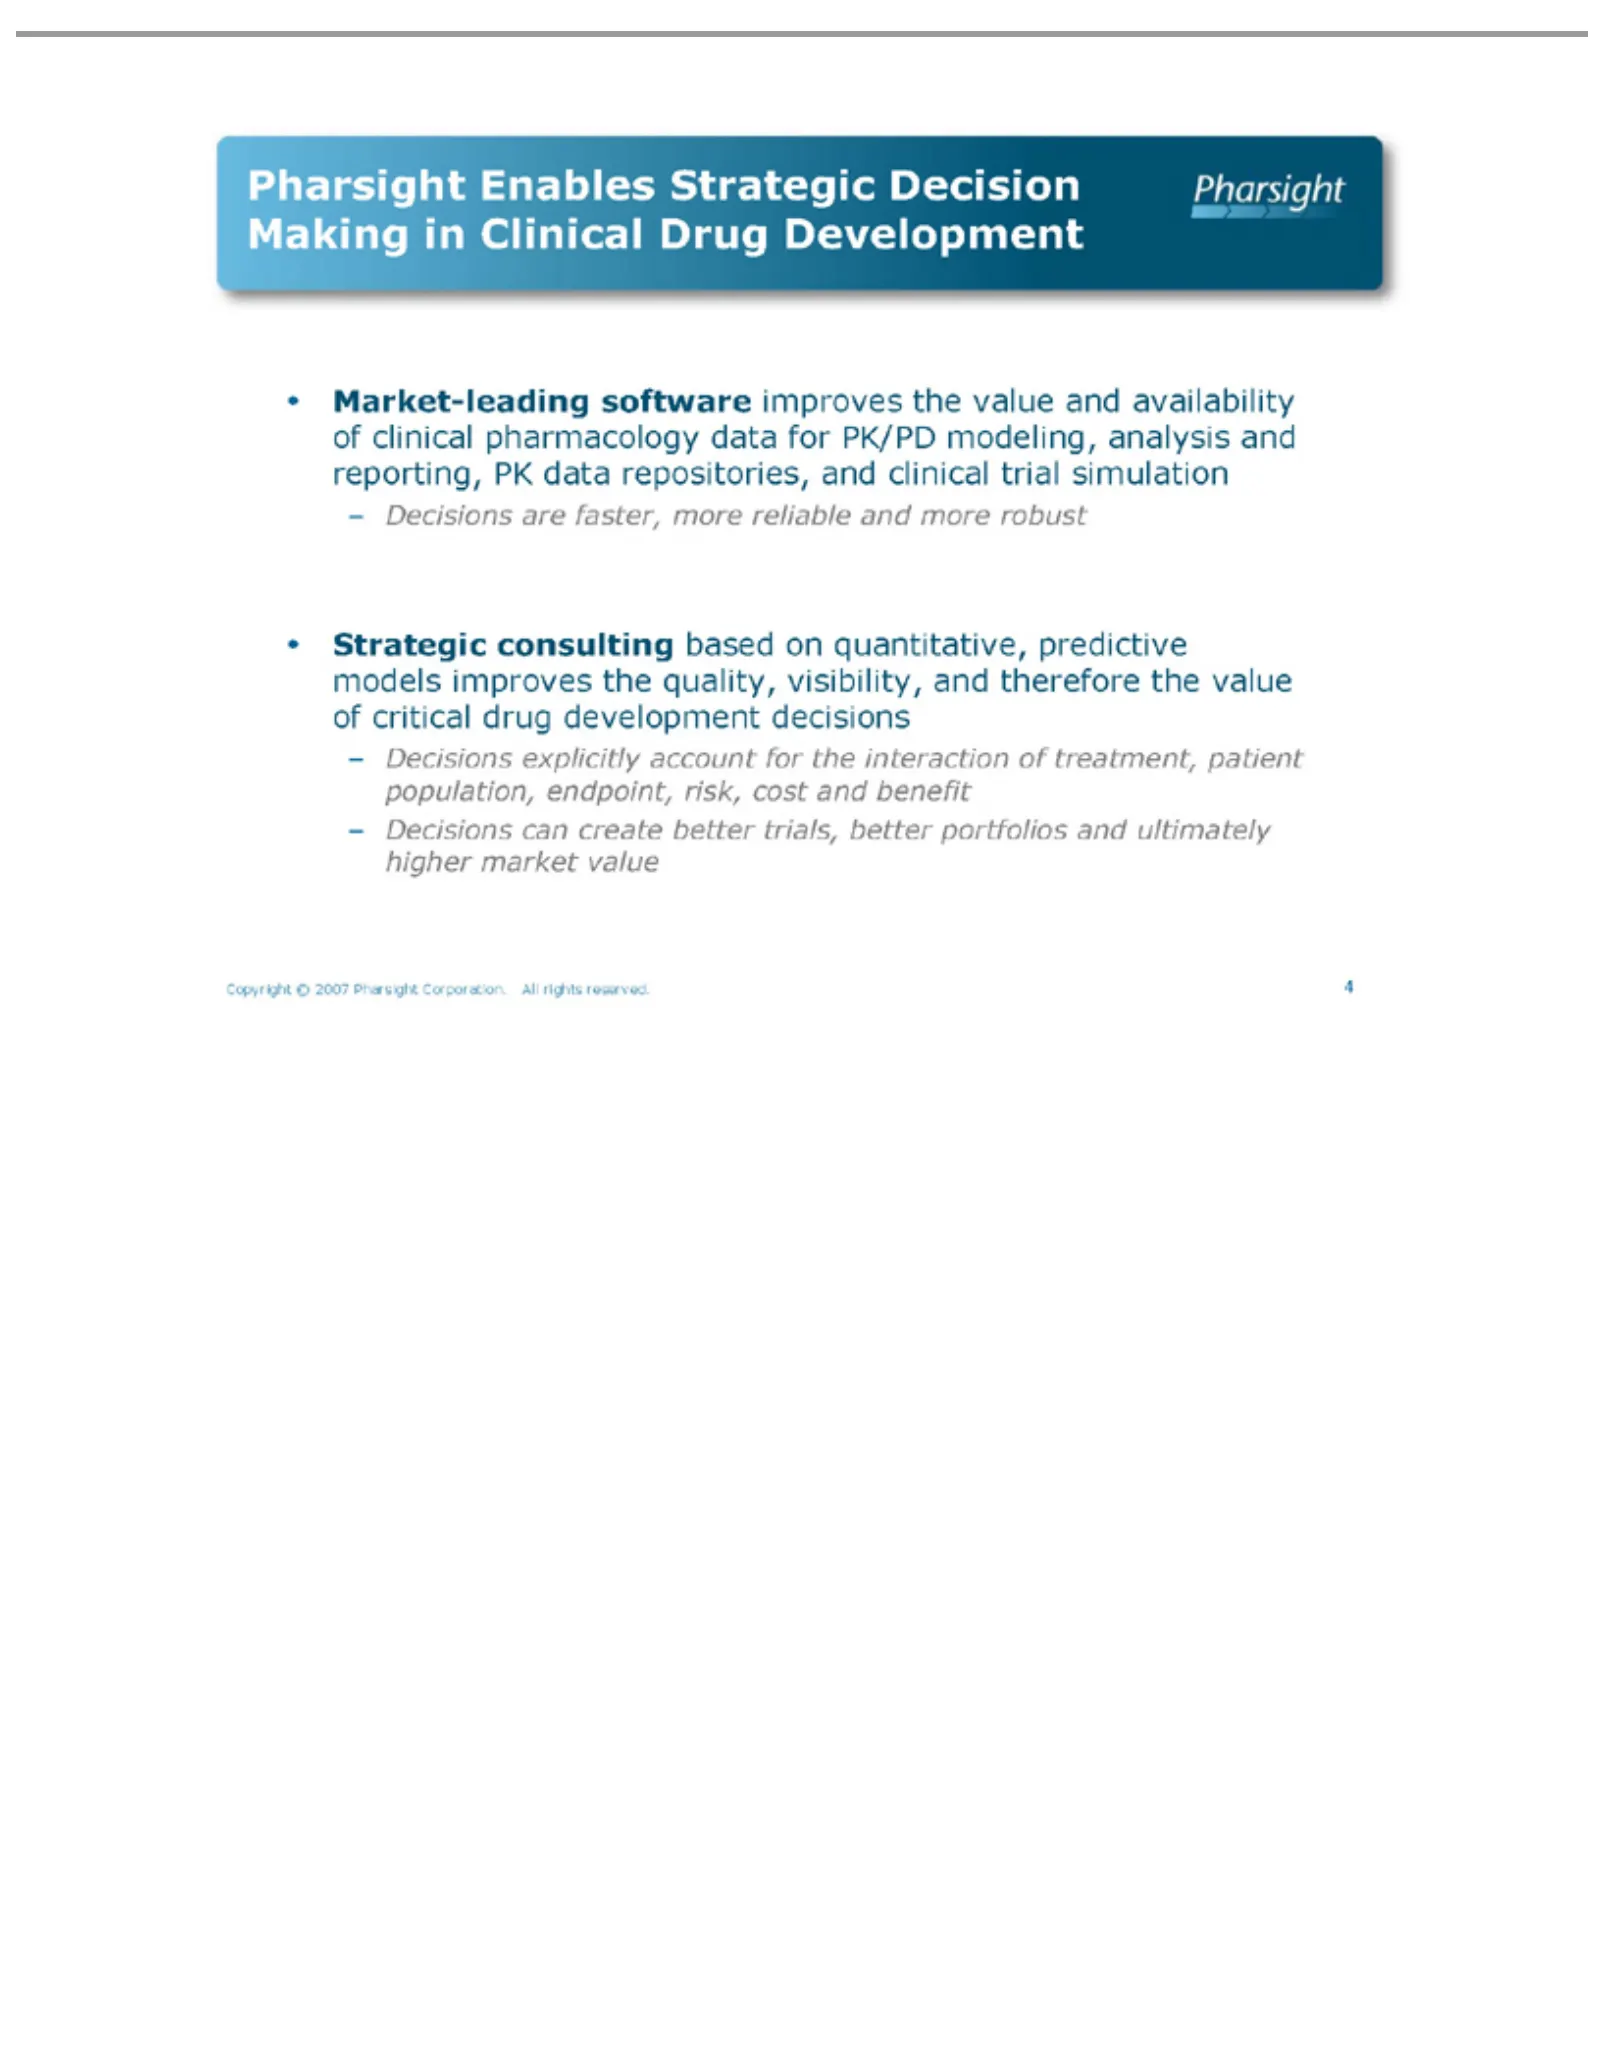
Slide 4: Making Strategic Decisions in Drug Development
Pharsight •Making – Copyright 4 Market-leading Strategic Decisions inEnables © Clinical consulting are explicitly can 2007 faster, create software Strategic Pharsight Drug based account more better Development improves Decision on reliable Corporation. trials, for quantitative, the better and the in
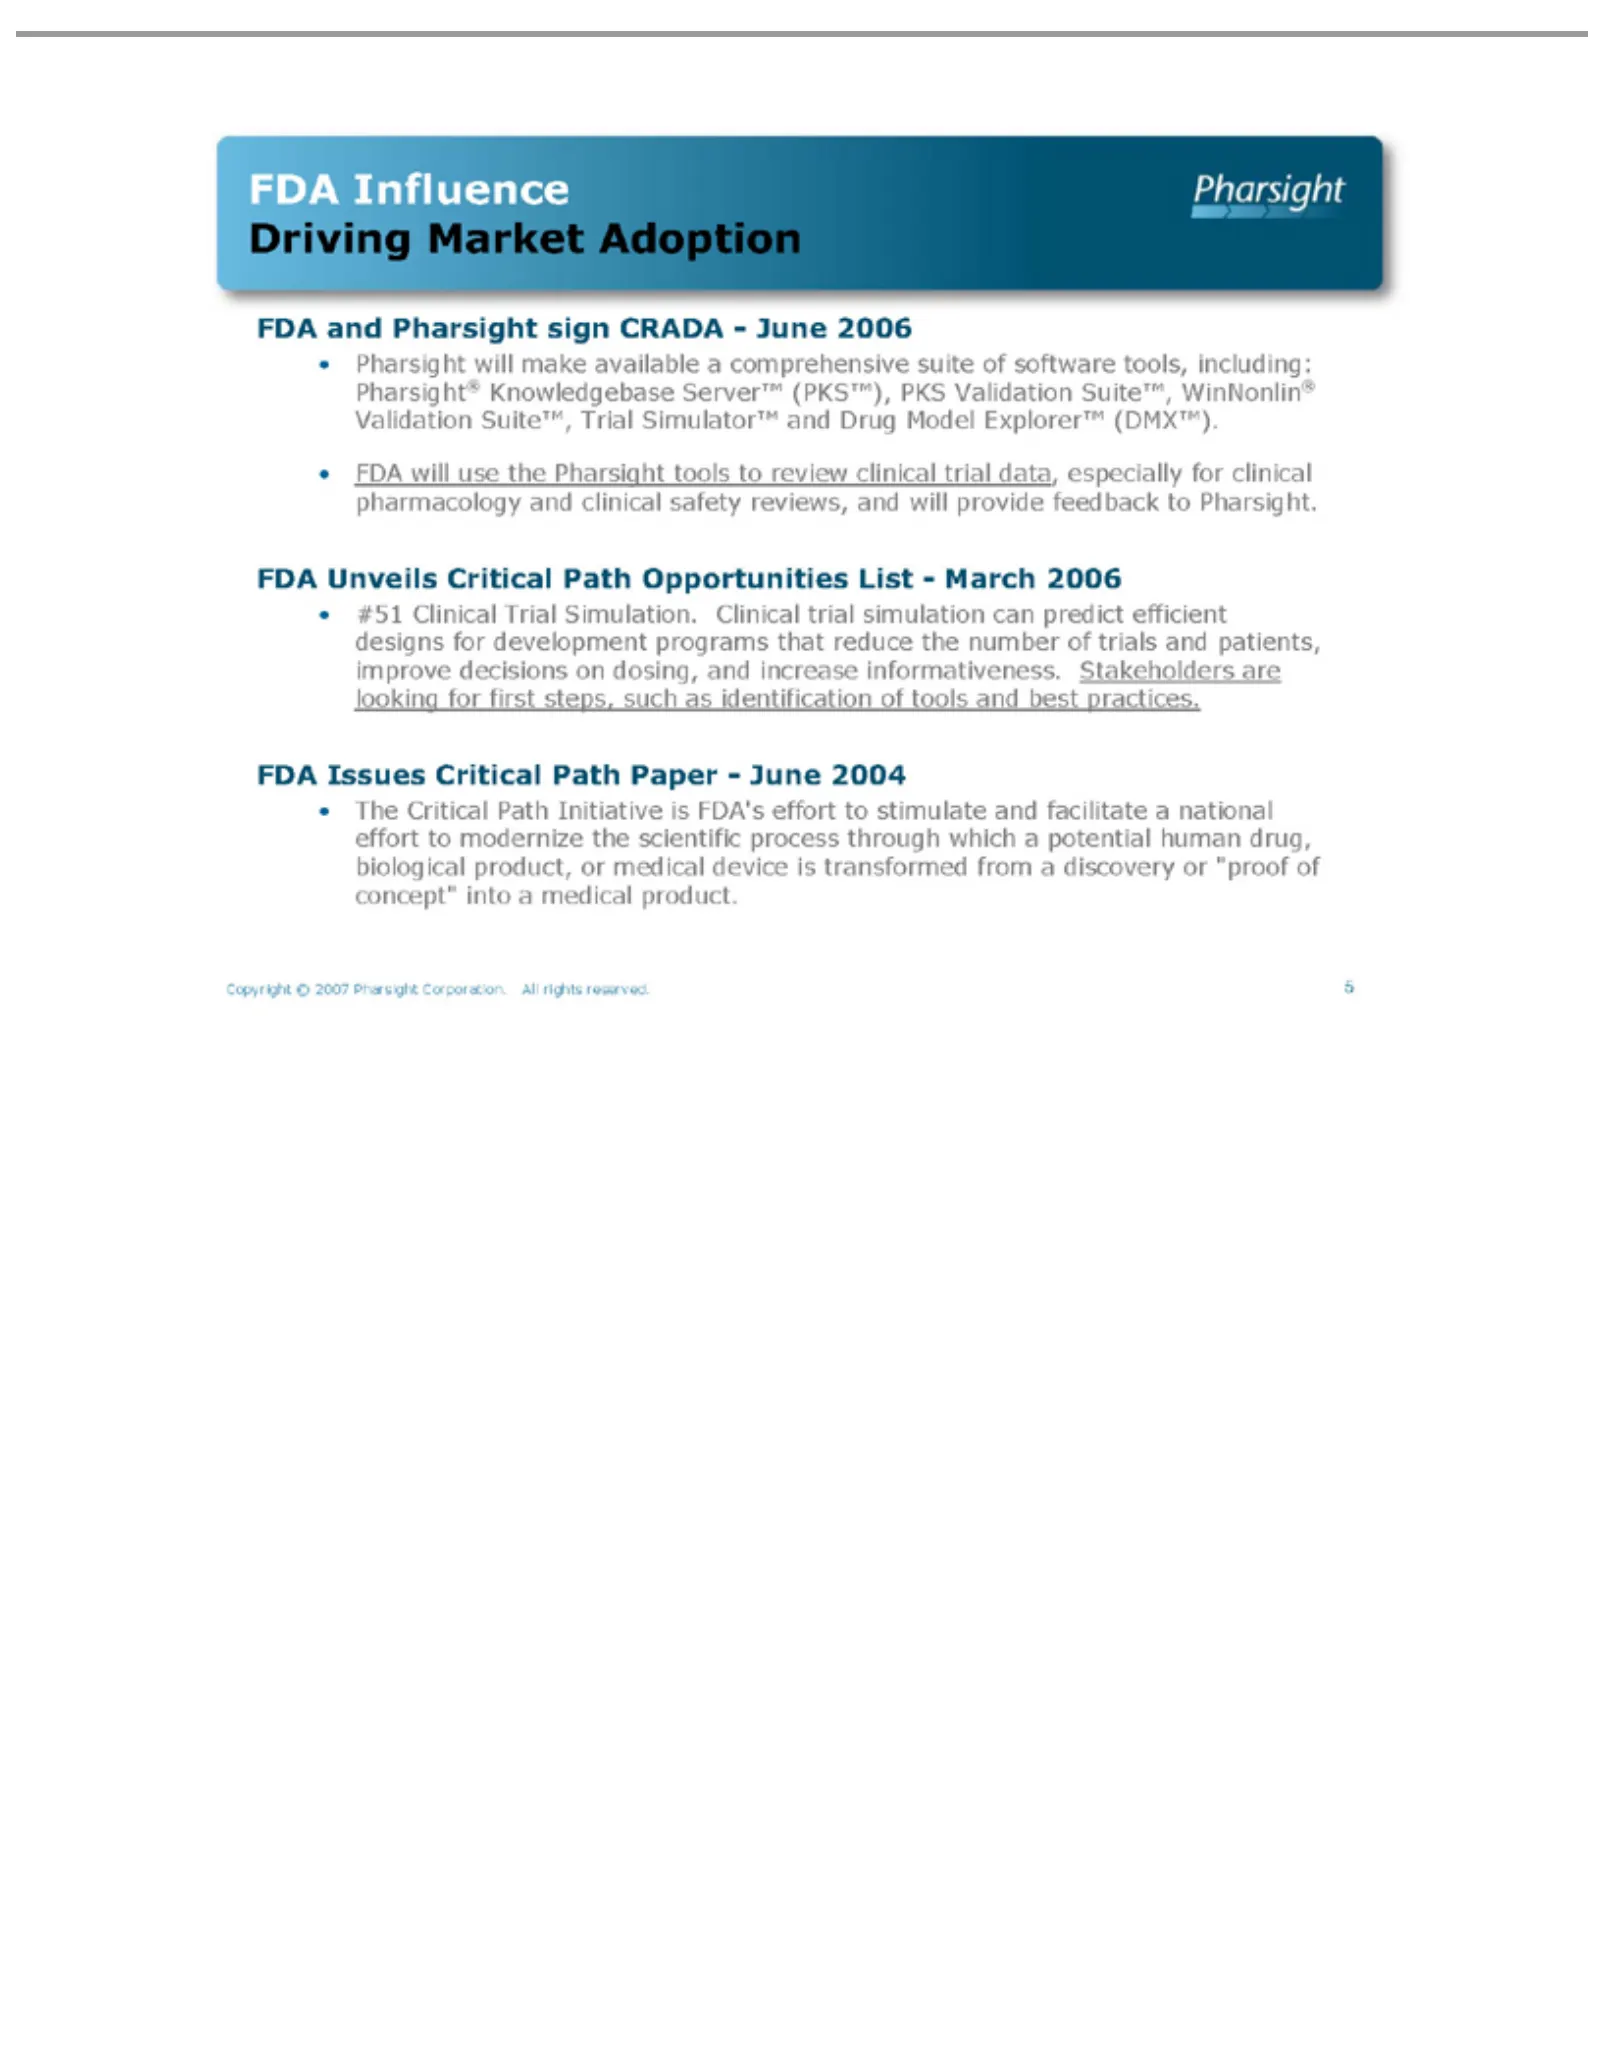
Slide 5: FDA Critical Path Initiative
Driving Simulator™ informativeness. •FDA is Copyright 5 The Pharsight FDA #51 transformed Influence and Unveils Issues Clinical Critical will Market Pharsight ©use will Critical and 2007 Critical Path Trial from the make Adoption Drug Stakeholders Pharsight Initiative Simulation. sign Path a Path av
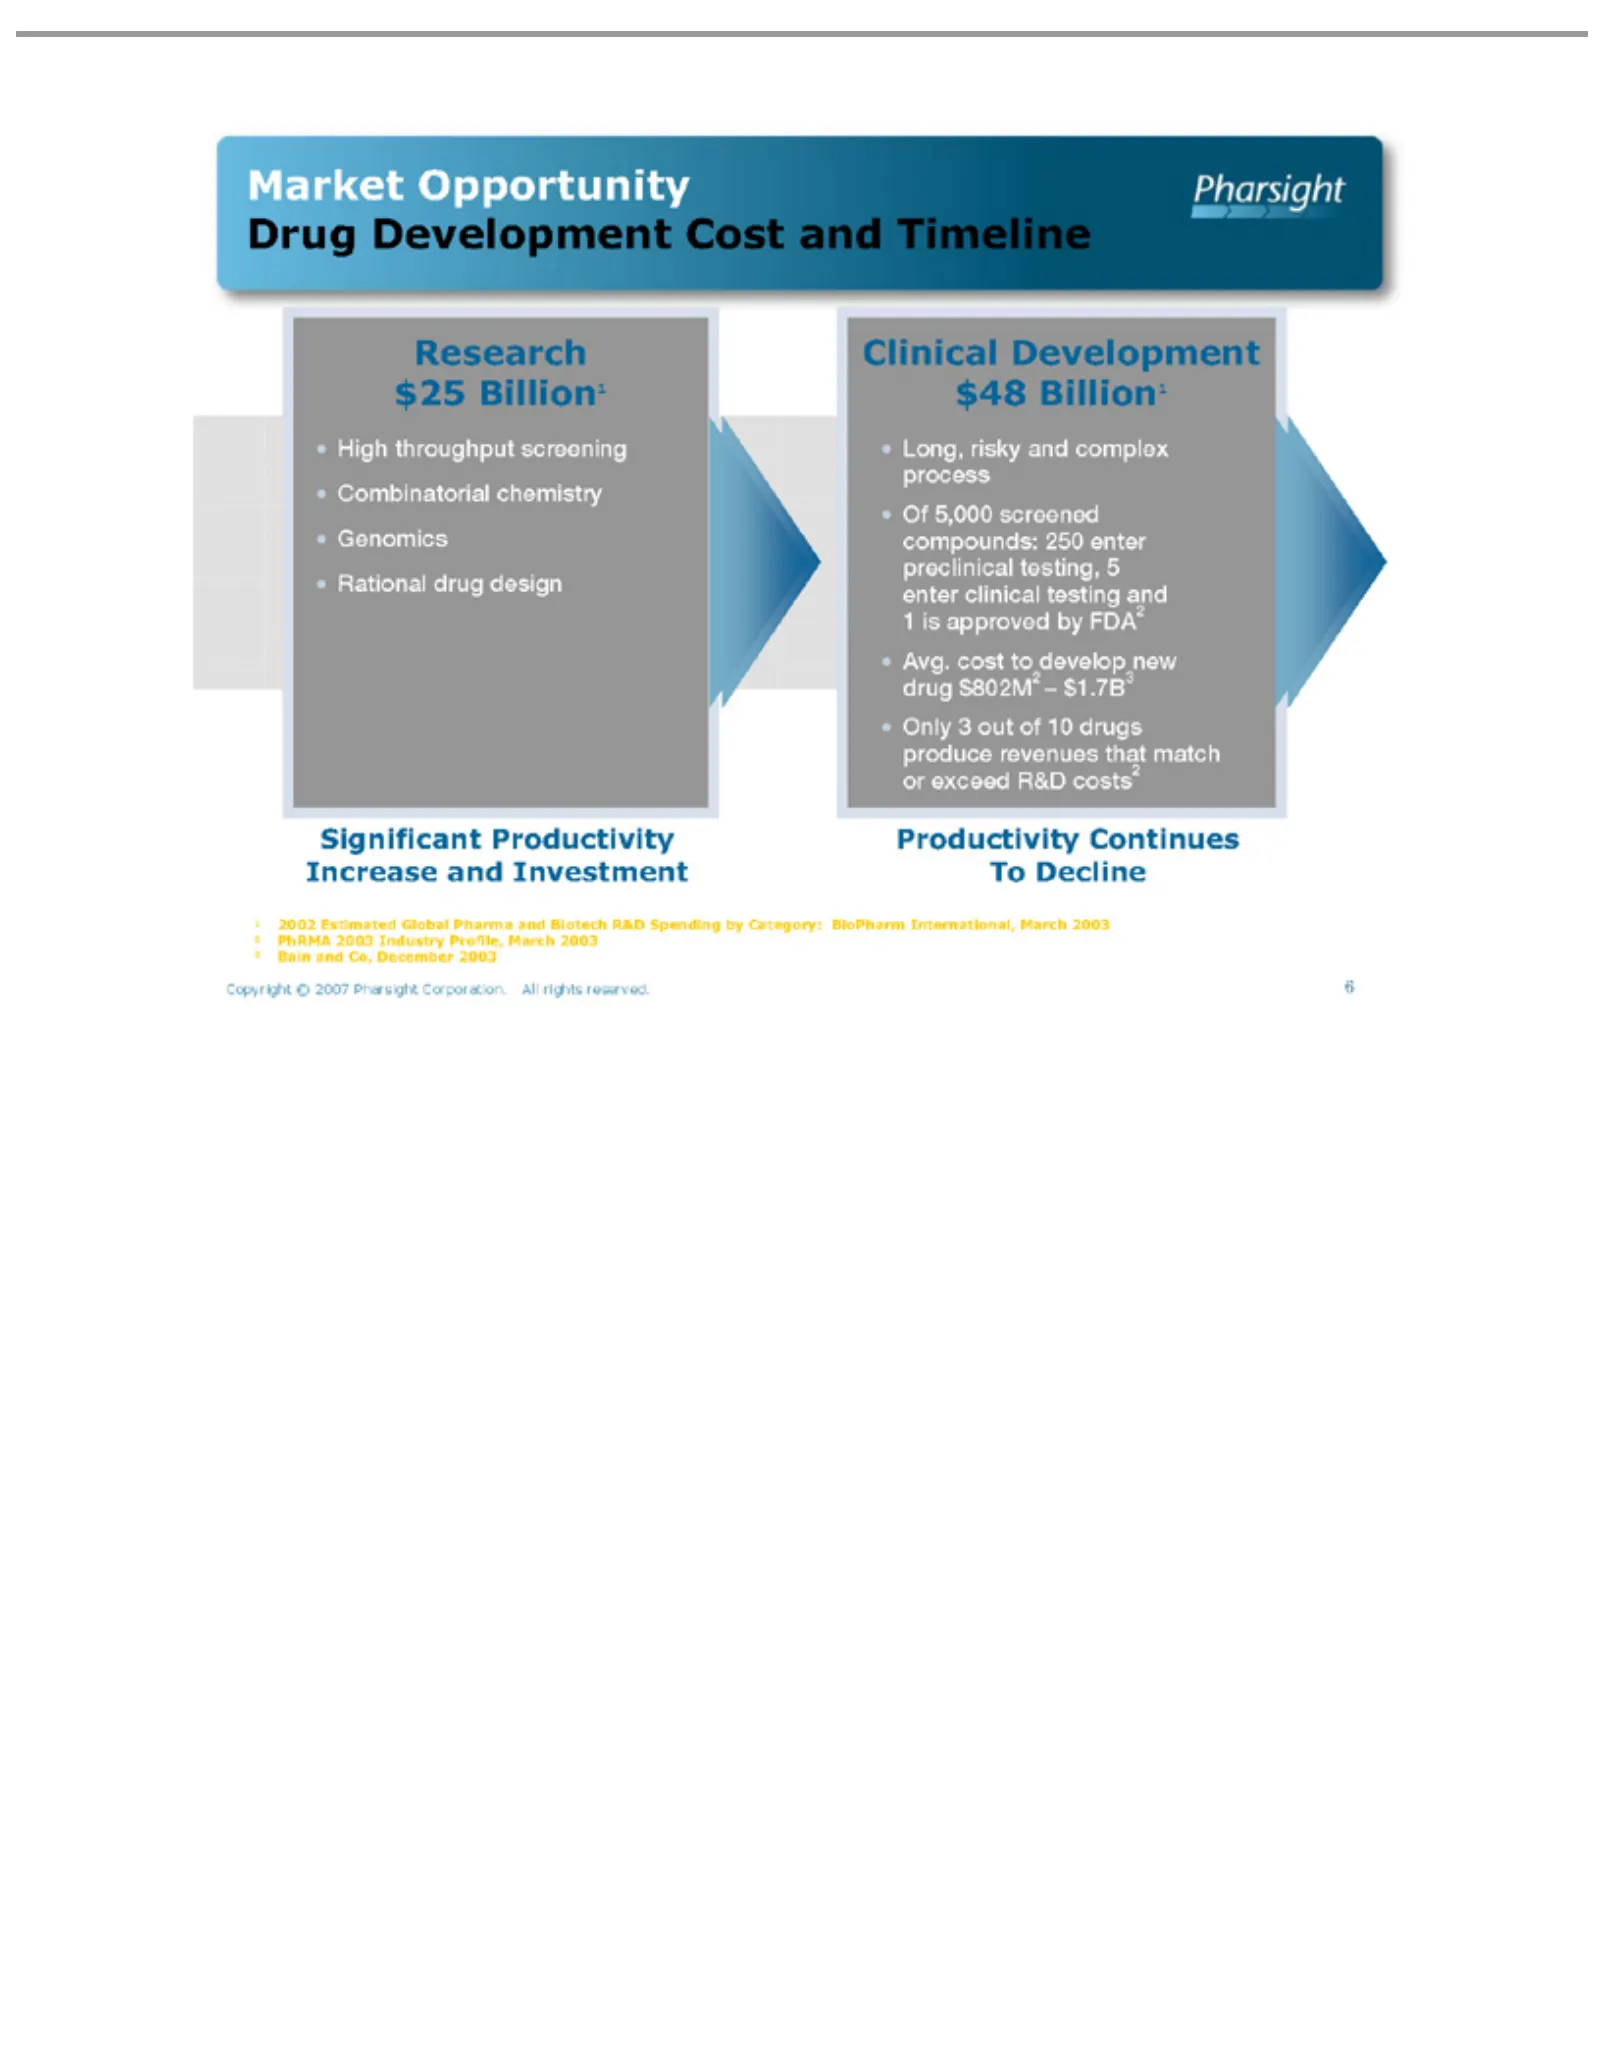
Slide 6: Market Opportunity: Drug Development Productivity
Market Drug Clinical Research $25 •$48 Significant Productivity 1 2 3 6 Avg. High Long, Combinatorial Genomics Of Rational Only Billion1 5,000 Development cost 3throughput Copyright Opportunity 2002 risky Development out drug screened to Productivity PhRMA Bain © of Continues Estimated and develop 1
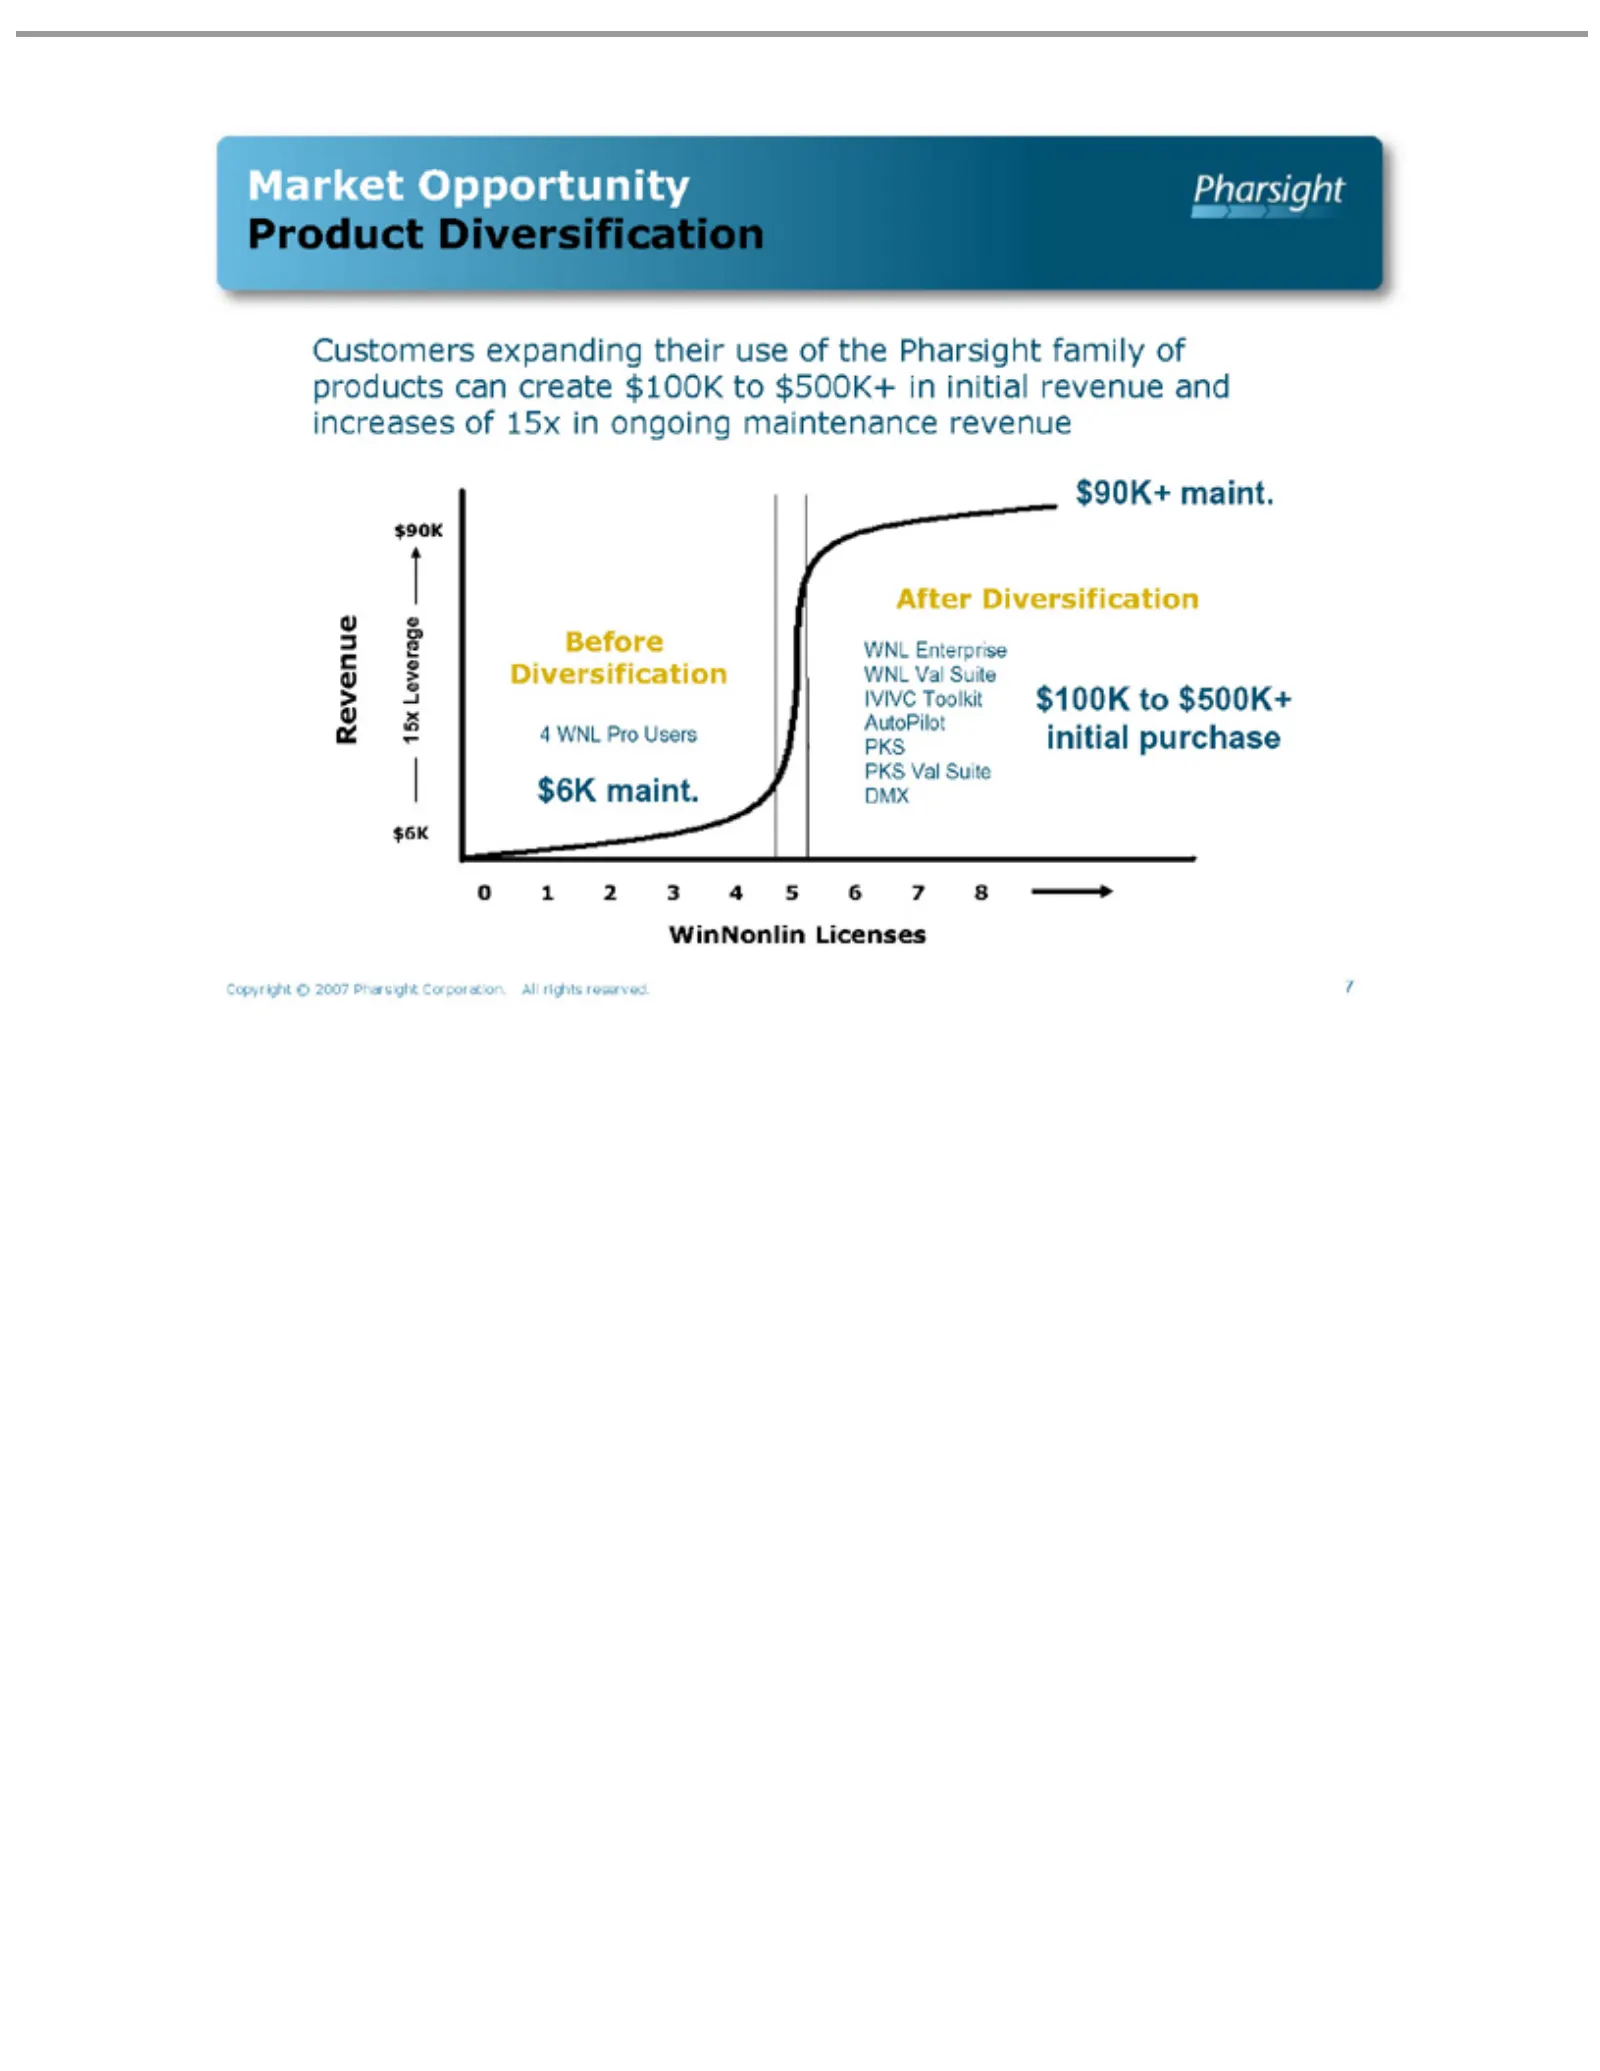
Slide 7: Market Opportunity: Product Diversification
•Market $90K+ After $90K Before Revenue WNL Diversification IVIVC $100K initial AutoPilot 15x 4 PKS DMX 0 $6K WinNonlin Copyright 7 Customers WNL 1 2Leverage maint. Val 3Diversification Val Enterprise purchase to 4Toolkit maint. Opportunity Pro Suite 5$500K+ Suite © 6Licenses Users expanding 72007 8
Slide 8: Software Products
Software Products Confidential © Pharsight Corporation
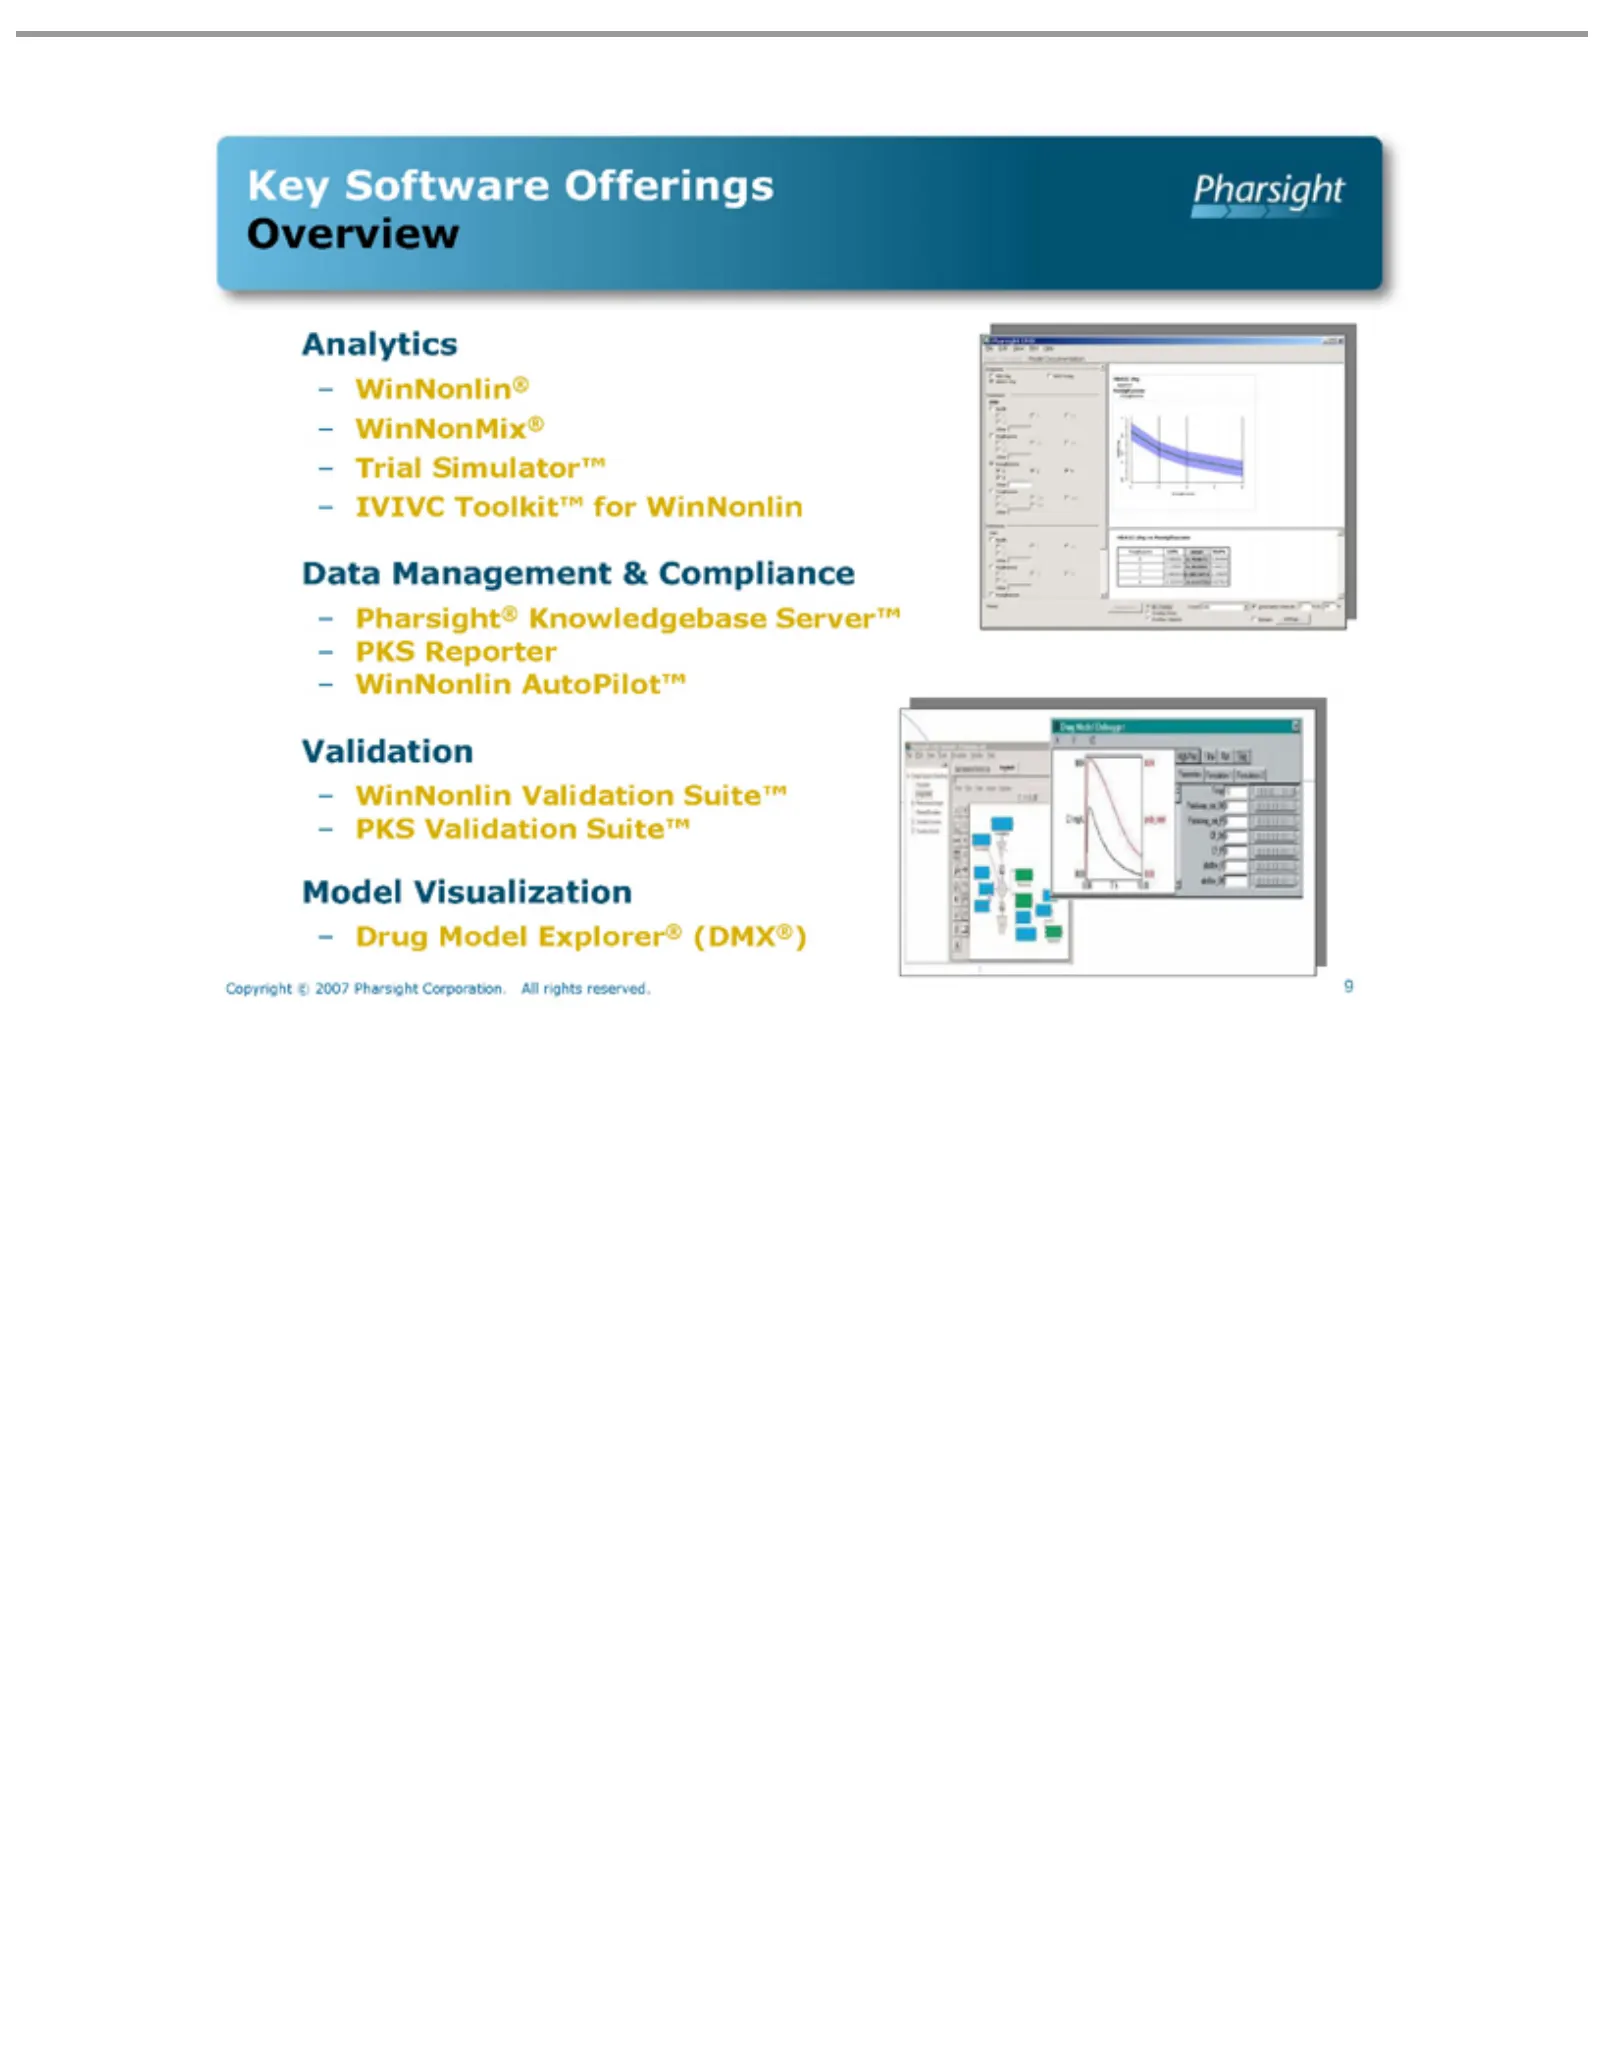
Slide 9: Key Analytics Software Offerings Overview
Key Analytics Overview Data Validation Model – Copyright 9 WinNonlin® WinNonMix® Trial WinNonlin IVIVC Pharsight® PKS Drug Software Management Validation Reporter Visualization Simulator™ Model Toolkit™ © 2007 AutoPilot™ Validation Knowledgebase Offerings Explorer® Suite™ Pharsight &forCompliance Wi
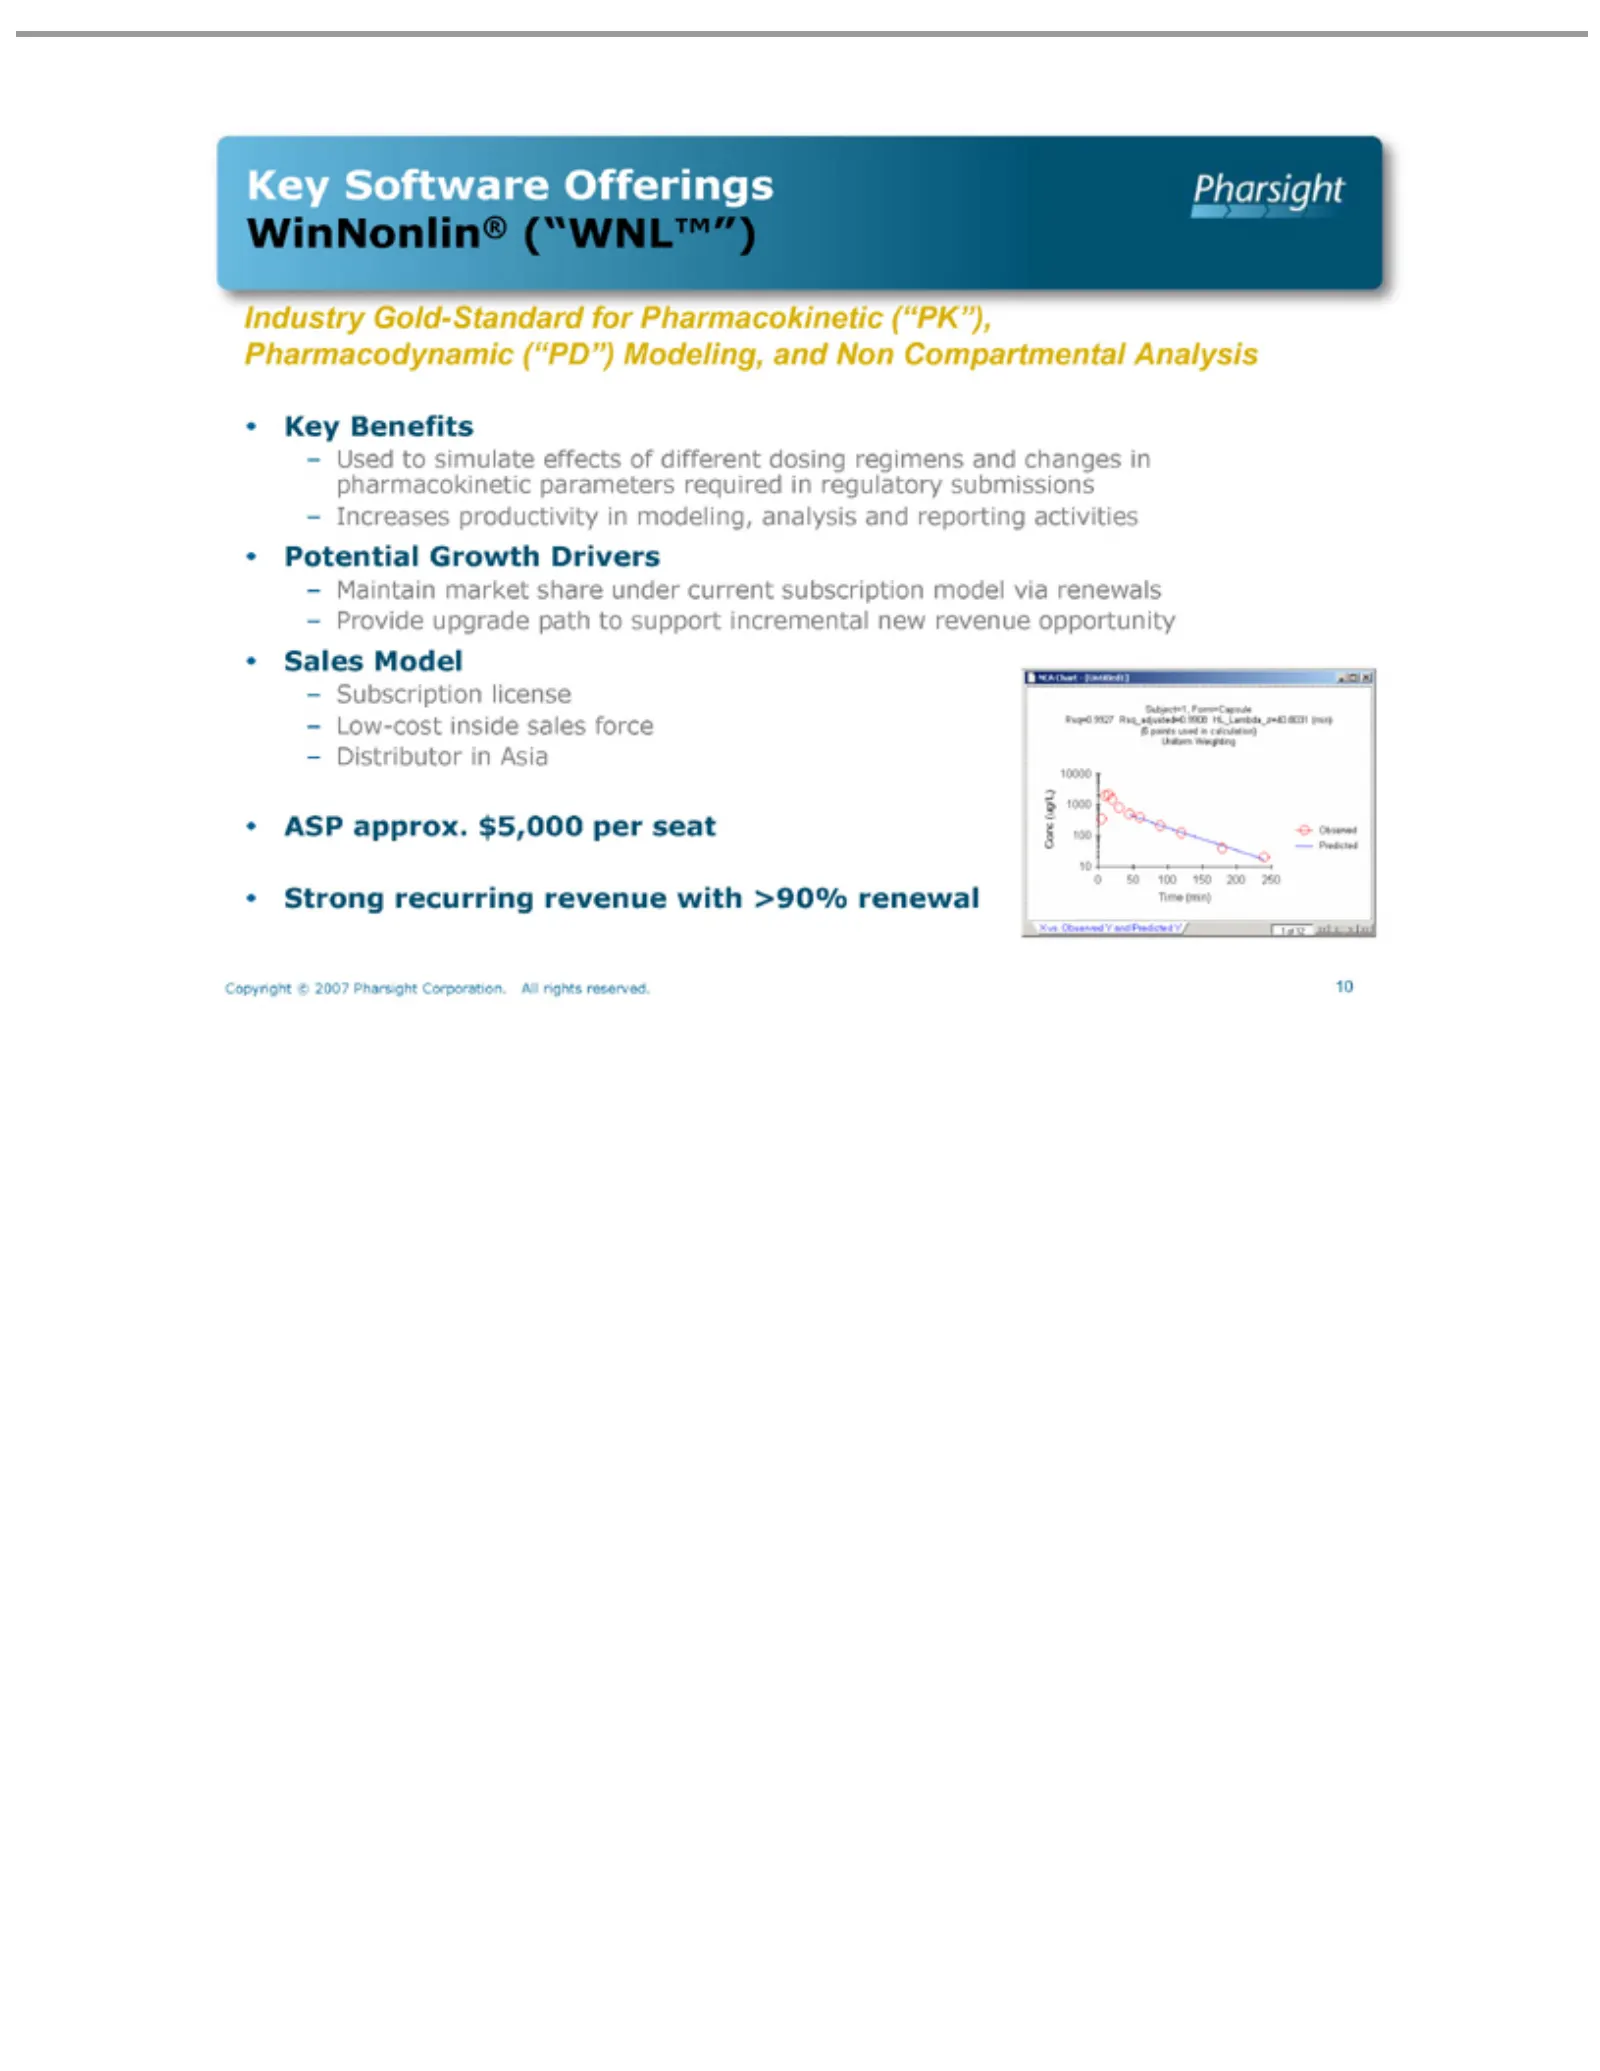
Slide 10: Key Software Offerings: WinNonlin
Key WinNonlin® Industry Pharmacodynamic •– Copyright 10ASP Key Potential Sales Strong Used Increases Maintain Provide Subscription Low-cost Distributor Software Benefits approx. Model torecurring Gold-Standard simulate upgrade © Growth market productivity inside 2007 in (“WNL™”) Offerings $5,000 lic
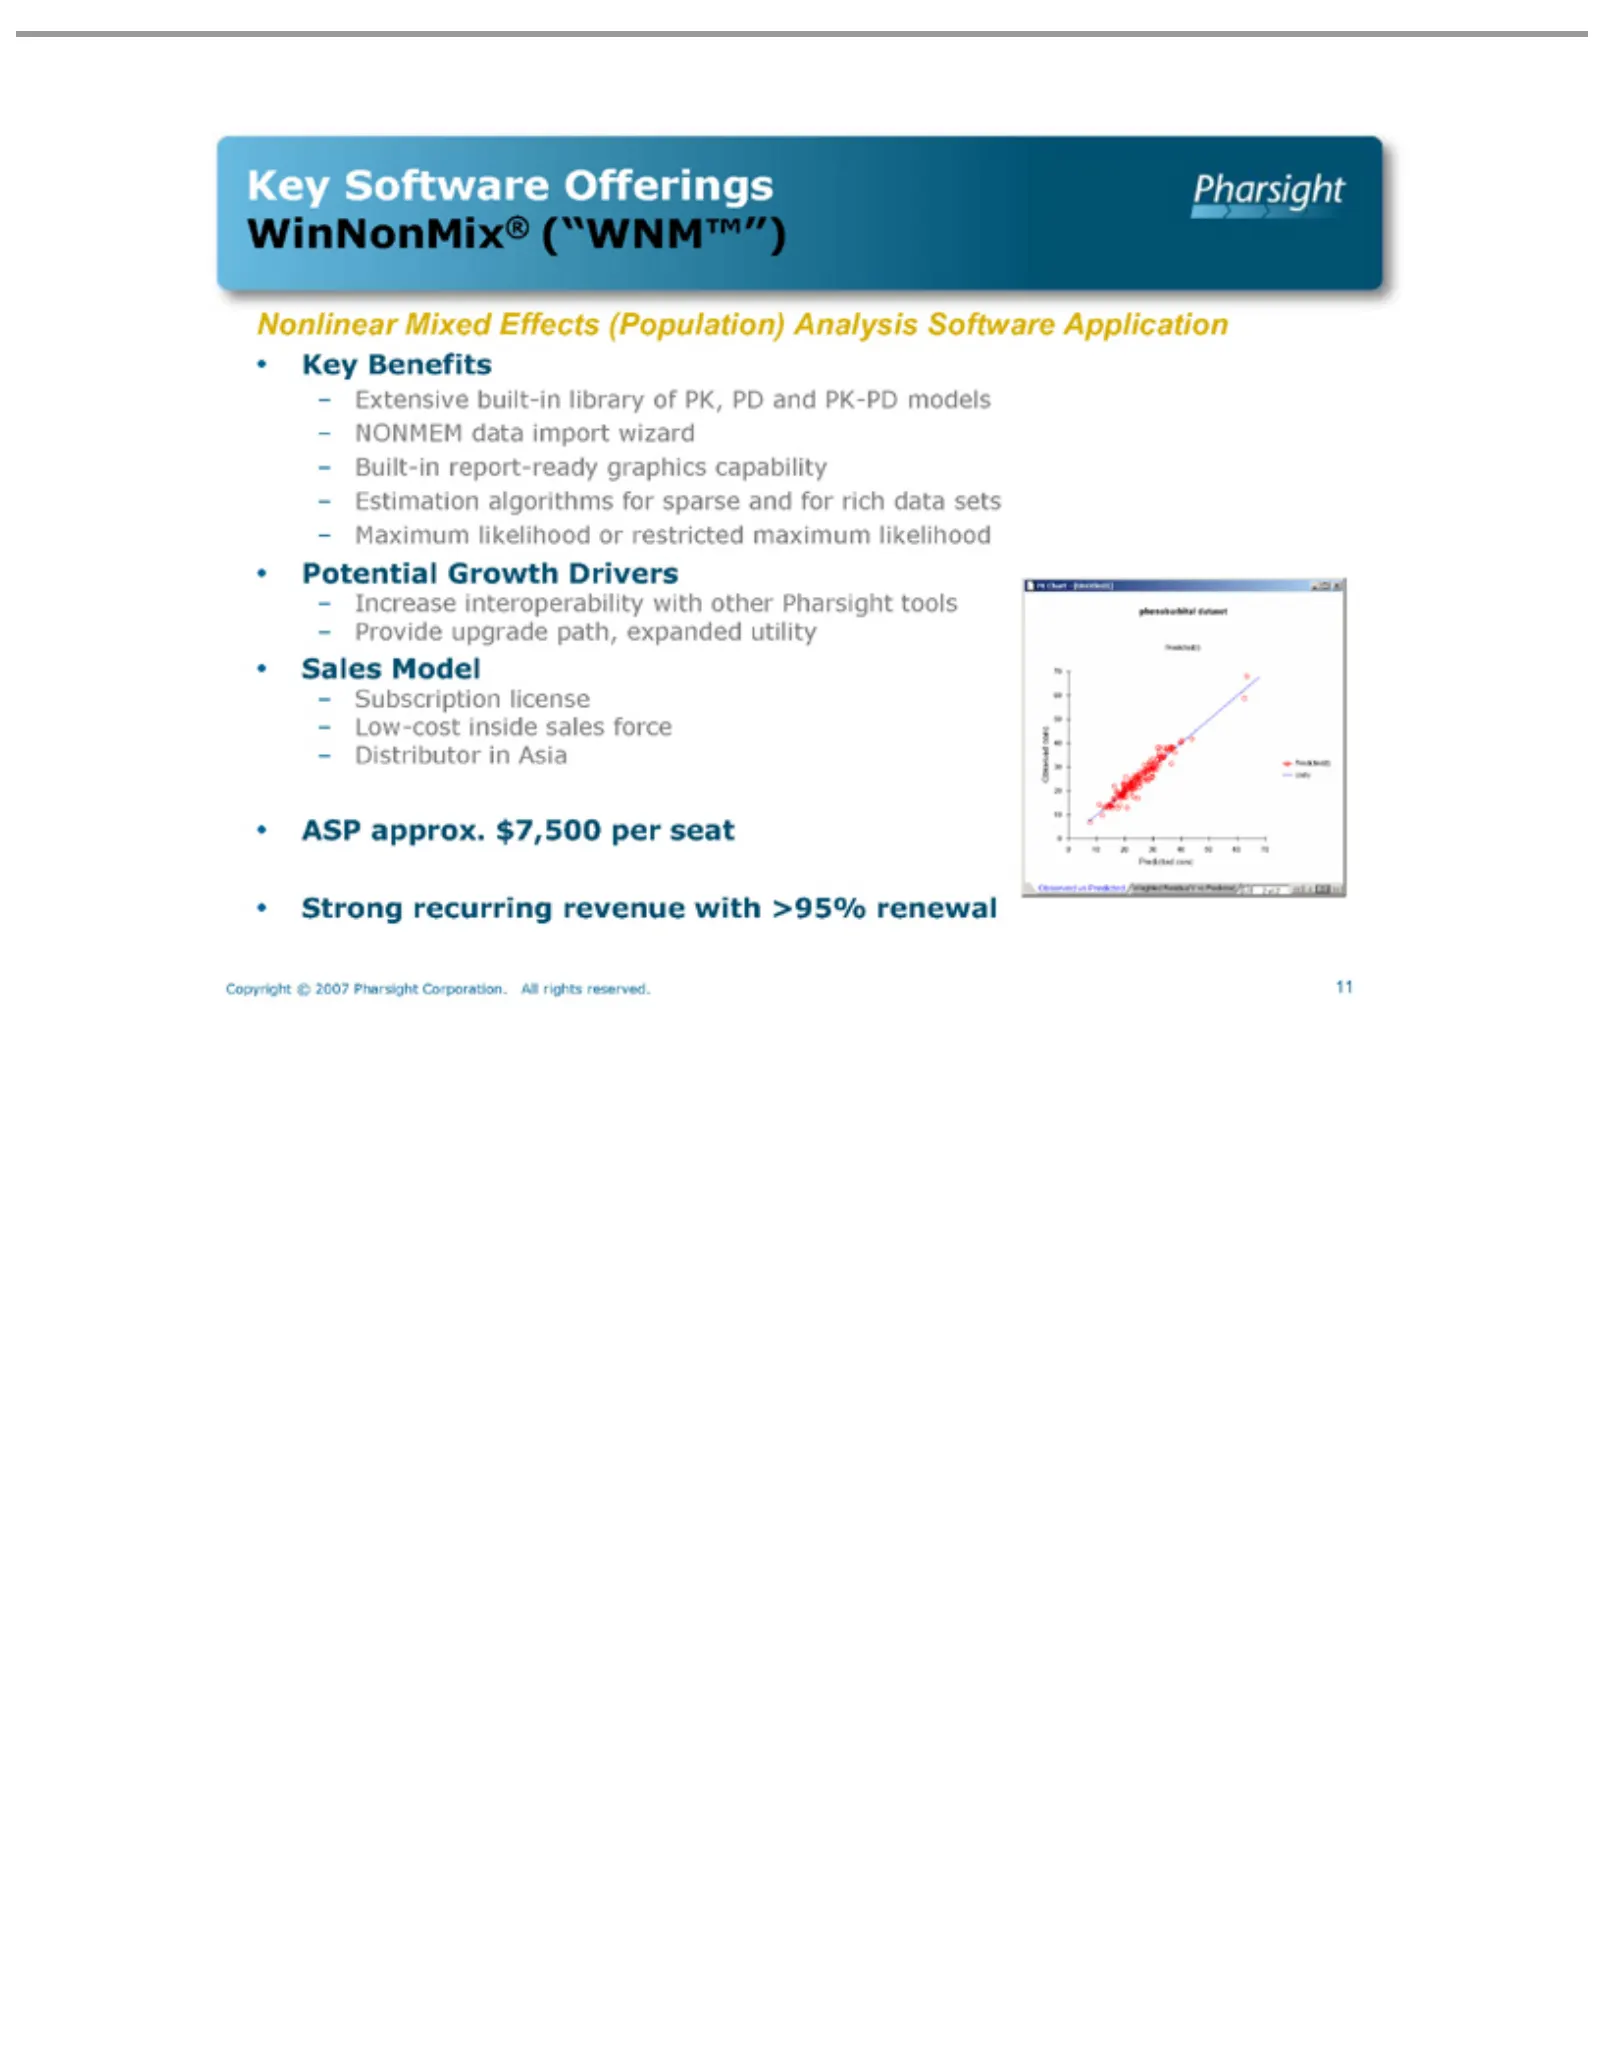
Slide 11: Key Software Offerings: WinNonMix
Key WinNonMix® Nonlinear •– Copyright 11ASP Key Potential Sales Strong Extensive NONMEM Built-in Estimation Maximum Increase Provide Subscription Low-cost Distributor Software Benefits approx. Model recurring upgrade report-ready Mixed © interoperability Growth inside built-in likelihood 2007 algori
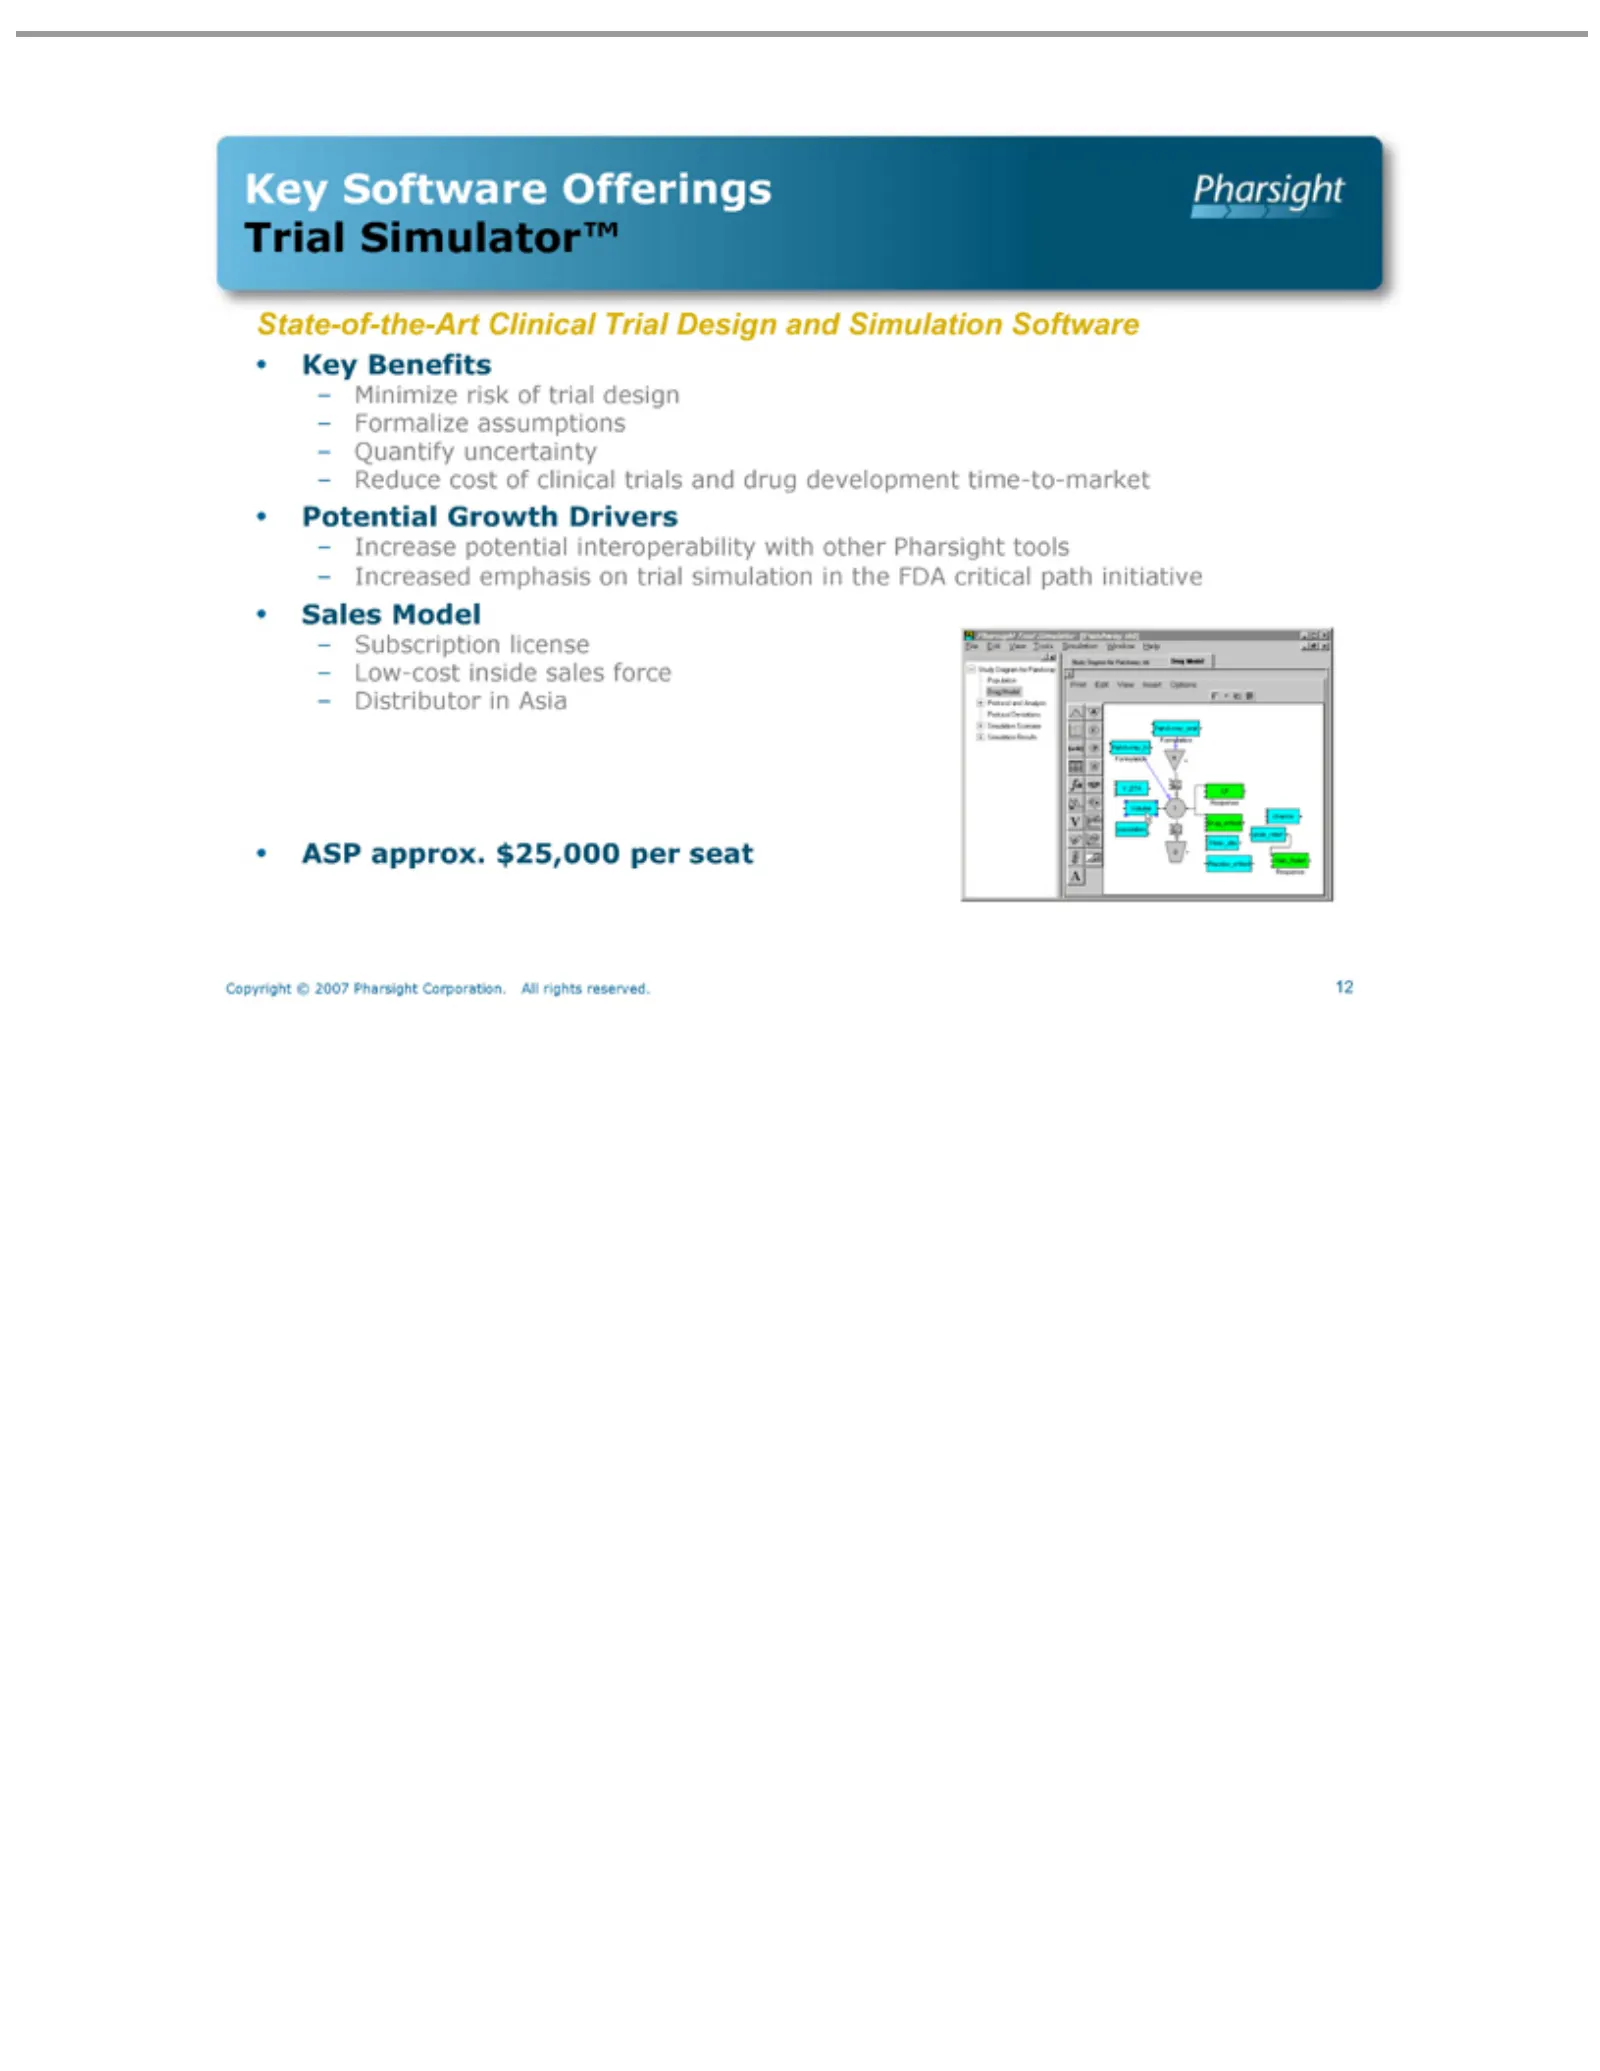
Slide 12: Key Software Offerings: Trial Simulator
Key Trial State-of-the-Art •– Copyright 12ASP Key Potential Sales Minimize Formalize Quantify Reduce Increase Increased Subscription Low-cost Distributor Software Simulator™ Benefits approx. Model cost © potential Growth uncertainty inside emphasis risk assumptions 2007 inOfferings of $25,000 licens
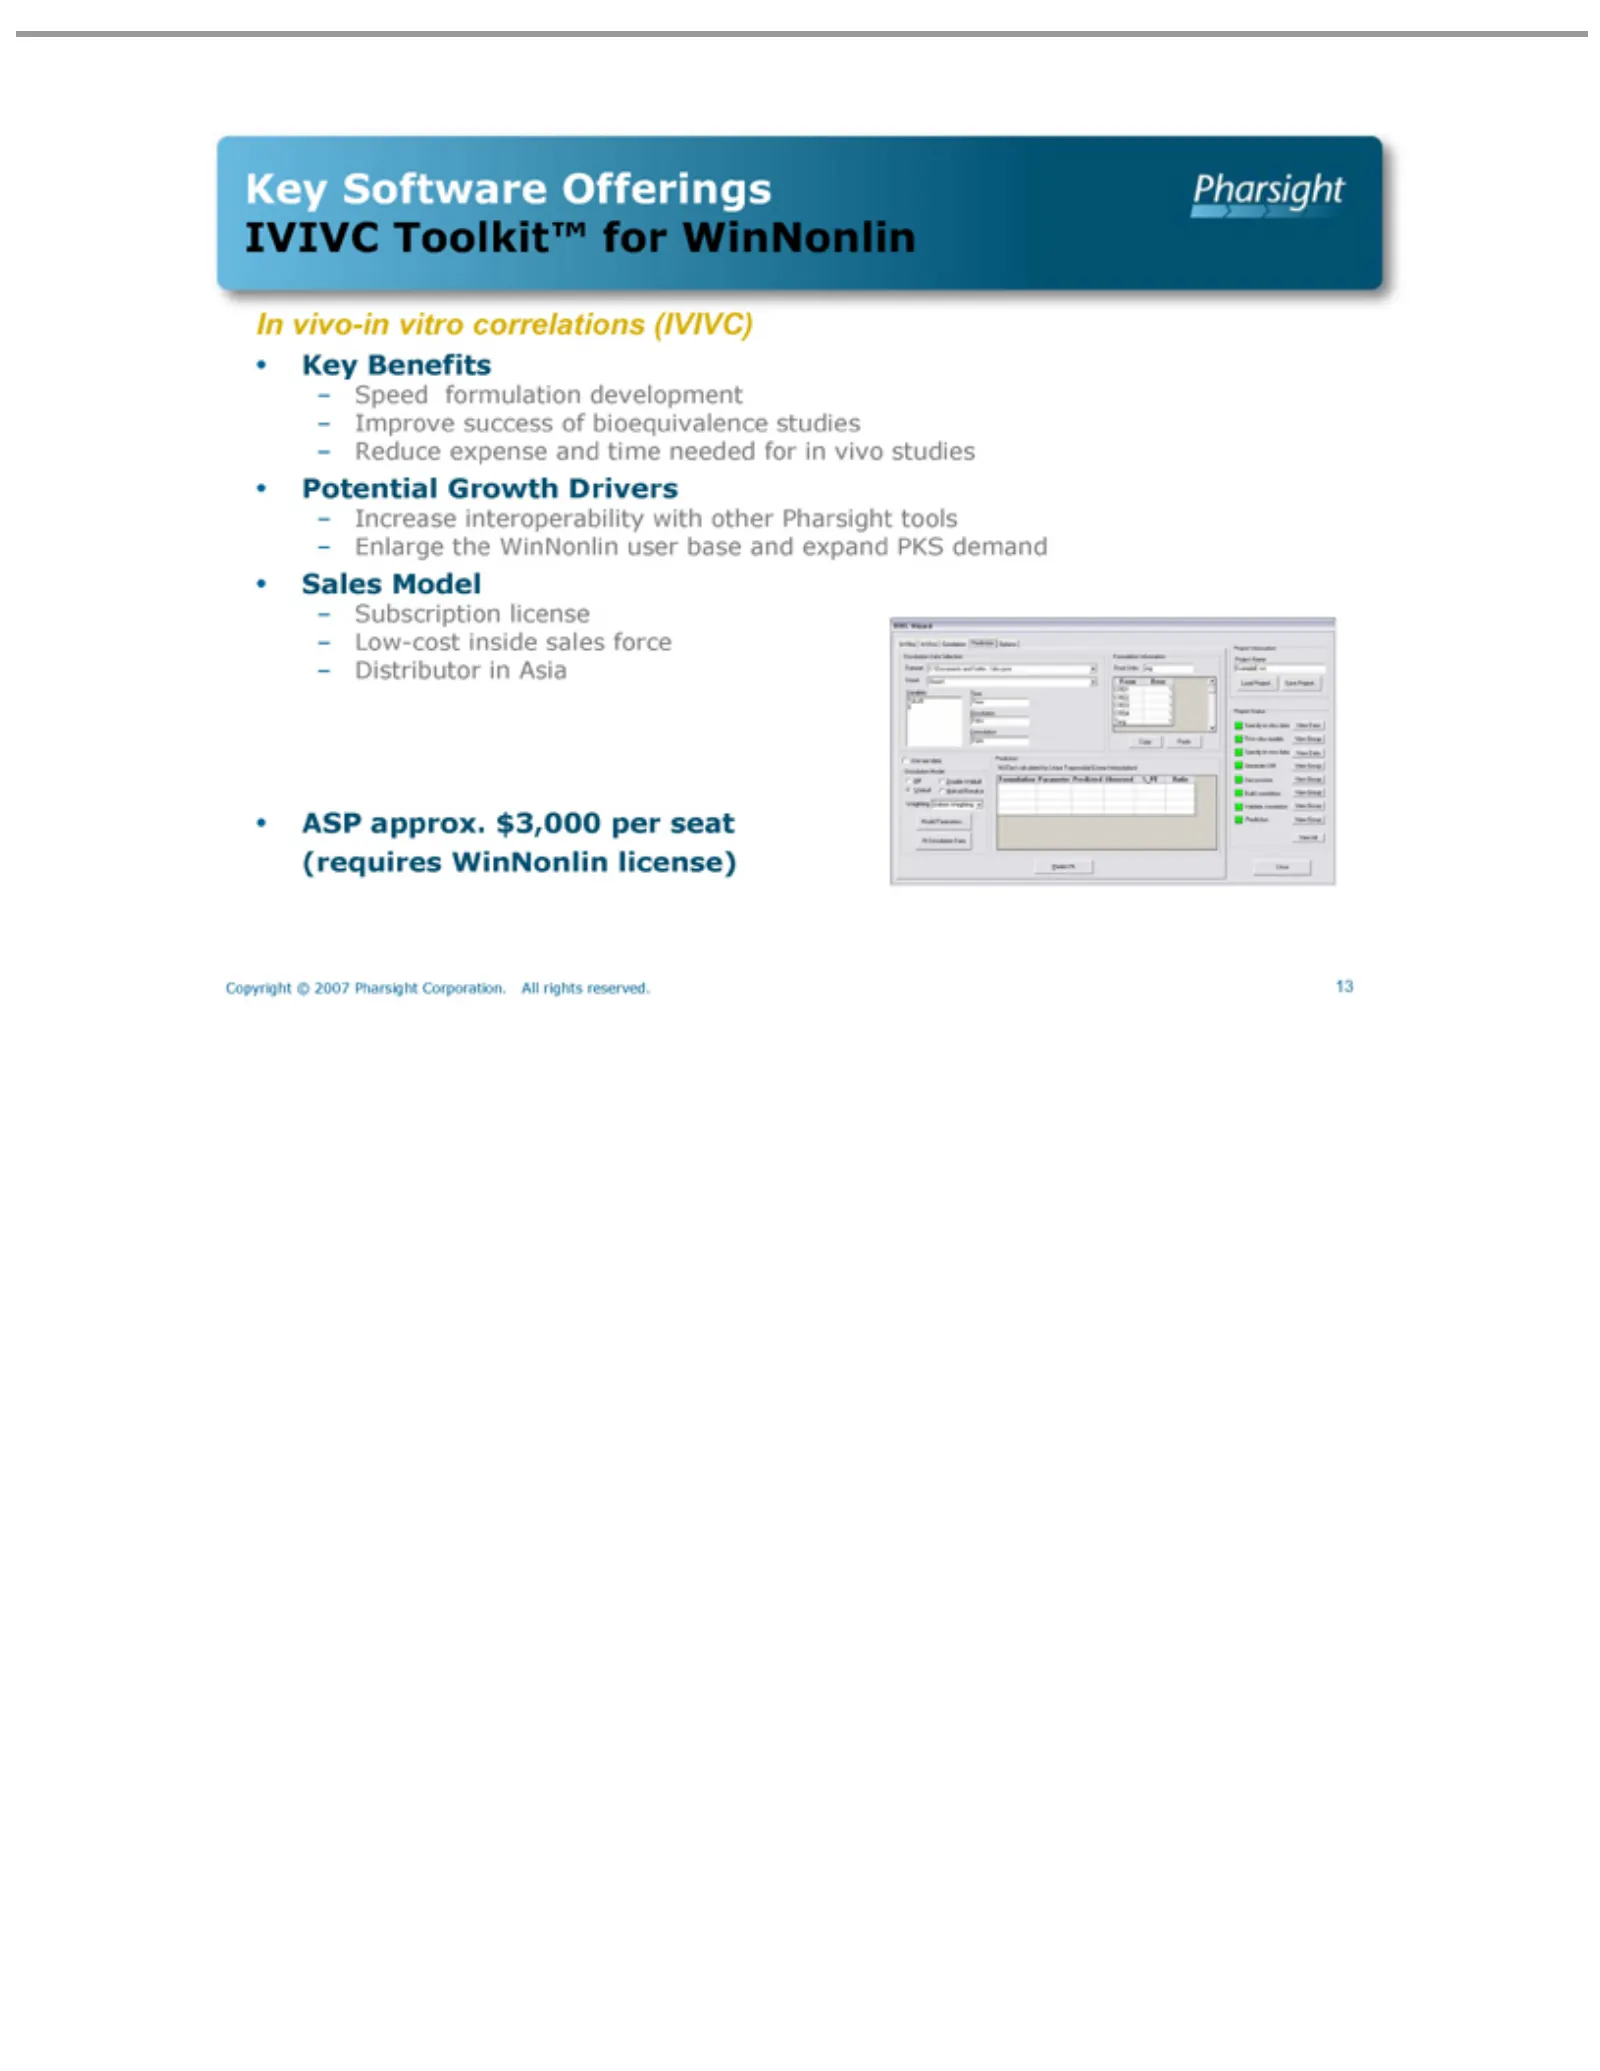
Slide 13: Key Software Offerings: IVIVC Toolkit
Key IVIVC In •– Copyright 13ASP Key Potential Sales Speed Improve Reduce Increase Enlarge Subscription Low-cost Distributor vivo-in Software Benefits approx. Model Toolkit™ formulation expense the vitro © interoperability success Growth inside 2007 in WinNonlin Offerings $3,000 license correlations
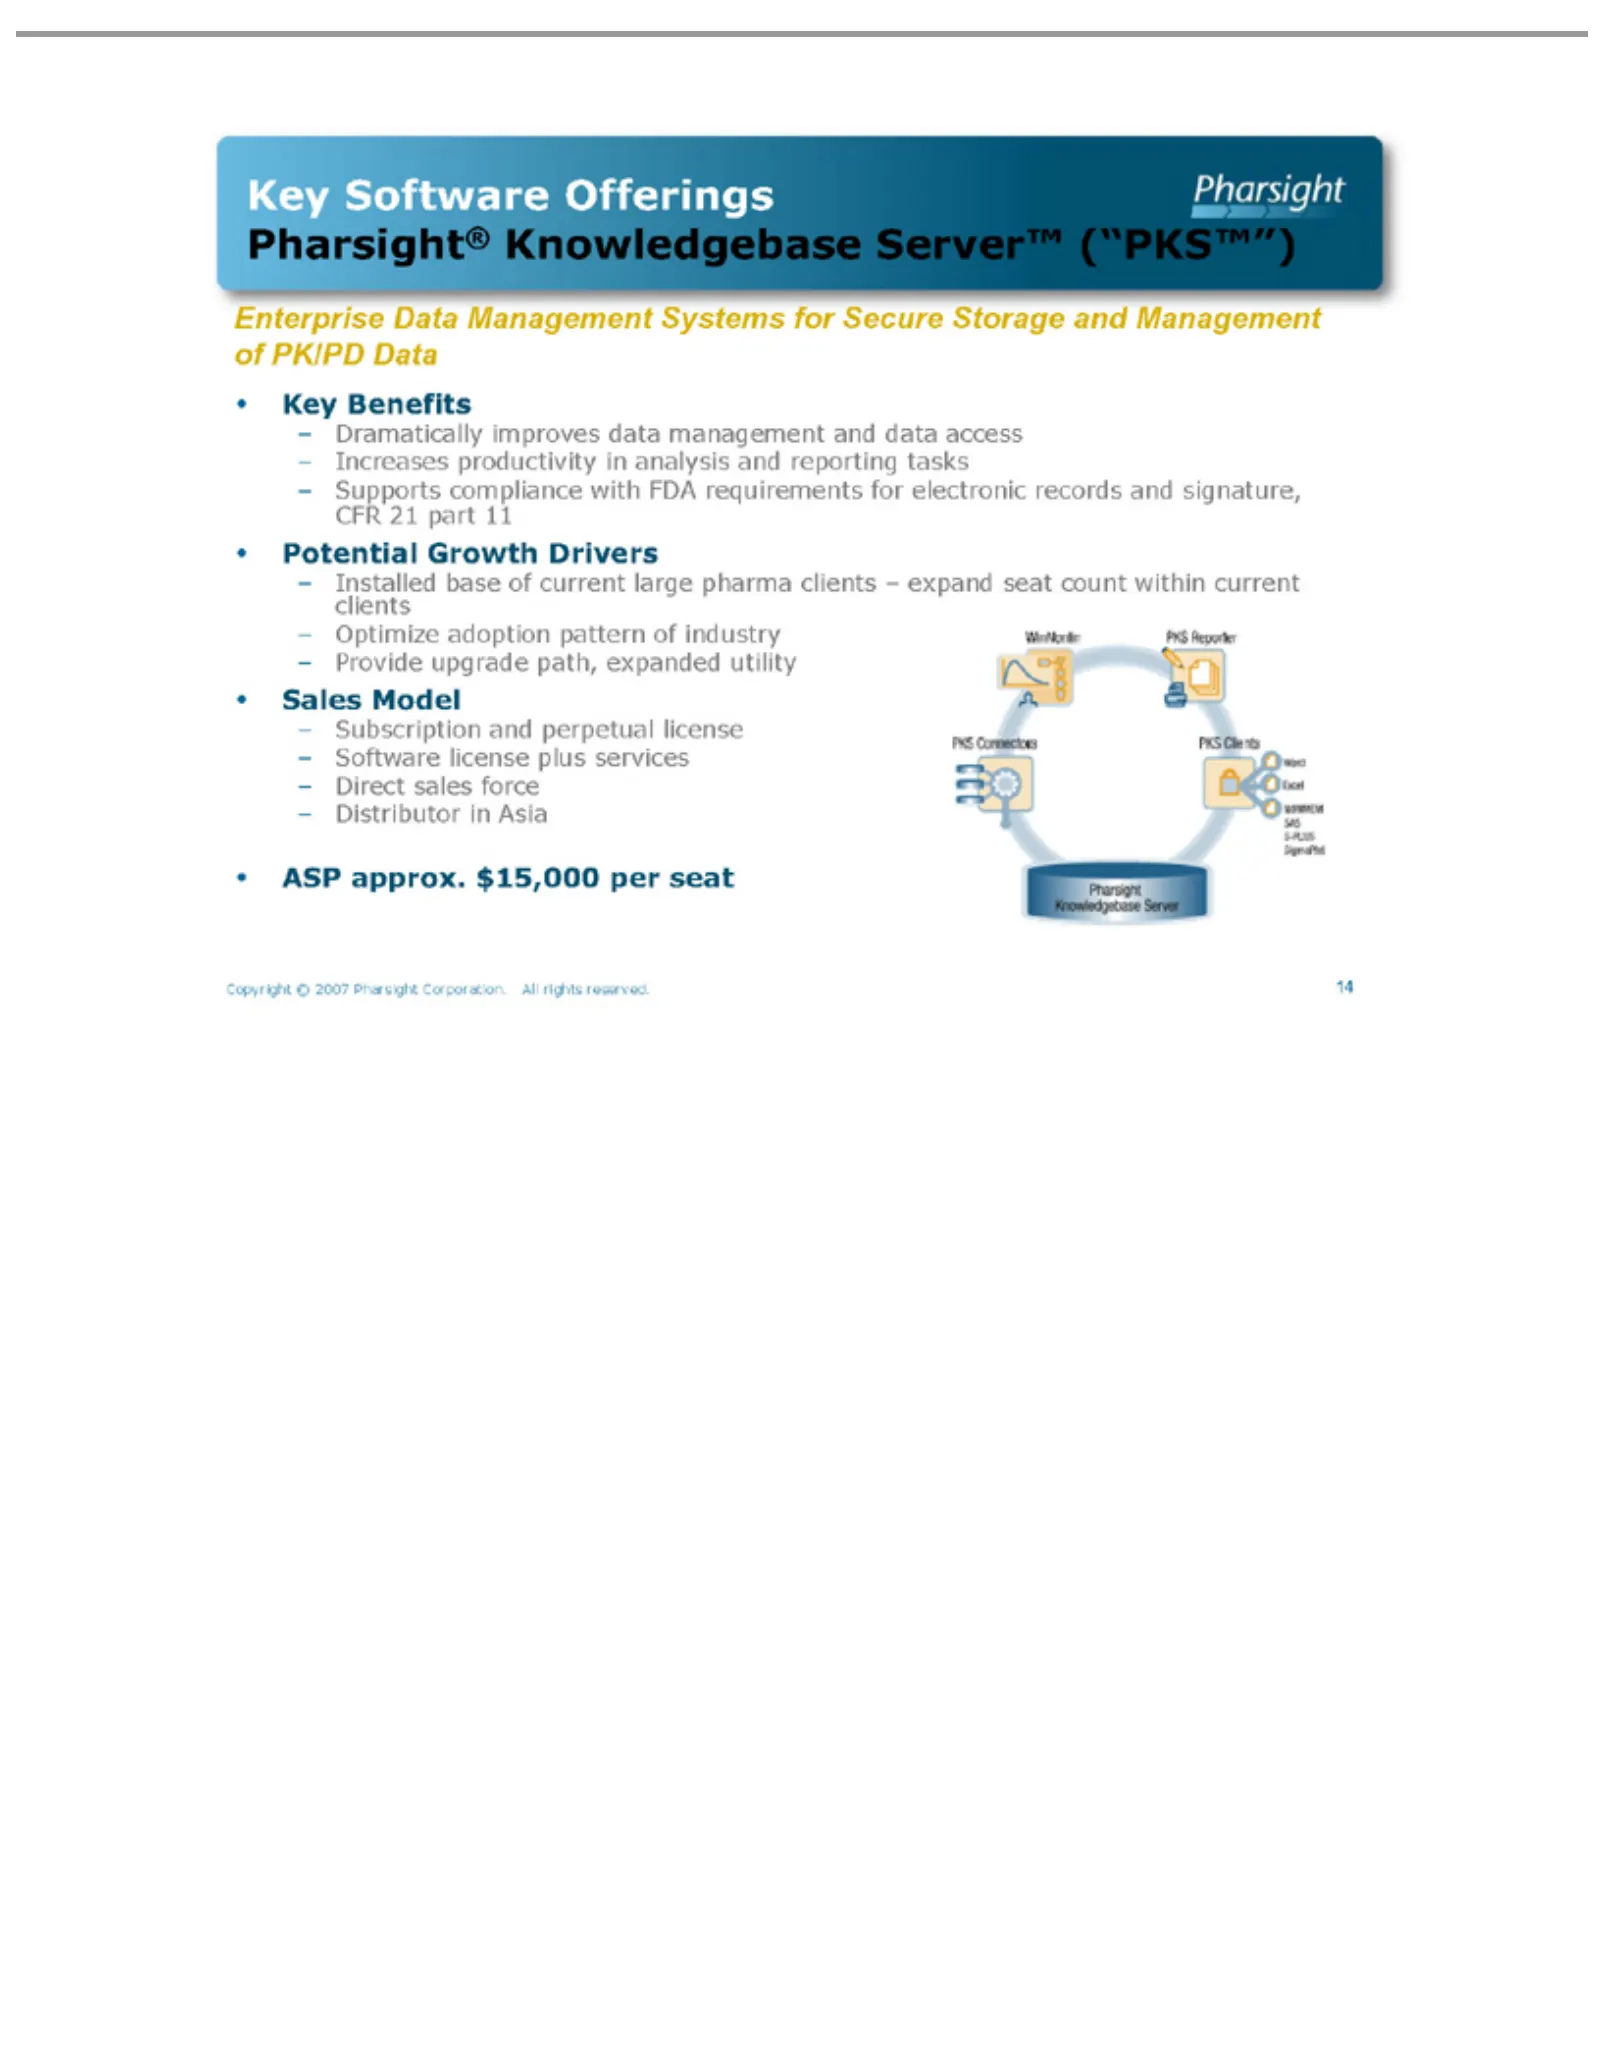
Slide 14: Key Software Offerings: Pharsight Knowledgebase Server
Key Pharsight® Enterprise •– Copyright 14ASP Key Potential Sales Dramatically Increases Supports Installed Optimize Provide Subscription Software Direct Distributor Software Benefits approx. Model sales upgrade © Data Growth base compliance license productivity adoption Knowledgebase 2007 inforce Of
Slide 15: Key Software Offerings: WinNonlin AutoPilot
Key WinNonlin Streamlining •– UNDER Copyright 15ASP Key Potential Sales Automate Capture Standardize Decrease Free-up Extend Subscription Software Direct Distributor Software Benefits approx. Model sales DEVELOPMENT AutoPilot PK PK and ©Growth license AutoPilot™ reporting analyses 2007 automation in
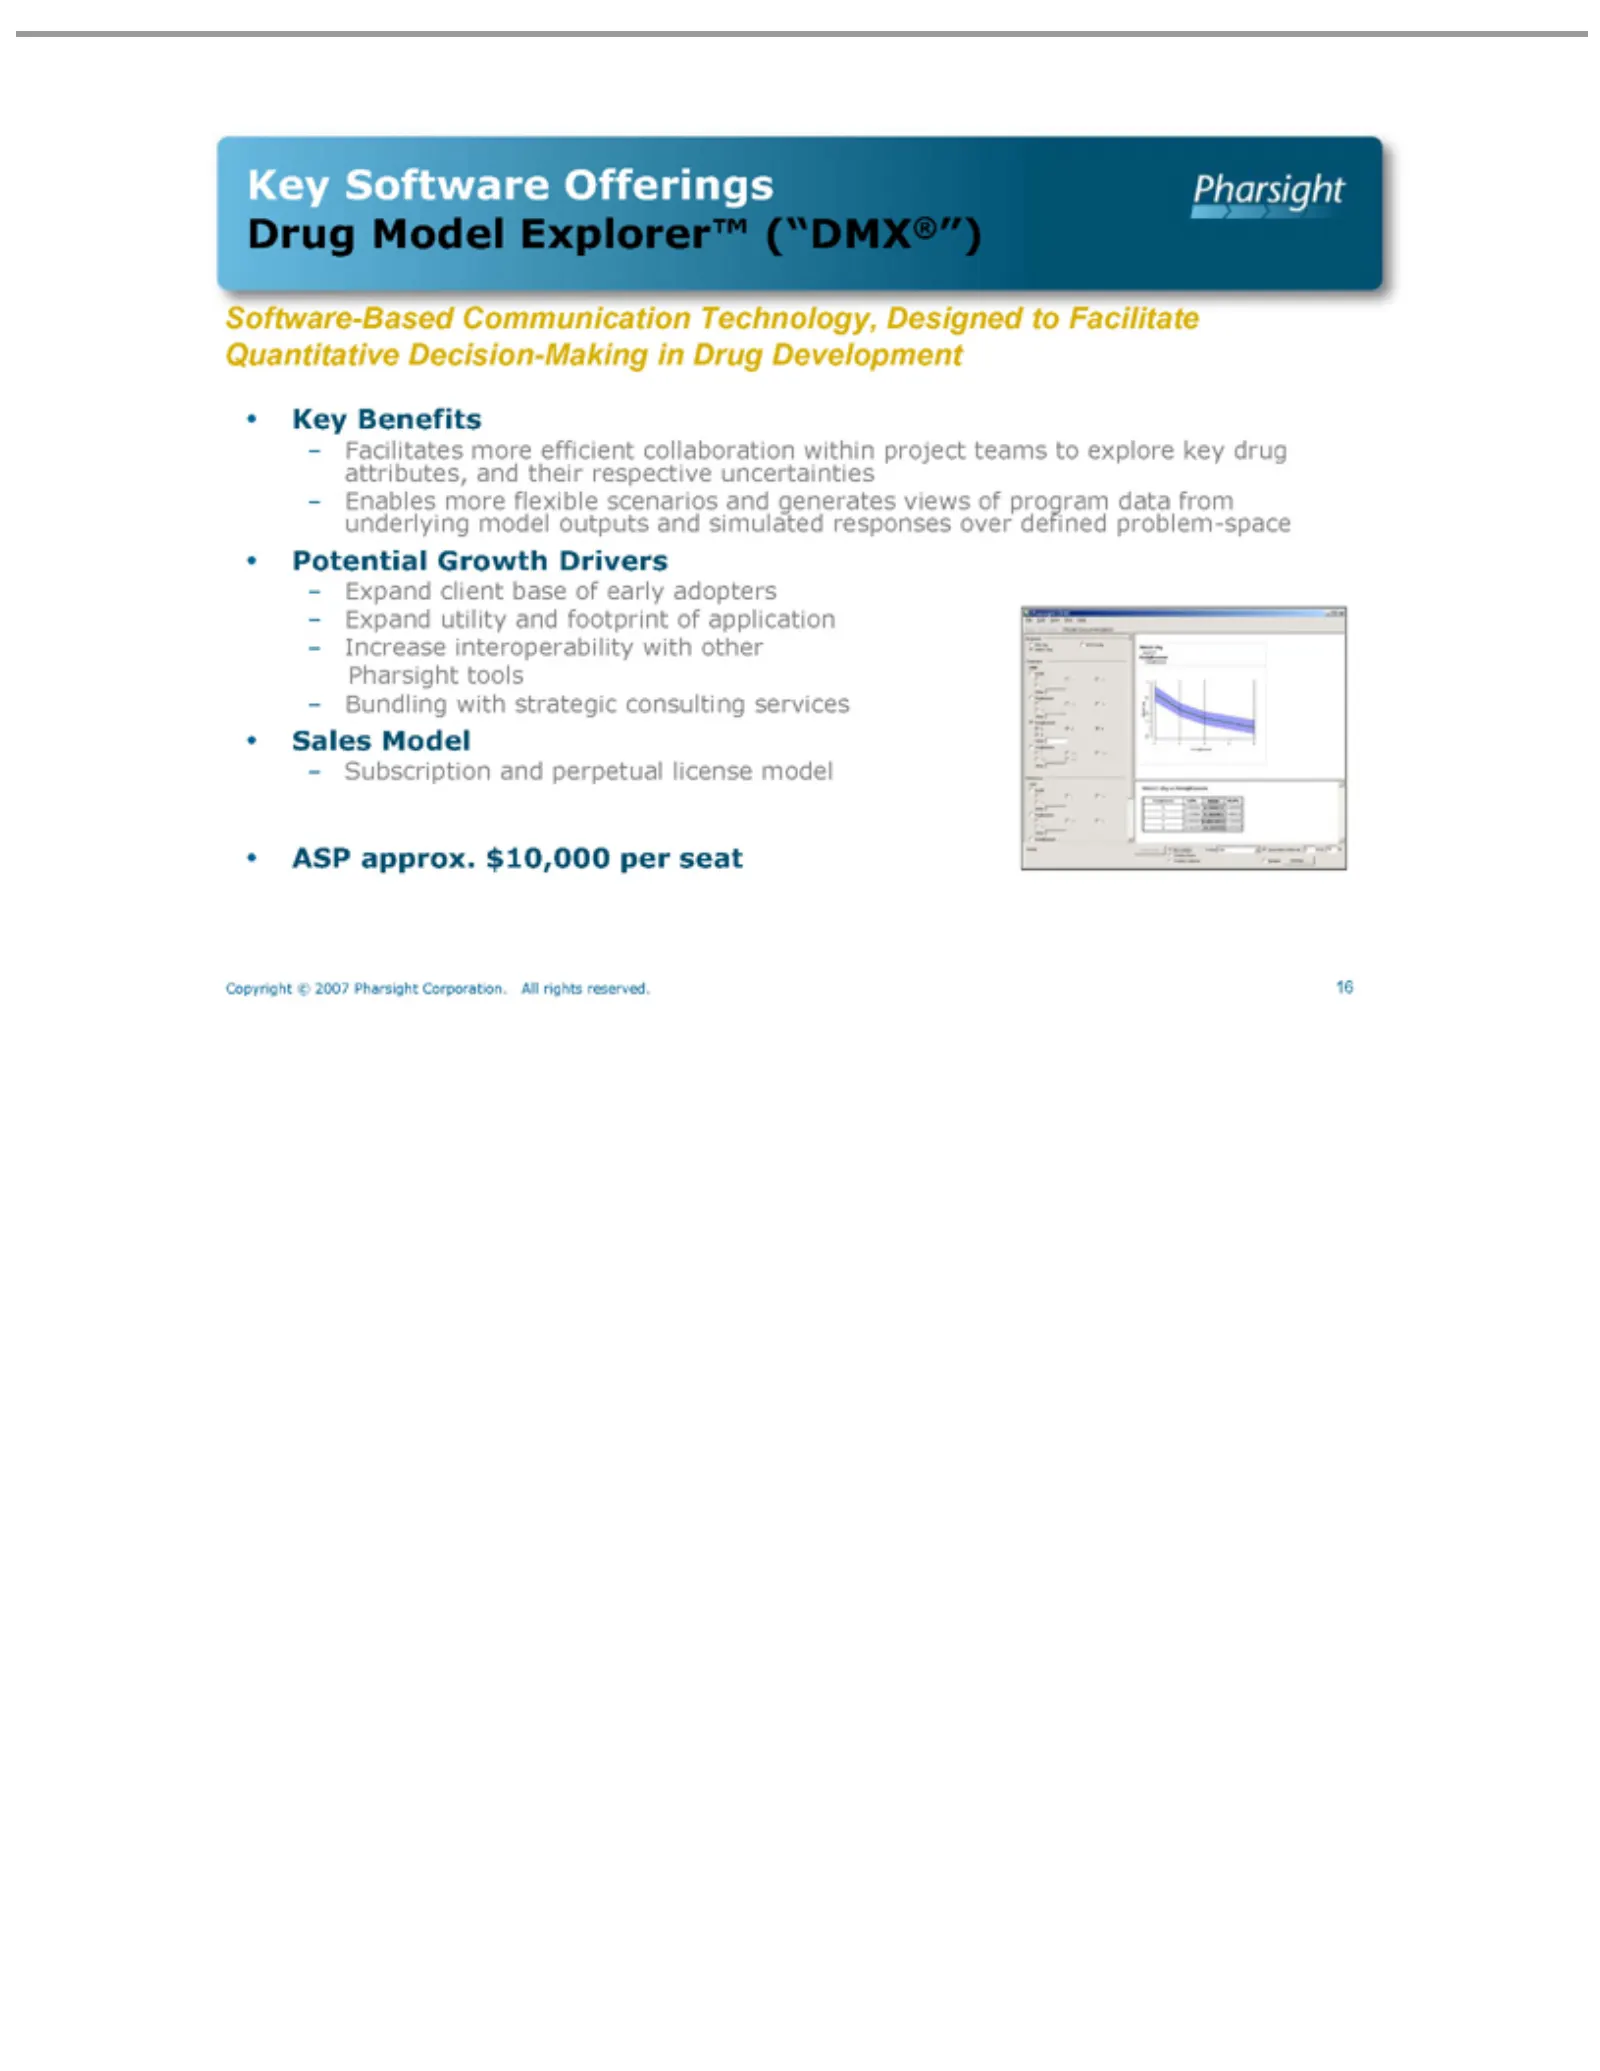
Slide 16: Key Software Offerings: Drug Model Explorer
Key Drug Software-Based Pharsight •– Copyright 16ASP Key Potential Sales Facilitates Enables Expand Increase Bundling Subscription Software Model Benefits approx. Model tools client utility more © interoperability Growth with more Explorer™ 2007 Offerings $10,000 and flexible base Communication and
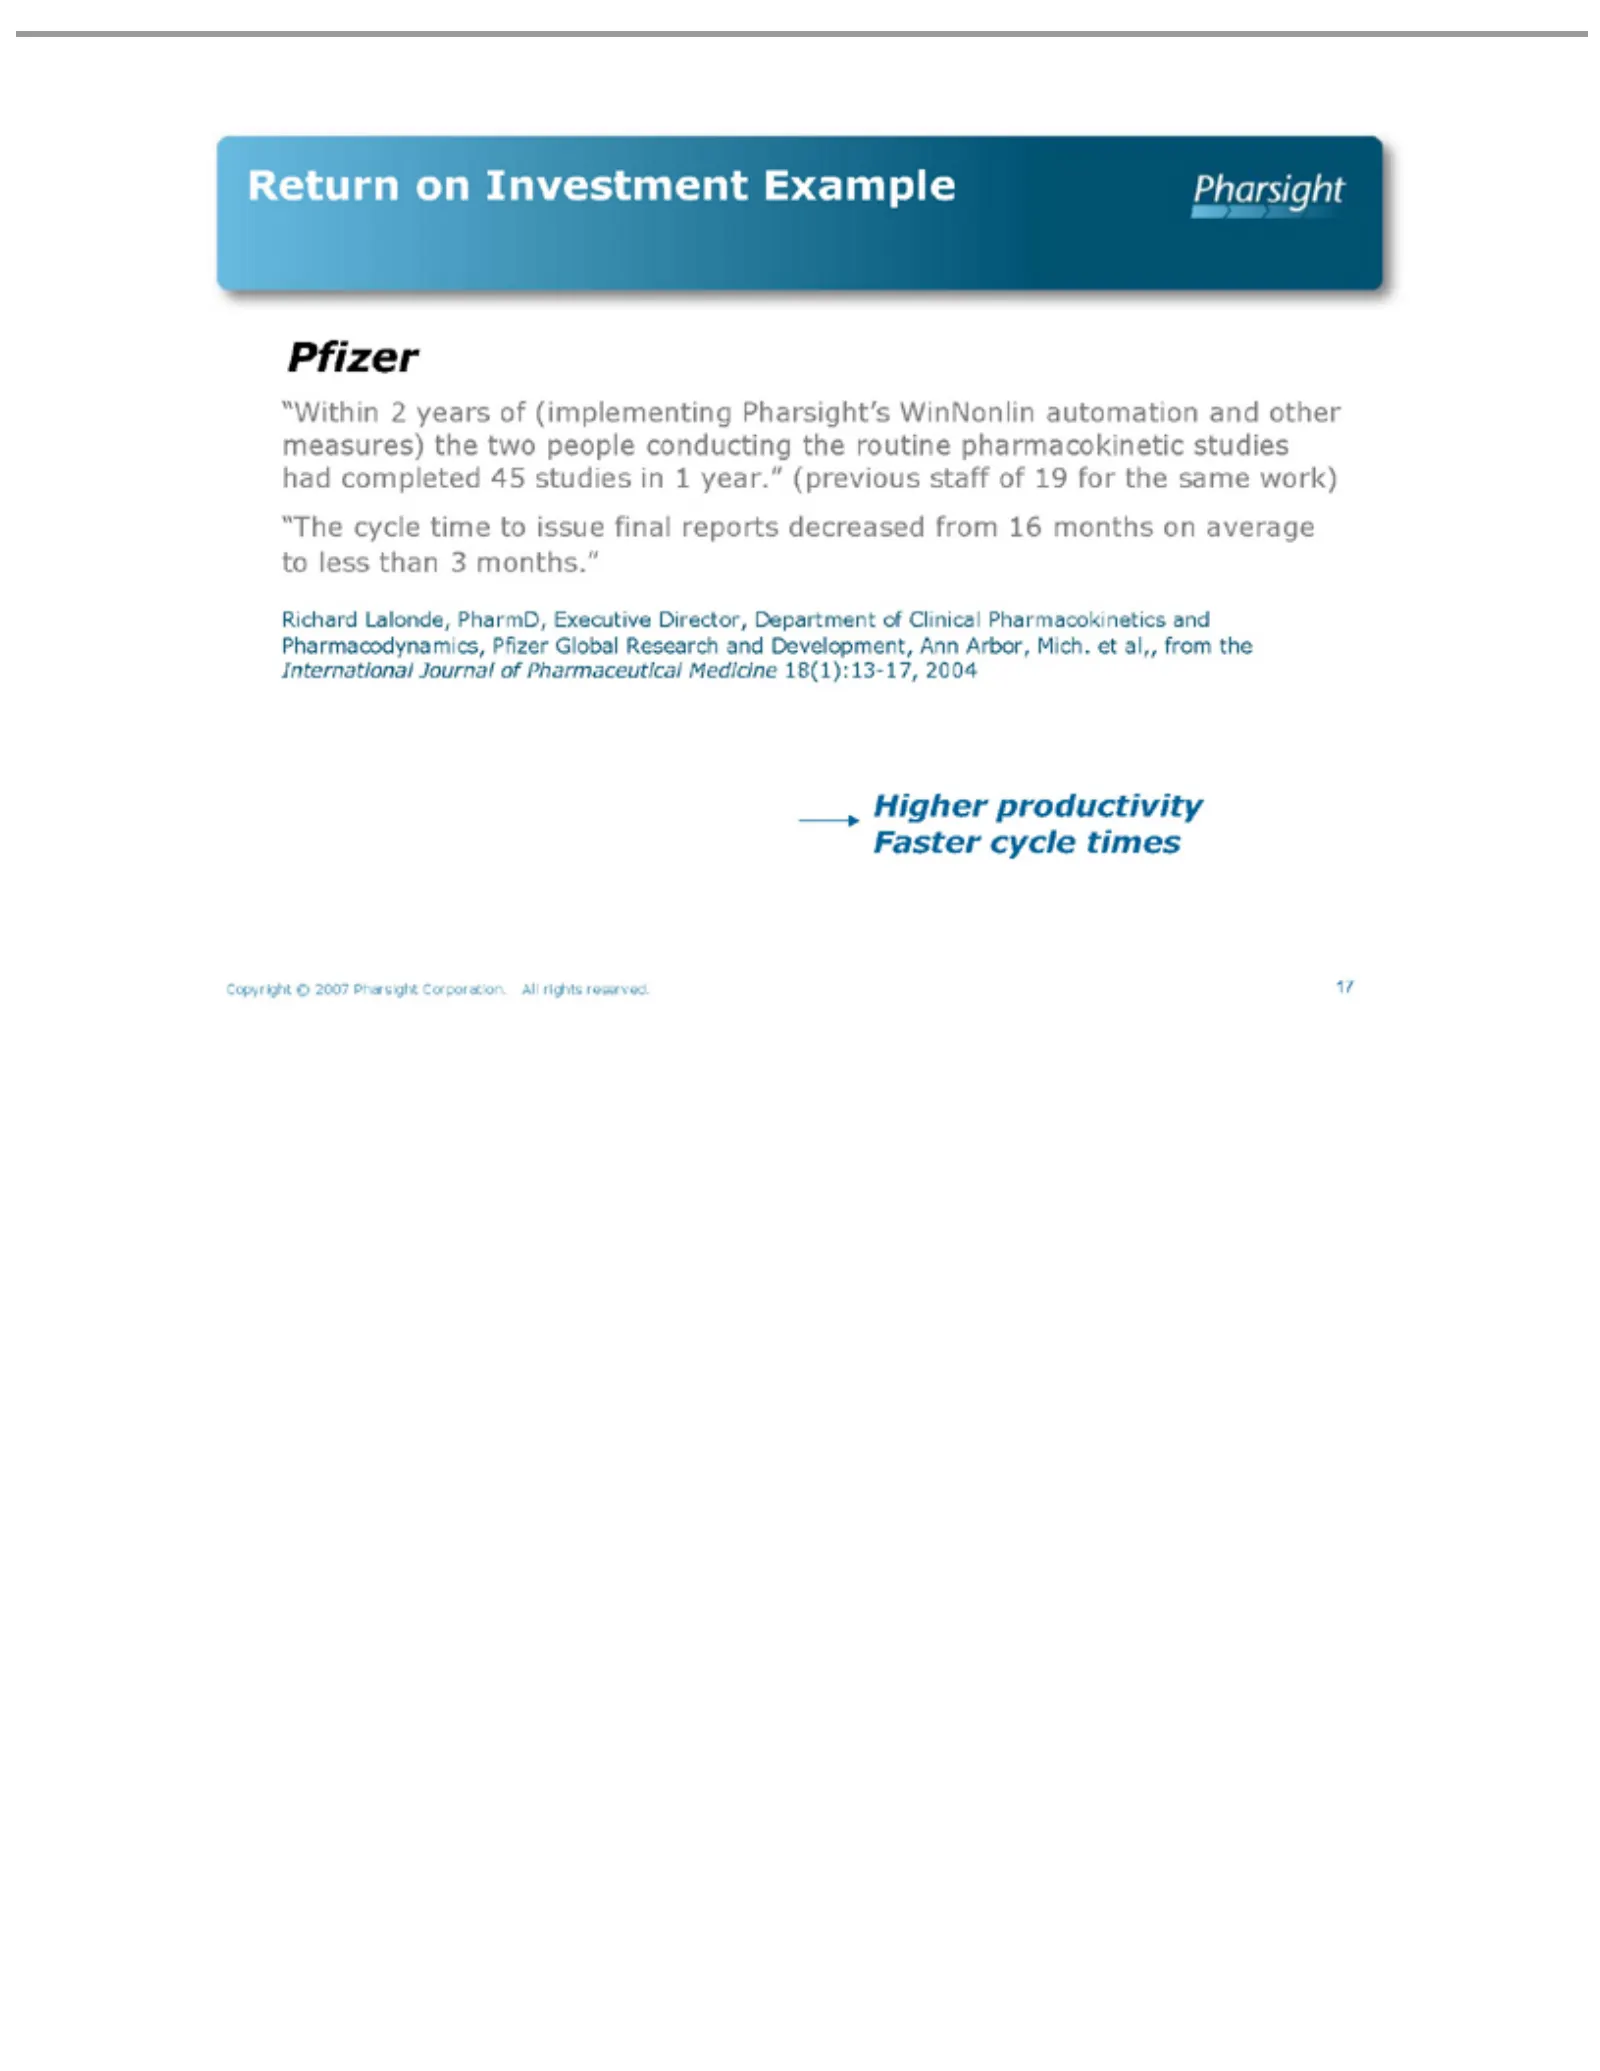
Slide 17: Higher Productivity Example: Pfizer
Returncycle “Within Pfizer (previous “The Richard International Higher Faster Copyright 17 cycle on productivity Lalonde, 2 staff years Investment ©time times 2007 Journal ofof to19 PharmD, Pharsight (implementing issue for ofExample Pharmaceutical the final Executive same Corporation. reports work)
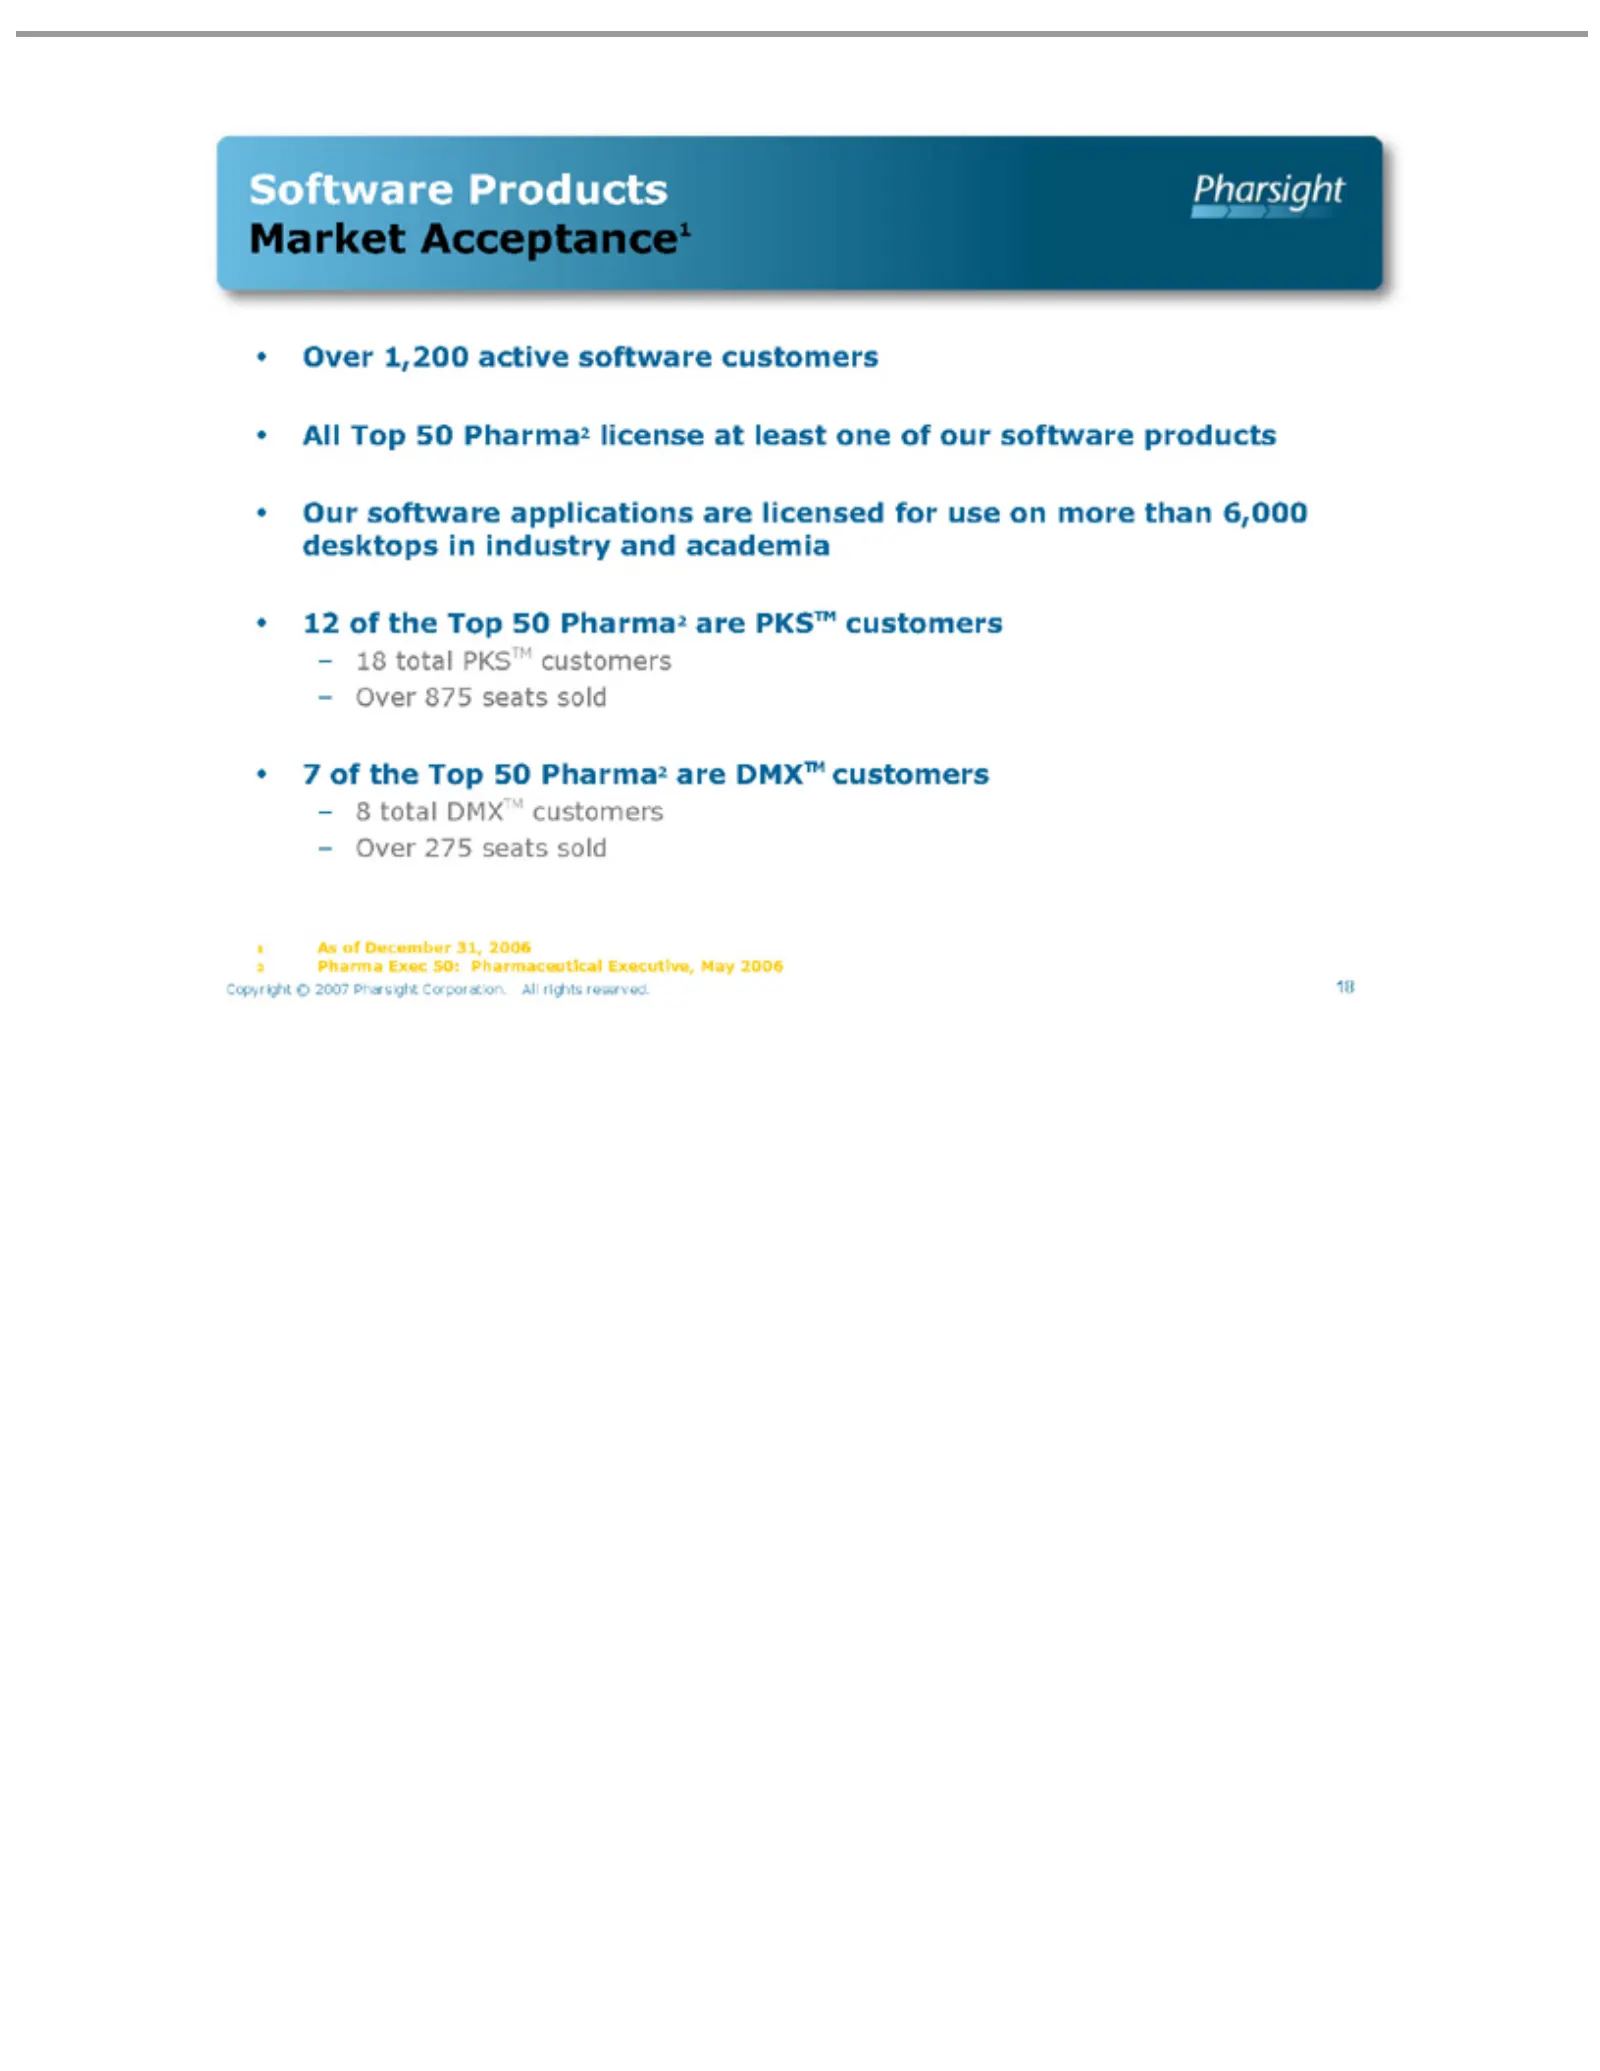
Slide 18: Software Market Acceptance
Software •Market – 1 2 Copyright 18All Over Our 712 As 818of Over Pharma total of total Top ofsoftware the 1,200 the 875 275 Acceptance1 December DMXTM 50 Products Top PKSTM Exec © Top seats Pharma2 2007 active 50 applications 50 50: Pharma2 sold Pharma2 31, Pharsight customers Pharmaceutical softwa
Slide 19: Strategic Consulting Services
Strategic Consulting Confidential © Pharsight Services Corporation
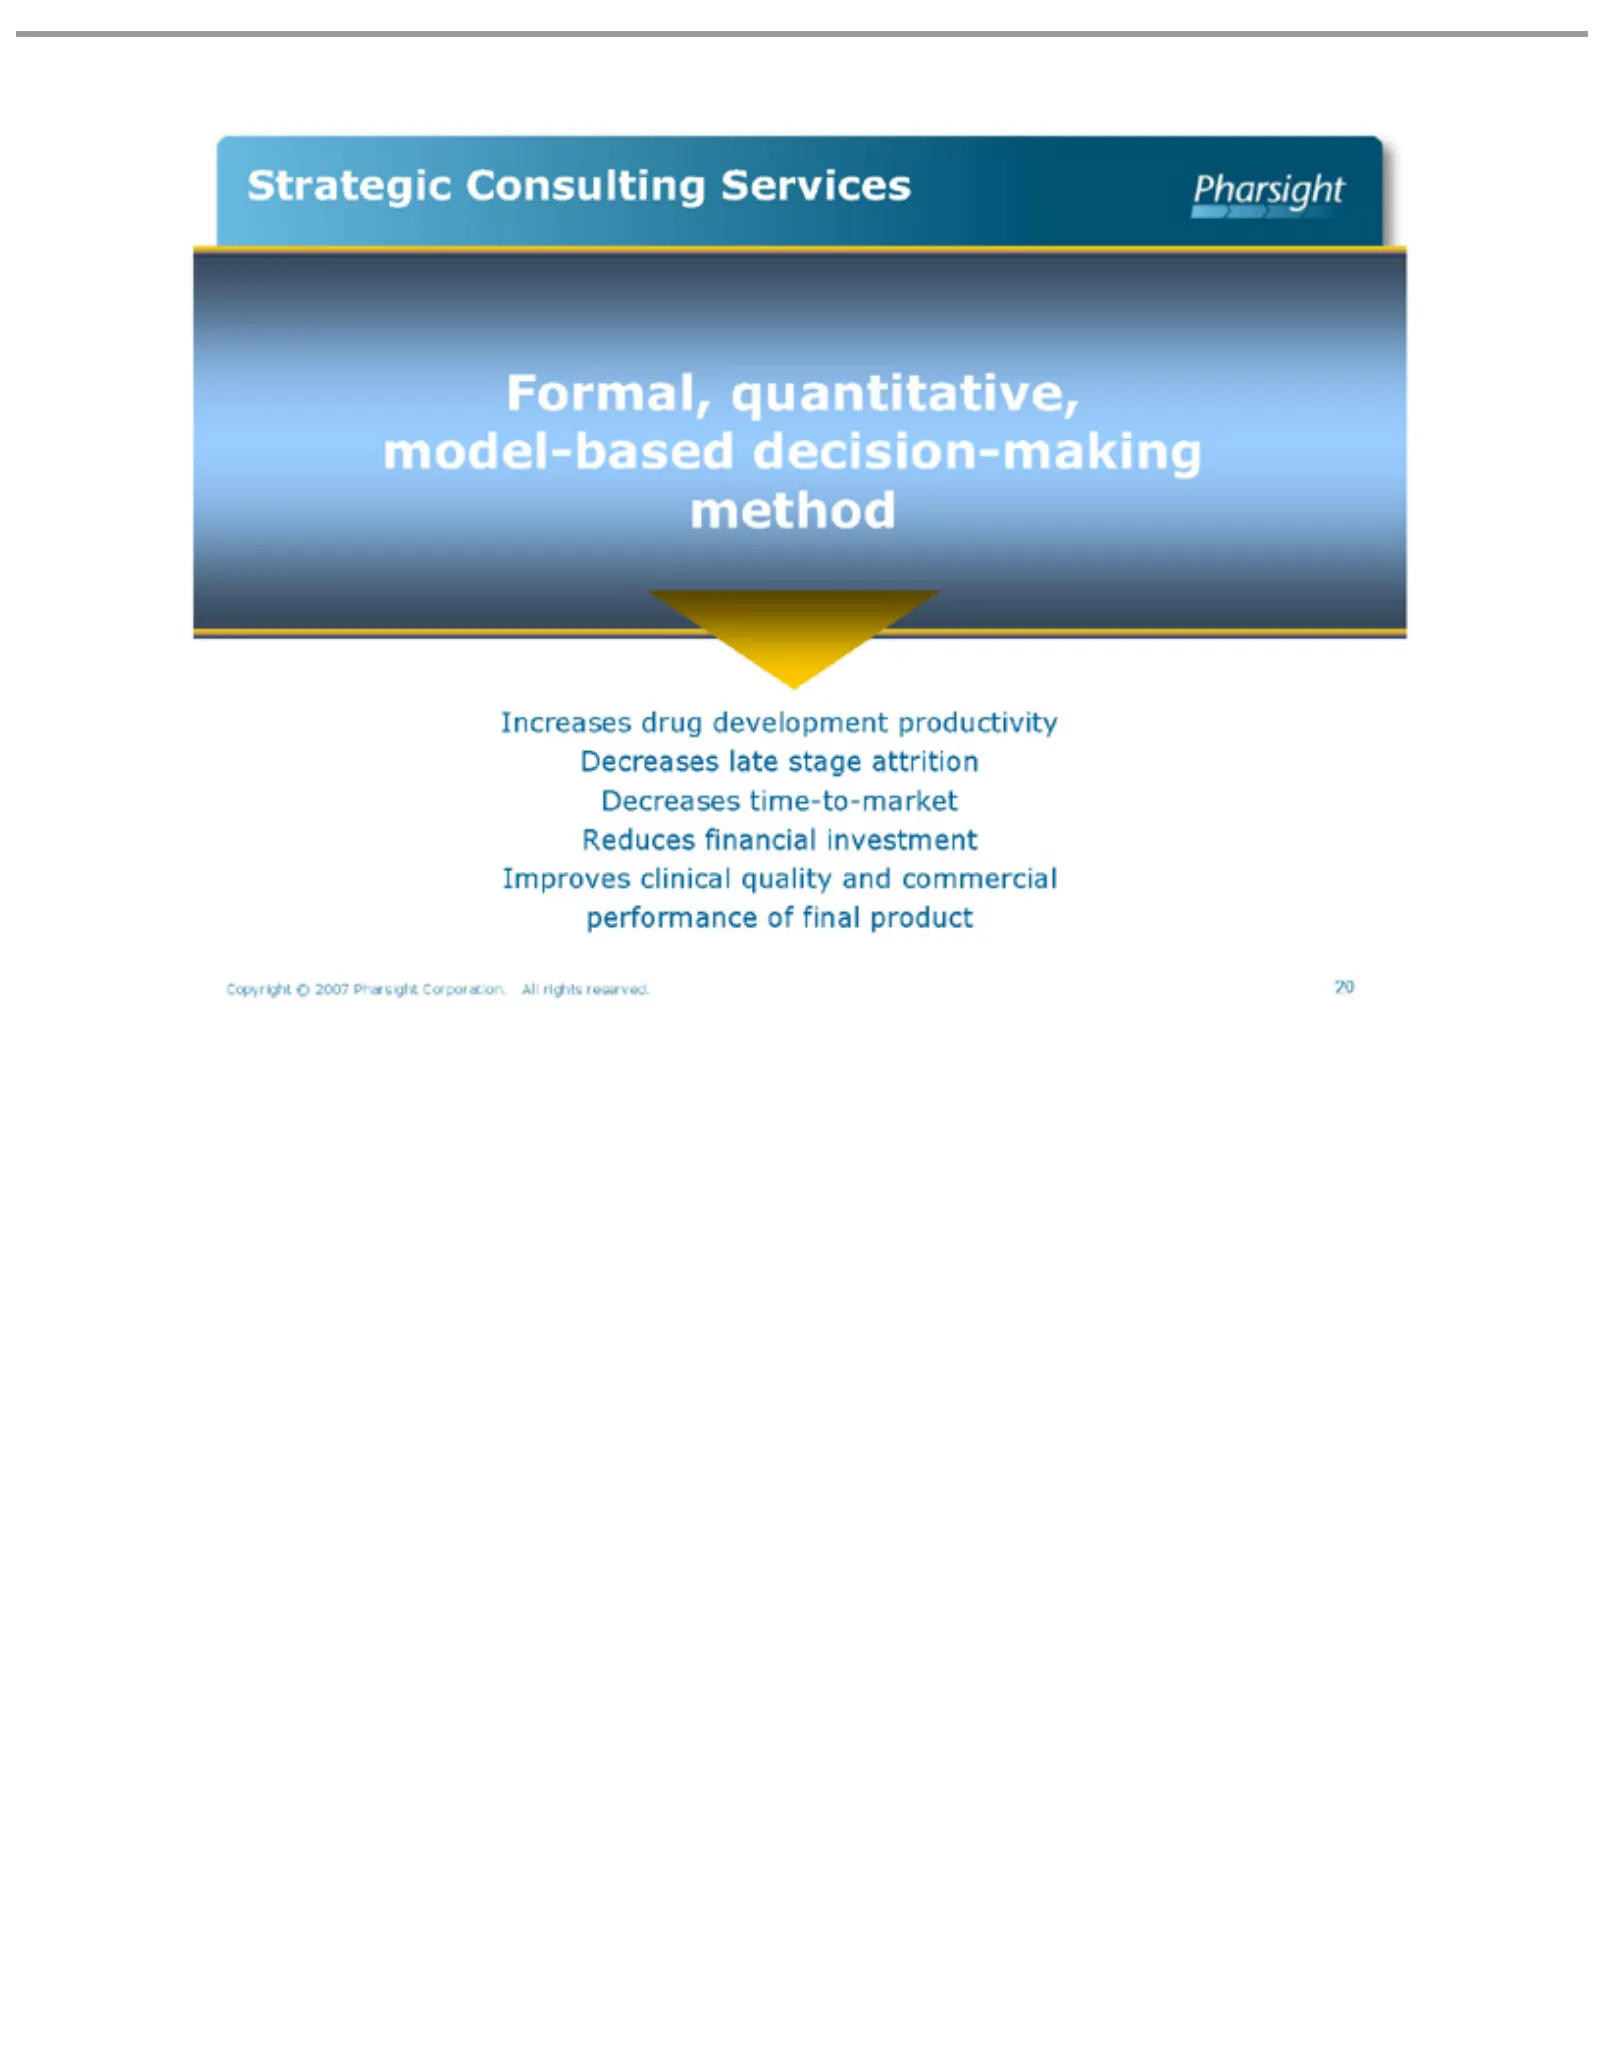
Slide 20: Strategic Consulting Services
Strategicquantitative, Formal, model-based Increases method Decreases Reduces Improves performance Copyright 20 financial Consulting drug clinical late time-to-market © of 2007 decision-making stage development final quality investment Pharsight attrition Services product andproductivity Corporation
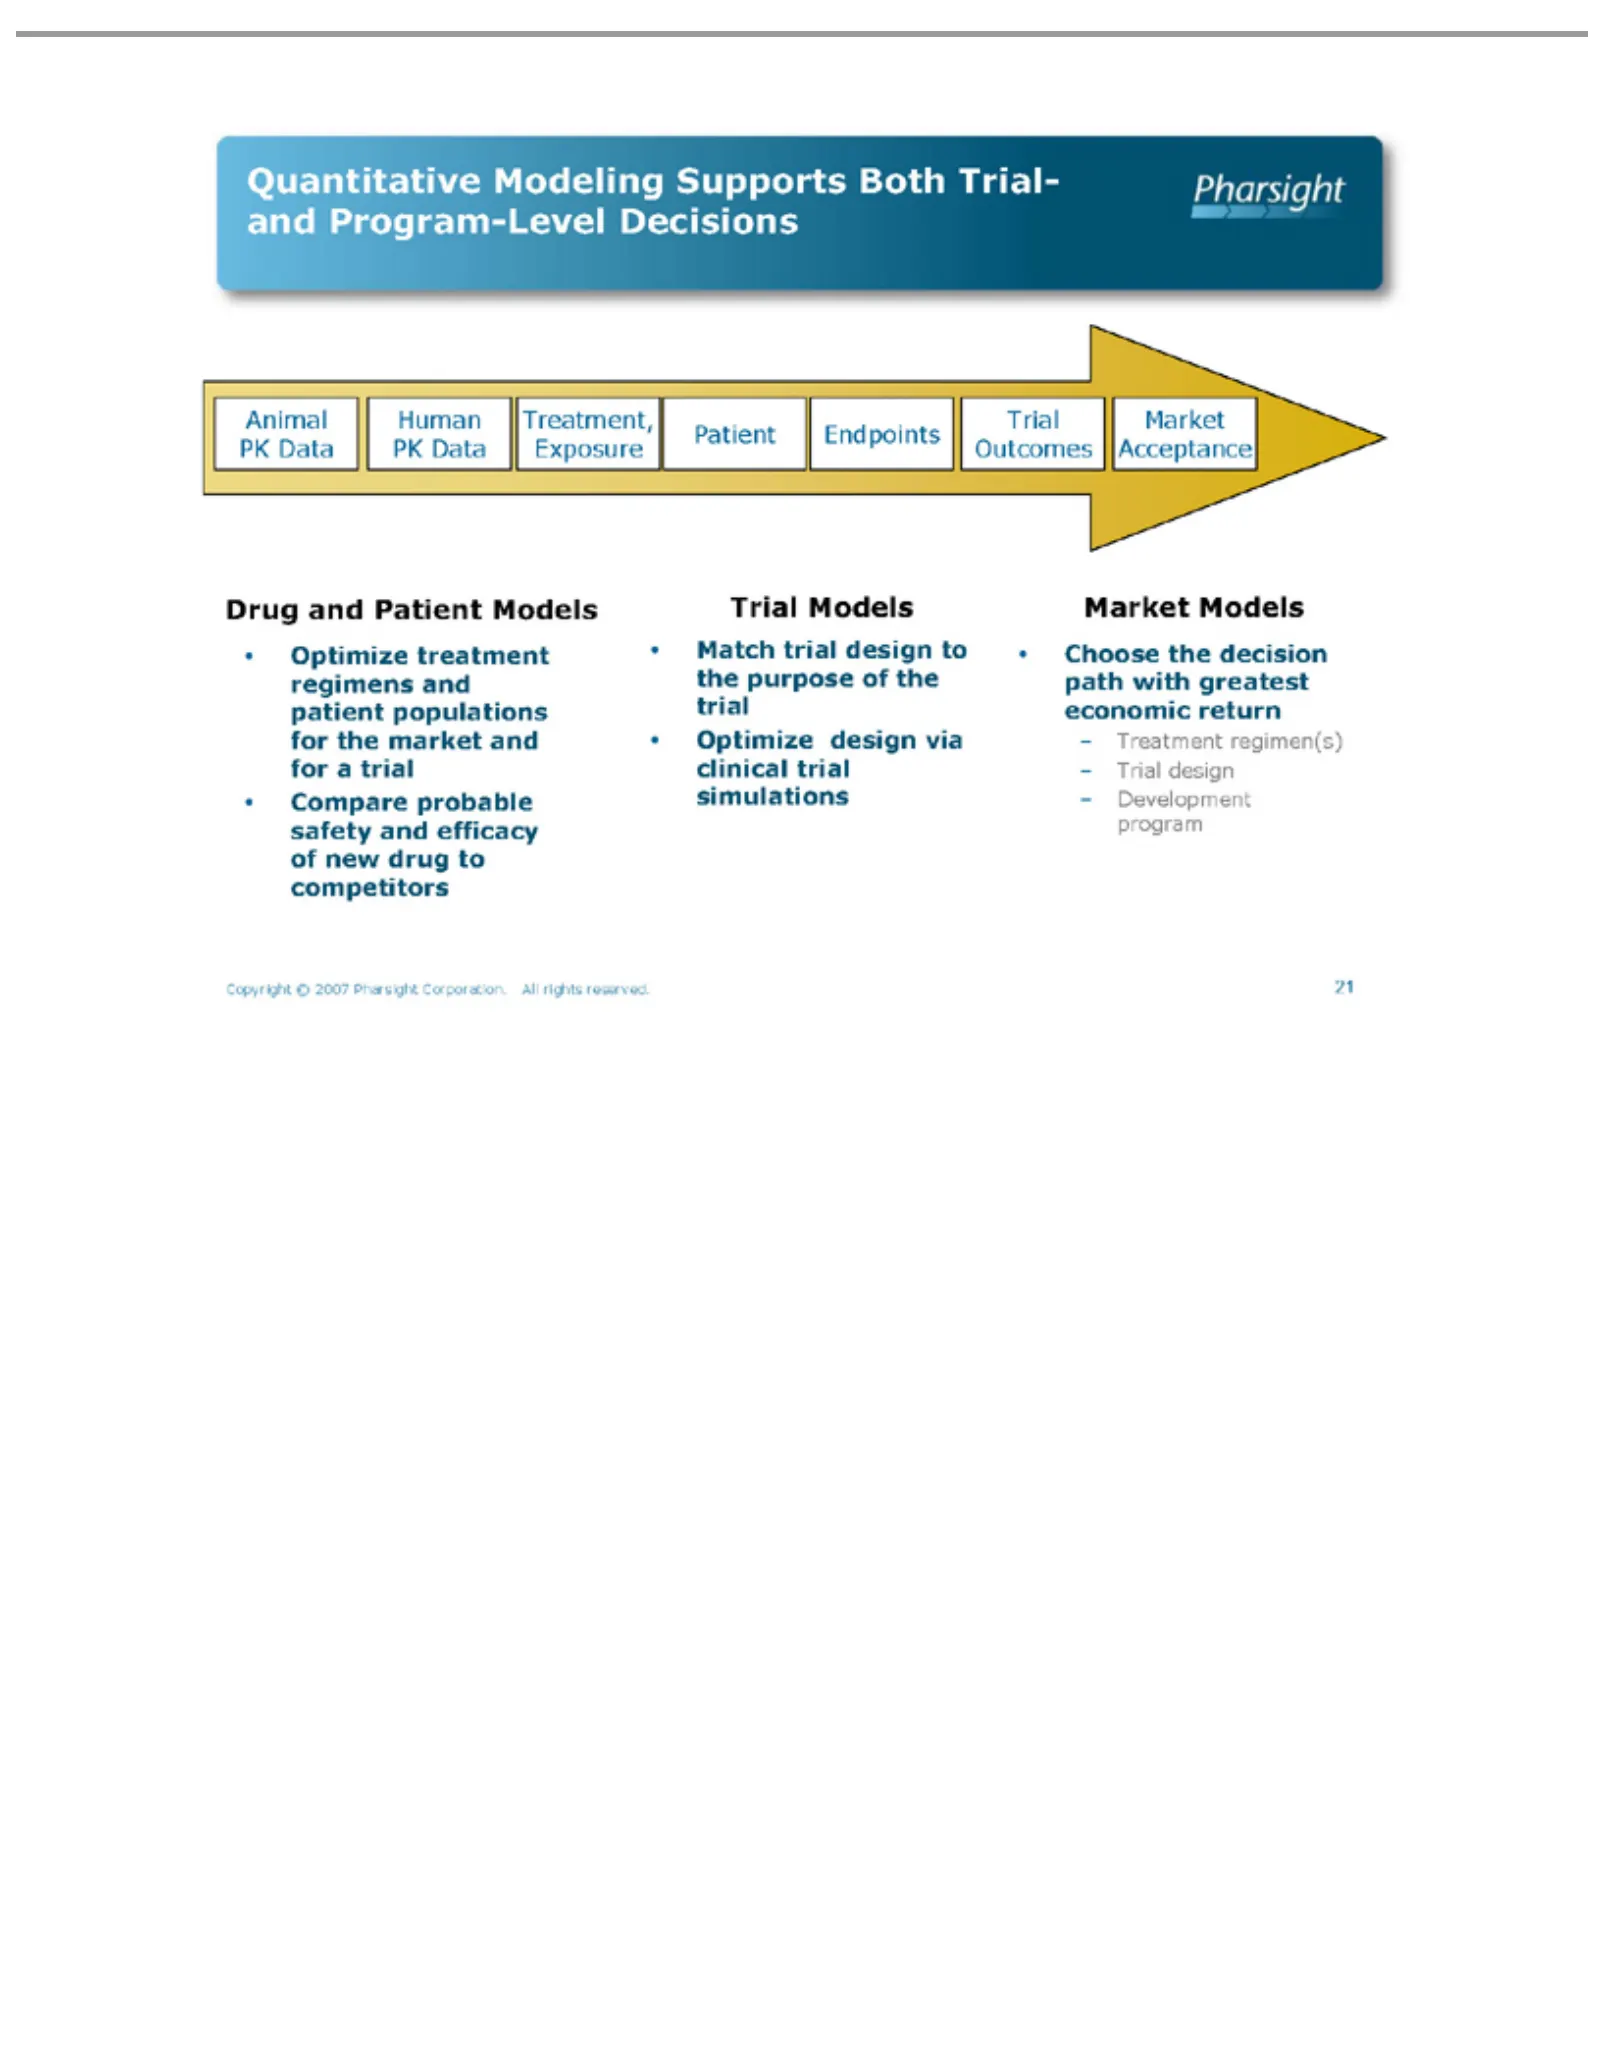
Slide 21: Quantitative Drug Development Models
Quantitative Animal Human Treatment, Endpoints Patient Drug Trial •Market – Copyright 21Compare Match Optimize Choose Treatment Trial Development Outcomes Models and design Acceptance Models PK trial the Patient © probable treatment design Exposure Data regimen(s) Modeling design 2007 decision progr
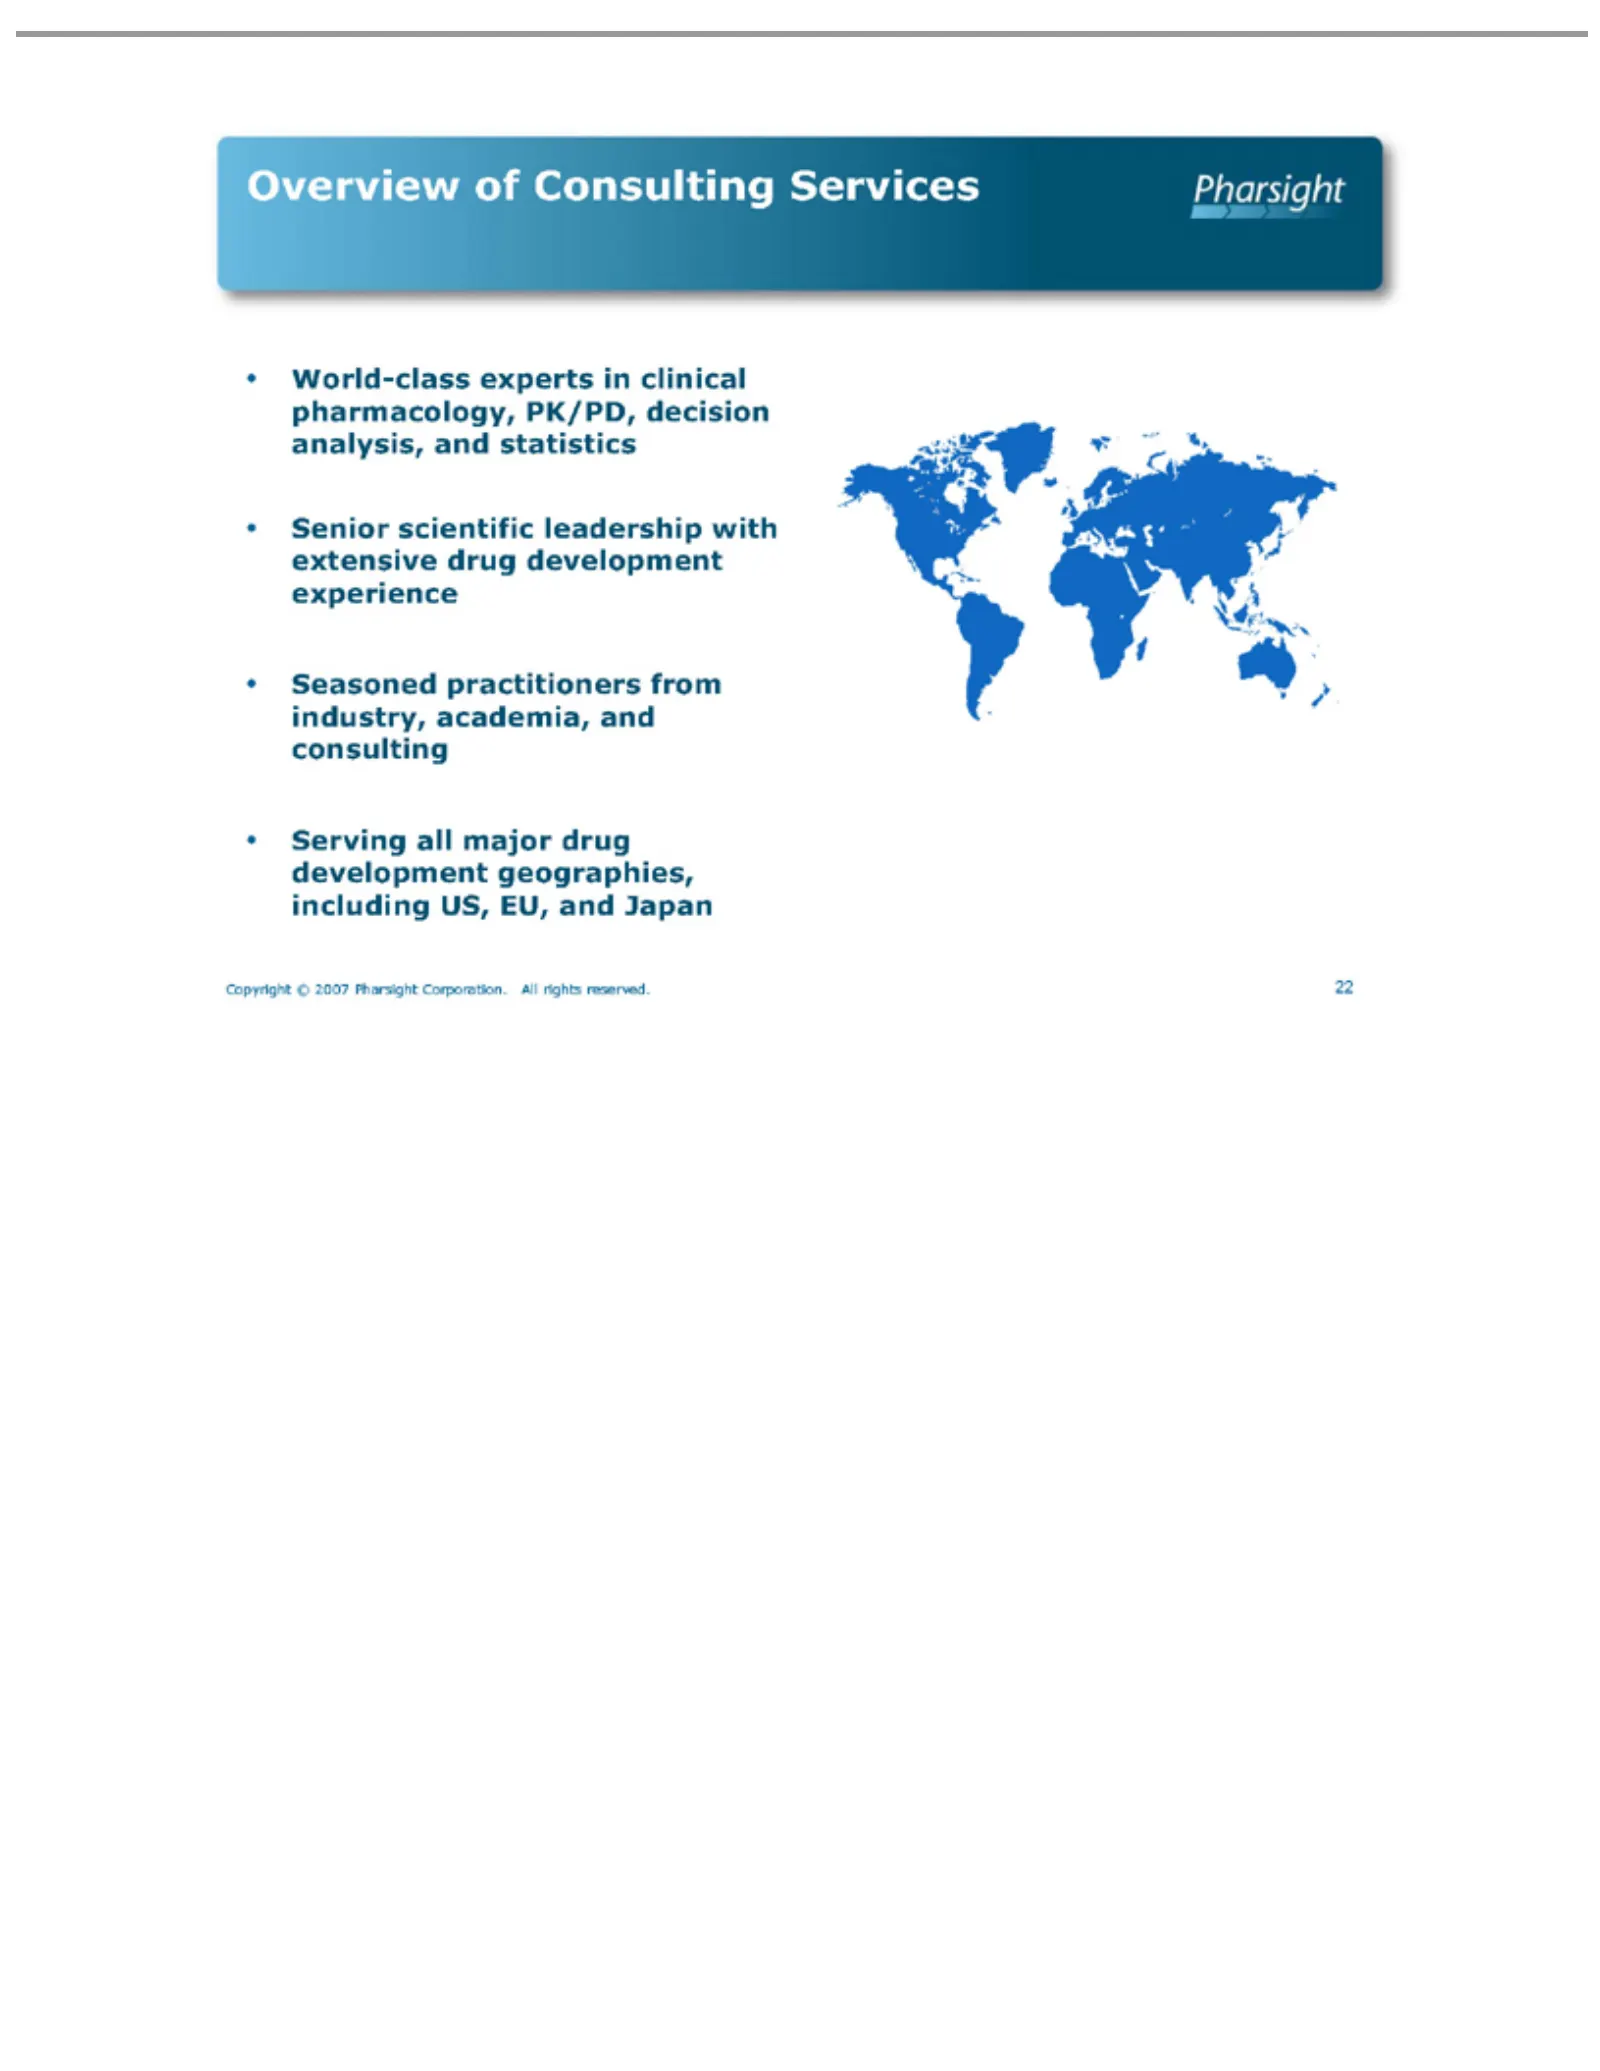
Slide 22: Consulting Services Overview
•Overview Copyright 22 World-class Senior scientific Seasoned Serving all of ©practitioners major Consulting 2007 experts leadership Pharsight drug in clinical from development Services Corporation. with industry, pharmacology, extensive geographies, academia, Alldrug rights PK/PD, development and i
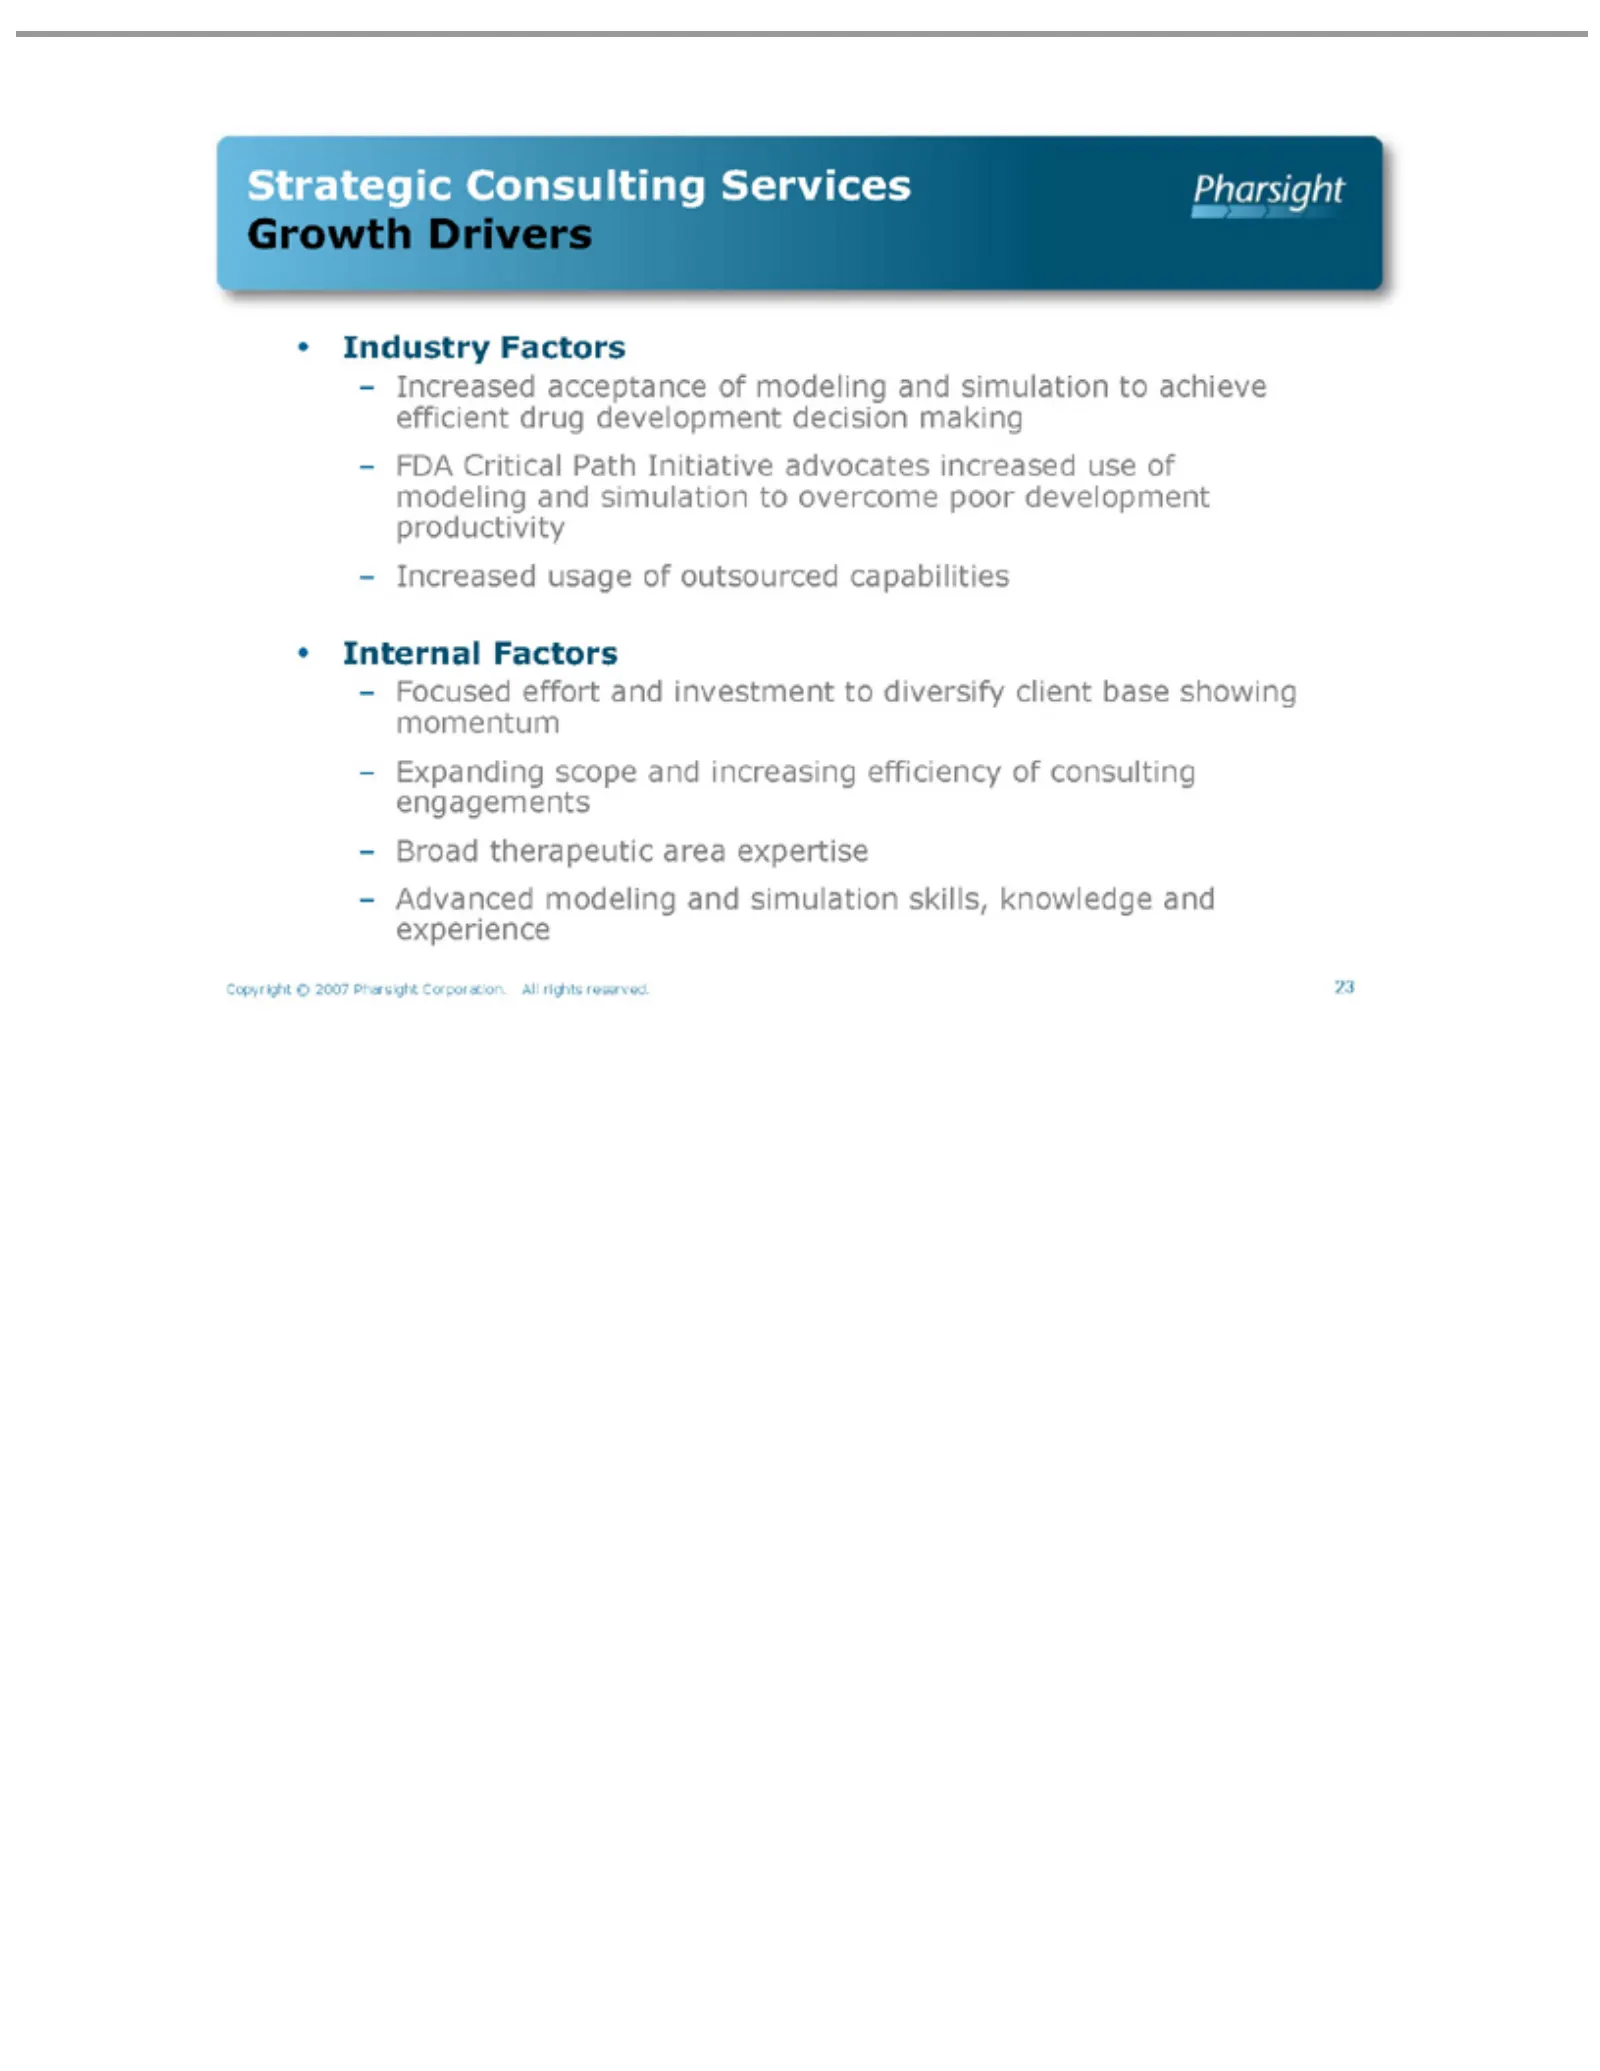
Slide 23: Strategic Consulting Growth Factors
Strategic •Growth – Copyright 23Industry Internal Advanced FDA Critical Increased Focused Expanding Broad Drivers therapeutic Consulting Factors Factors © effort acceptance usage modeling 2007 scope Path and of Pharsight and area Initiative outsourced Services investment and of increasing expertise
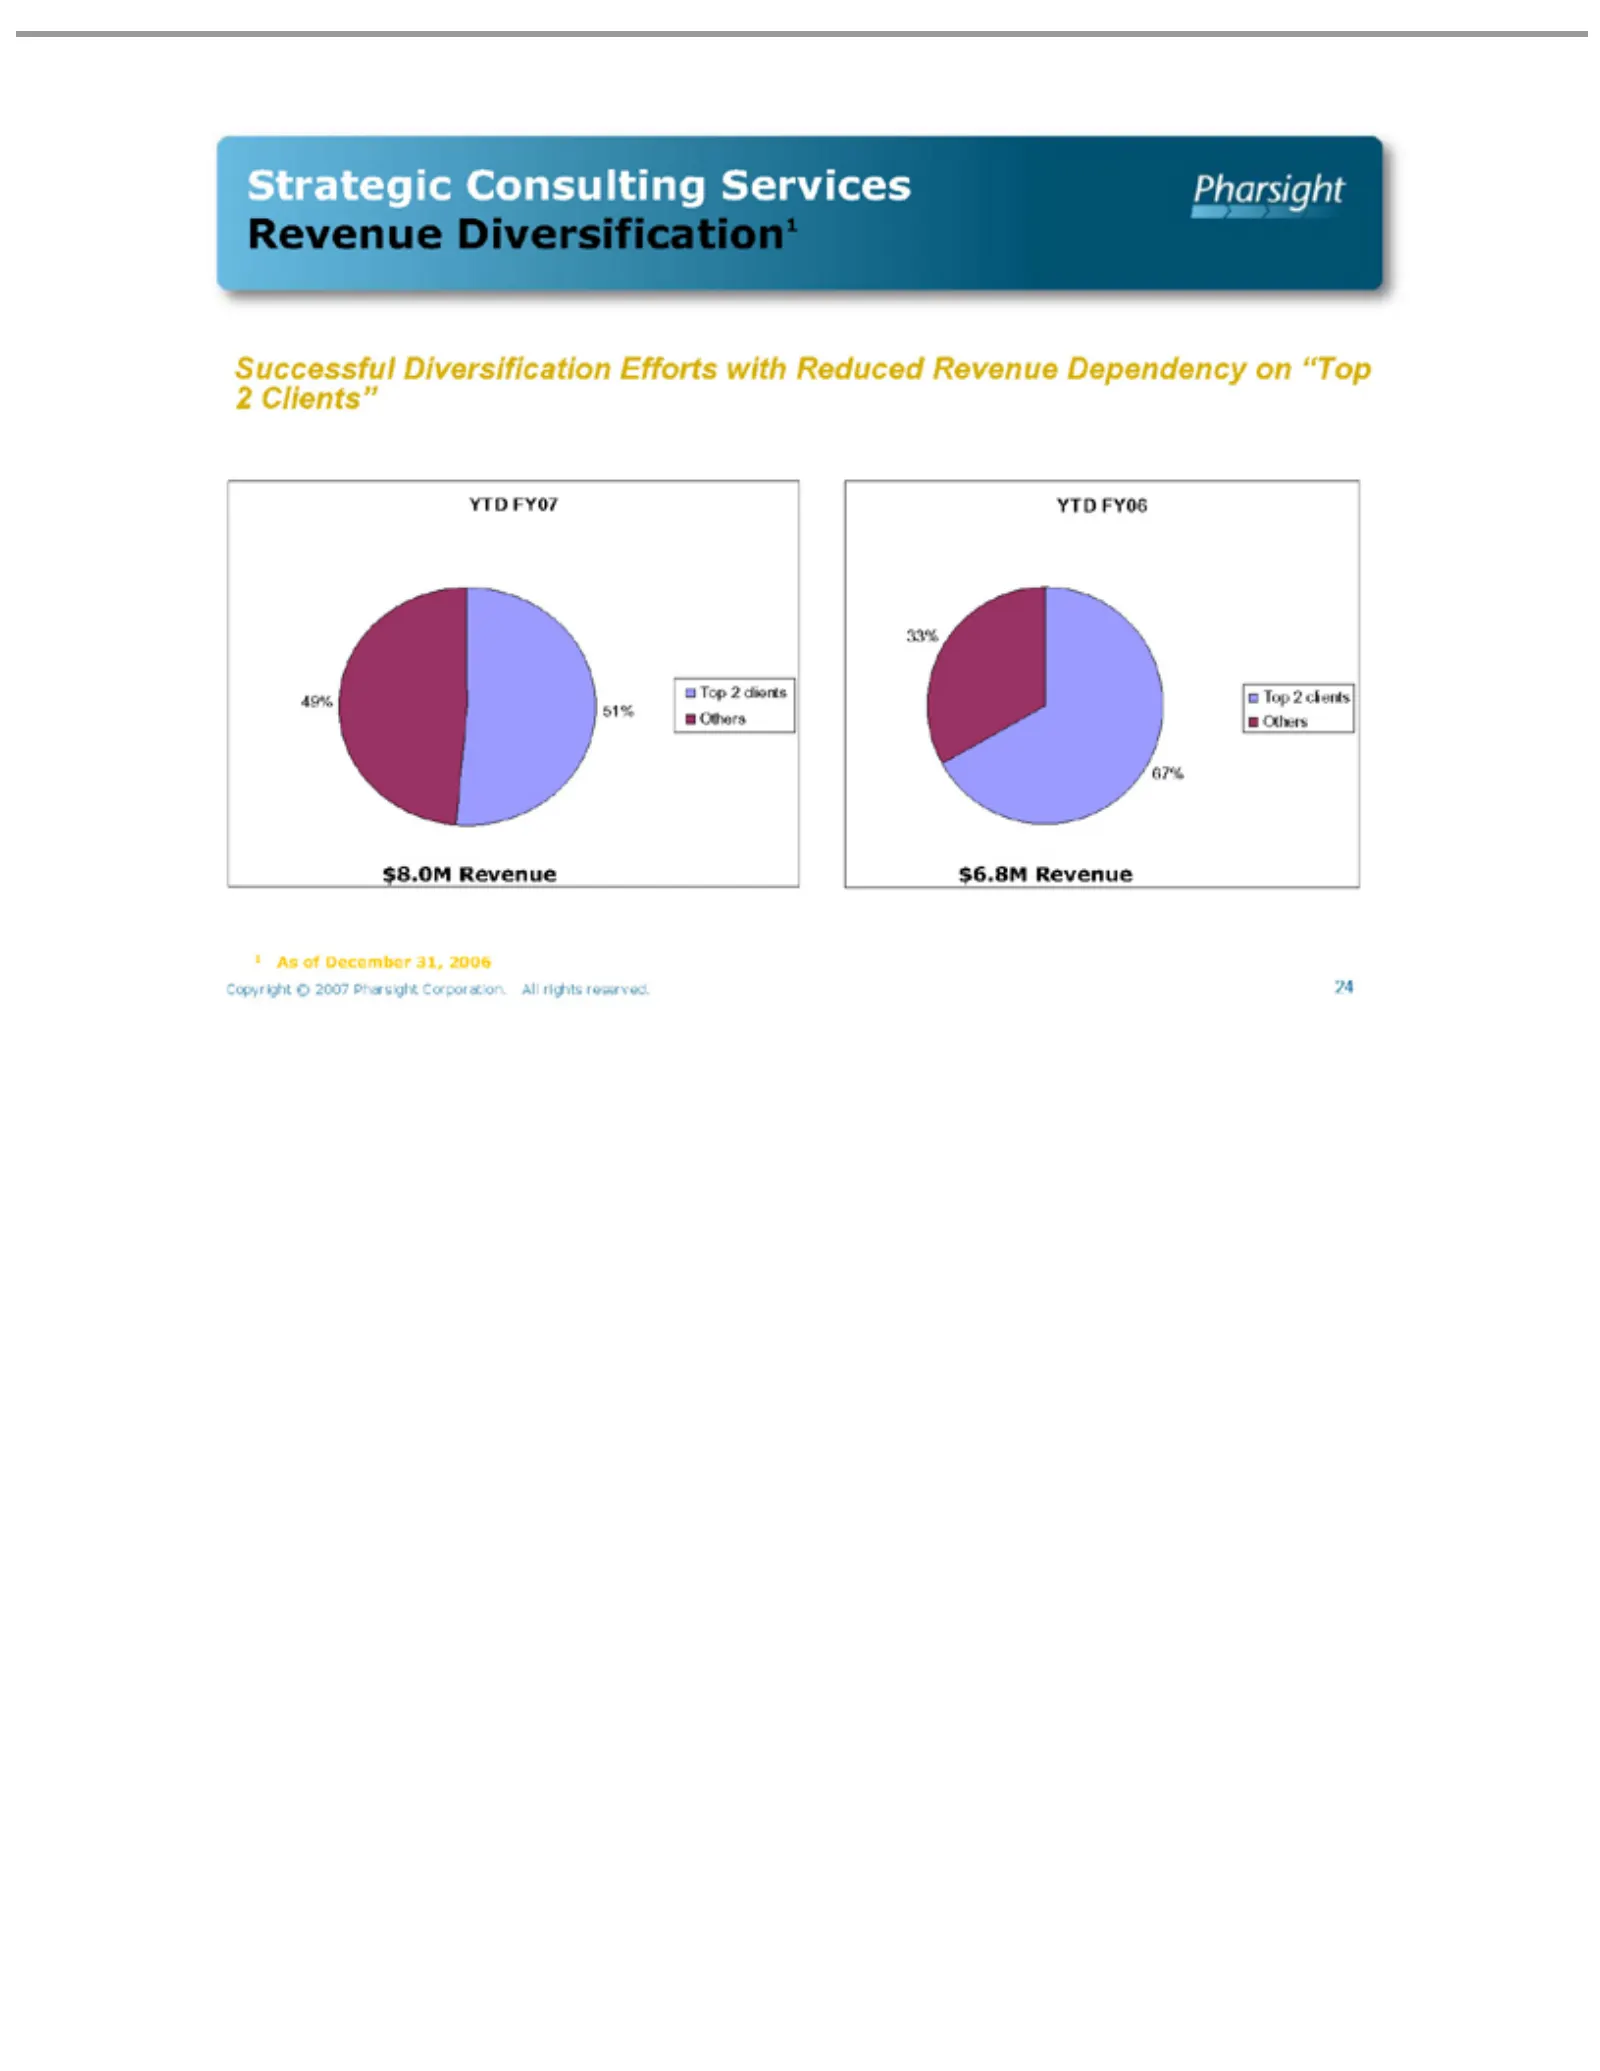
Slide 24: Consulting Revenue Diversification
Strategic Revenue Successful $8.0M 51% 49% YTD Top 33% $6.8M 67% Others 1 Copyright 24As2of FY07 FY06 clients Revenue December Diversification1 Consulting © Diversification 2007 31, Pharsight Services 2006Efforts Corporation. with Reduced All rights Revenue reserved. Dependency on “Top 2 Clients”
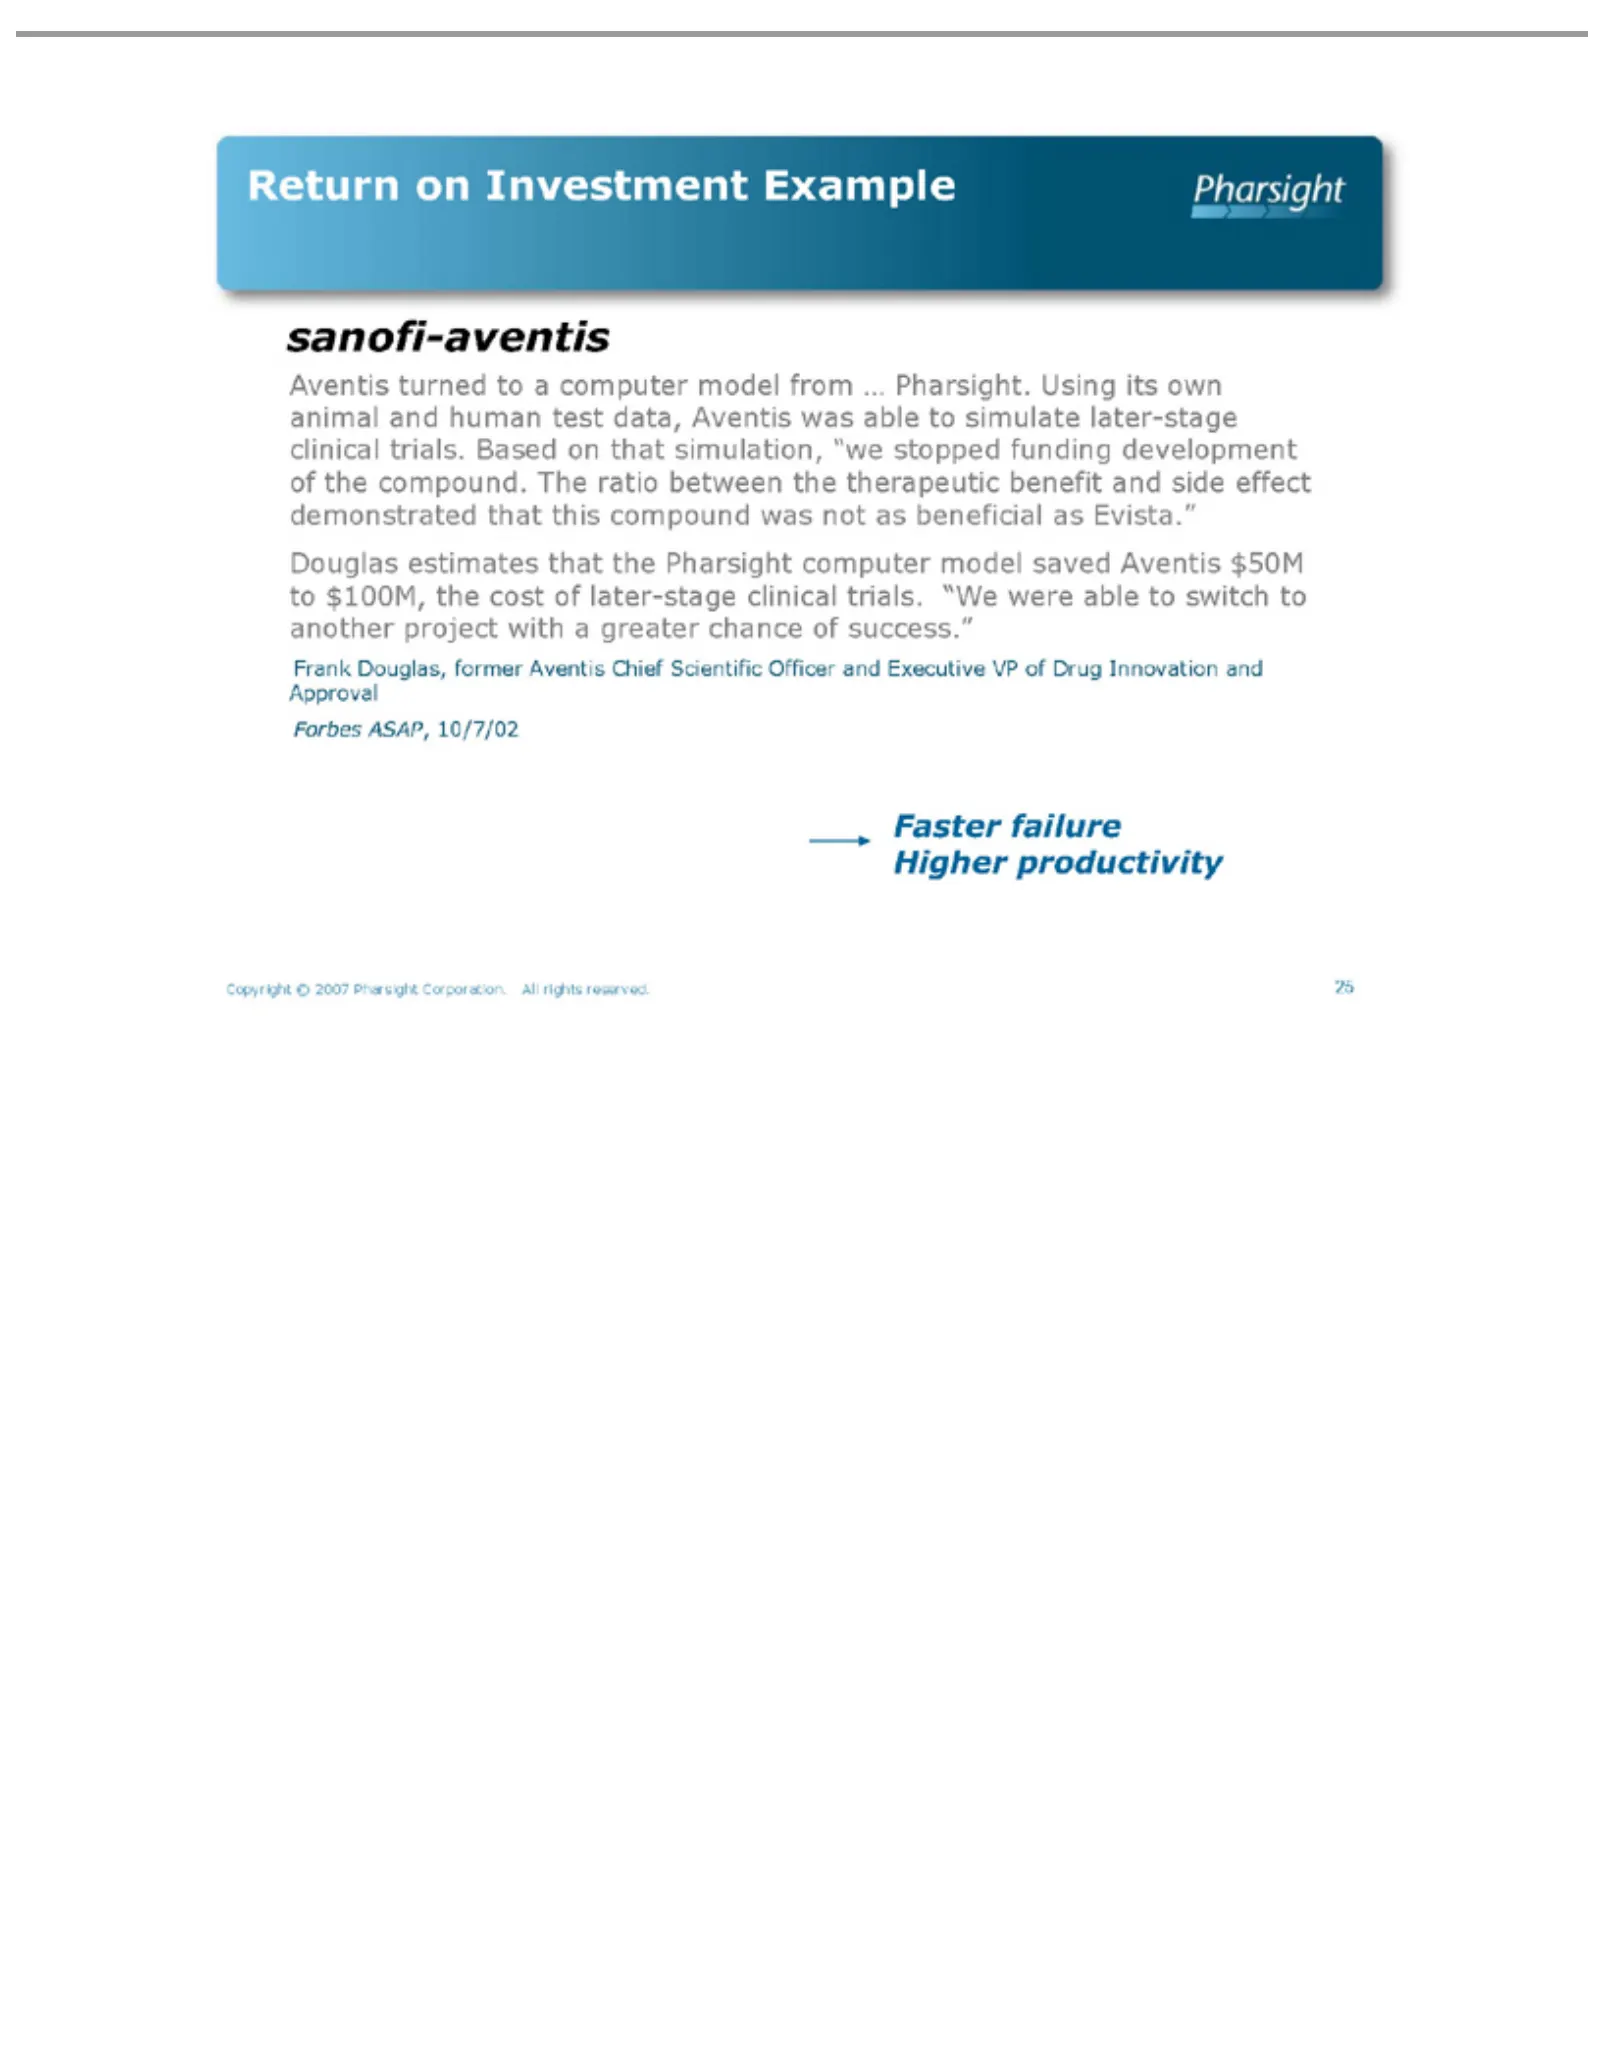
Slide 25: Higher Productivity Example: Aventis
ReturnDouglas, Aventis sanofi-aventis development Douglas Frank Forbes Faster Higher Copyright 25 failure ASAP, on productivity turned estimates Investment © 2007 of10/7/02 toformer the athat Pharsight computer compound. Example the Aventis Pharsight Corporation. model Chief The ratio from computer
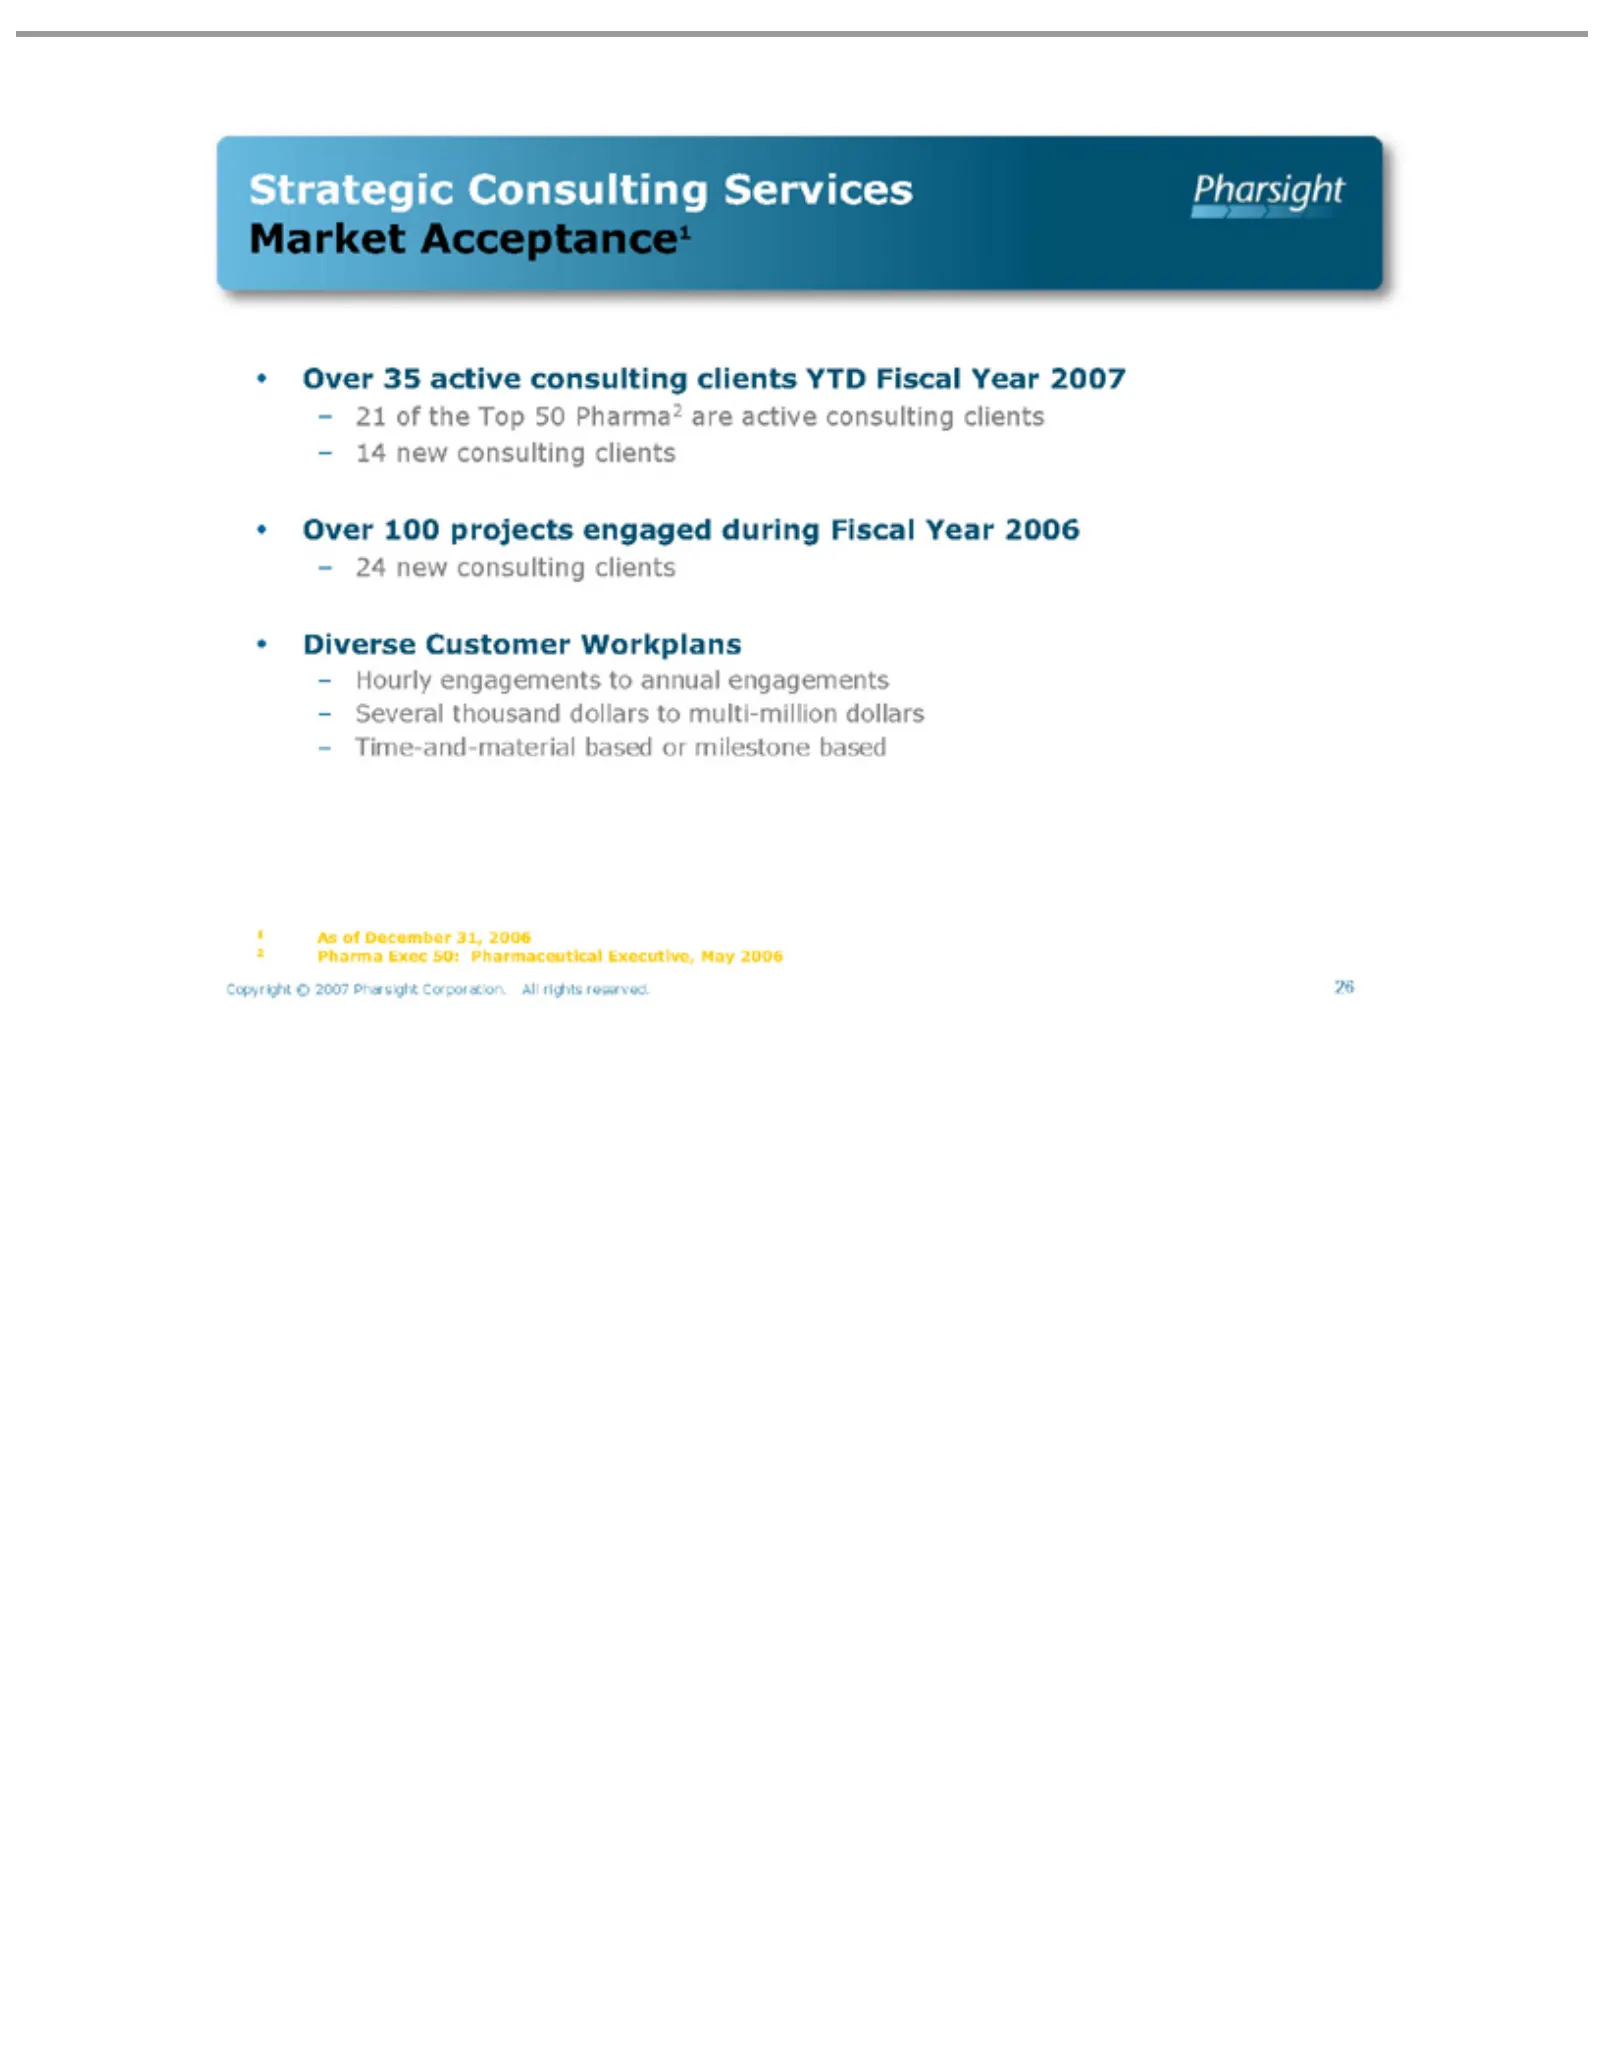
Slide 26: Strategic Consulting Market Acceptance
Strategic •Market – 1 2 Copyright 26Over Diverse As Time-and-material 21 new 14 24 Hourly Several Pharma of100 35 Acceptance1 the December Consulting engagements consulting Customer thousand Exec active © Top projects 2007 50: 50 consulting 31, Pharsight Pharma2 Pharmaceutical dollars engaged Workpl
Slide 27: Financial Overview
Financial Overview Confidential © Pharsight Corporation
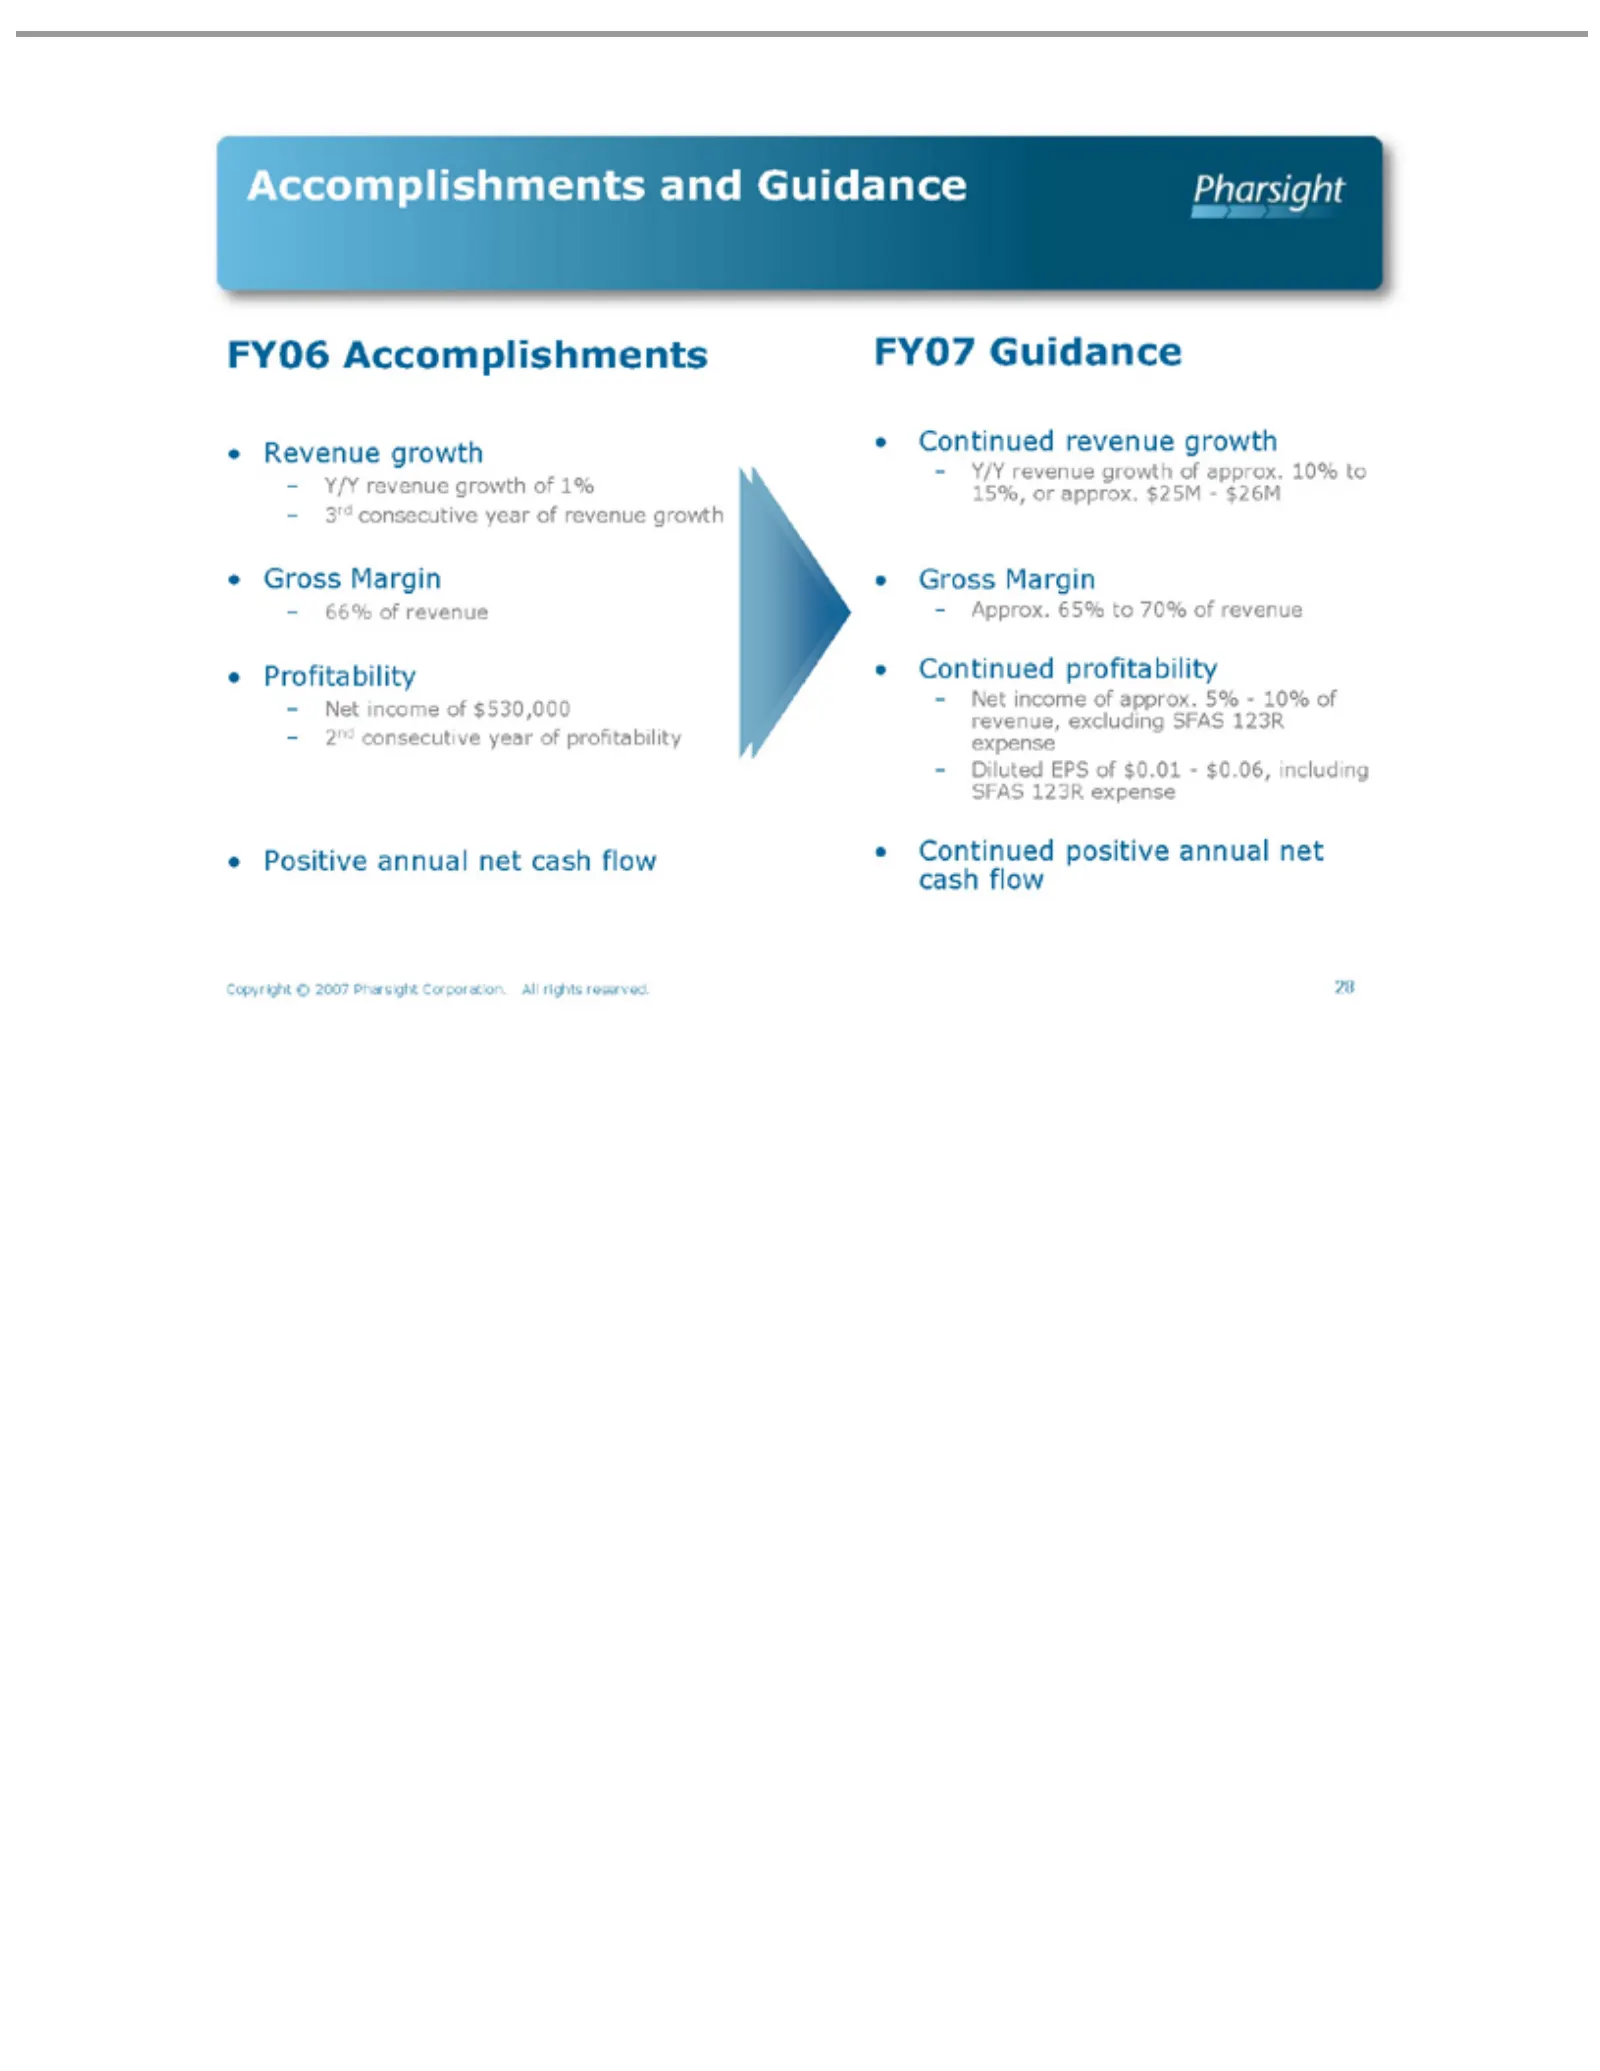
Slide 28: Accomplishments and FY07 Guidance
Accomplishments FY06 FY07 •– Copyright 28Revenue Profitability Positive Gross Continued Approx. Y/Y 3rd consecutive 66% 2nd Net Diluted income Accomplishments consecutive Guidance revenue ofMargin revenue EPS annual 65% © growth revenue profitability positive 2007 ofof growth toapprox. $530,000 net
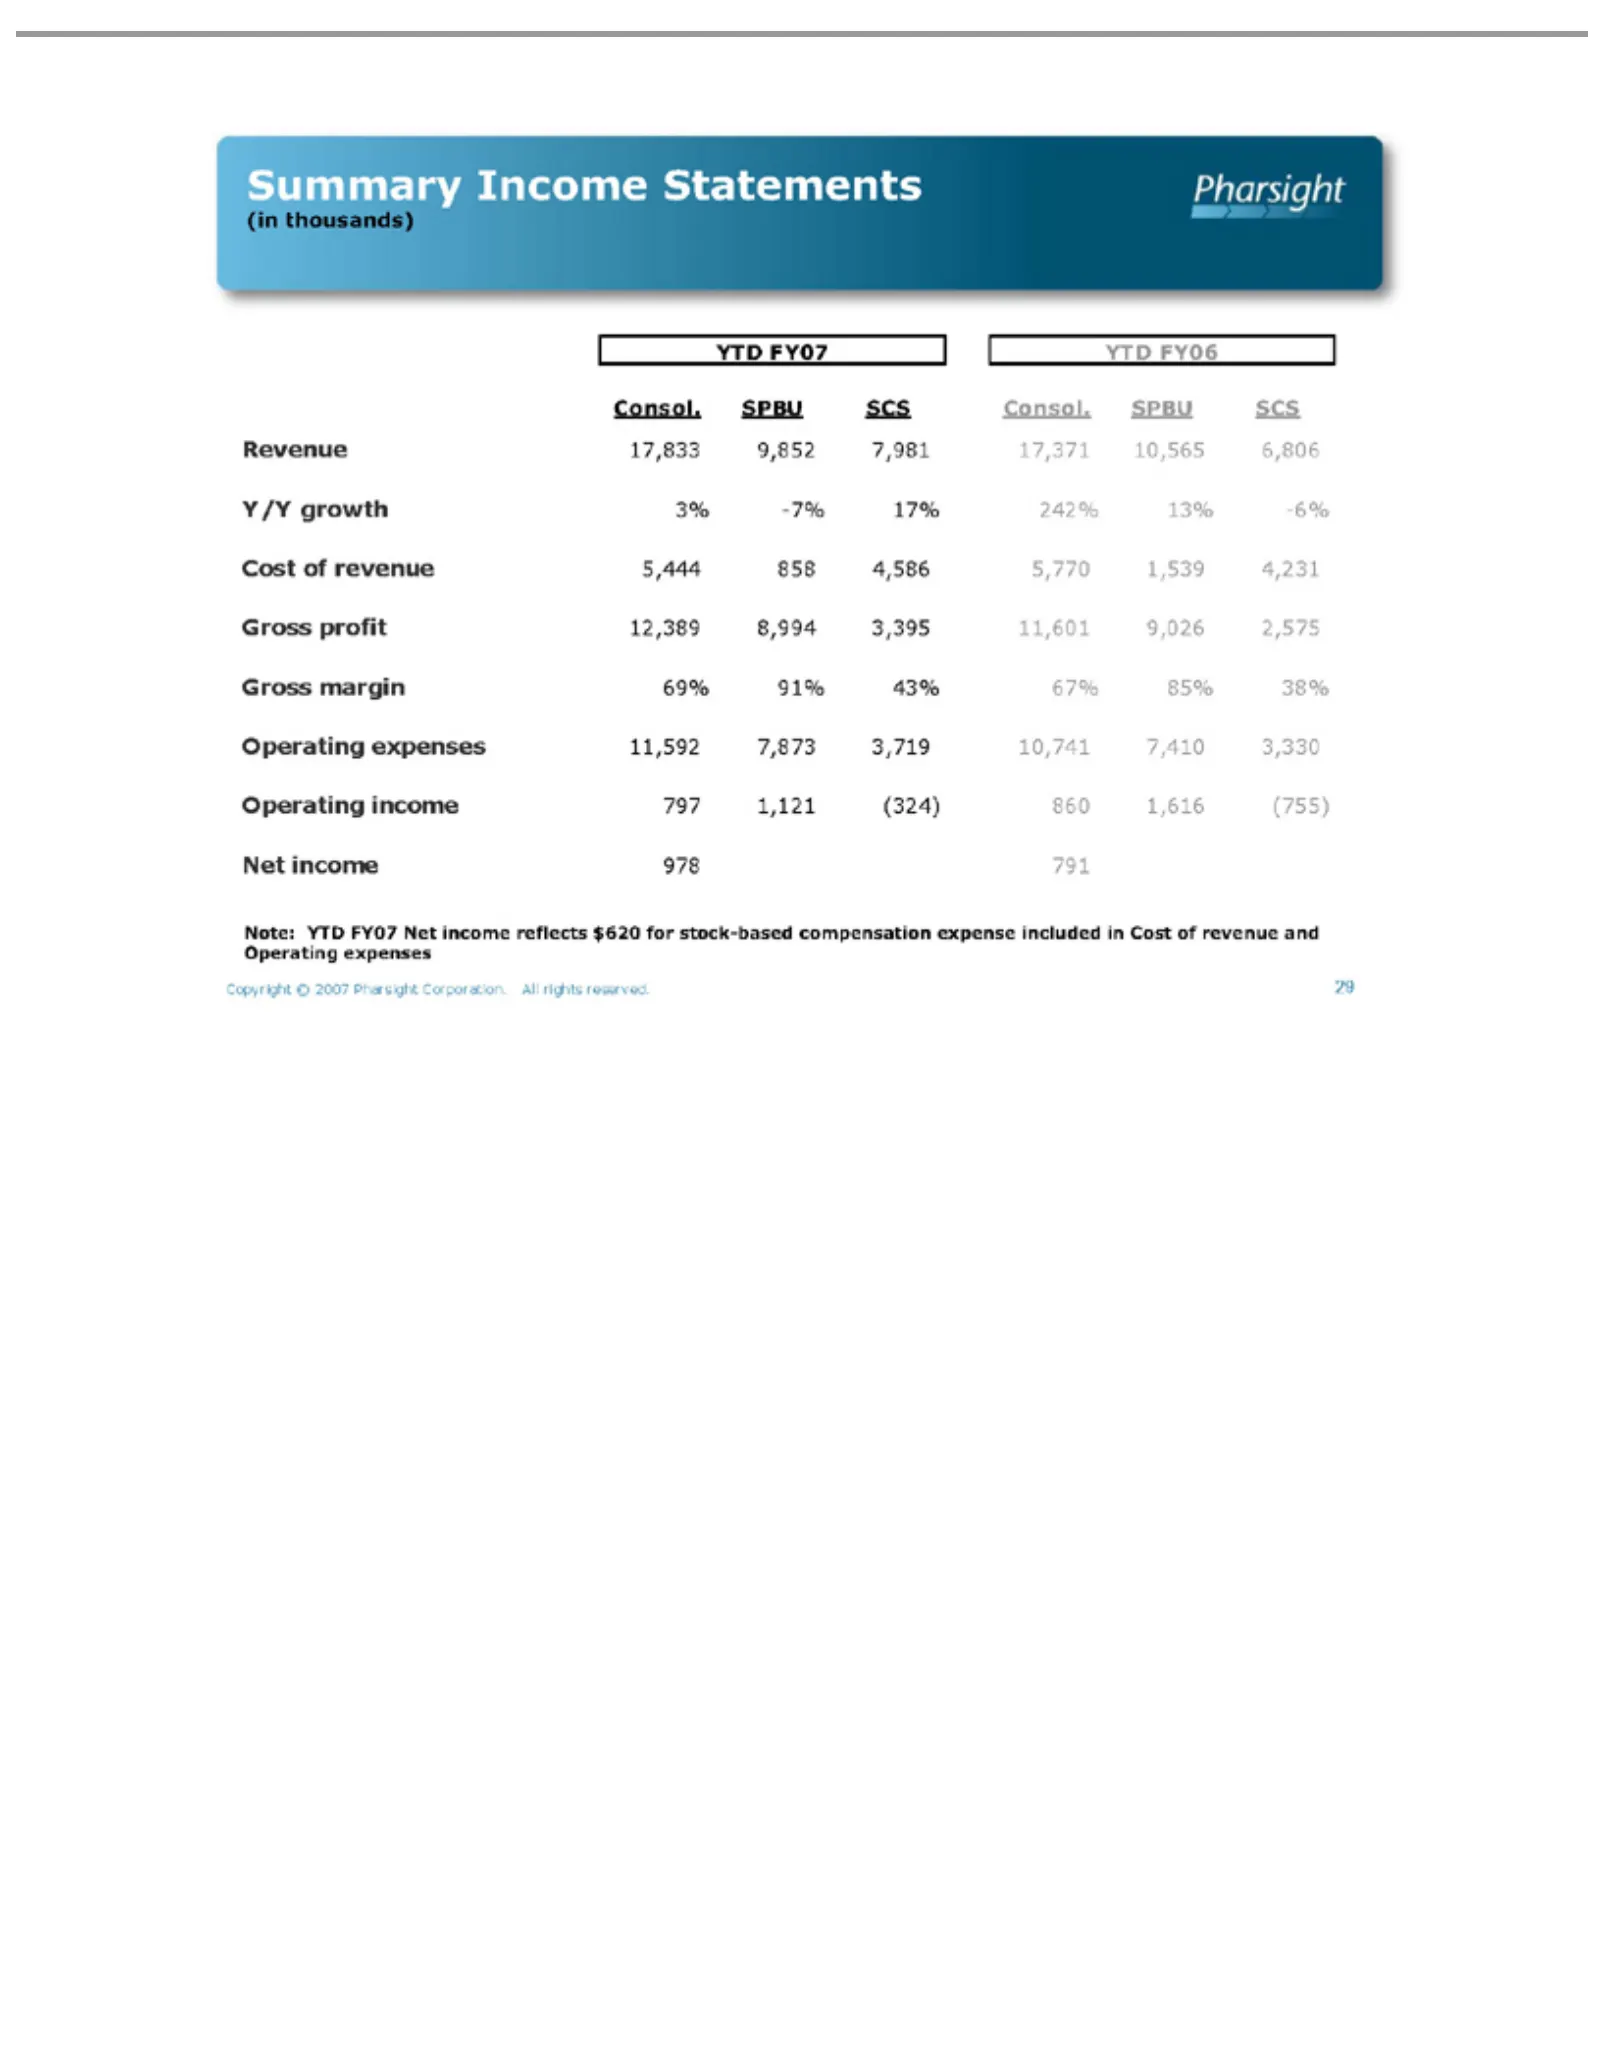
Slide 29: Summary Income Statements
Summary (in thousands) Income Statements FY07 YTD FY06 YTD Revenue Consol. SPBU SCS Consol. SPBU SCS Y/Y growth 17,833 9,852 7,981 17,371 10,565 6,806 Cost of revenue 3% -7% 17% 242% 13% -6% Gross profit 5,444 858 4,586 5,770 1,539 4,231 Gross margin 12,389 8,994 3,395 11,601 9,026 2,575 Operating e
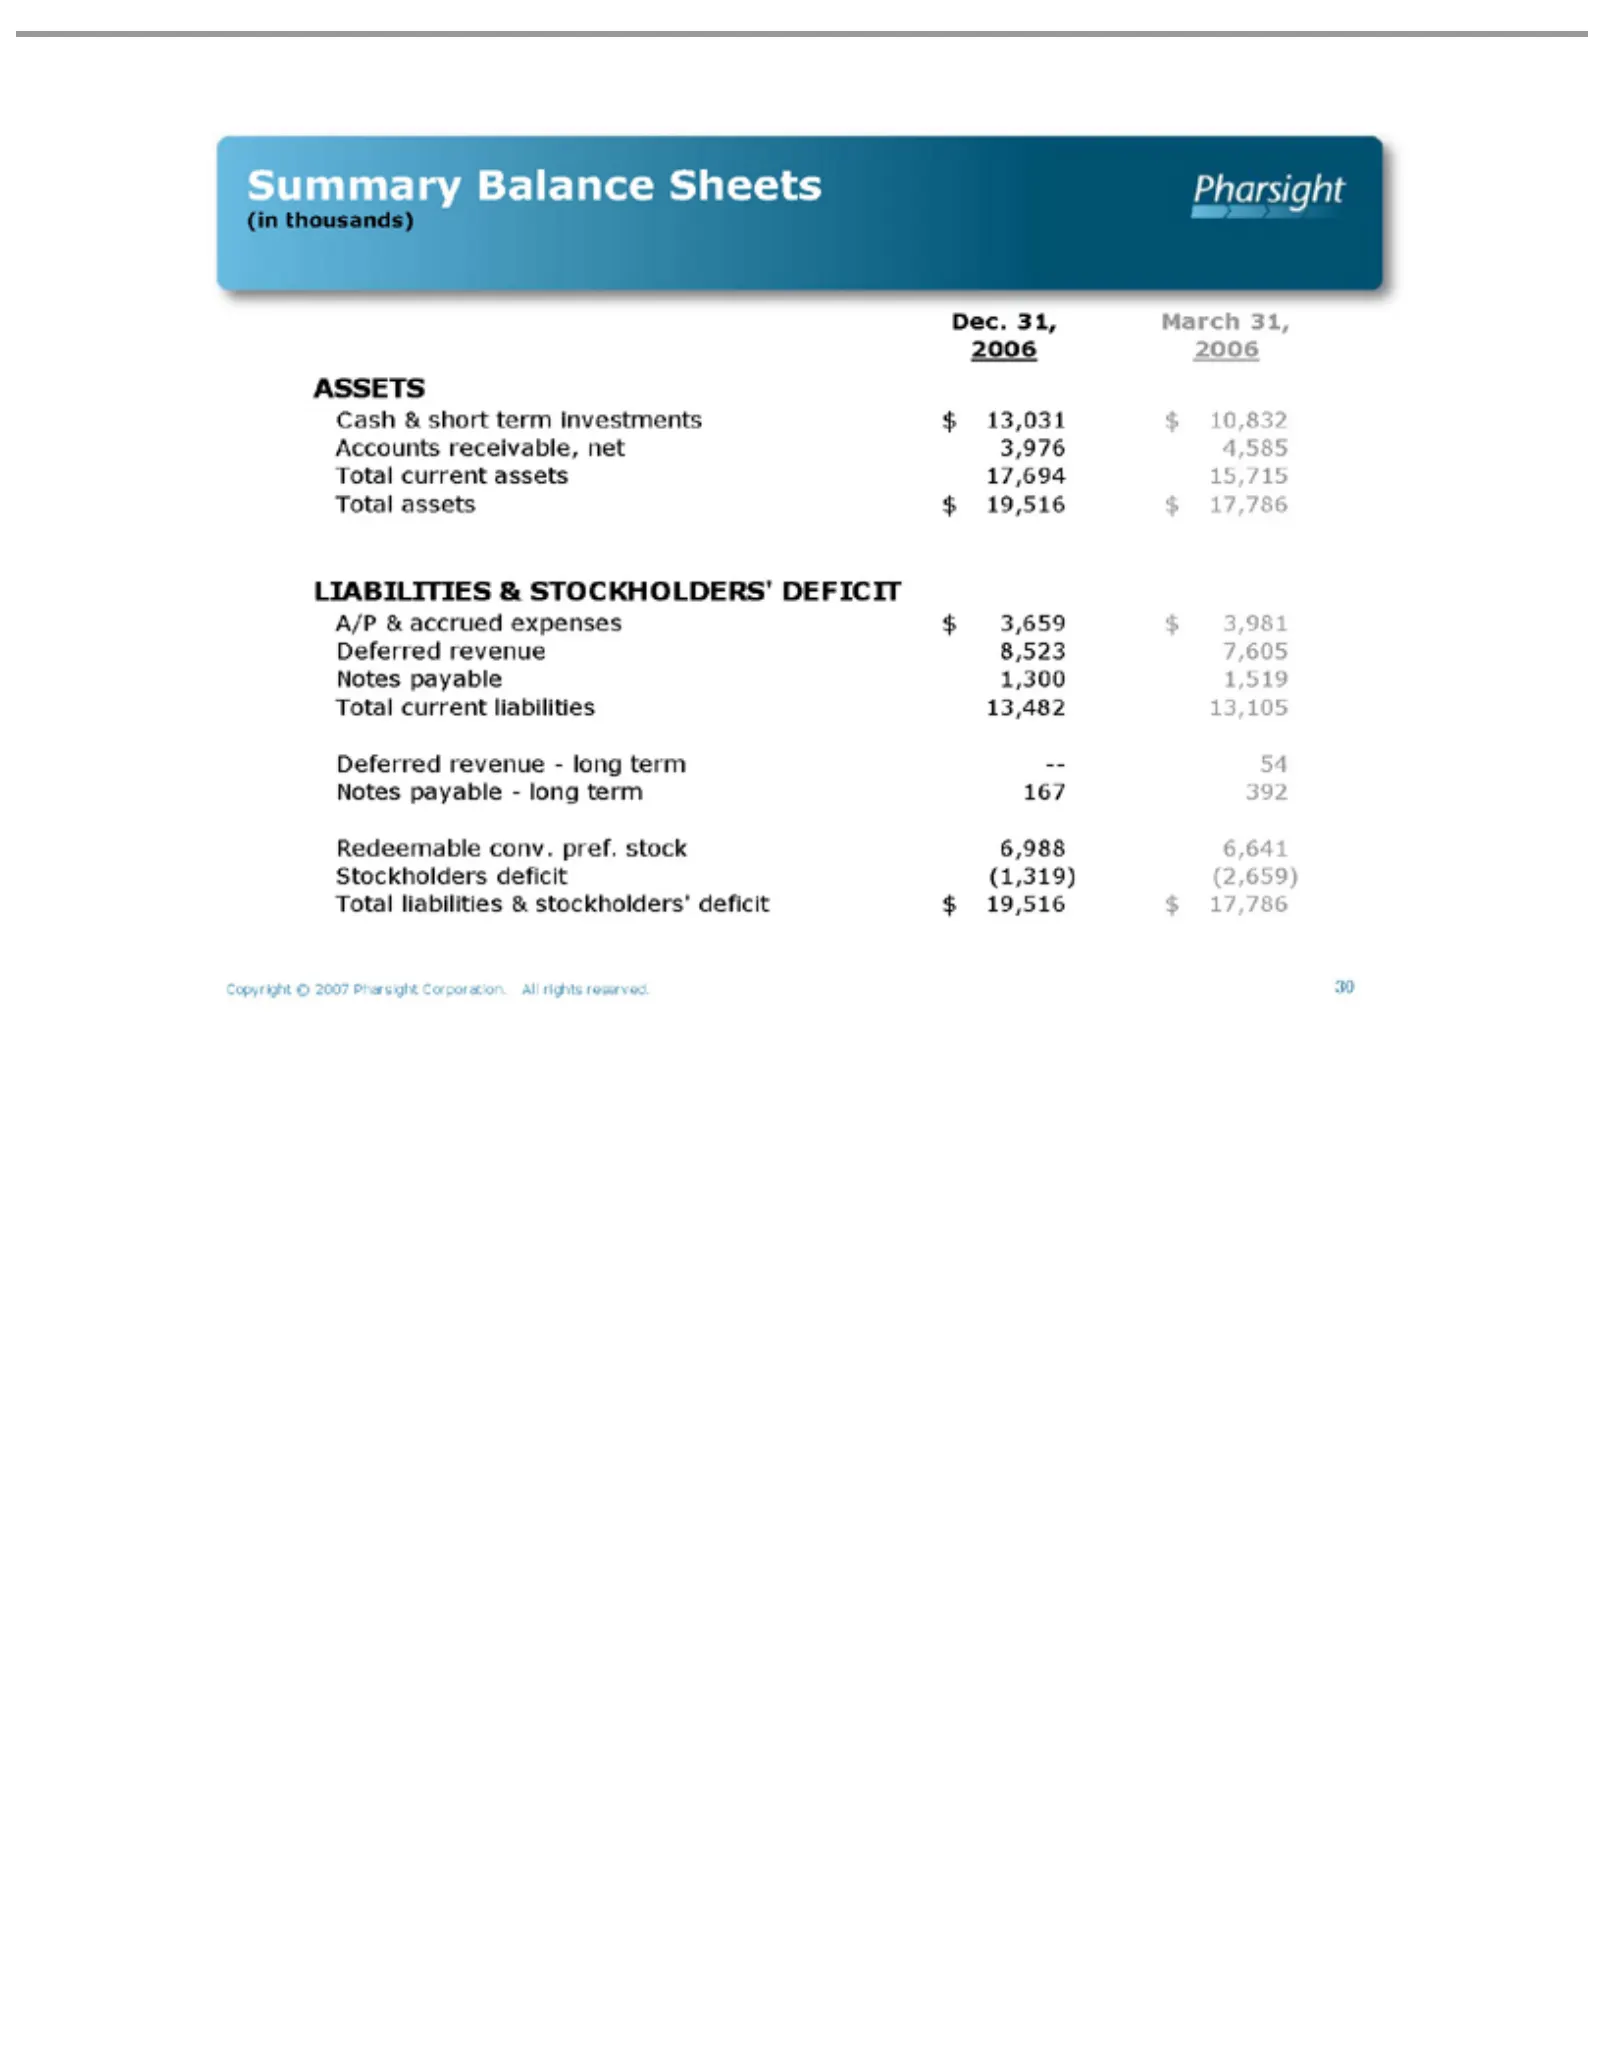
Slide 30: Summary Balance Sheets
(in thousands) Summary Balance Sheets ASSETS Dec.2006 31, March2006 31, Cash & short term investments Accounts receivable, net $ 13,031 $ 10,832 Total current assets 3,976 4,585 Total assets 17,694 15,715 LIABILITIES & STOCKHOLDERS’ DEFICIT $ 19,516 $ 17,786 A/P & accrued expenses Deferred revenue $
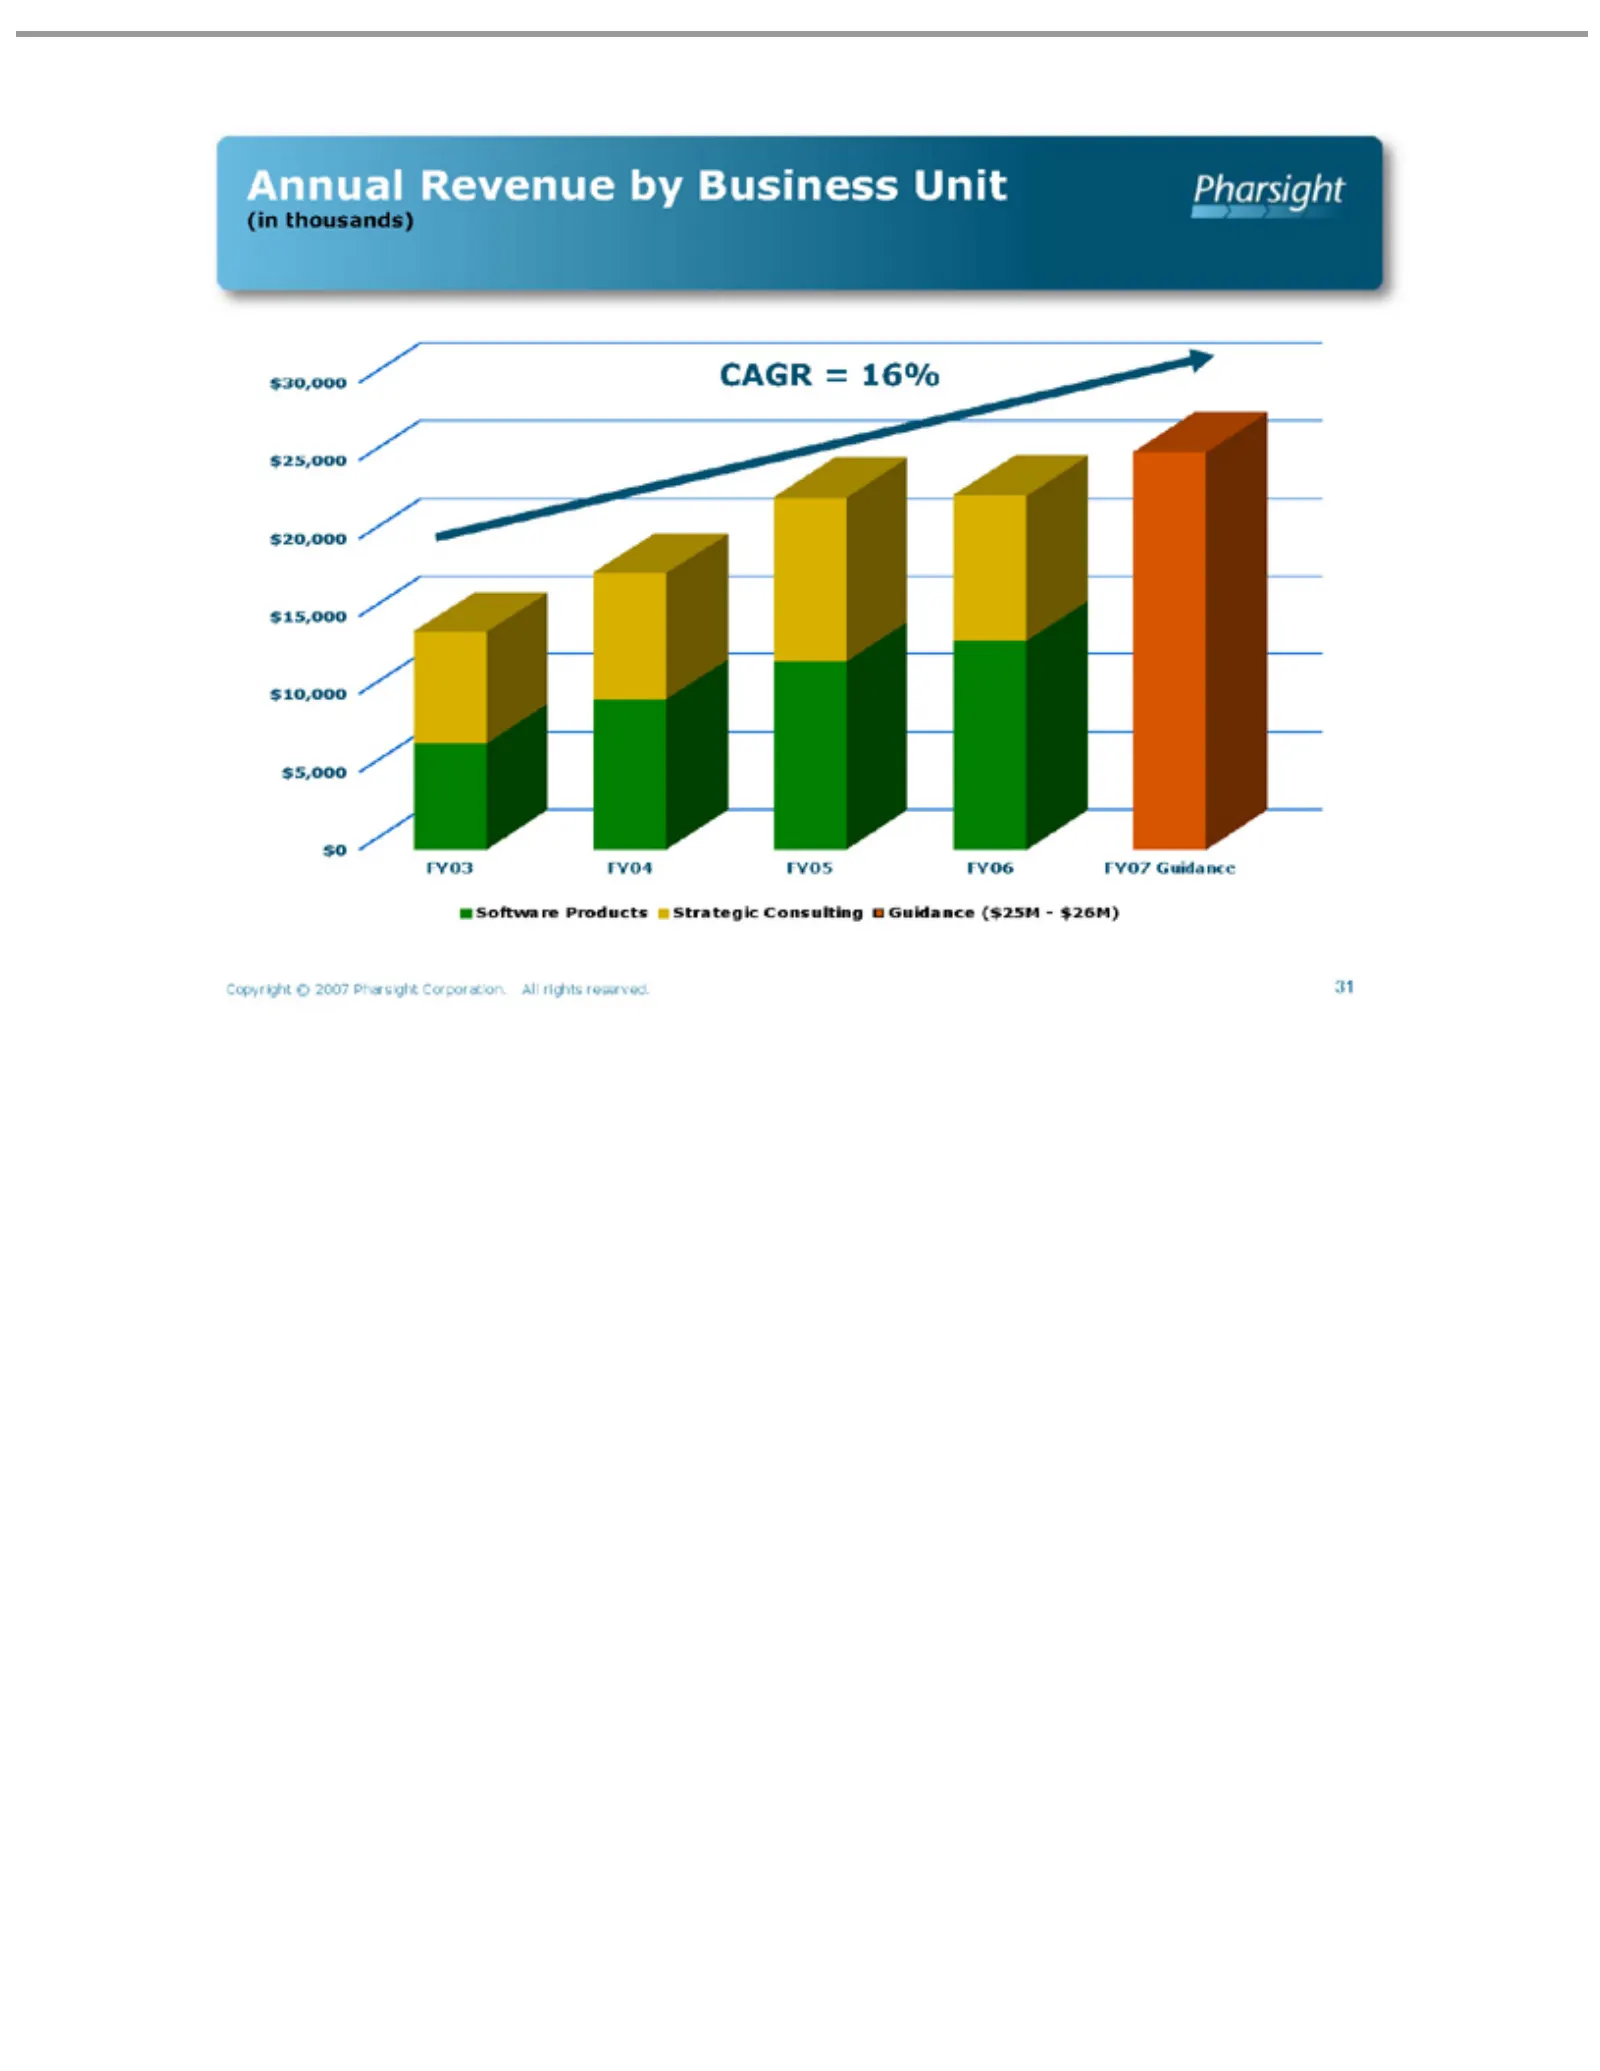
Slide 31: Annual Revenue by Business Unit
Annual (in thousands) Revenue by Business Unit CAGR = 16% $30,000 $25,000 $20,000 $15,000 $10,000 $5,000 $0 FY03 Software Products Copyright 31 © 2007 Pharsight Strategic Consulting Corporation. Guidance All rights ($25M reserved. - $26M) FY04 FY05 FY06 Guidance FY07
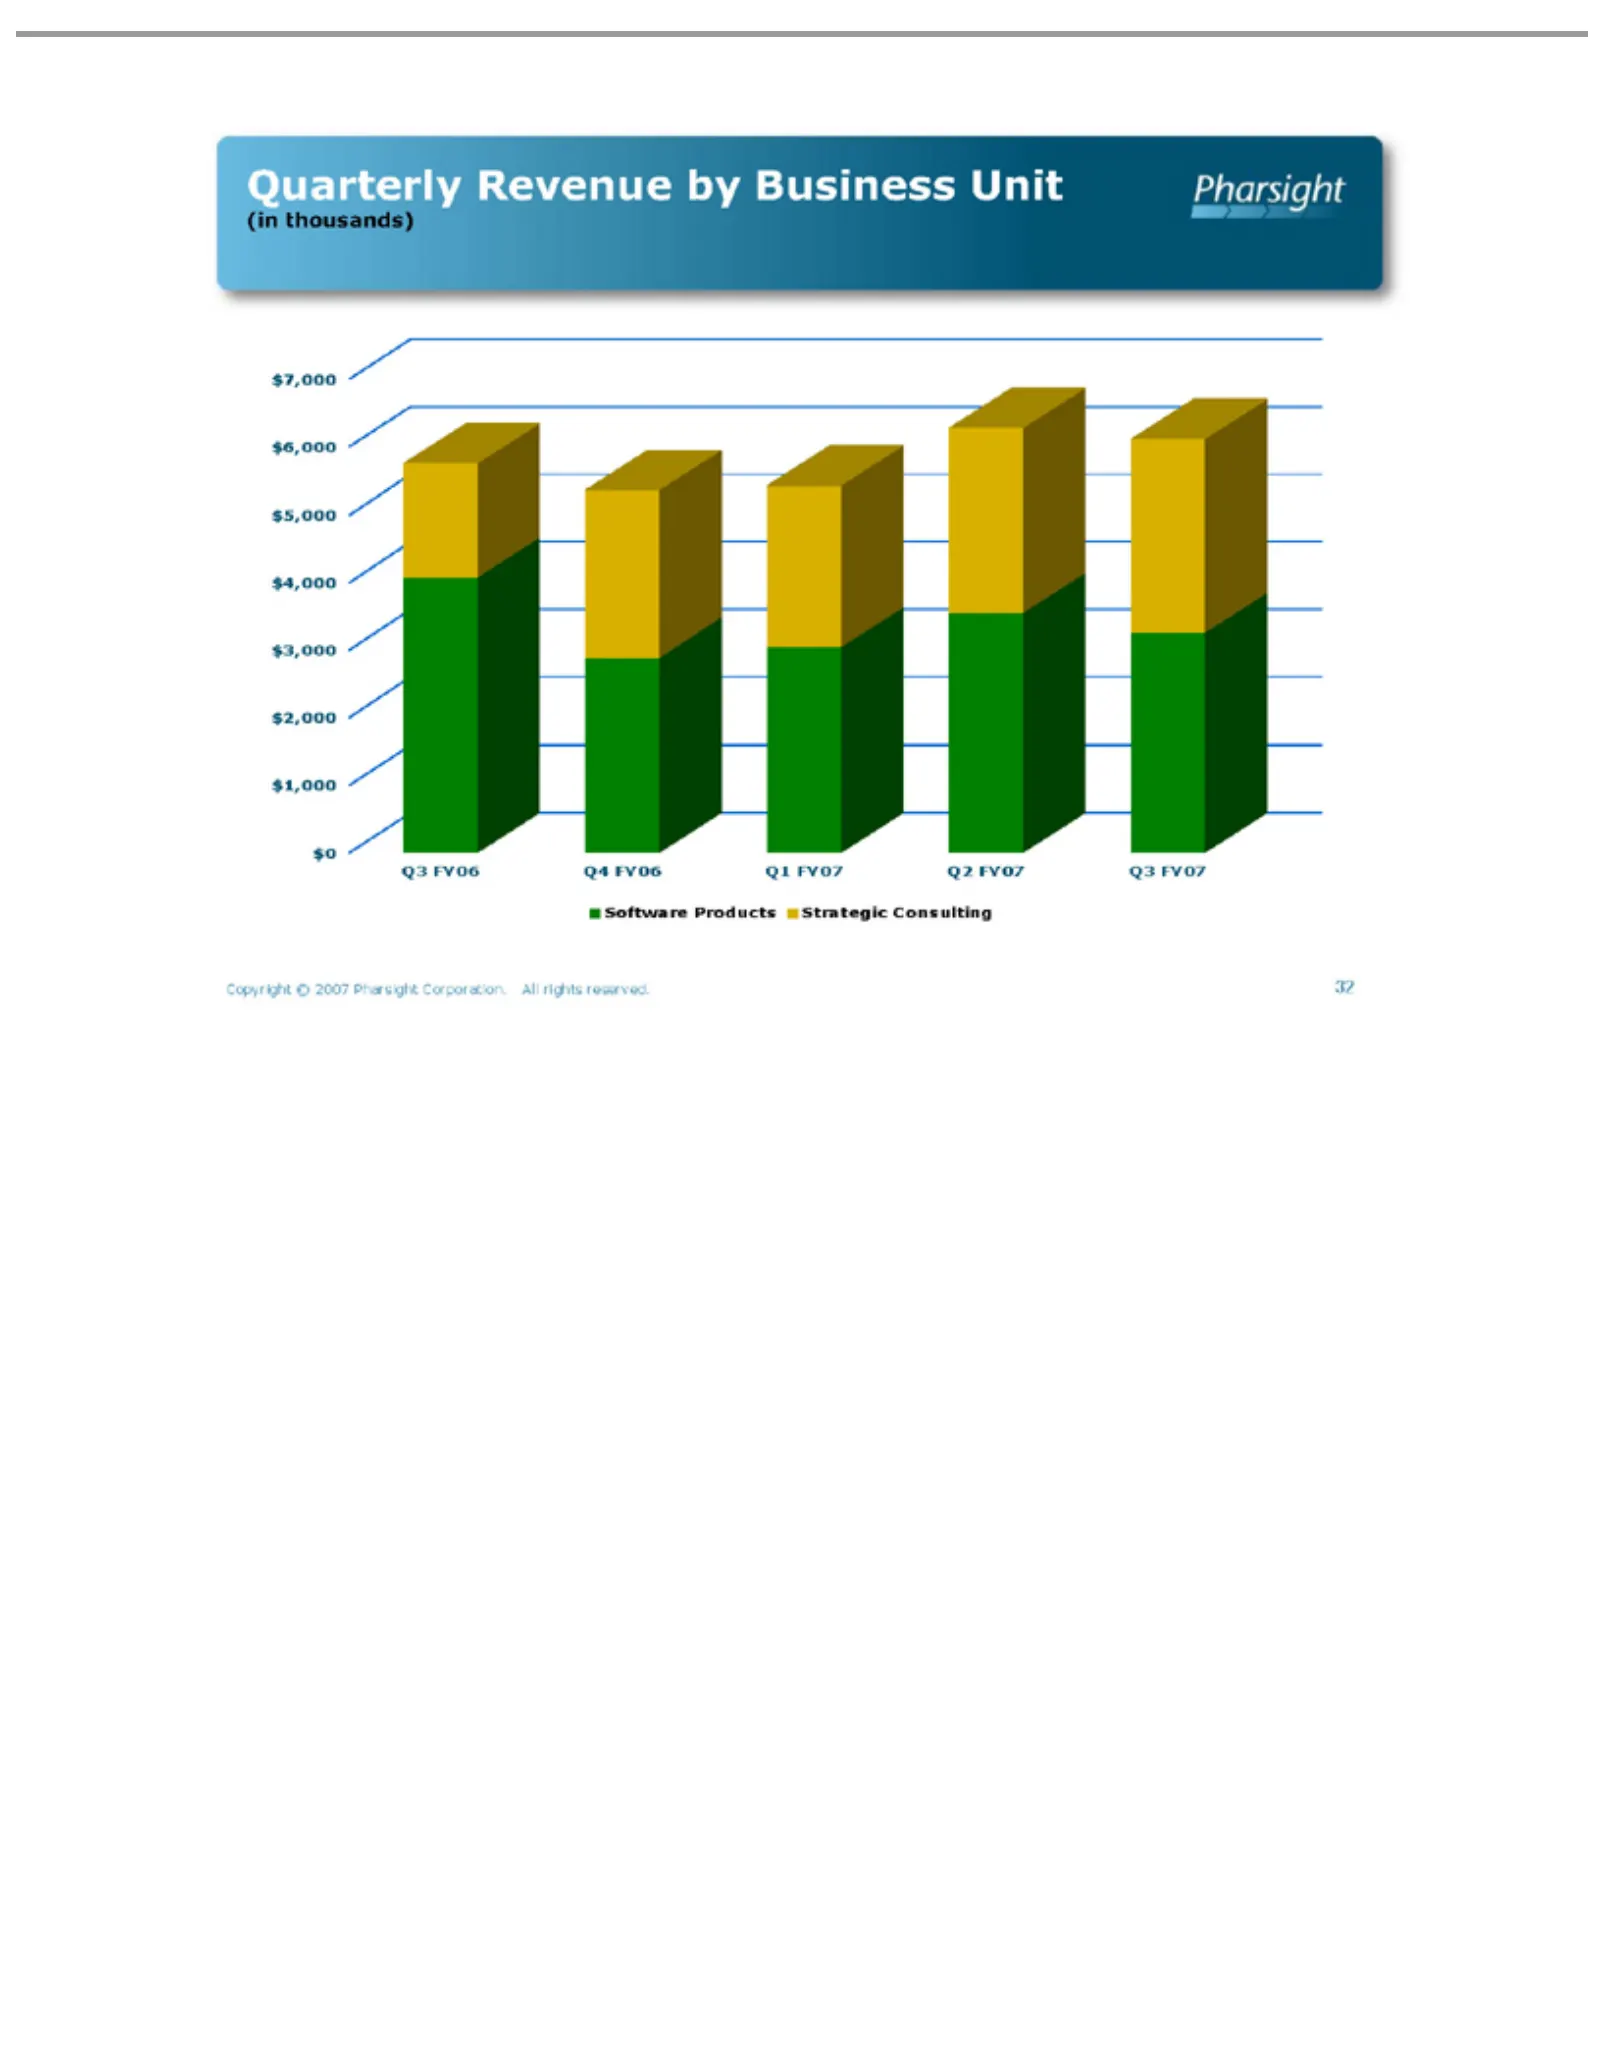
Slide 32: Quarterly Revenue by Business Unit
Quarterly (in $ 7,000 thousands) Revenue by Business Unit $6,000 $5,000 $4,000 $3,000 $2,000 $1,000 $0 Q3 FY06 Software Products Copyright 32 © 2007 Pharsight Strategic Consulting Corporation. All rights reserved. Q4 FY06 Q1 FY07 Q2 FY07 Q3 FY07
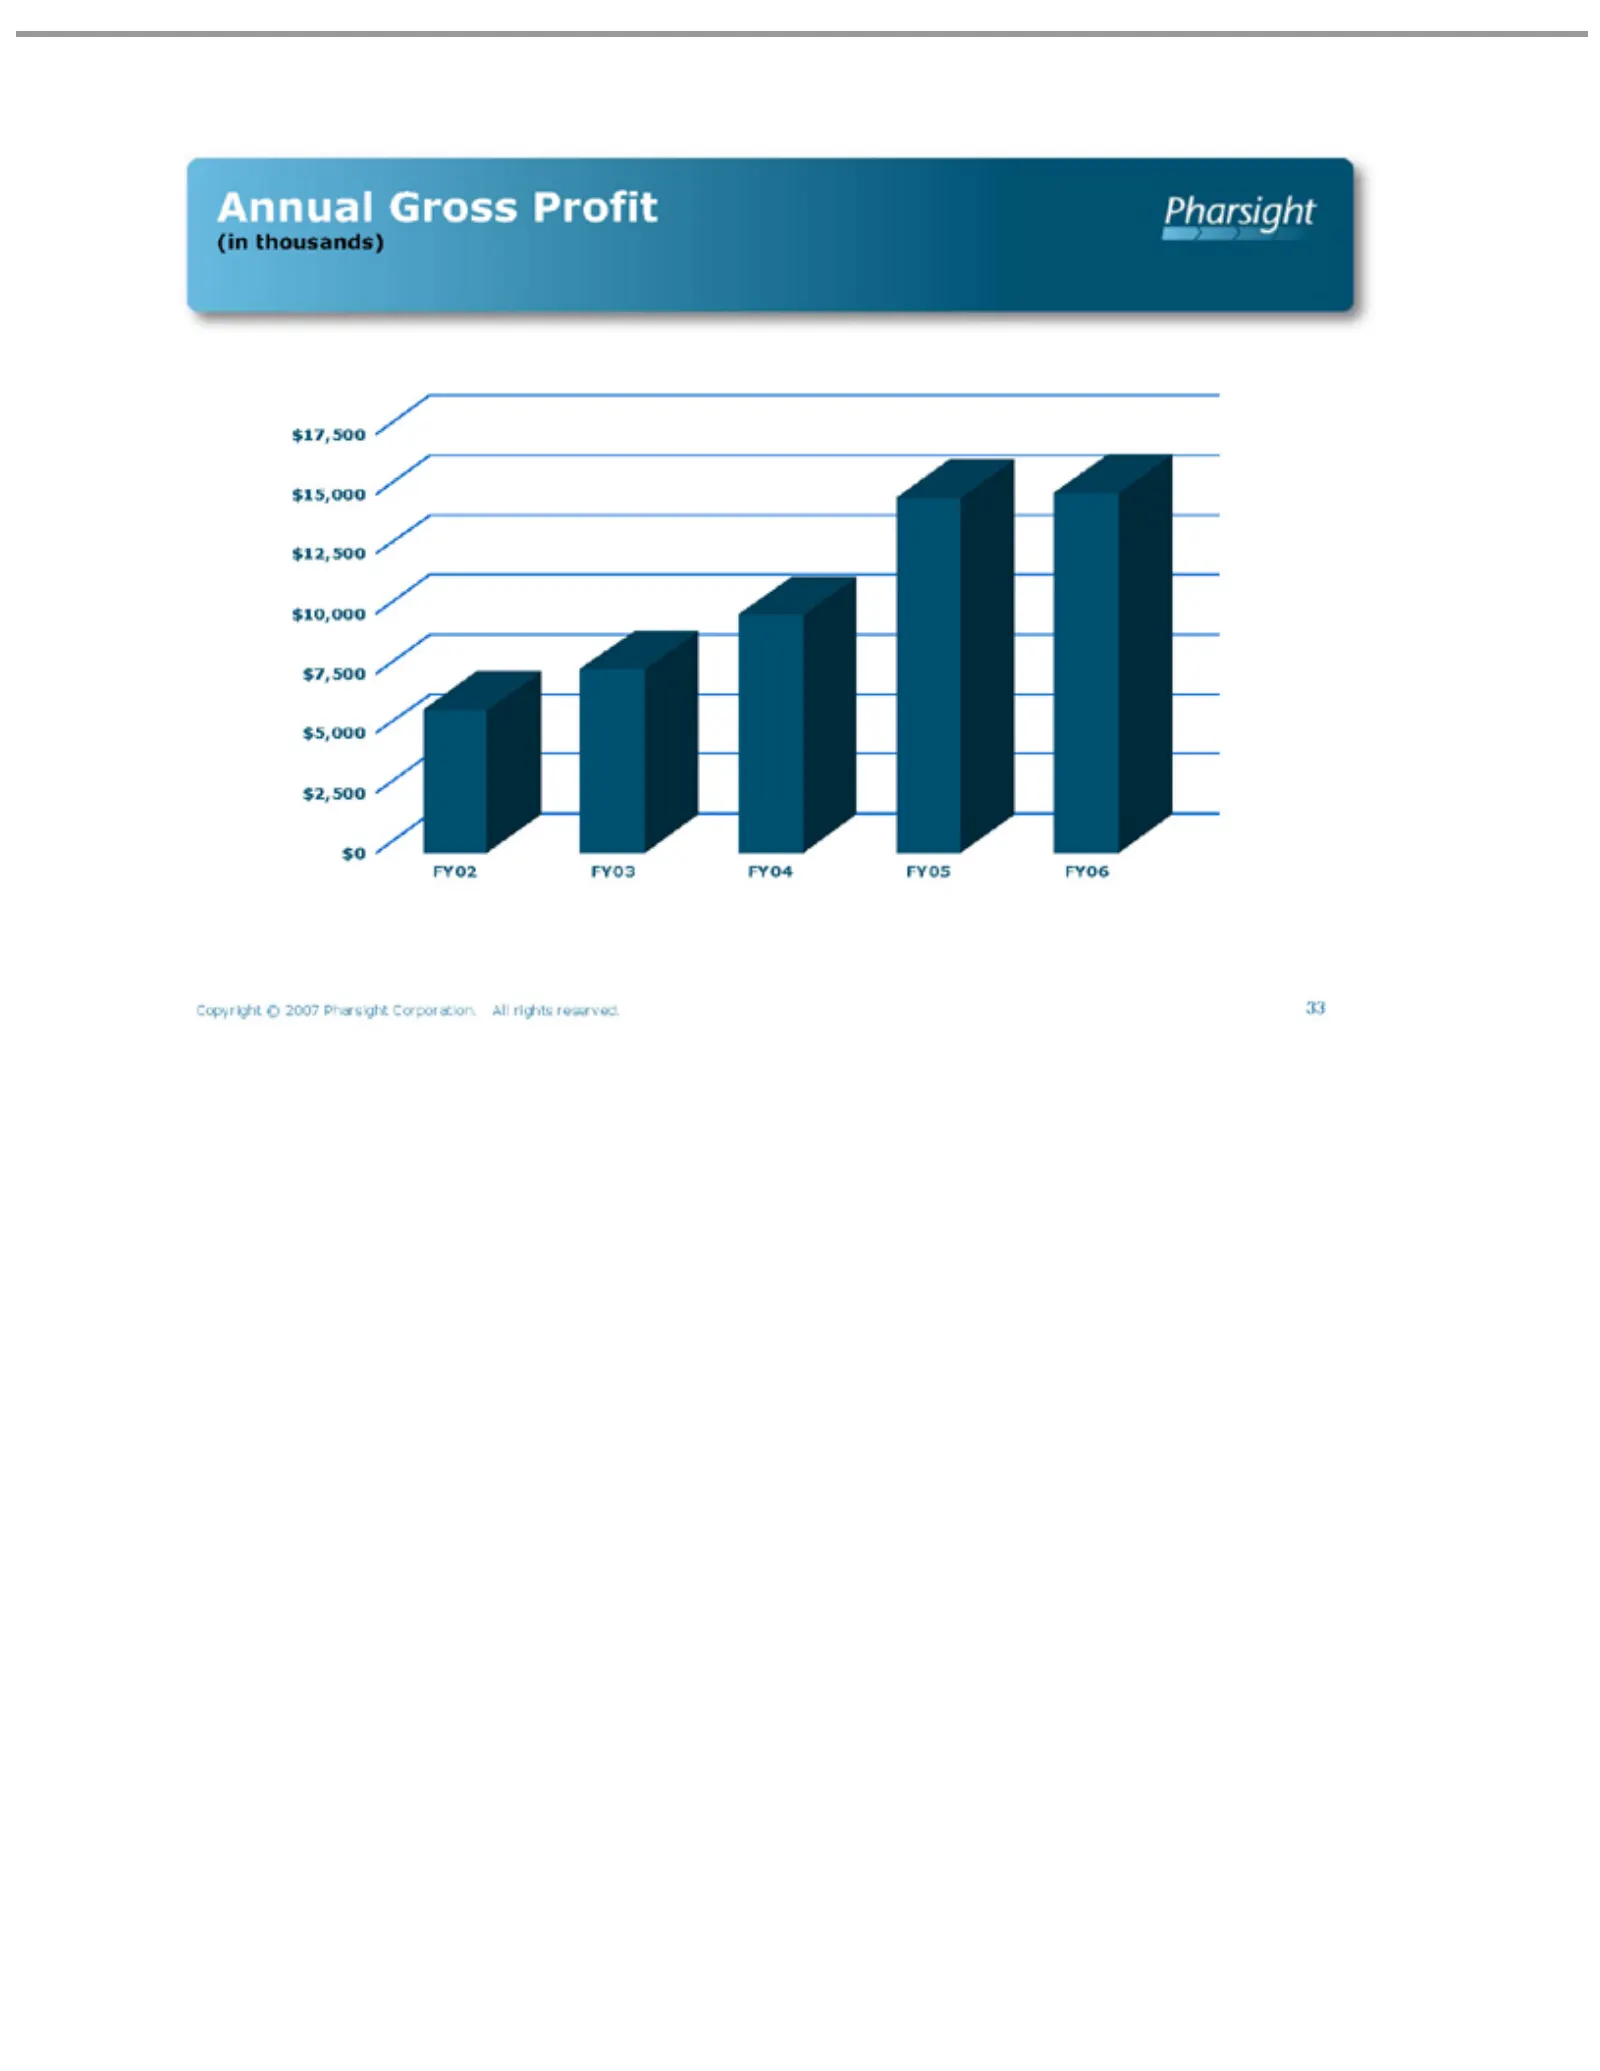
Slide 33: Annual Gross Profit
Annual Gr (in17,500 $ thousands) oss Profit $15,000 $12,500 $10,000 $7,500 $5,000 $2,500 $0 FY02 FY03 FY04 FY05 FY06 Copyright © 2007 Pharsight Corporation. All rights reserved. 33
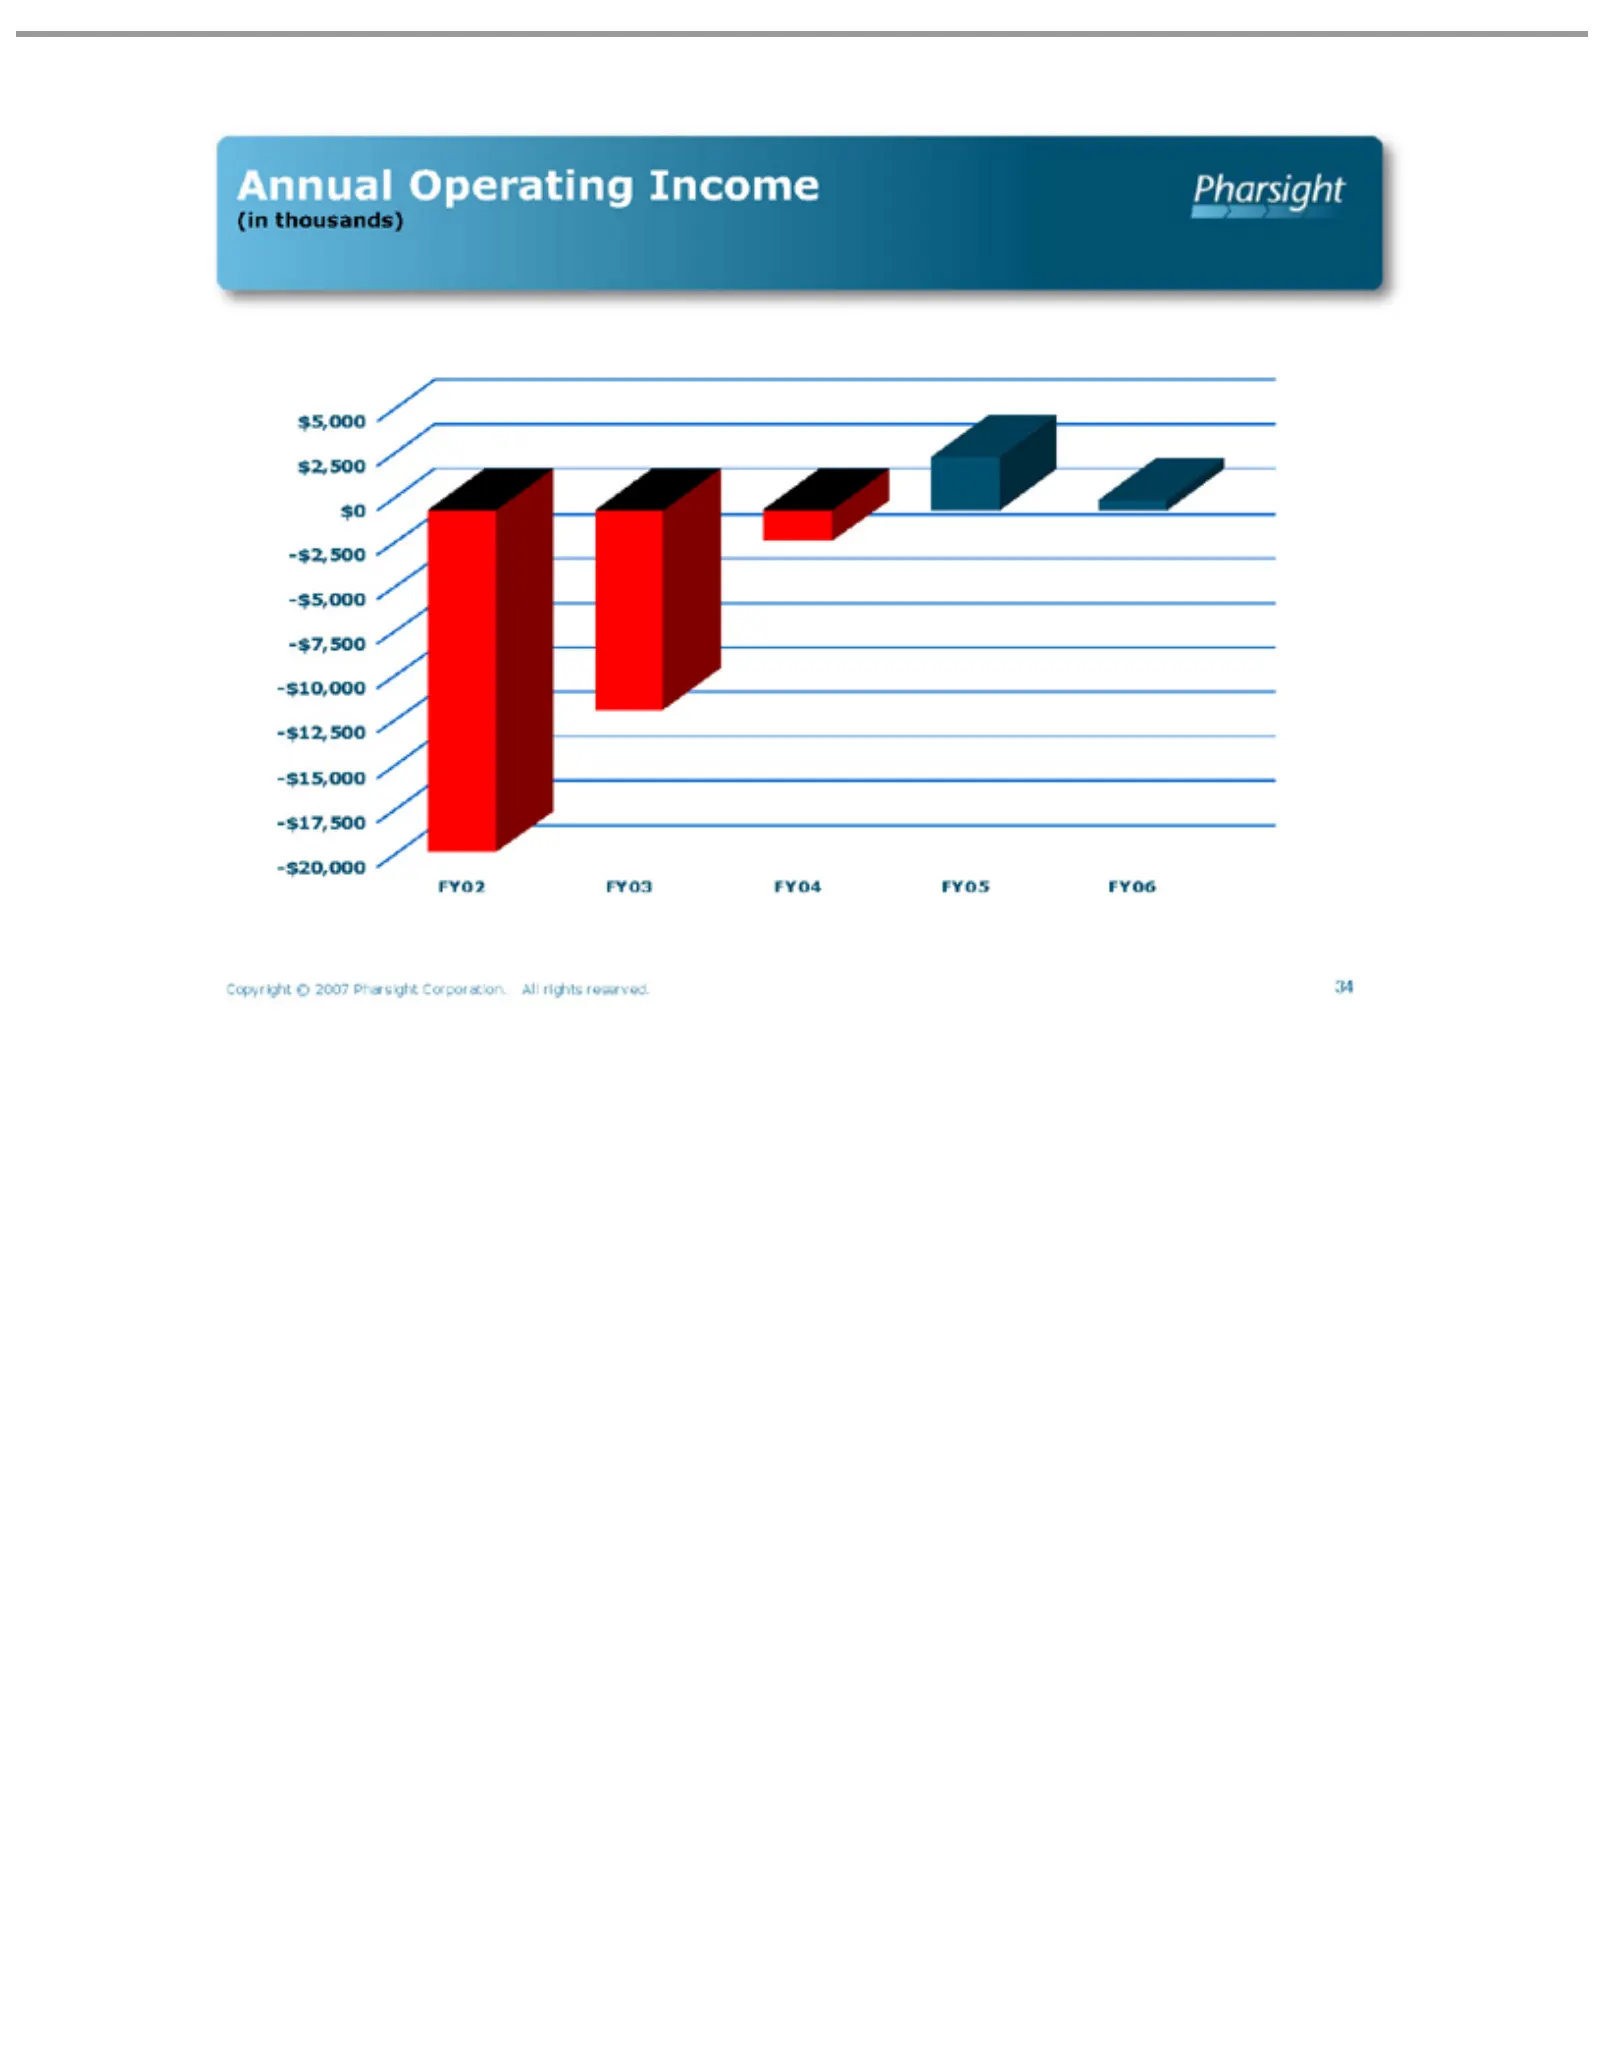
Slide 34: Annual Operating Income
Annual (in $5,000 thousands) Operating Income $2,500 $0 -$2,500 -$5,000 -$7,500 -$10,000 -$12,500 -$15,000 -$17,500 -$20,000 FY02 FY03 FY04 FY05 FY06 Copyright © 2007 Pharsight Corporation. All rights reserved. 34
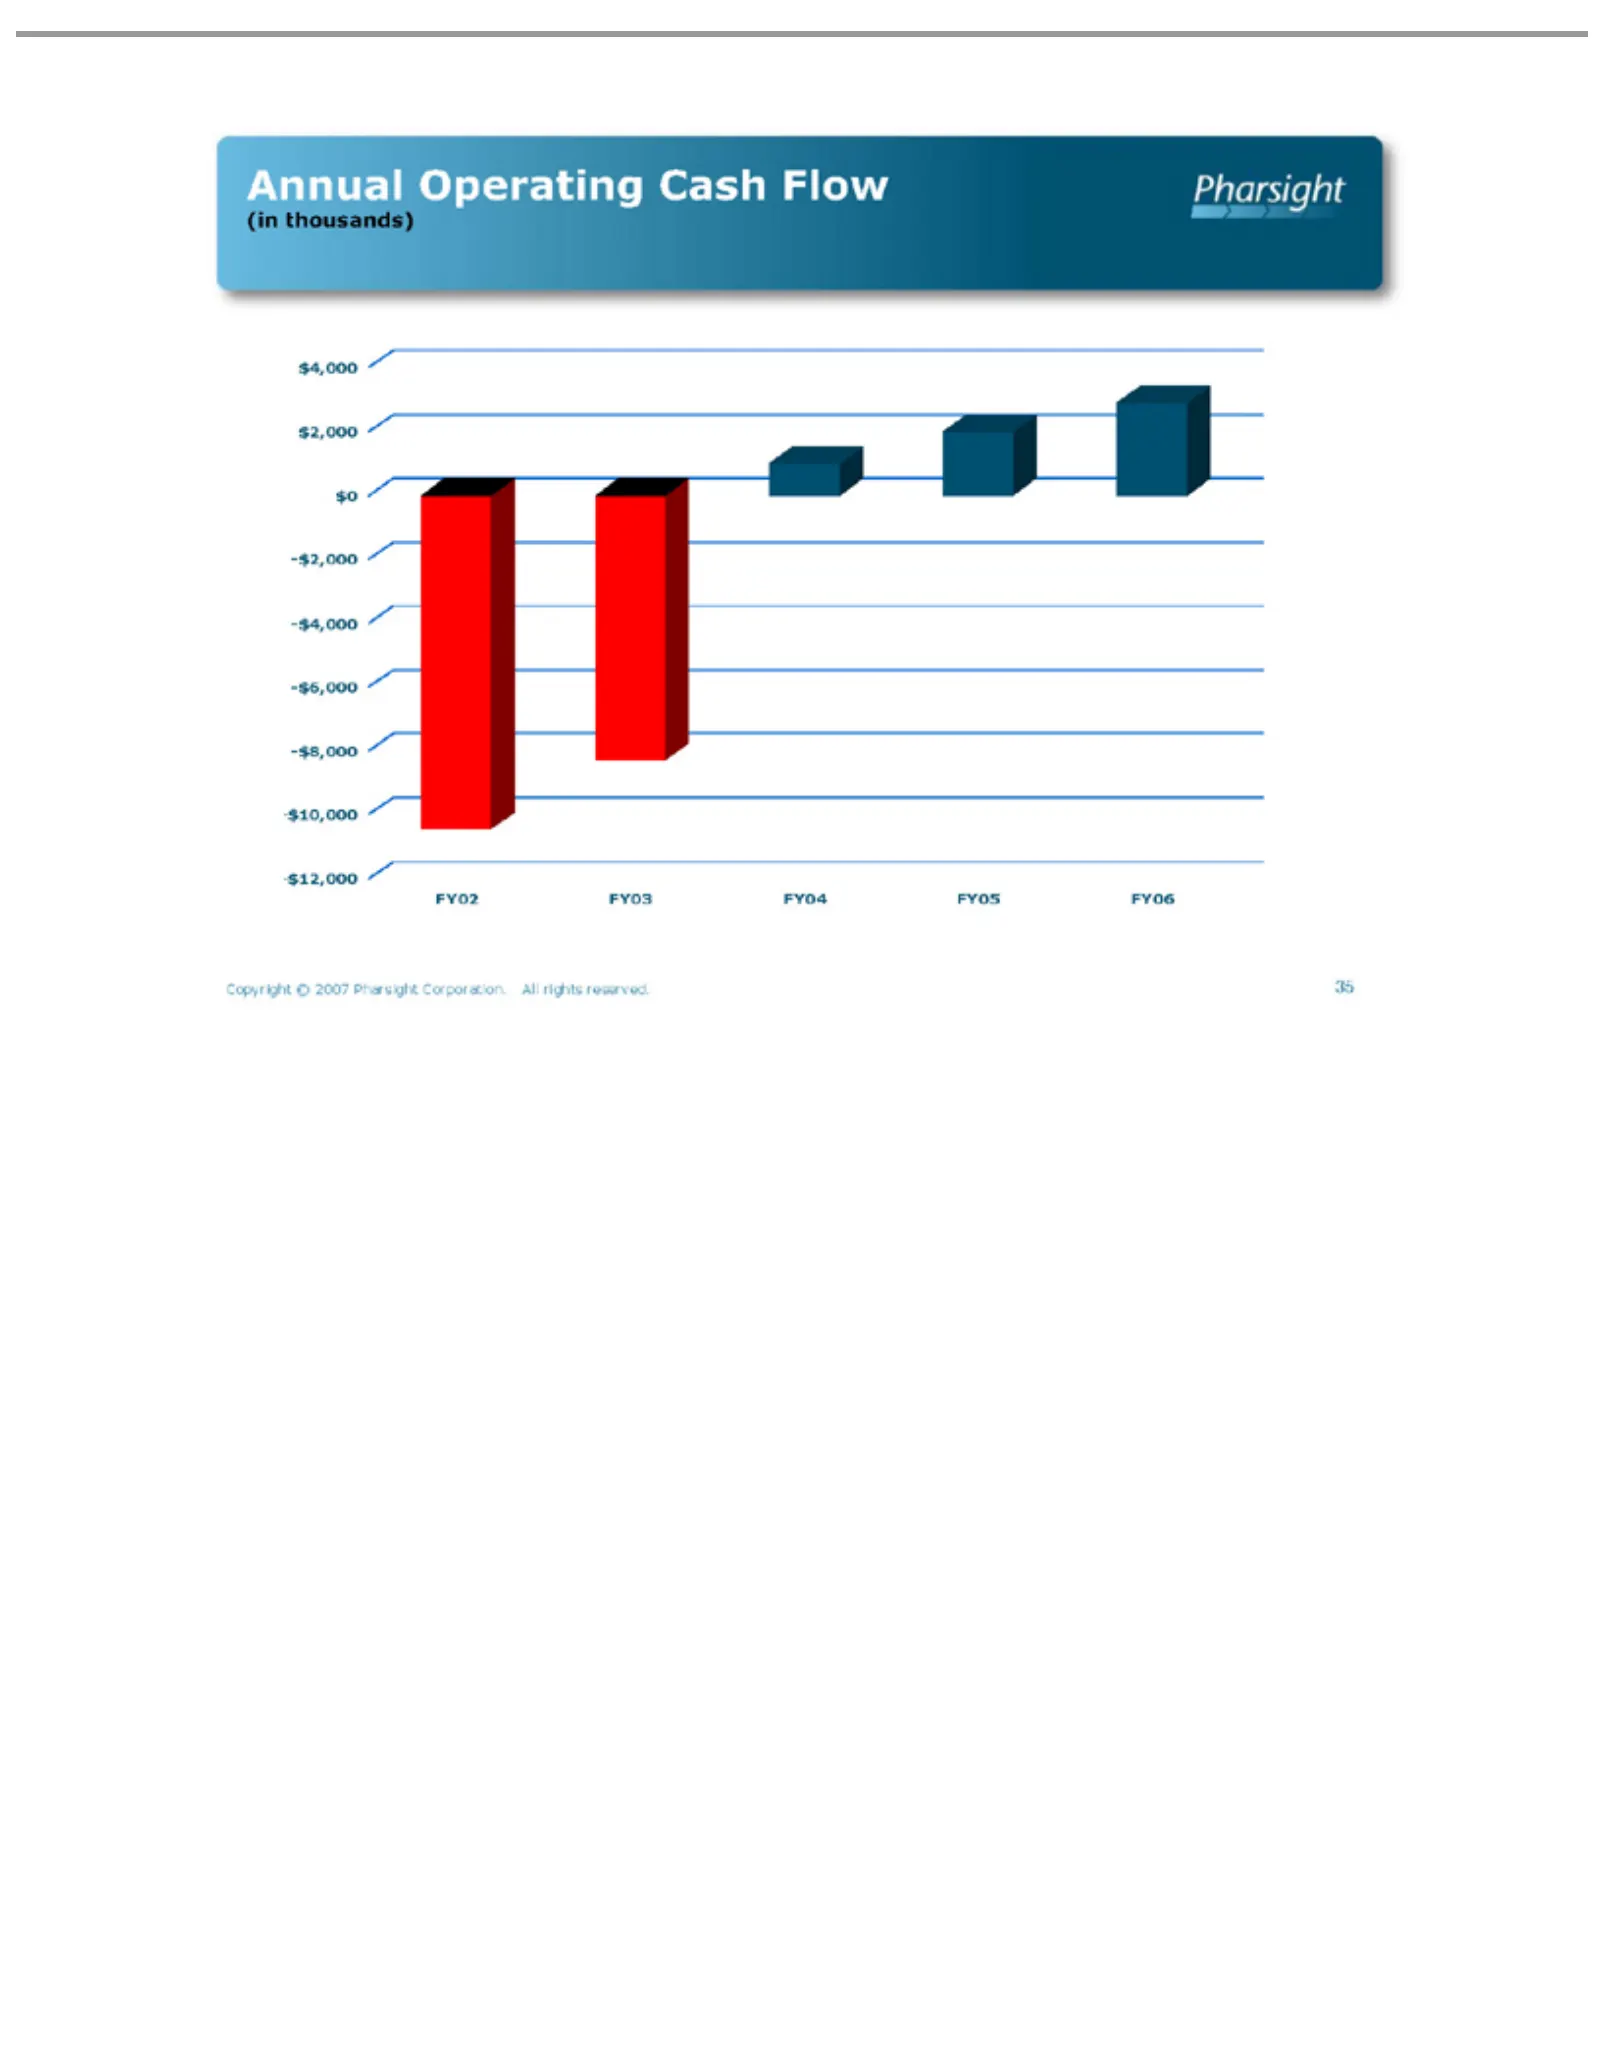
Slide 35: Annual Operating Cash Flow
Annual (in $4,000 thousands) Operating Cash Flow $2,000 $0 -$2,000 -$4,000 -$6,000 -$8,000 $10,000 $12,000 FY02 FY03 FY04 FY05 FY06 Copyright © 2007 Pharsight Corporation. All rights reserved. 35
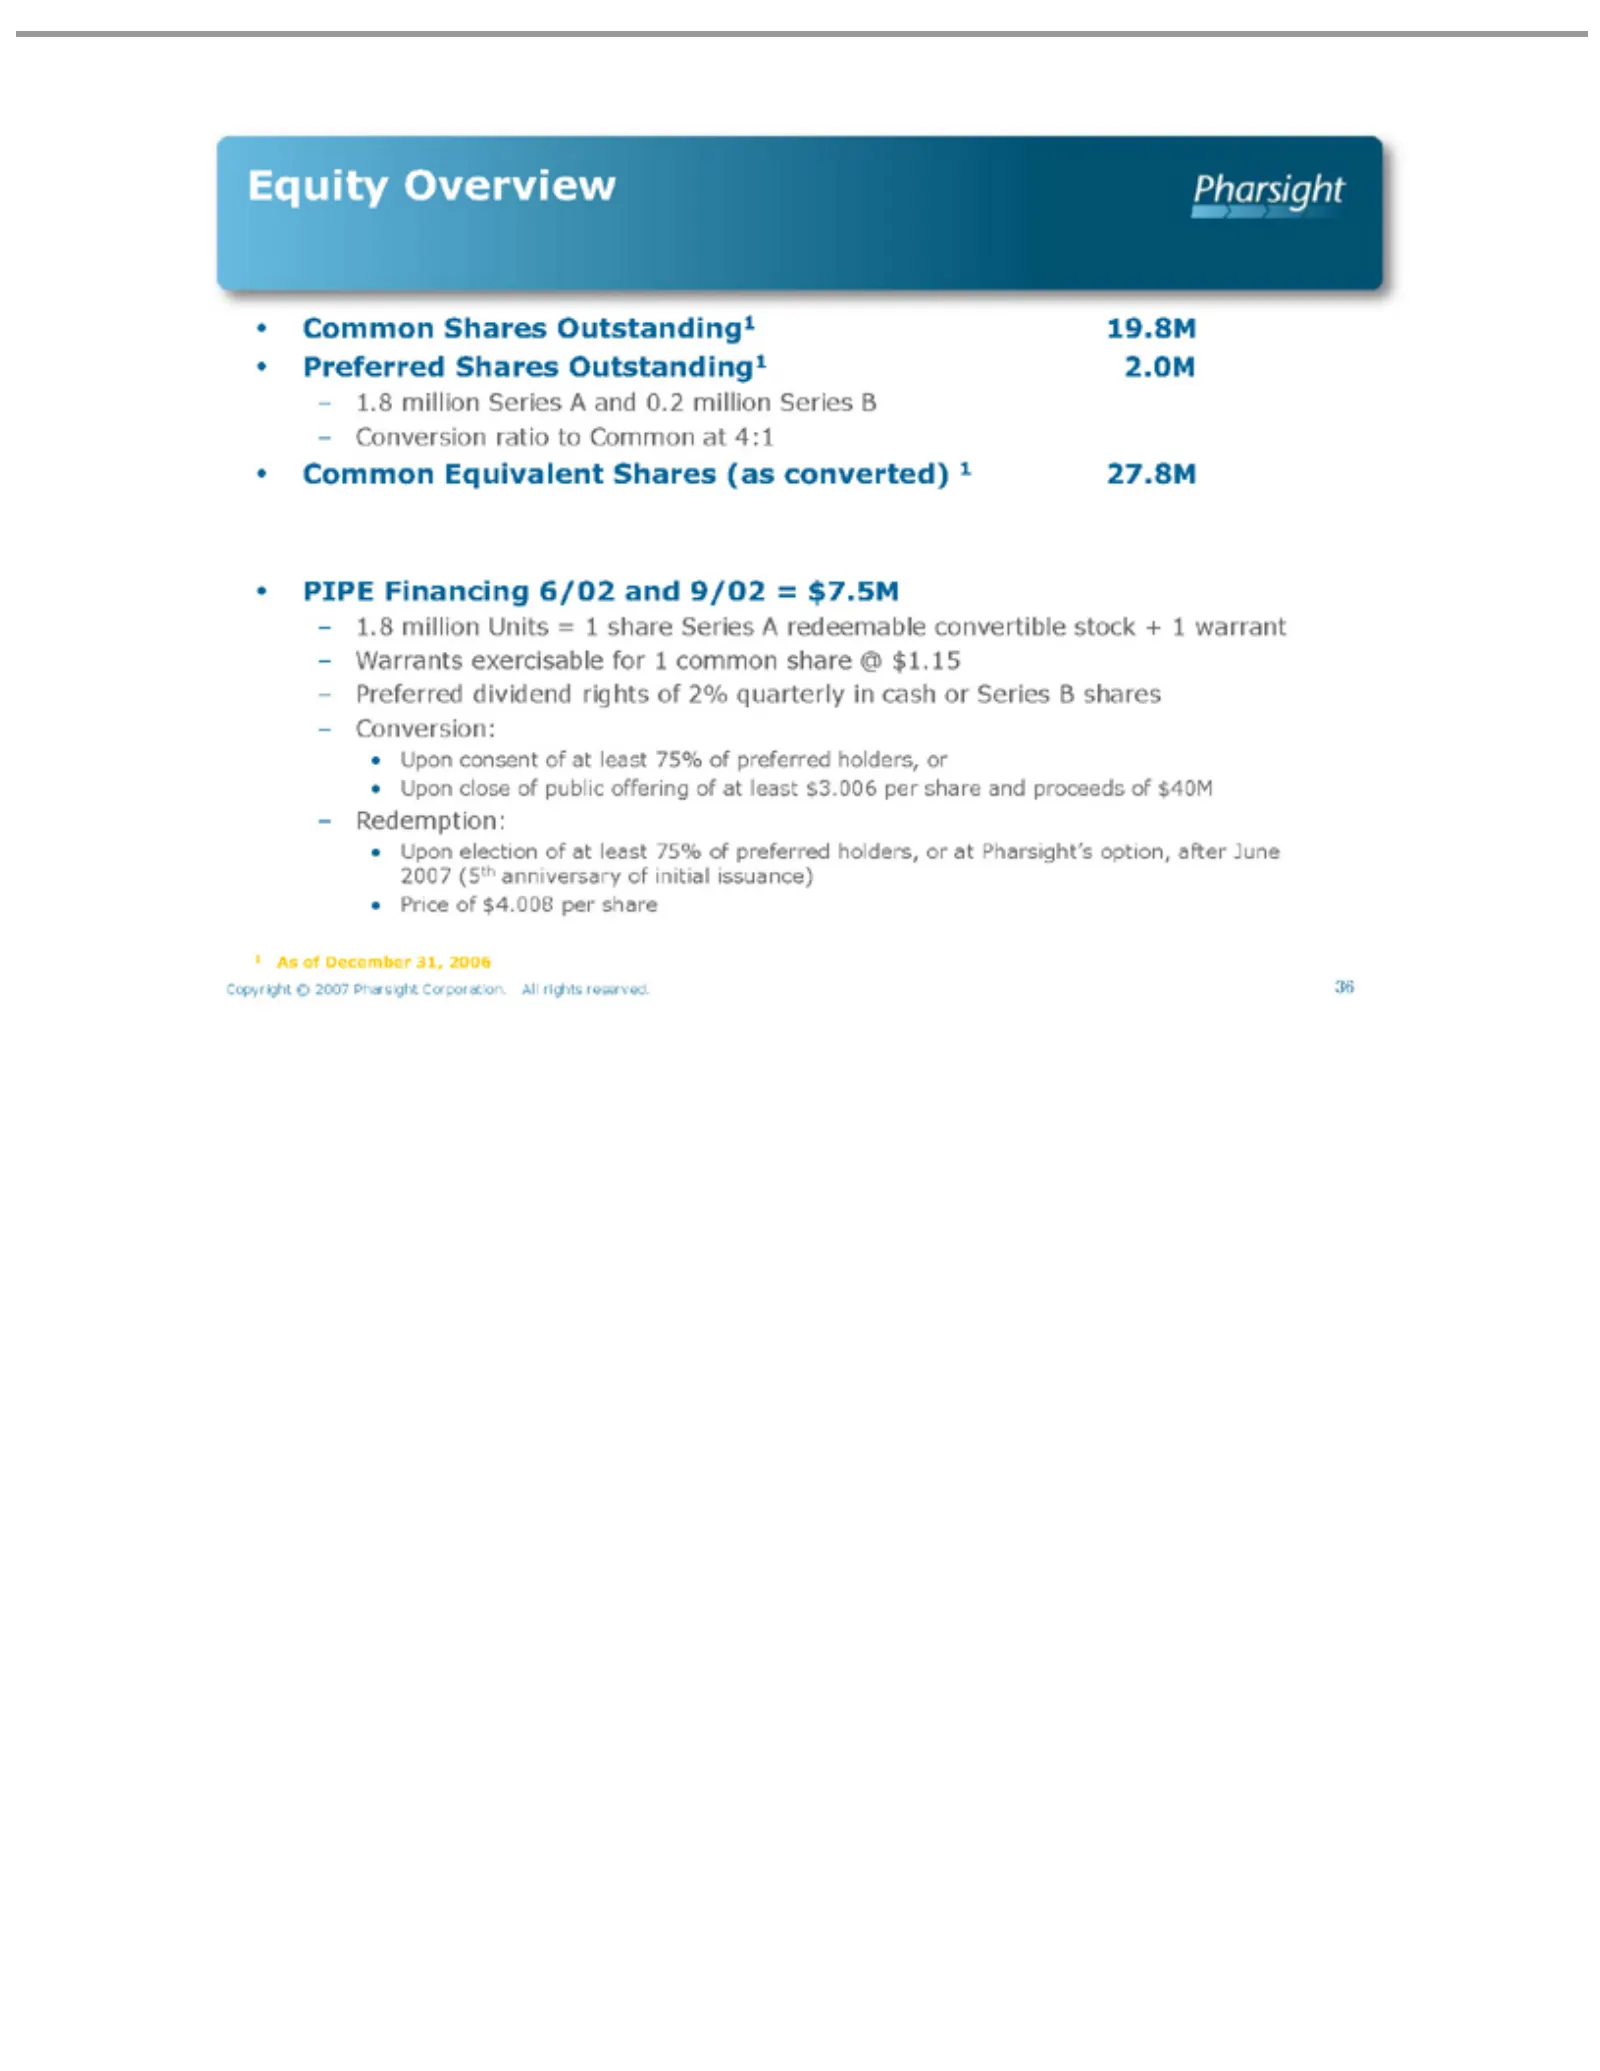
Slide 36: Equity Overview
• Equity Overview • Common Shares Outstanding1 19.8M Preferred Shares Outstanding1 2.0M – 1.8 million Series A and 0.2 million Series B • – Conversion ratio to Common at 4:1 Common •– Price 1 Copyright 36PIPE Upon As Warrants 1.8 Preferred Conversion: Redemption: of million of Equivalent Financing c
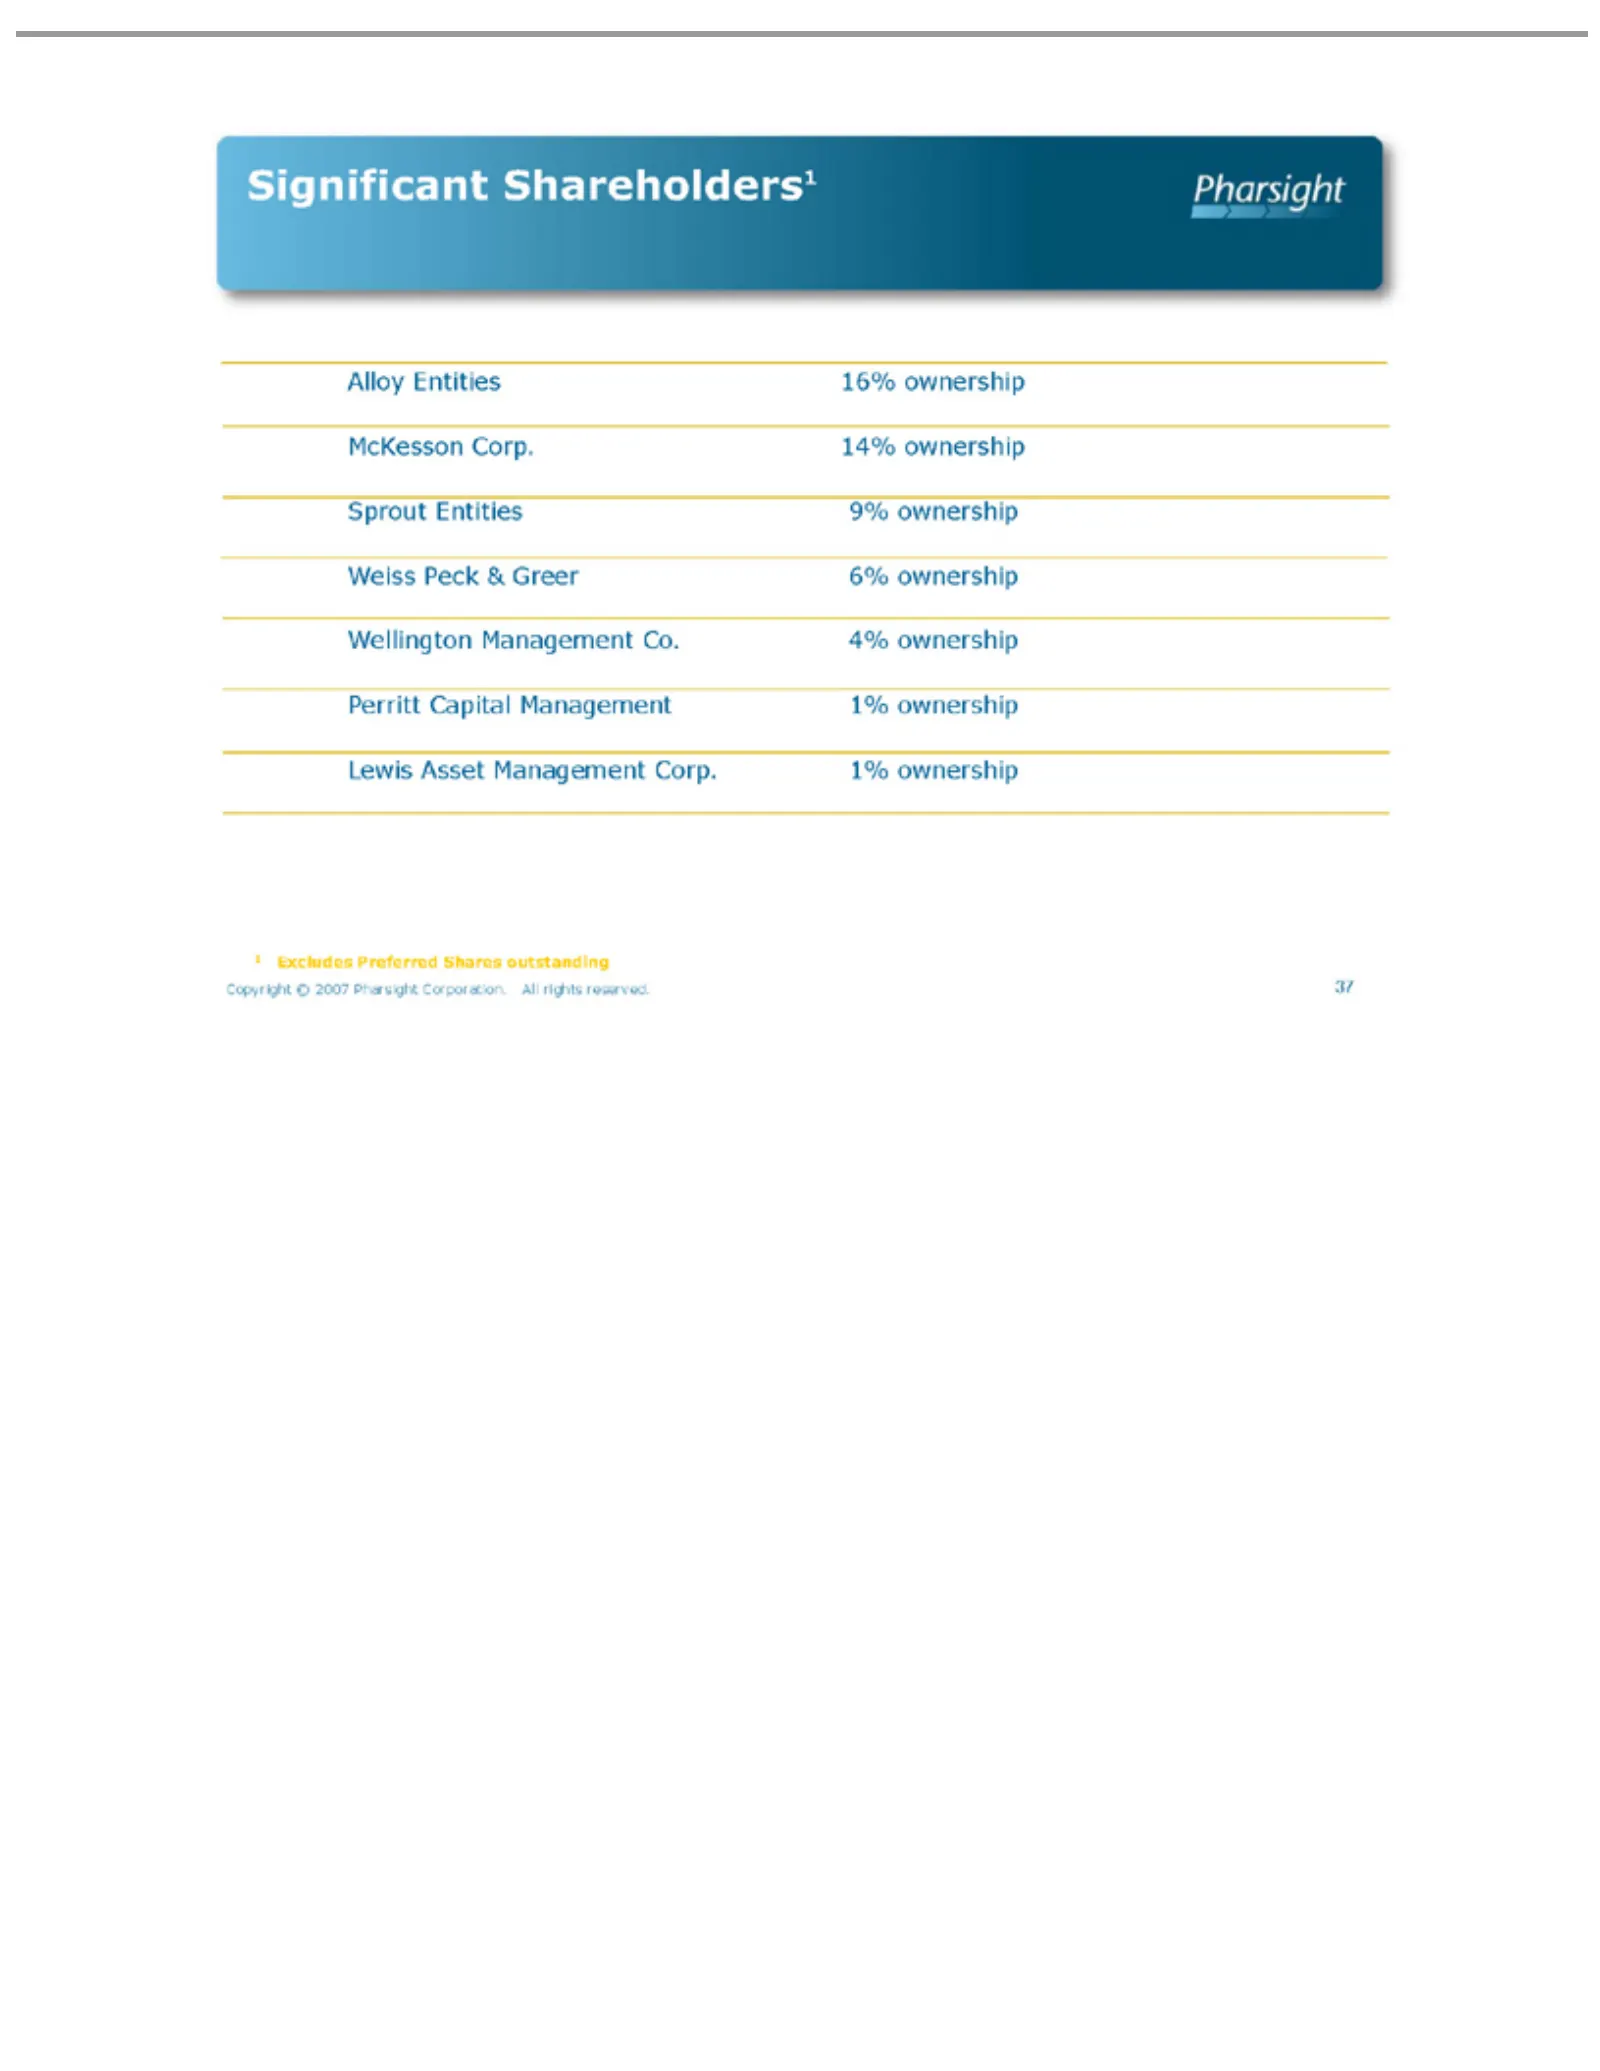
Slide 37: Significant Shareholders
Significant Alloy Entities Shareholders1 16% ownership McKesson Corp. 14% ownership Sprout Entities 9% ownership Weiss Peck & Greer 6% ownership Wellington Management Co. 4% ownership Perritt Capital Management 1% ownership Lewis Asset Management Corp. 1% ownership 1 Excludes©Preferred Copyright 37
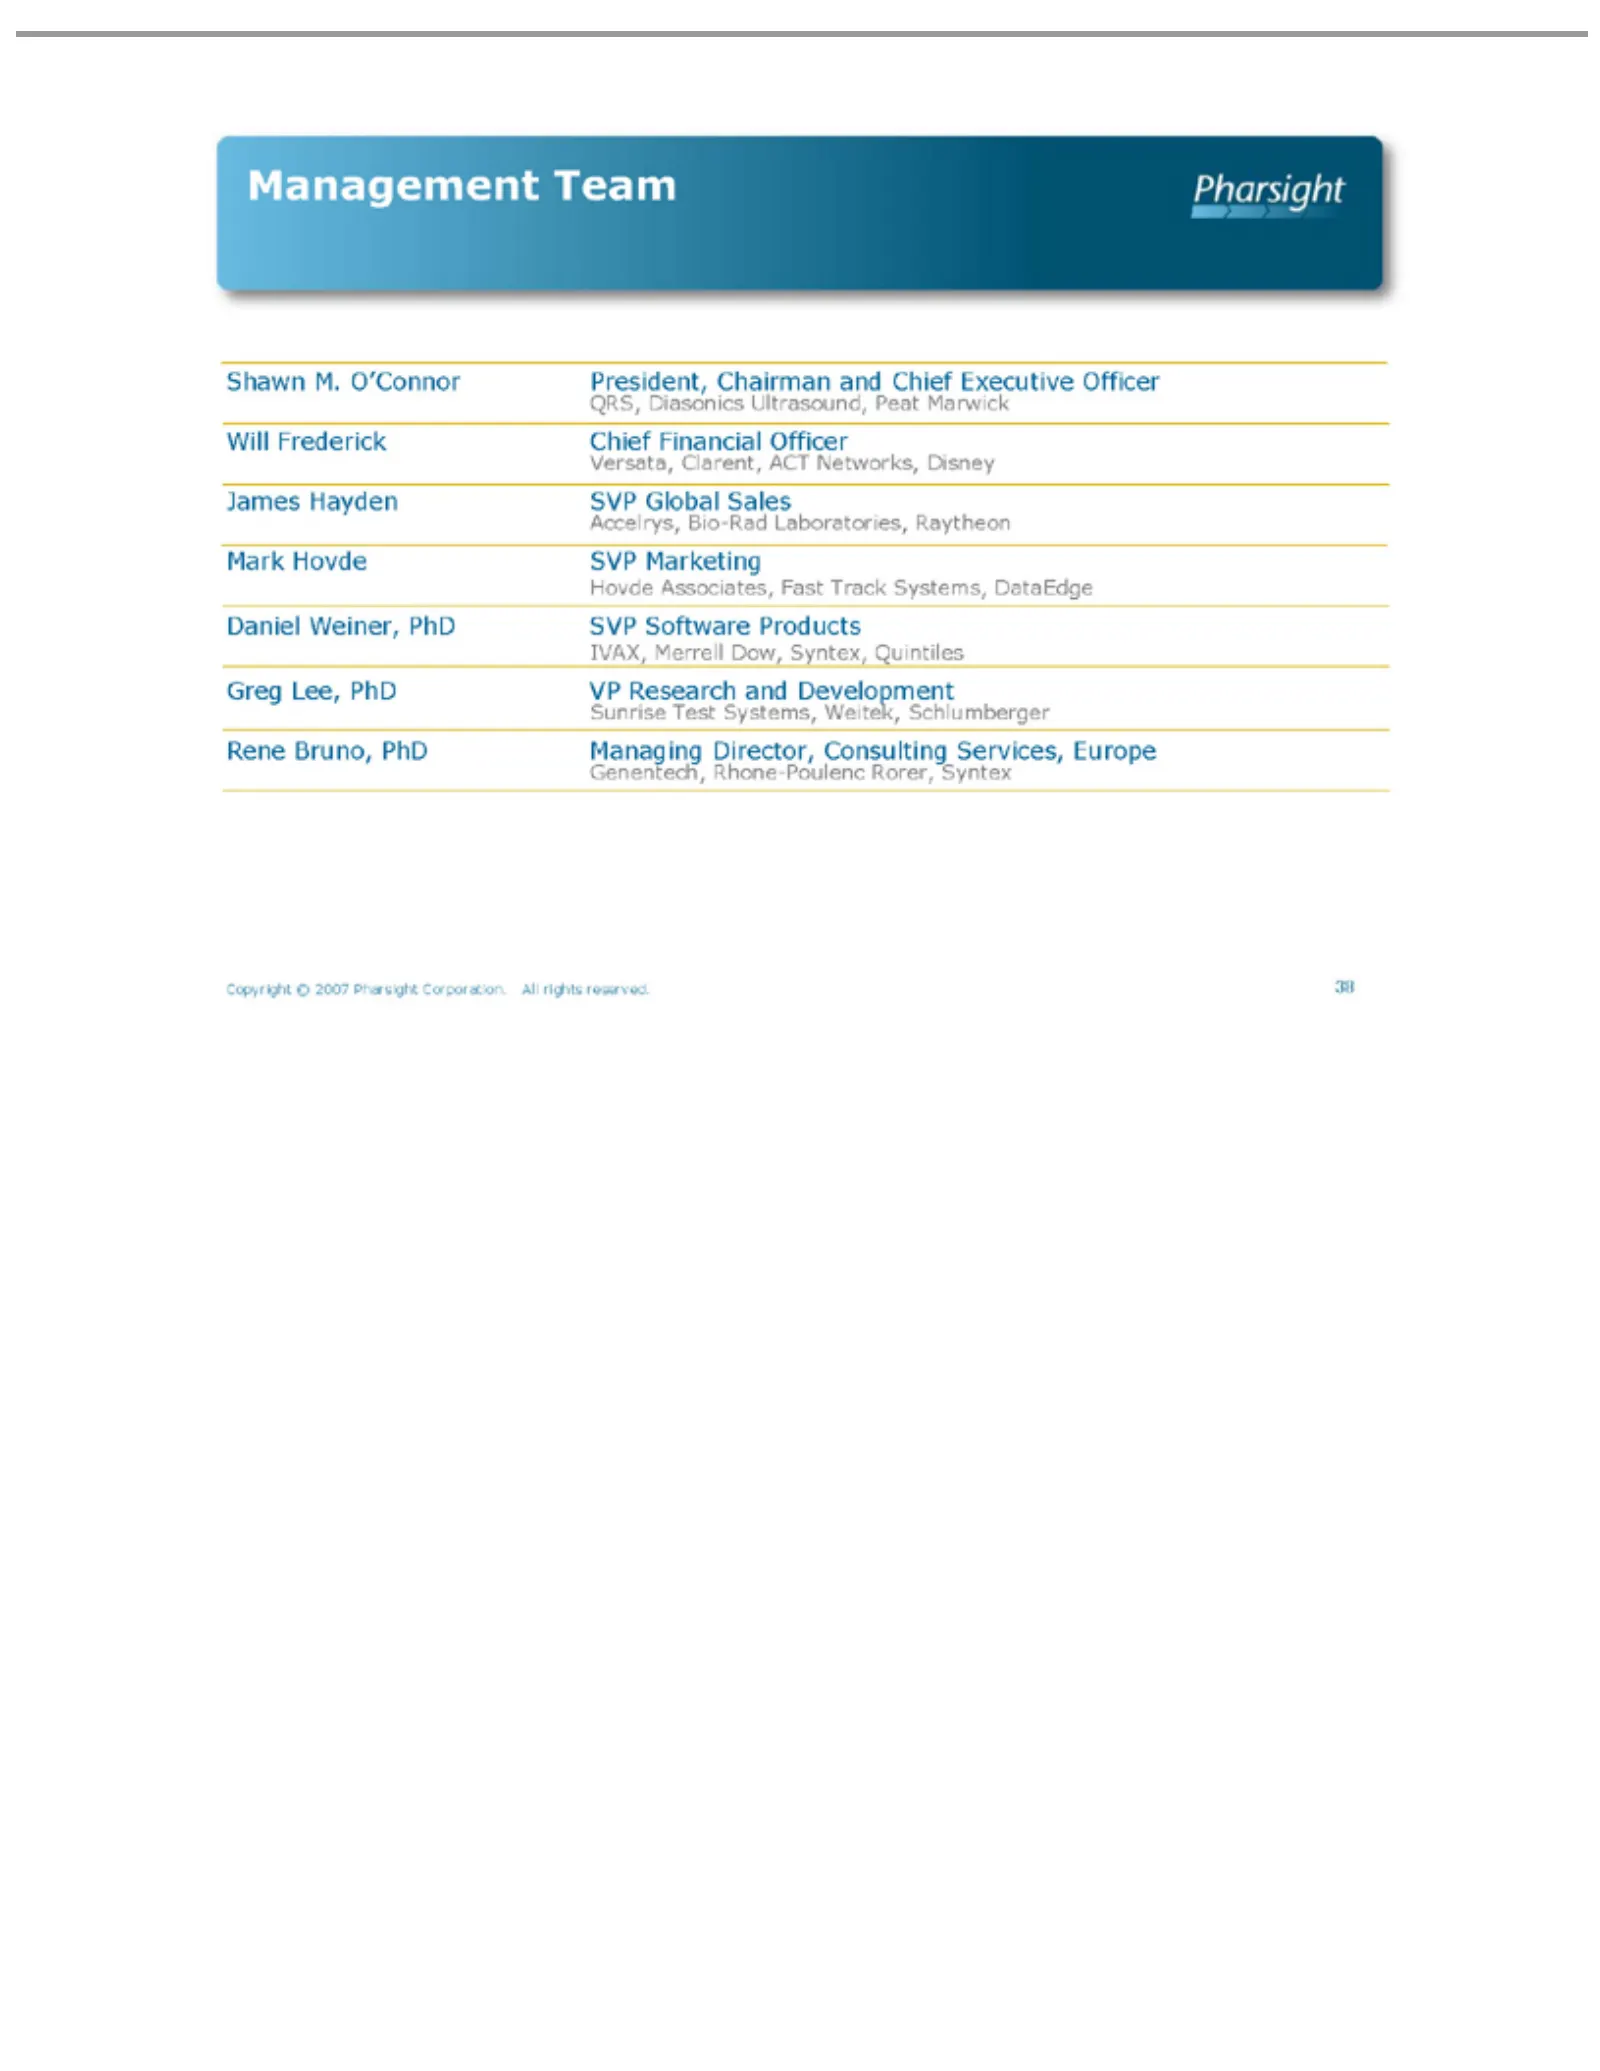
Slide 38: Management
Management Shawn M. O’Connor Team QRS, Diasonics President, Chairman Ultrasound, and Chief Peat Executive MarwickOfficer Will Frederick Chief Financial Versata, Clarent,Officer ACT Networks, Disney James Hayden SVP Global Accelrys, Bio-Rad Sales Laboratories, Raytheon Mark Hovde SVP Marketing Hovde
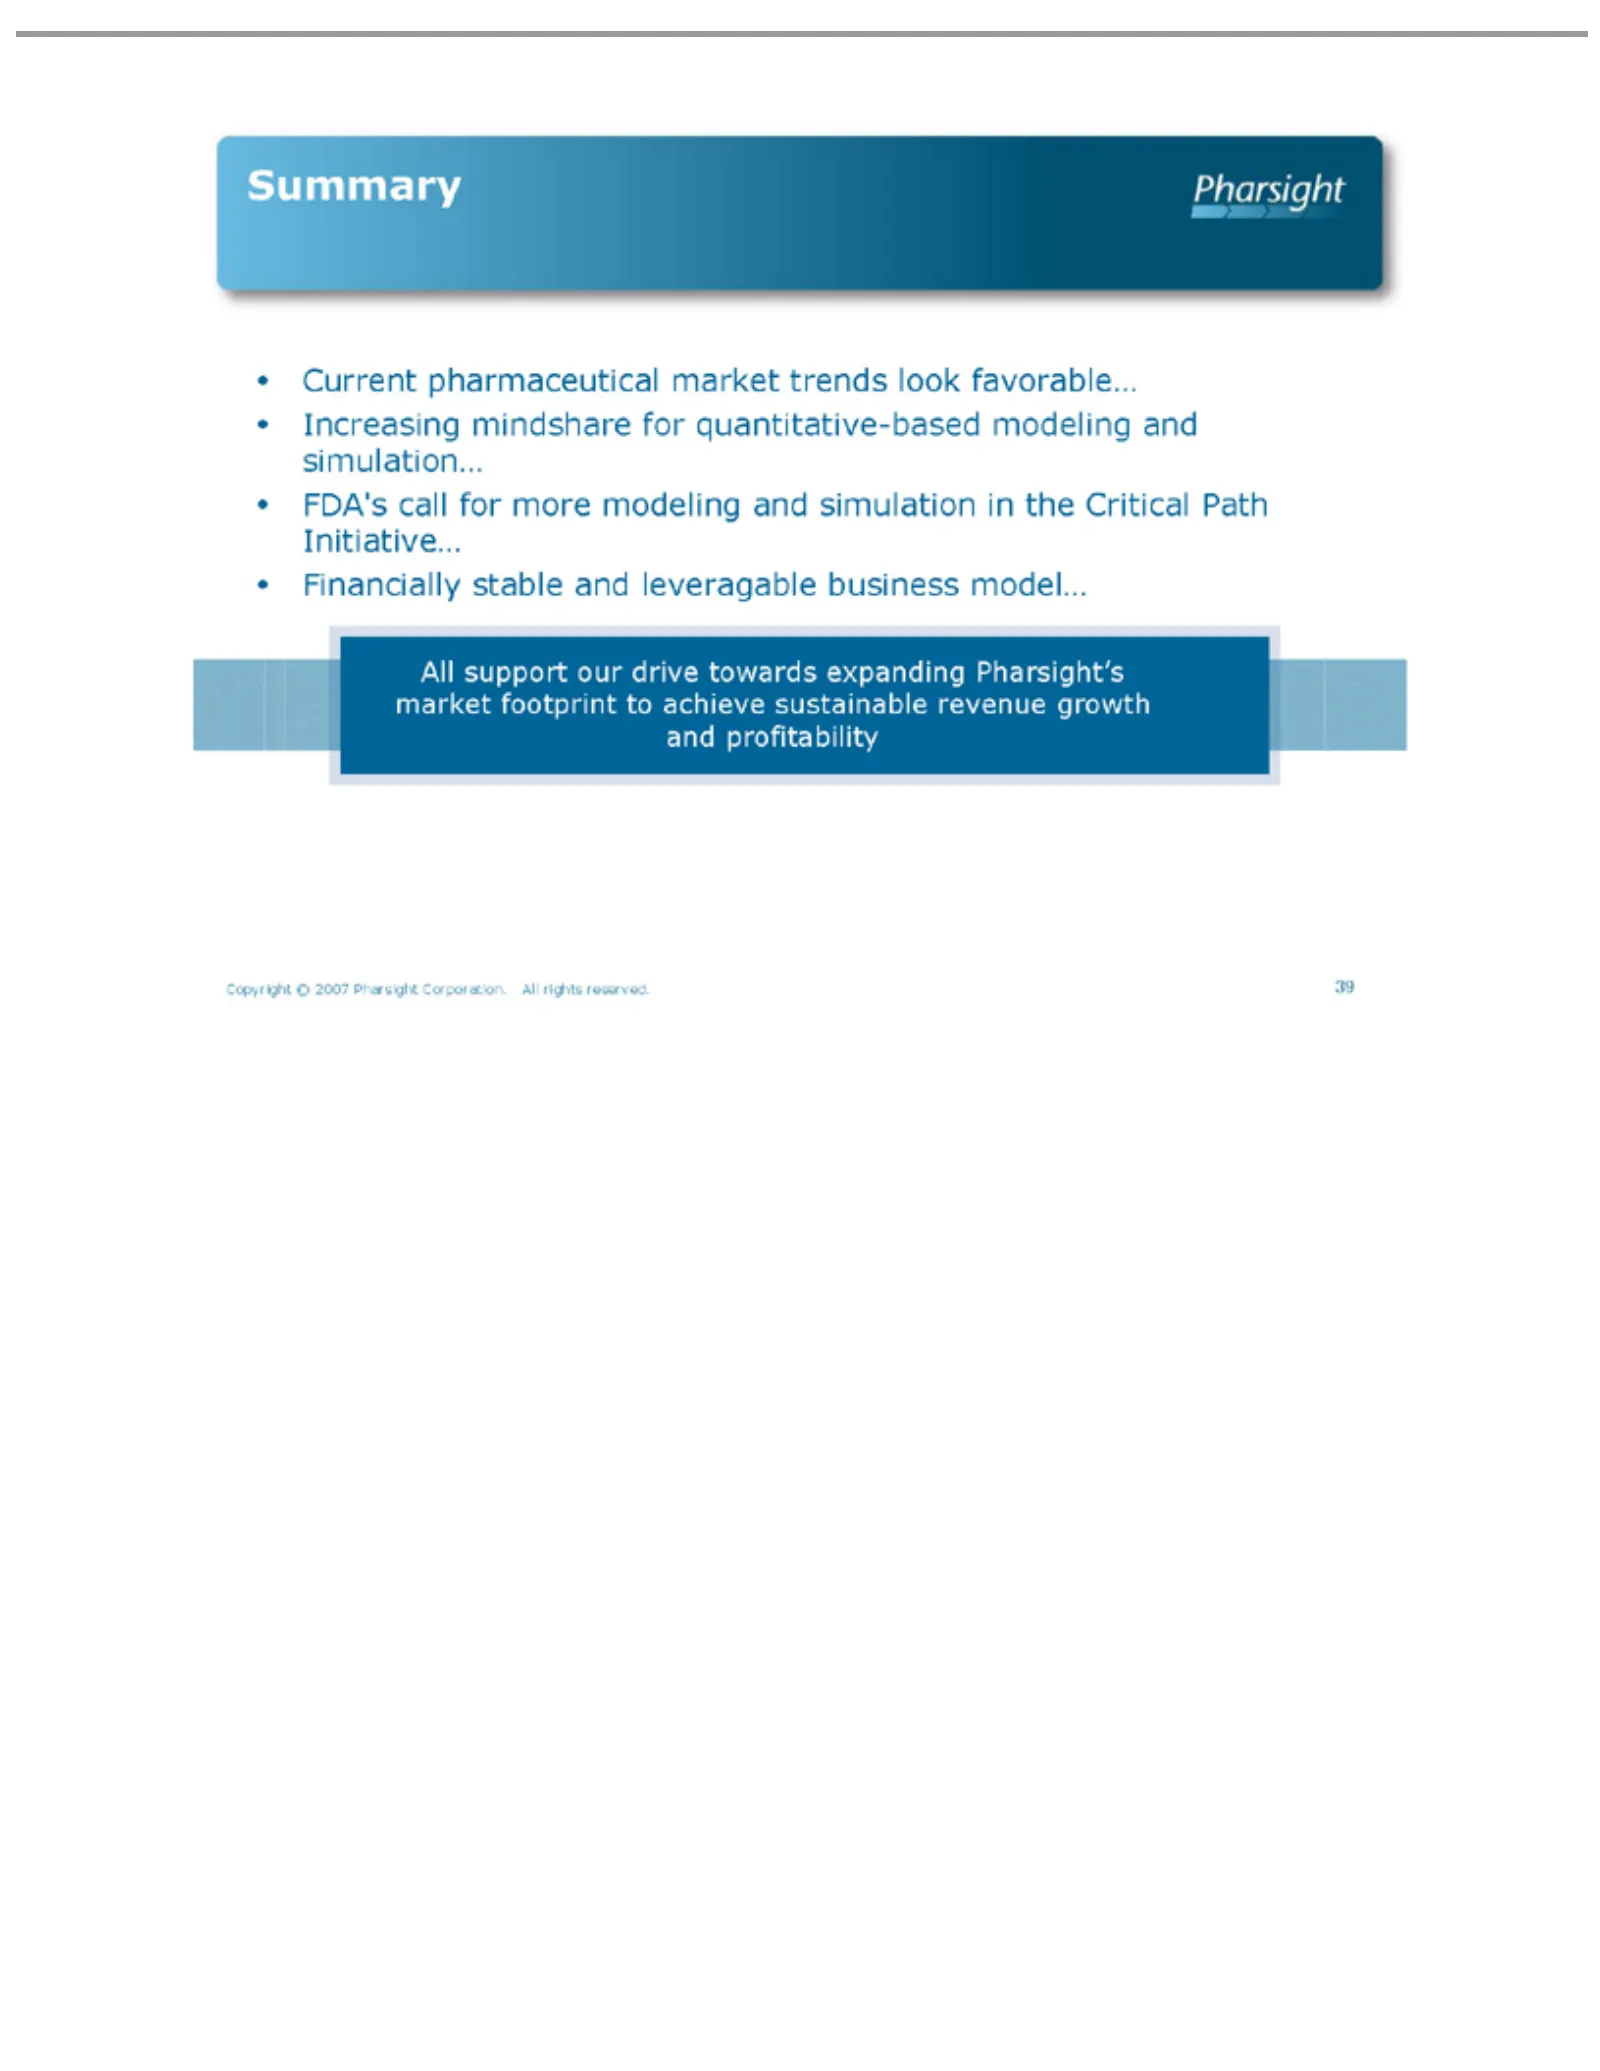
Slide 39: Summary
•Summary All Copyright 39 Current Increasing FDA’s Financially support call pharmaceutical ©our mindshare for 2007 stable drive more Pharsight and towards modeling for leveragable market quantitative-based Corporation. expanding and trends business simulation look Pharsight’s Allfavorable… model… ri
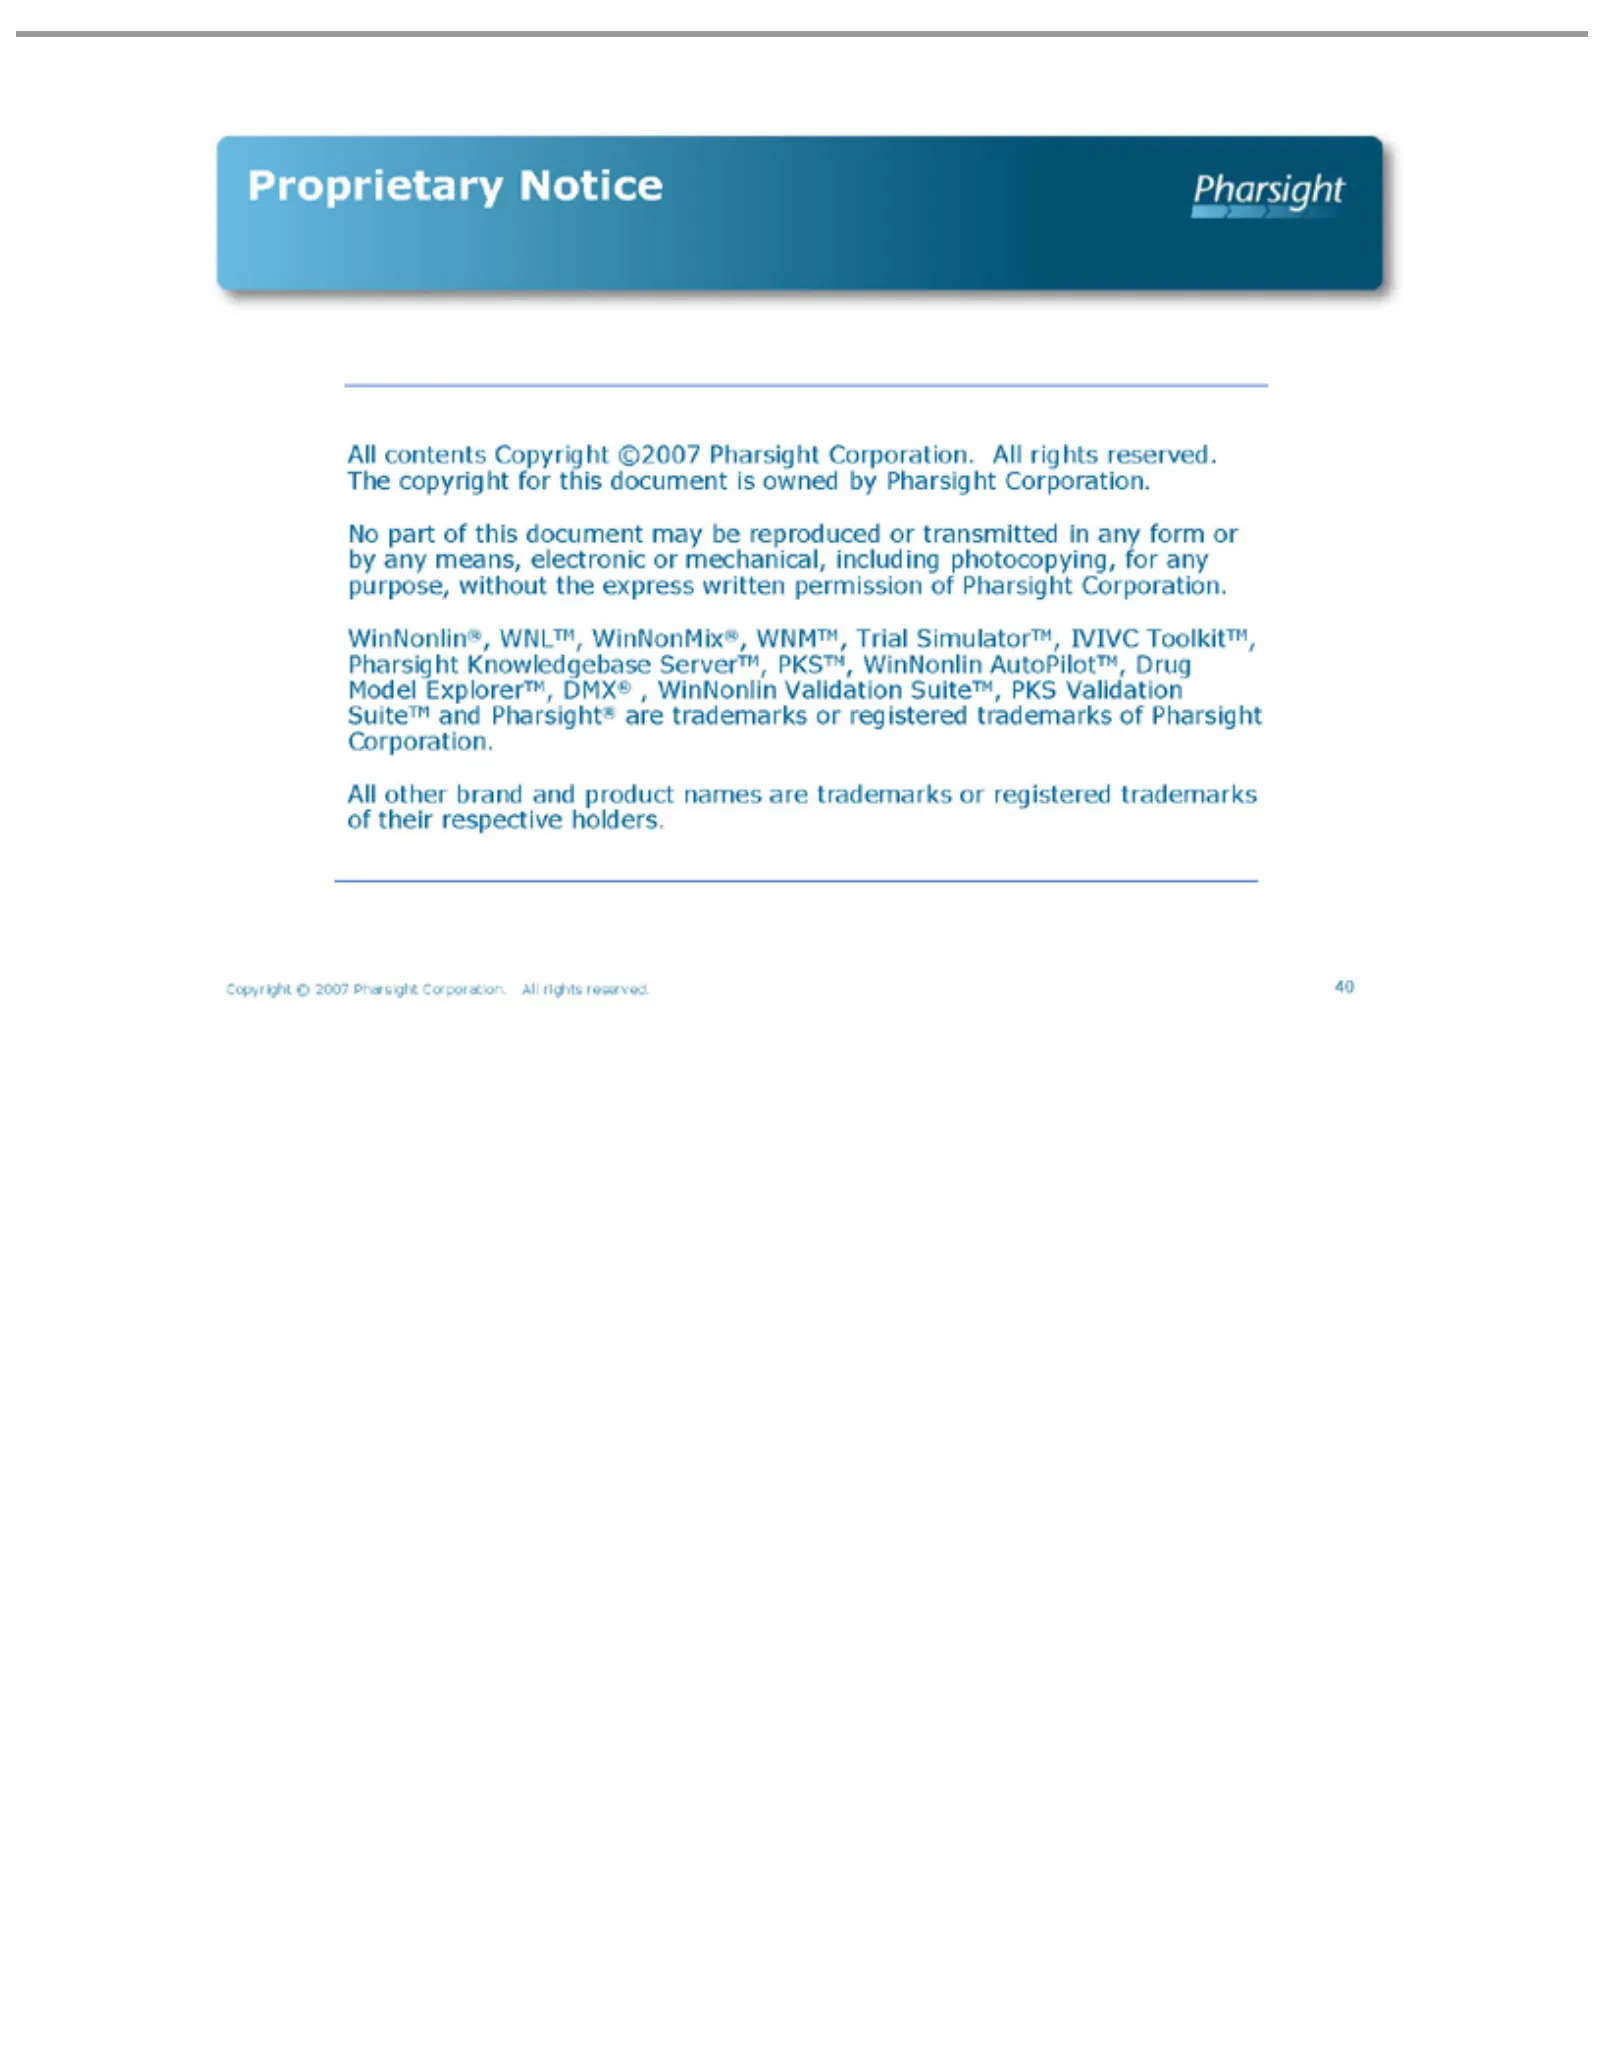
Slide 40: Proprietary Notice and Trademarks
Proprietary No Pharsight WinNonlin®, DMX® All Copyright 40 part contents otherof , WinNonlin brand Corporation. © this Notice Copyright 2007 WNLTM, document andPharsight product Validation ©2007 WinNonMix®, may names Corporation. be Pharsight SuiteTM, reproduced are trademarks WNMTM, Corporation. Al
Slide 41: Pharsight
Pharsight
Source: SEC EDGAR · 8-K filed Jan 26, 2007
More decks from Pharsight Corp
 Q4 2007 Earnings Presentation45 slides · May 14, 2007
 Q2 2007 Earnings Presentation33 slides · Nov 30, 2006
 Q1 FY2007 Earnings Presentation37 slides · Aug 3, 2006
 Investor Presentation (June 2006)36 slides · Jun 6, 2006
 Investor Presentation (February 2006)31 slides · Feb 2, 2006
 Investor Presentation (August 2005)39 slides · Aug 2, 2005