Pharsight — Investor Presentation (August 2005)
39 slides from Pharsight's investor presentation, Aug 2, 2005
Slide 1: Pharsight Corporation Investor Presentation June 2005
Exhibit 99.1 Pharsight June Shawn Cynthia SVP & 2005 O’Connor Chief Stephens Corporation Financial President Investor Officer & CEO Presentation
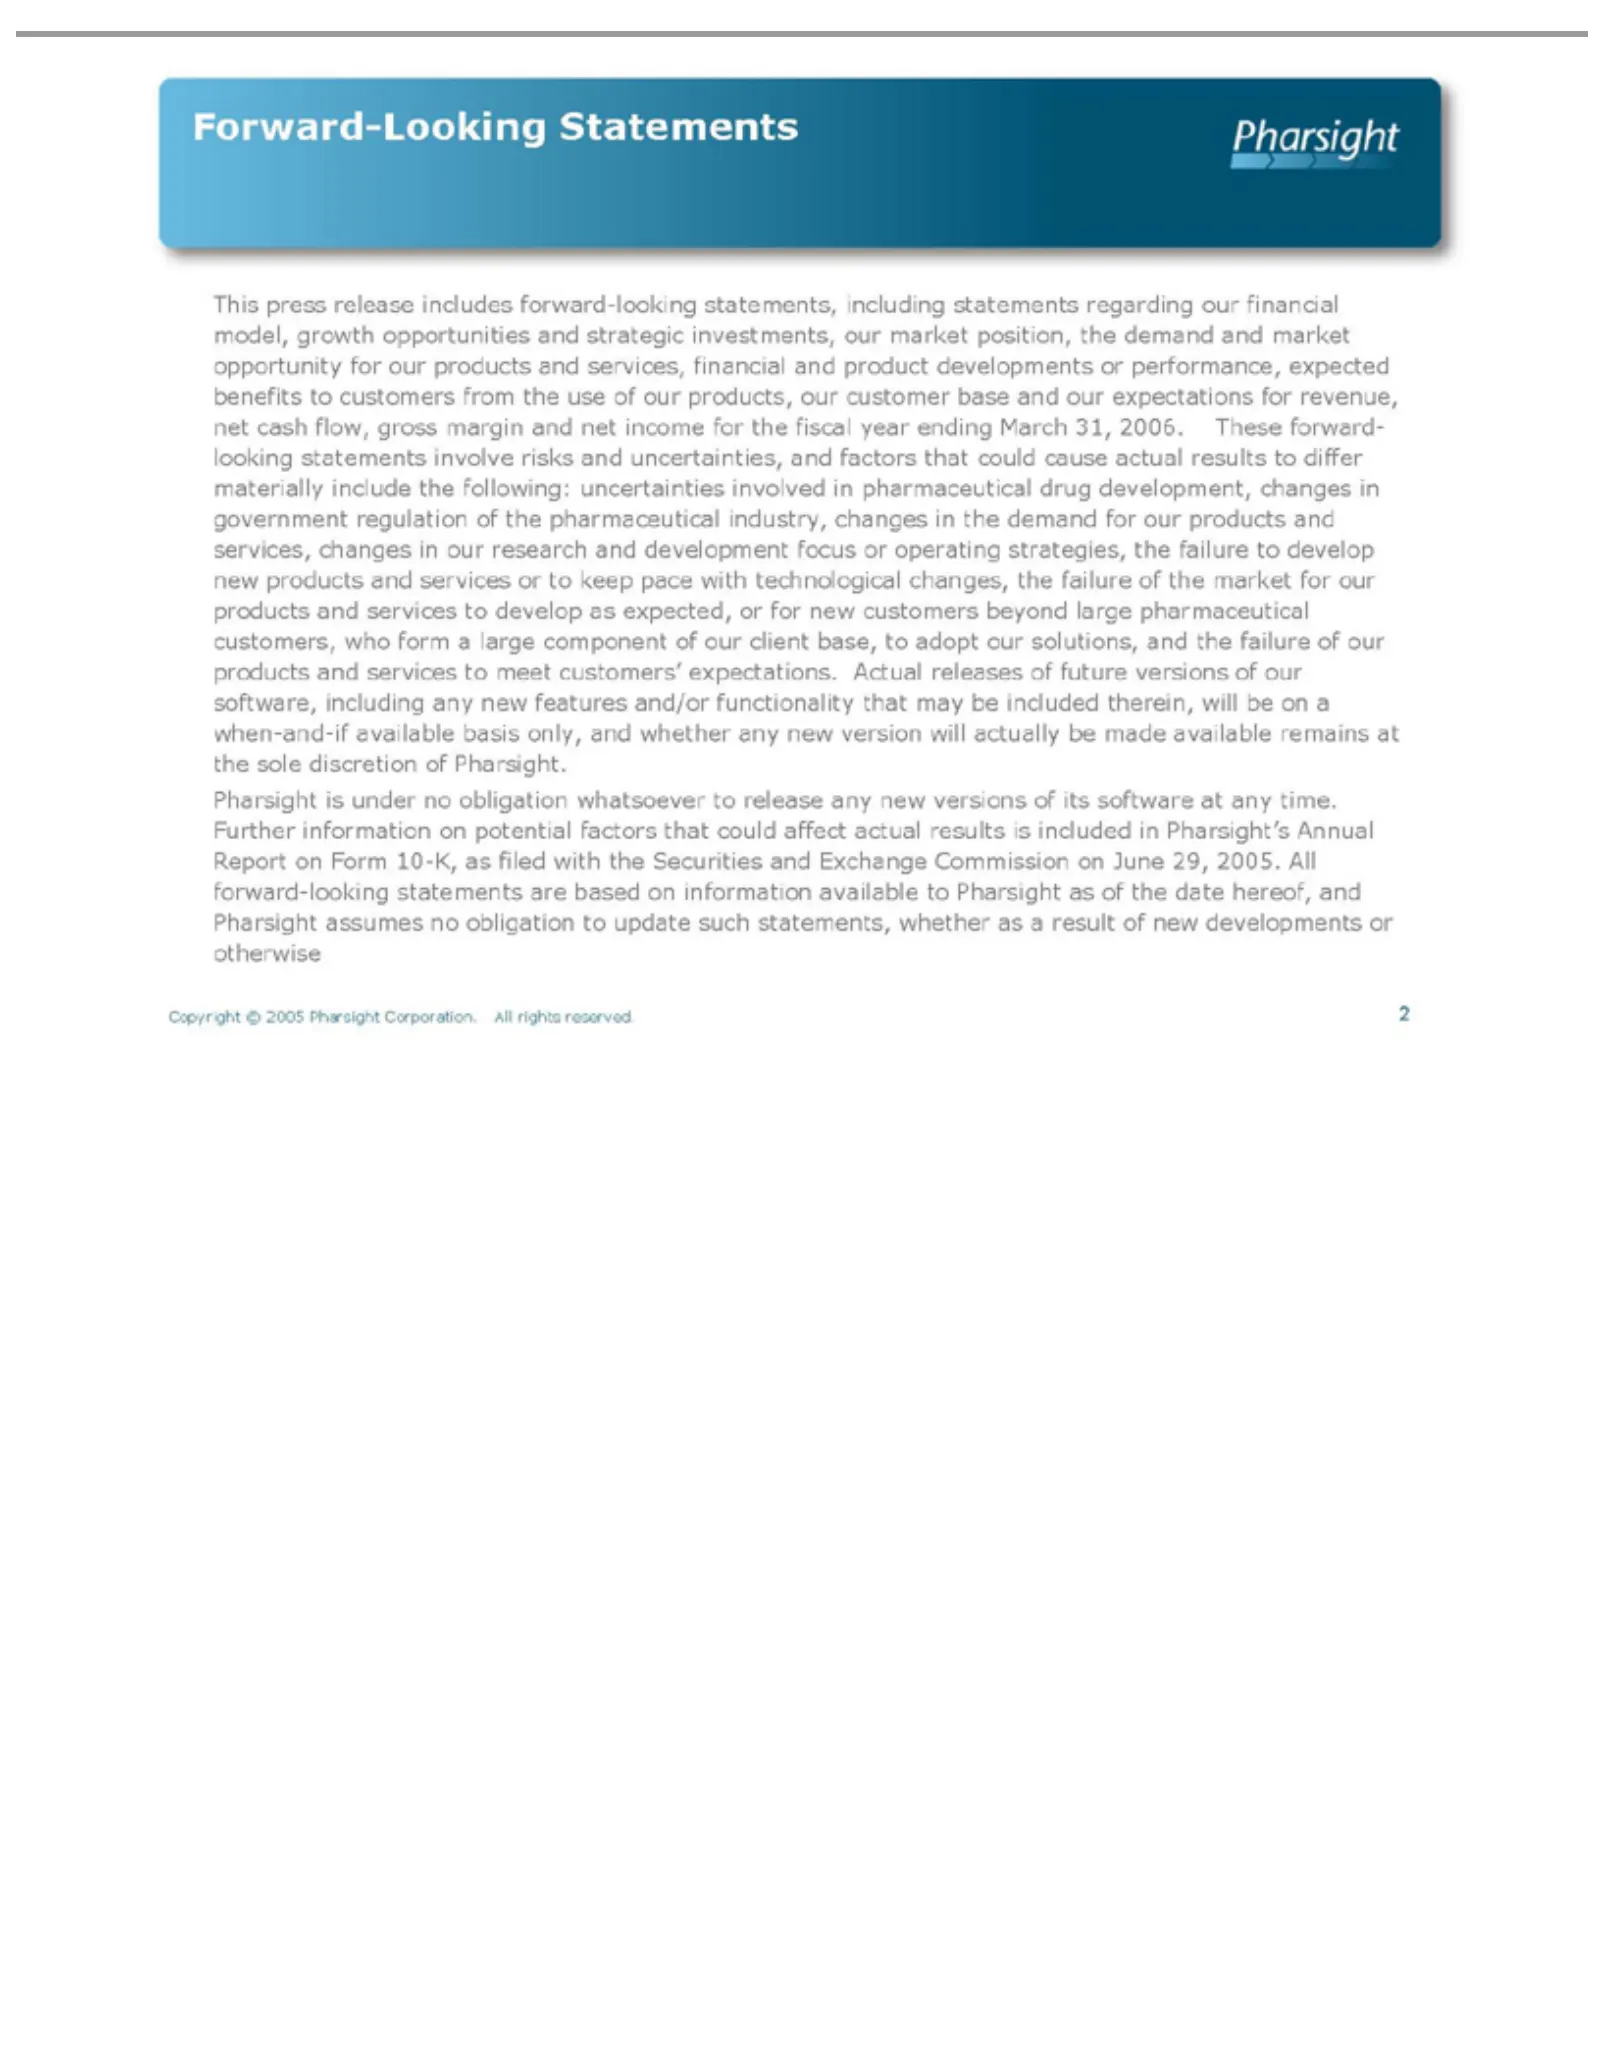
Slide 2: Forward-Looking Statements
Forward-Looking This market expectations could changes technological client functionality Pharsight Annual hereof, Copyright 2 press base, cause opportunity and Report inis© release the Pharsight to actual under for 2005 that changes, adopt demand onrevenue, may includes Statements Form no Pharsight
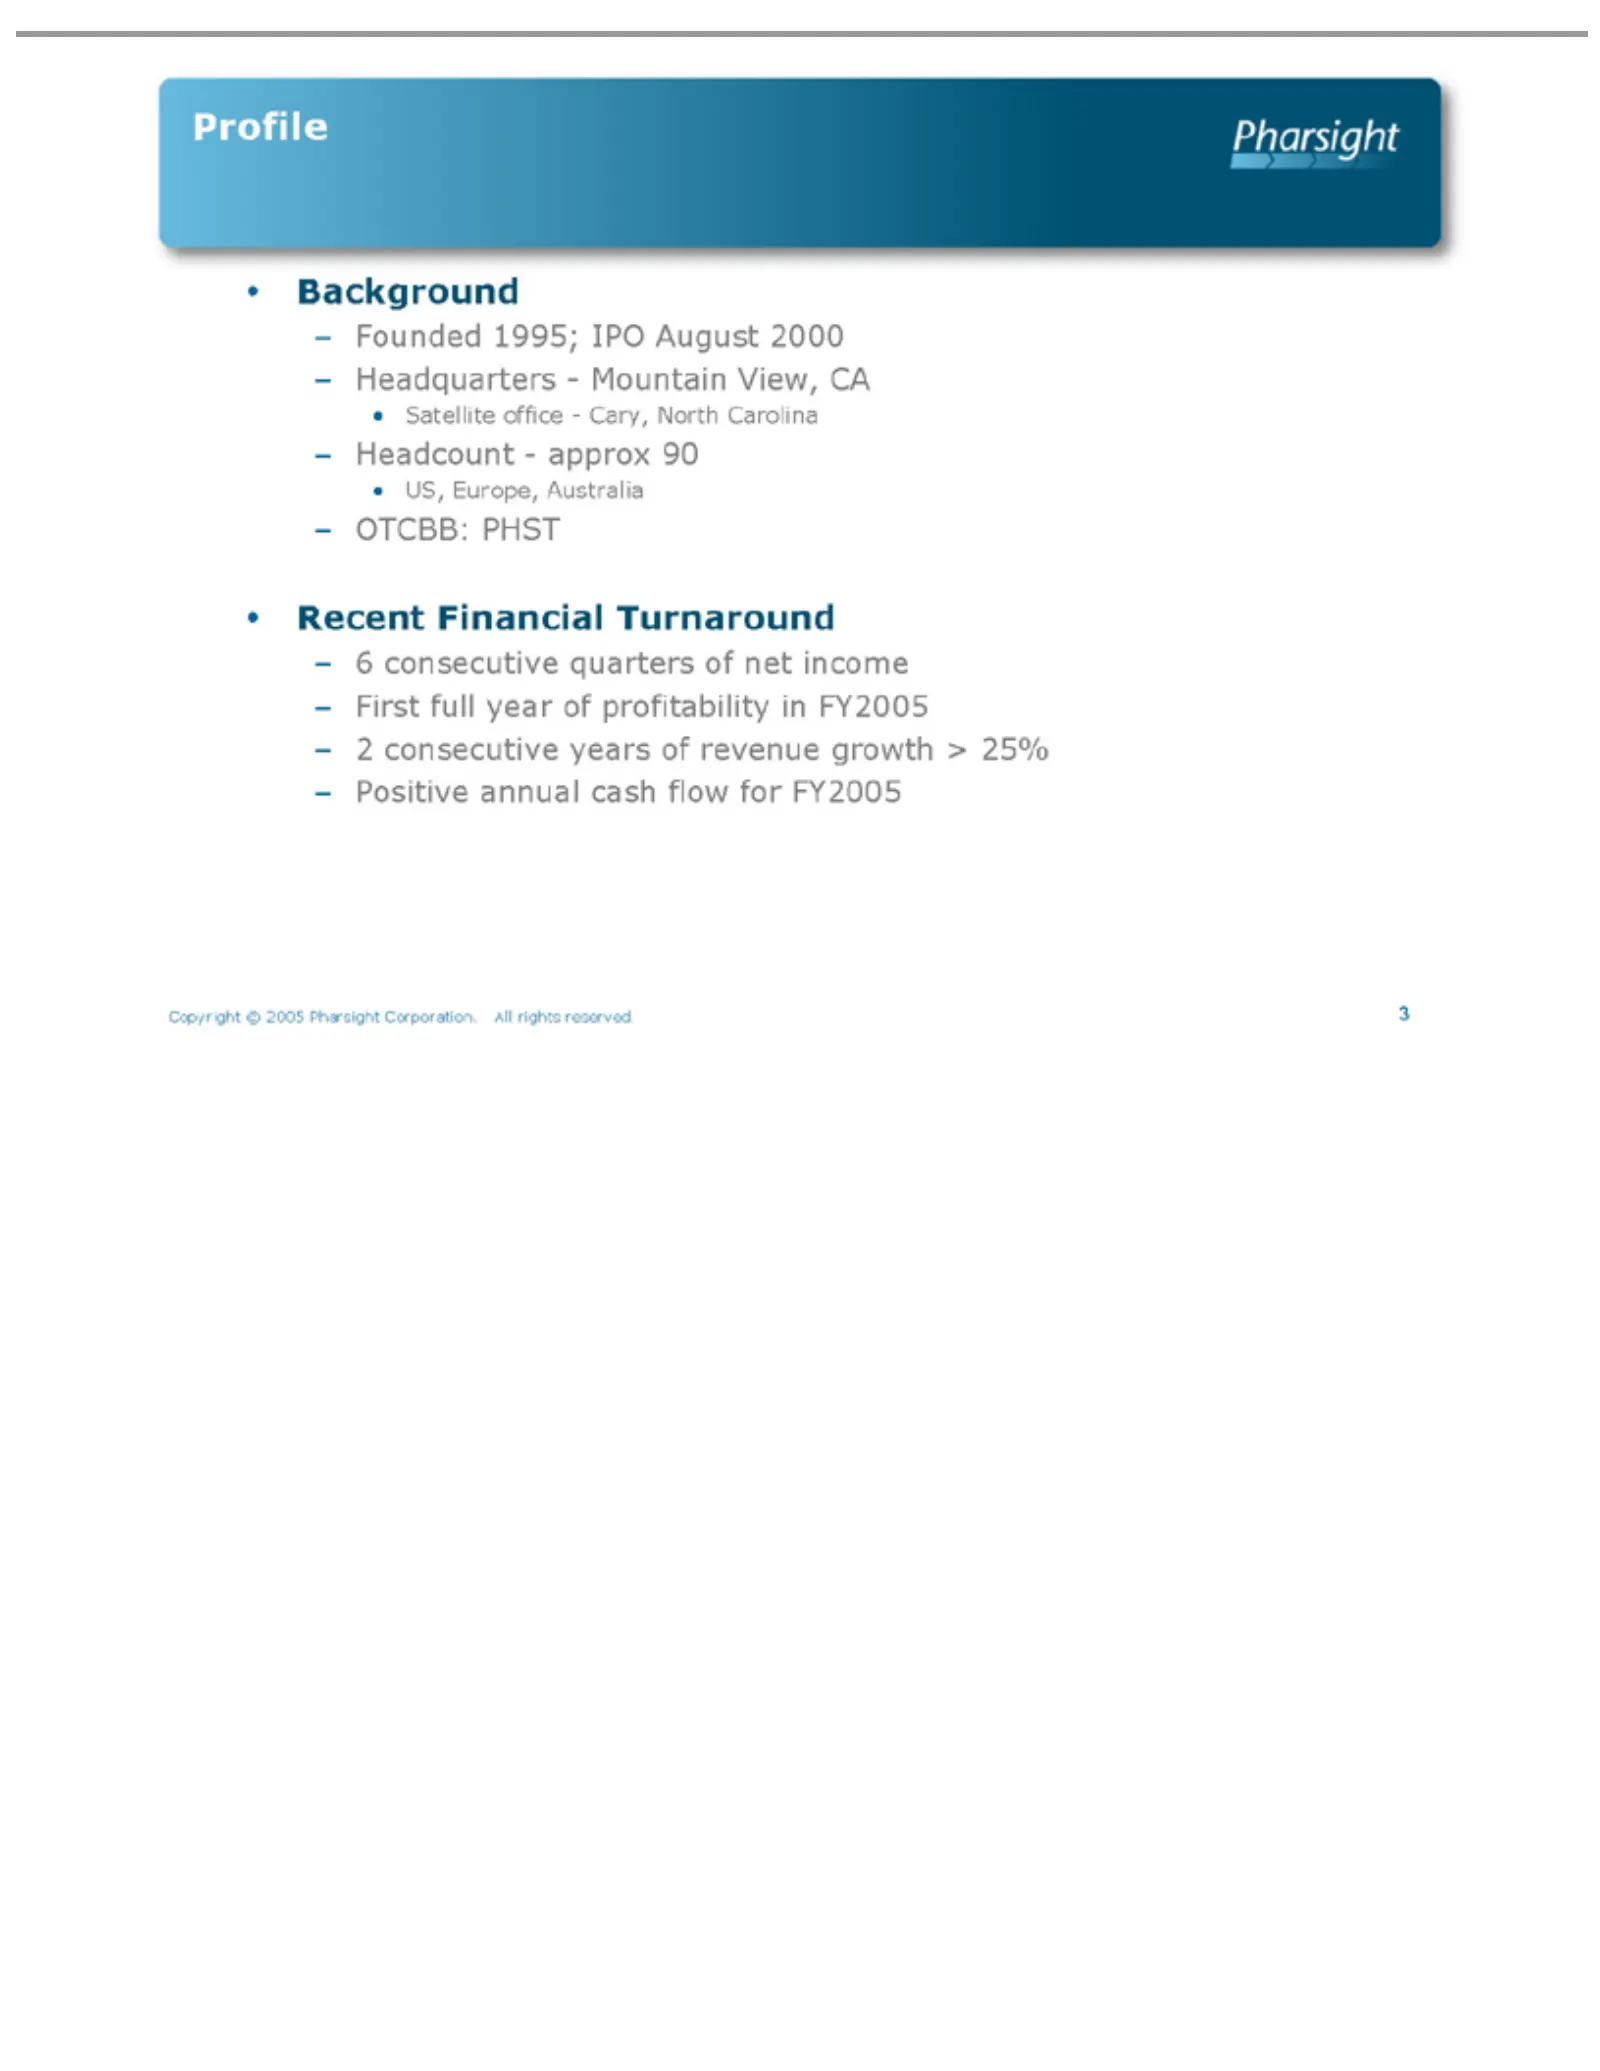
Slide 3: Pharsight Profile and Recent Background
Background Profile Satellite US, Recent – Copyright 3 Founded Headquarters—Mountain Headcount—approx 6OTCBB: 2First Positive consecutive Europe, full Financial office—Cary, annual ©year 1995; PHST Australia 2005 of quarters years Turnaround IPO cash profitability Pharsight of August 90 flow North re
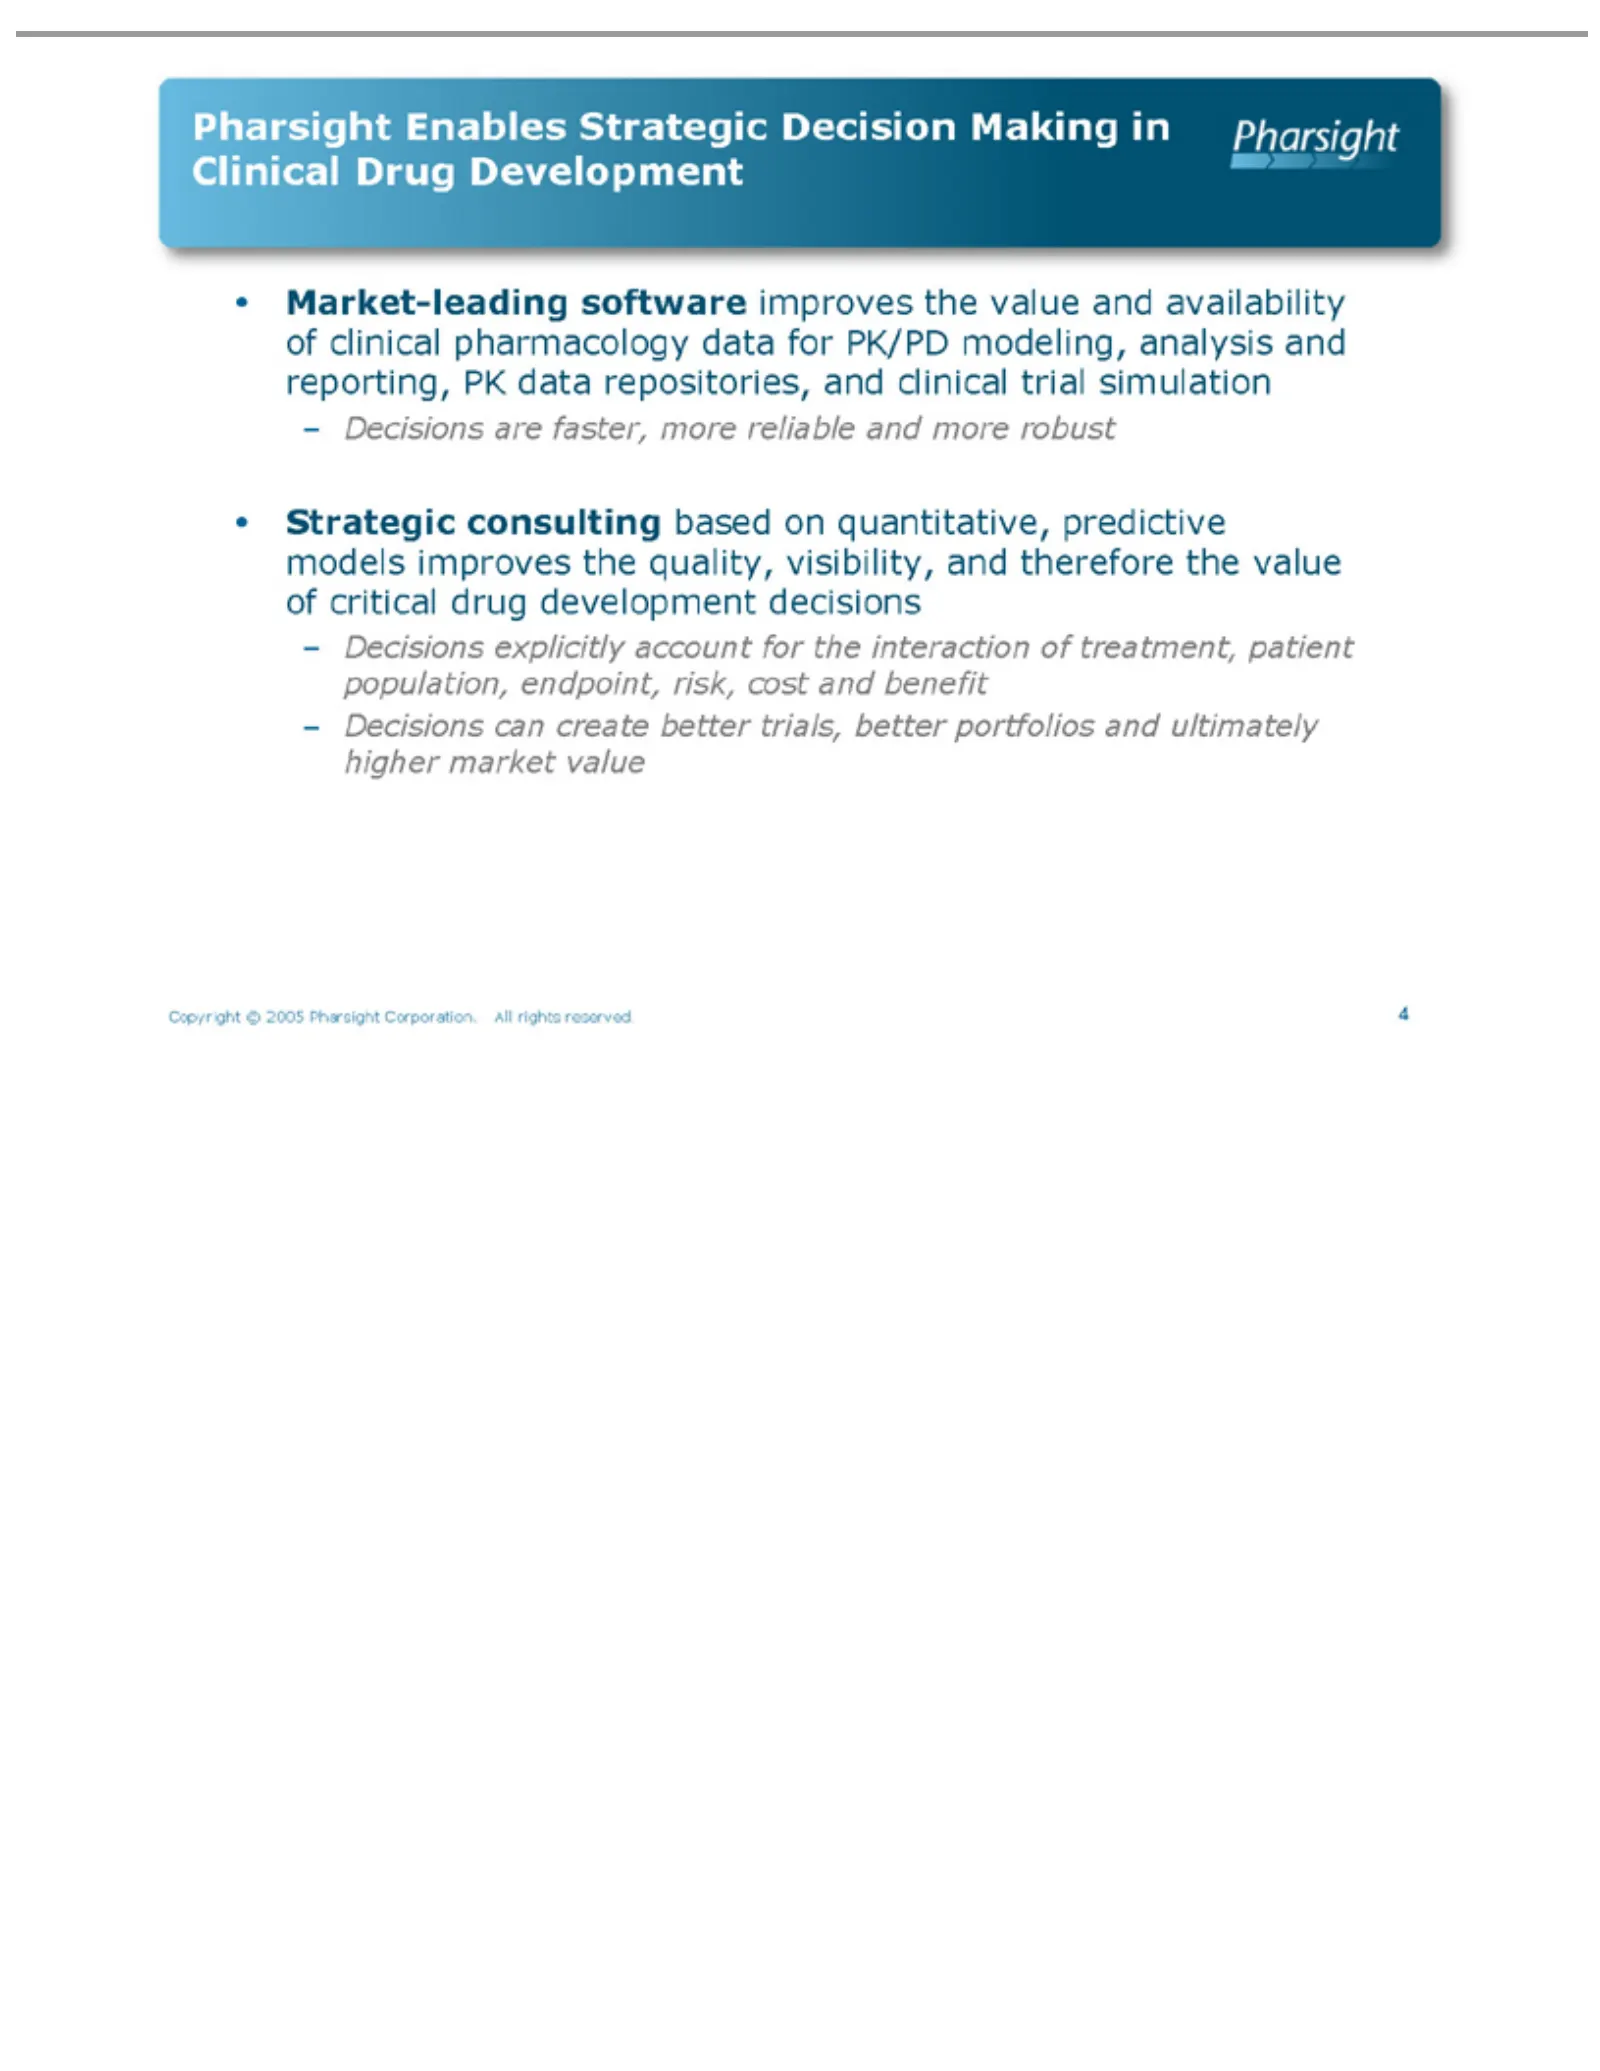
Slide 4: Pharsight Market-leading Strategic Decision Making in Drug Development
Pharsight Market-leading Strategic – Copyright 4 Decisions consulting Enables ©can are explicitly 2005 software faster, create Strategic Pharsight based account more better improves on Decision reliable Corporation. trials, quantitative, for the the better and Making interaction value more portfolio
Slide 5: Executive Team
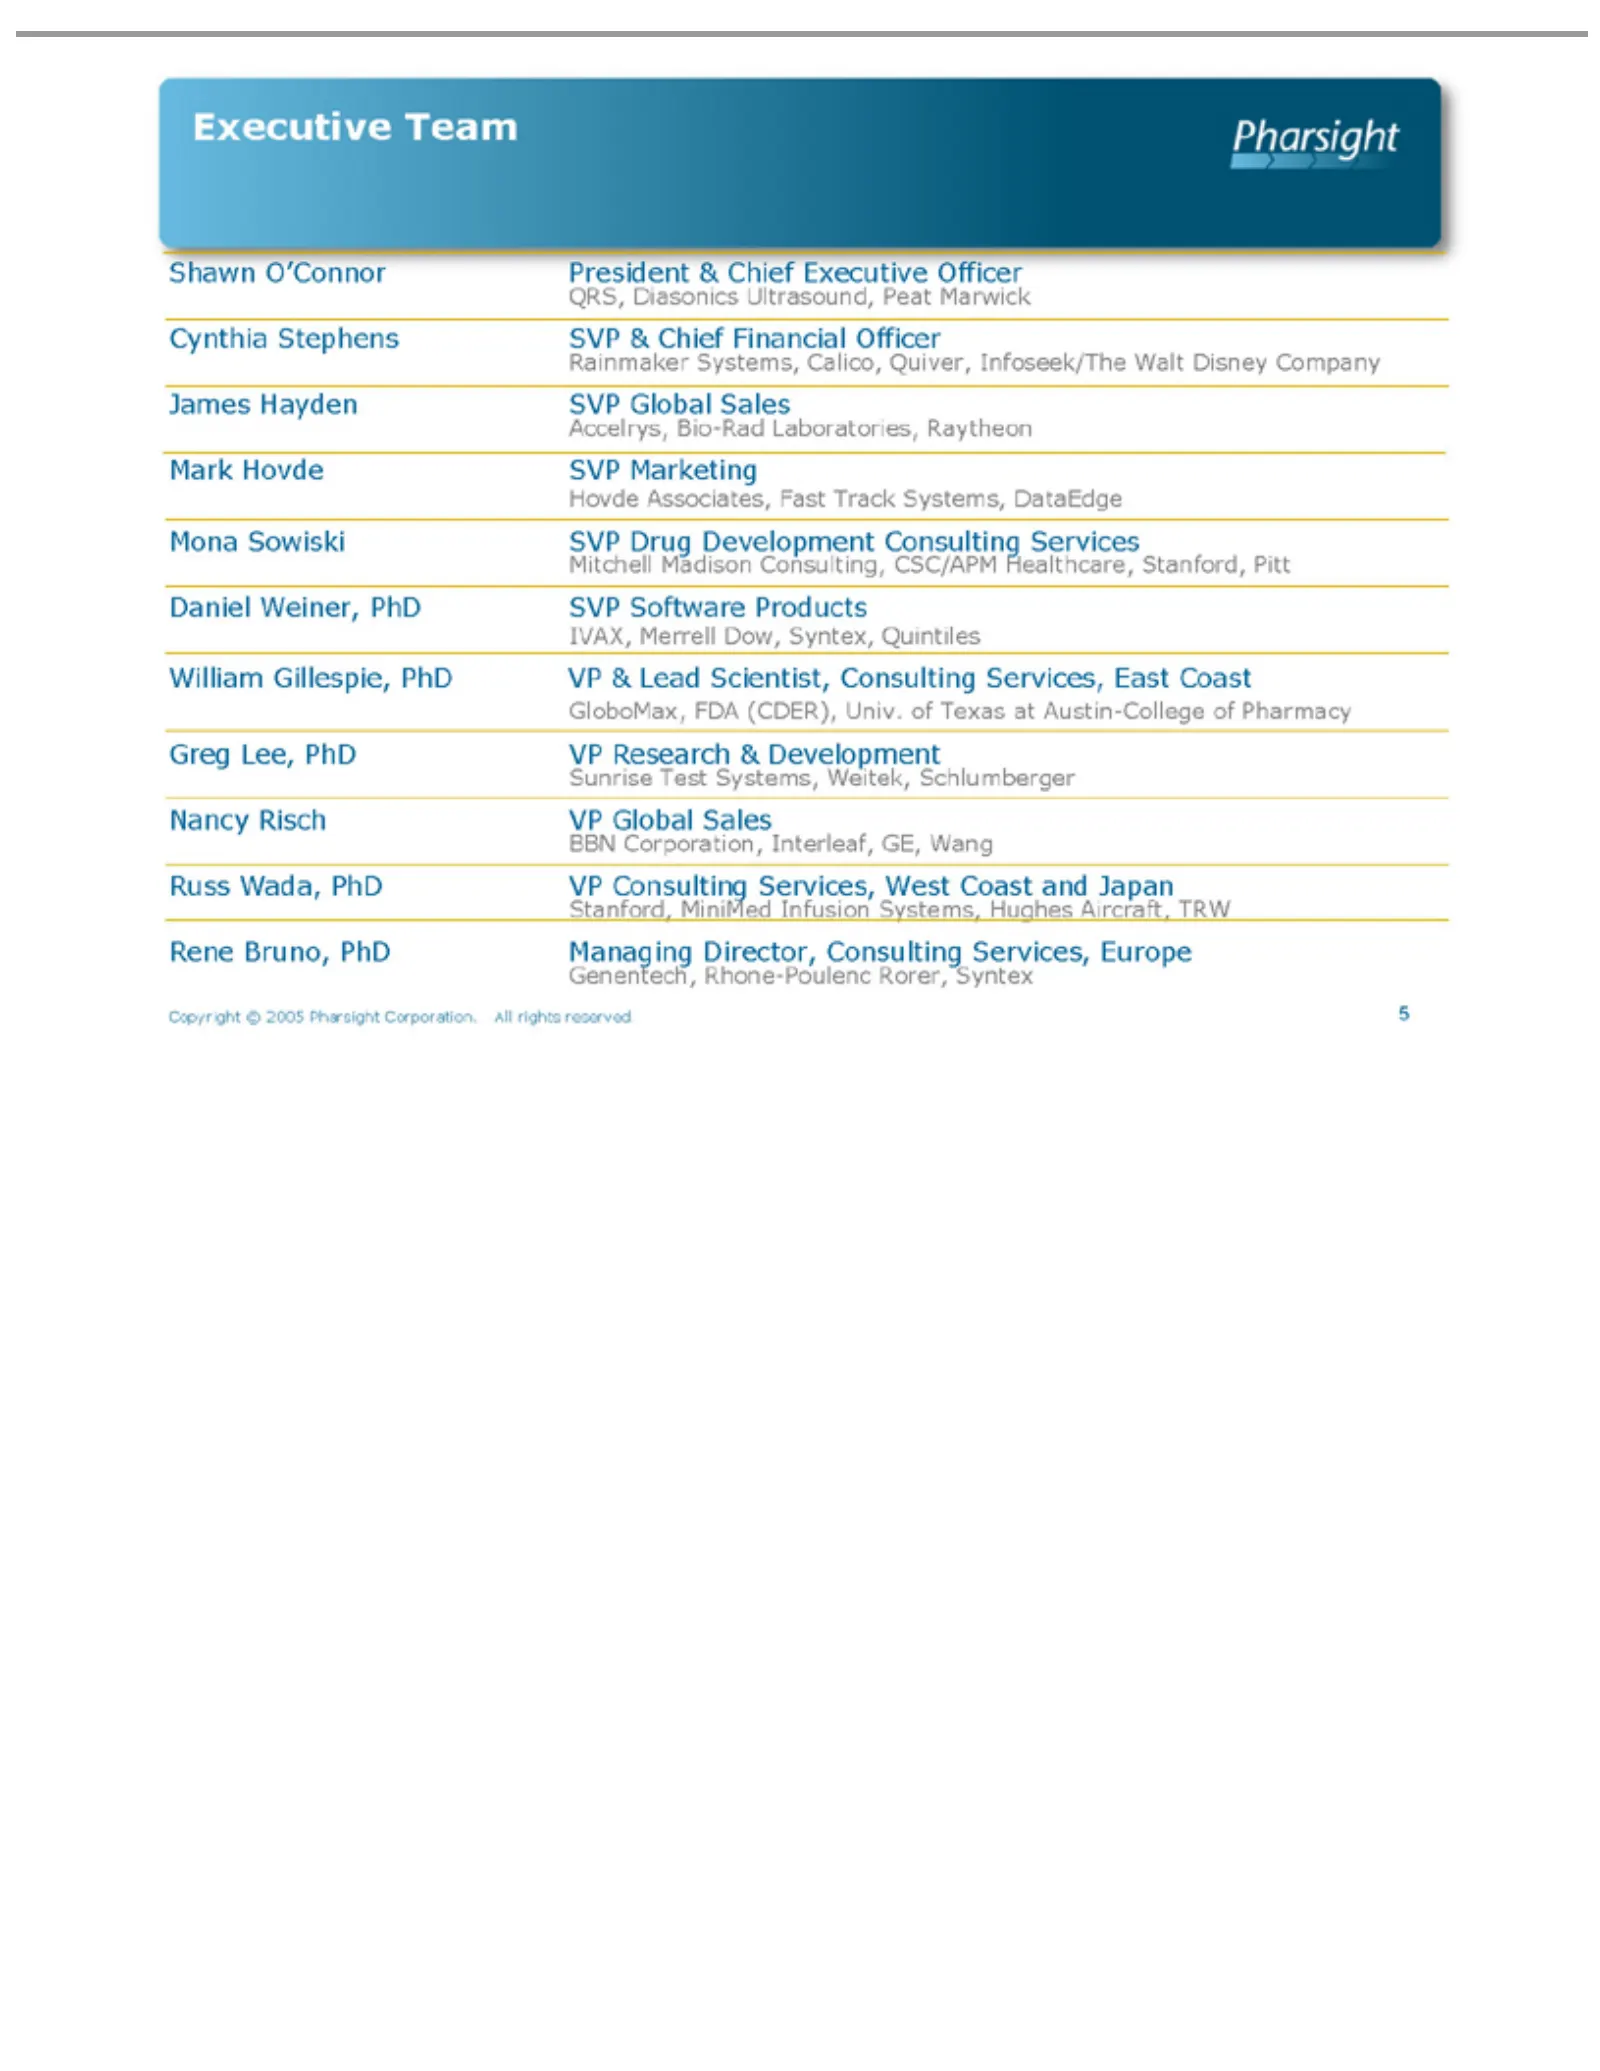
Executive Shawn Cynthia James Mark Mona Daniel William Greg Nancy Russ Rene Copyright 5 Wada, Lee, Bruno, Hovde Sowiski Hayden Risch Weiner, O’Connor Stephens Gillespie, Team PhD ©PhD PhD 2005 SVP VPSVP PhD VP Global VP President SVP Managing Marketing Pharsight PhD Research Global Drug SVP Consulti
Slide 6: Our Market Opportunity: Drug Development Productivity Continues to Decline
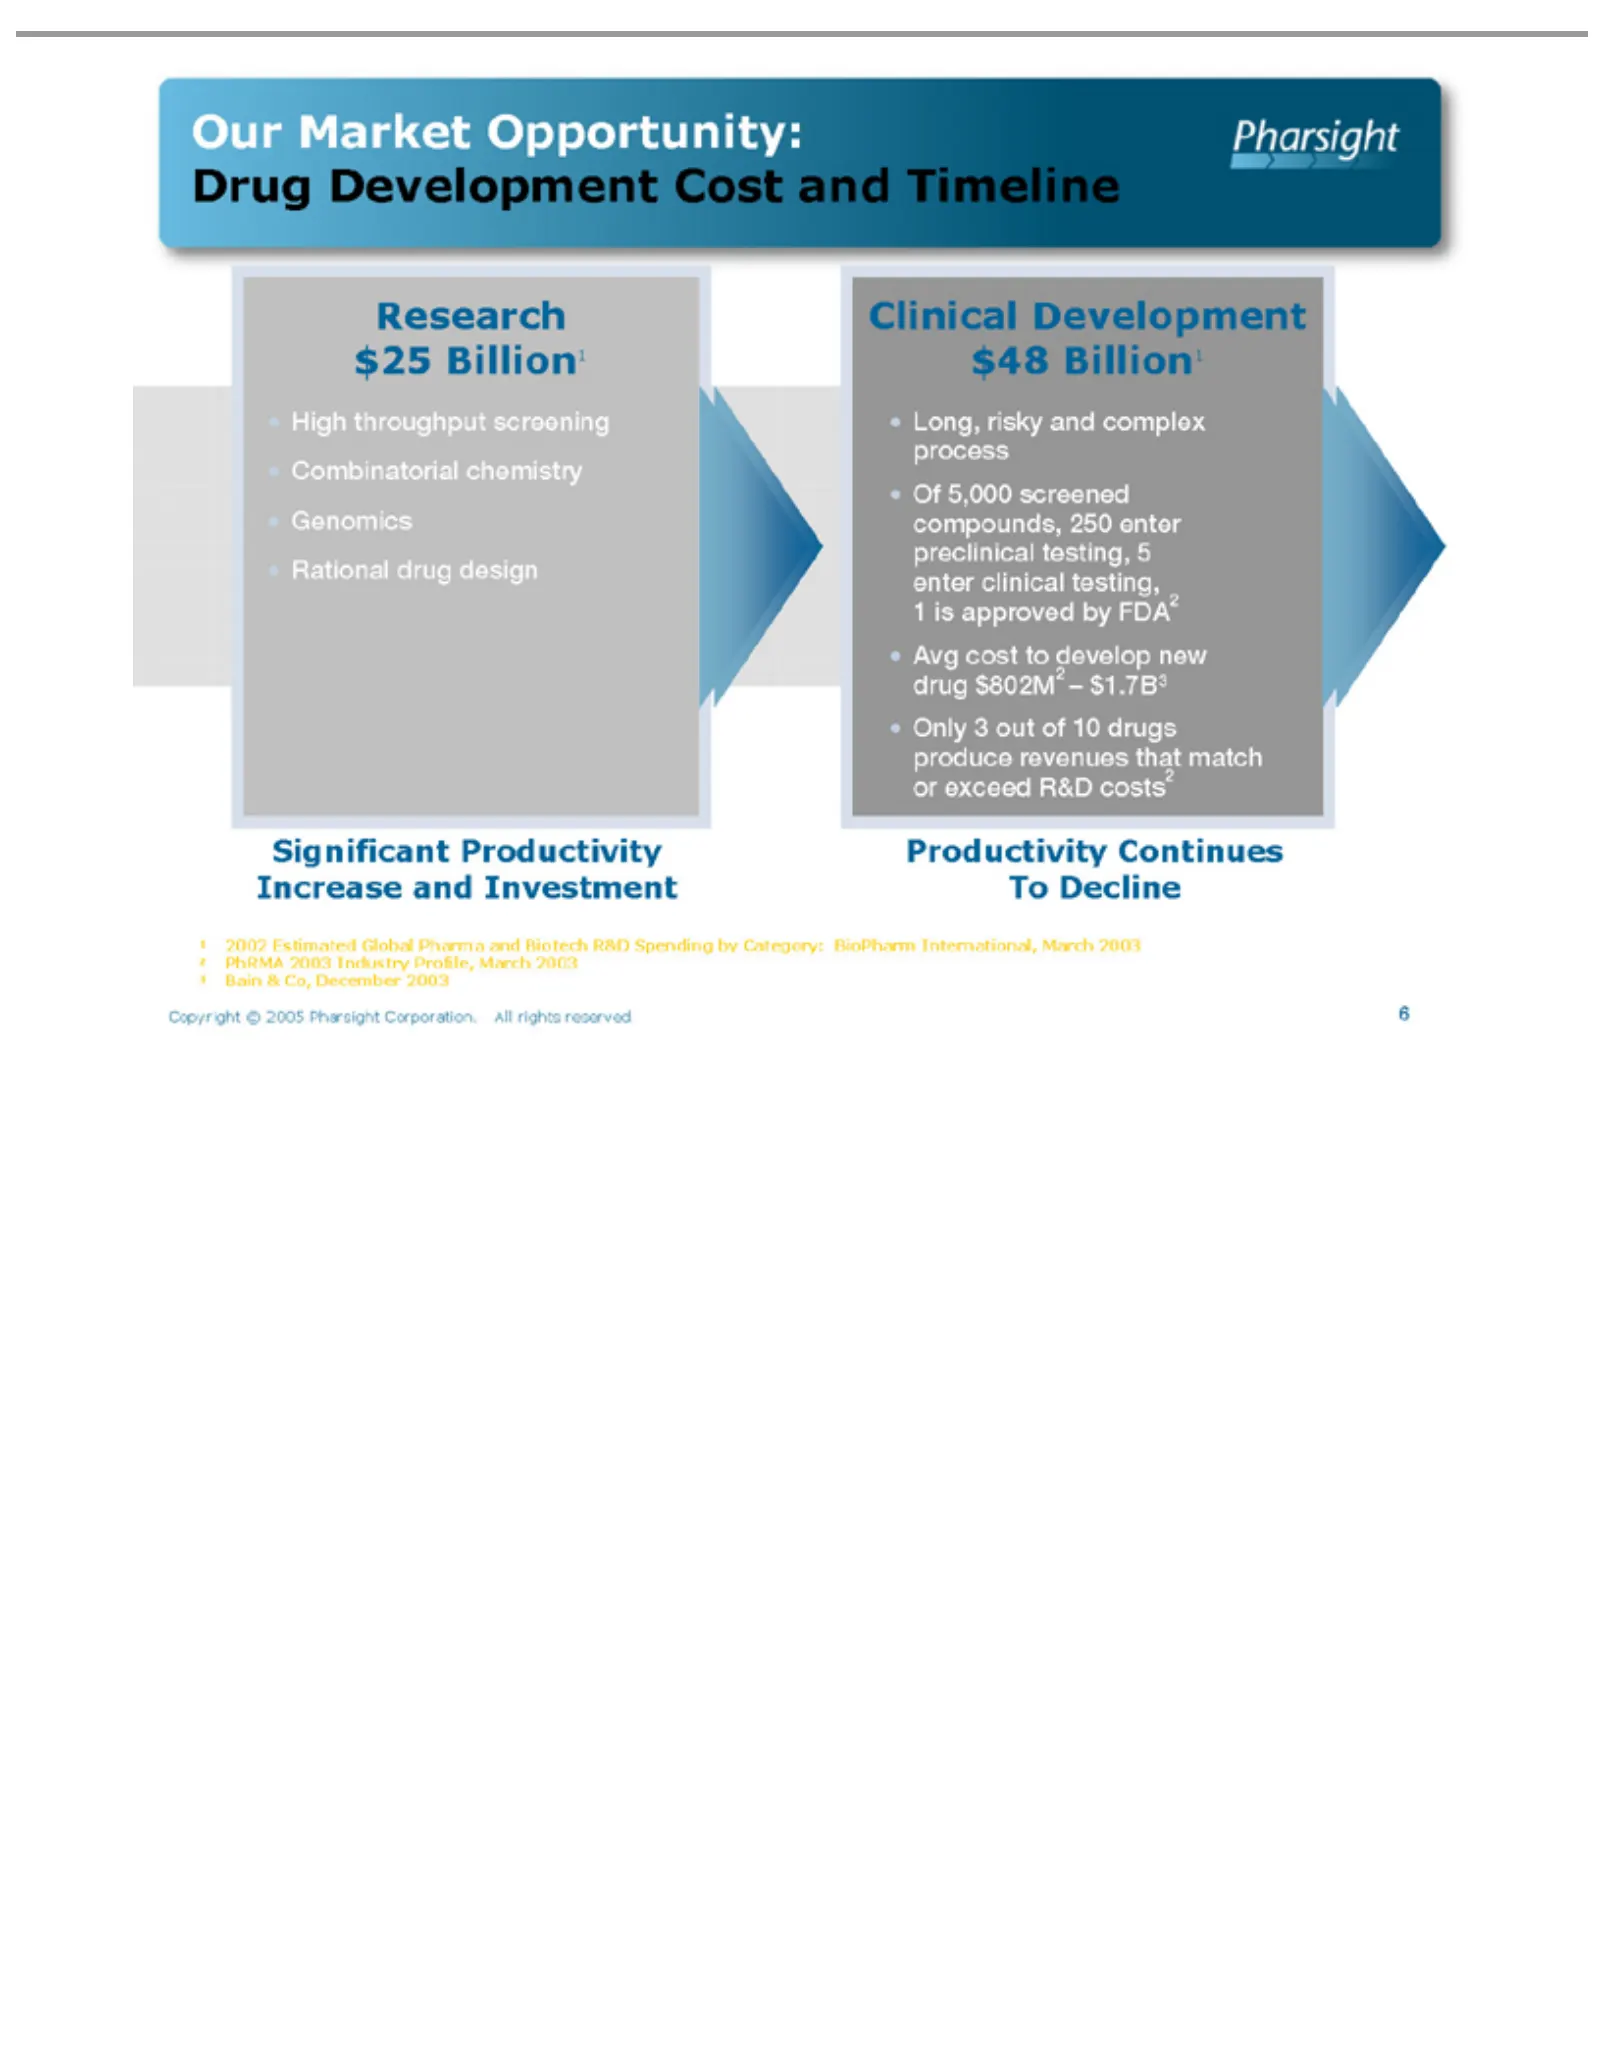
Our5,000 Drug Research High Clinical Long, Of Avg Only Significant Productivity 1 2 3 6 2002 Market cost 3throughput Development risky PhRMA Bain Copyrightout Development to screened Estimated &$25 of ©Productivity develop and Opportunity: Continues 10 Billion1 2003 Co, complex drugs screening compo
Slide 7: Our Market Opportunity: Total Pharma Development Expenditure
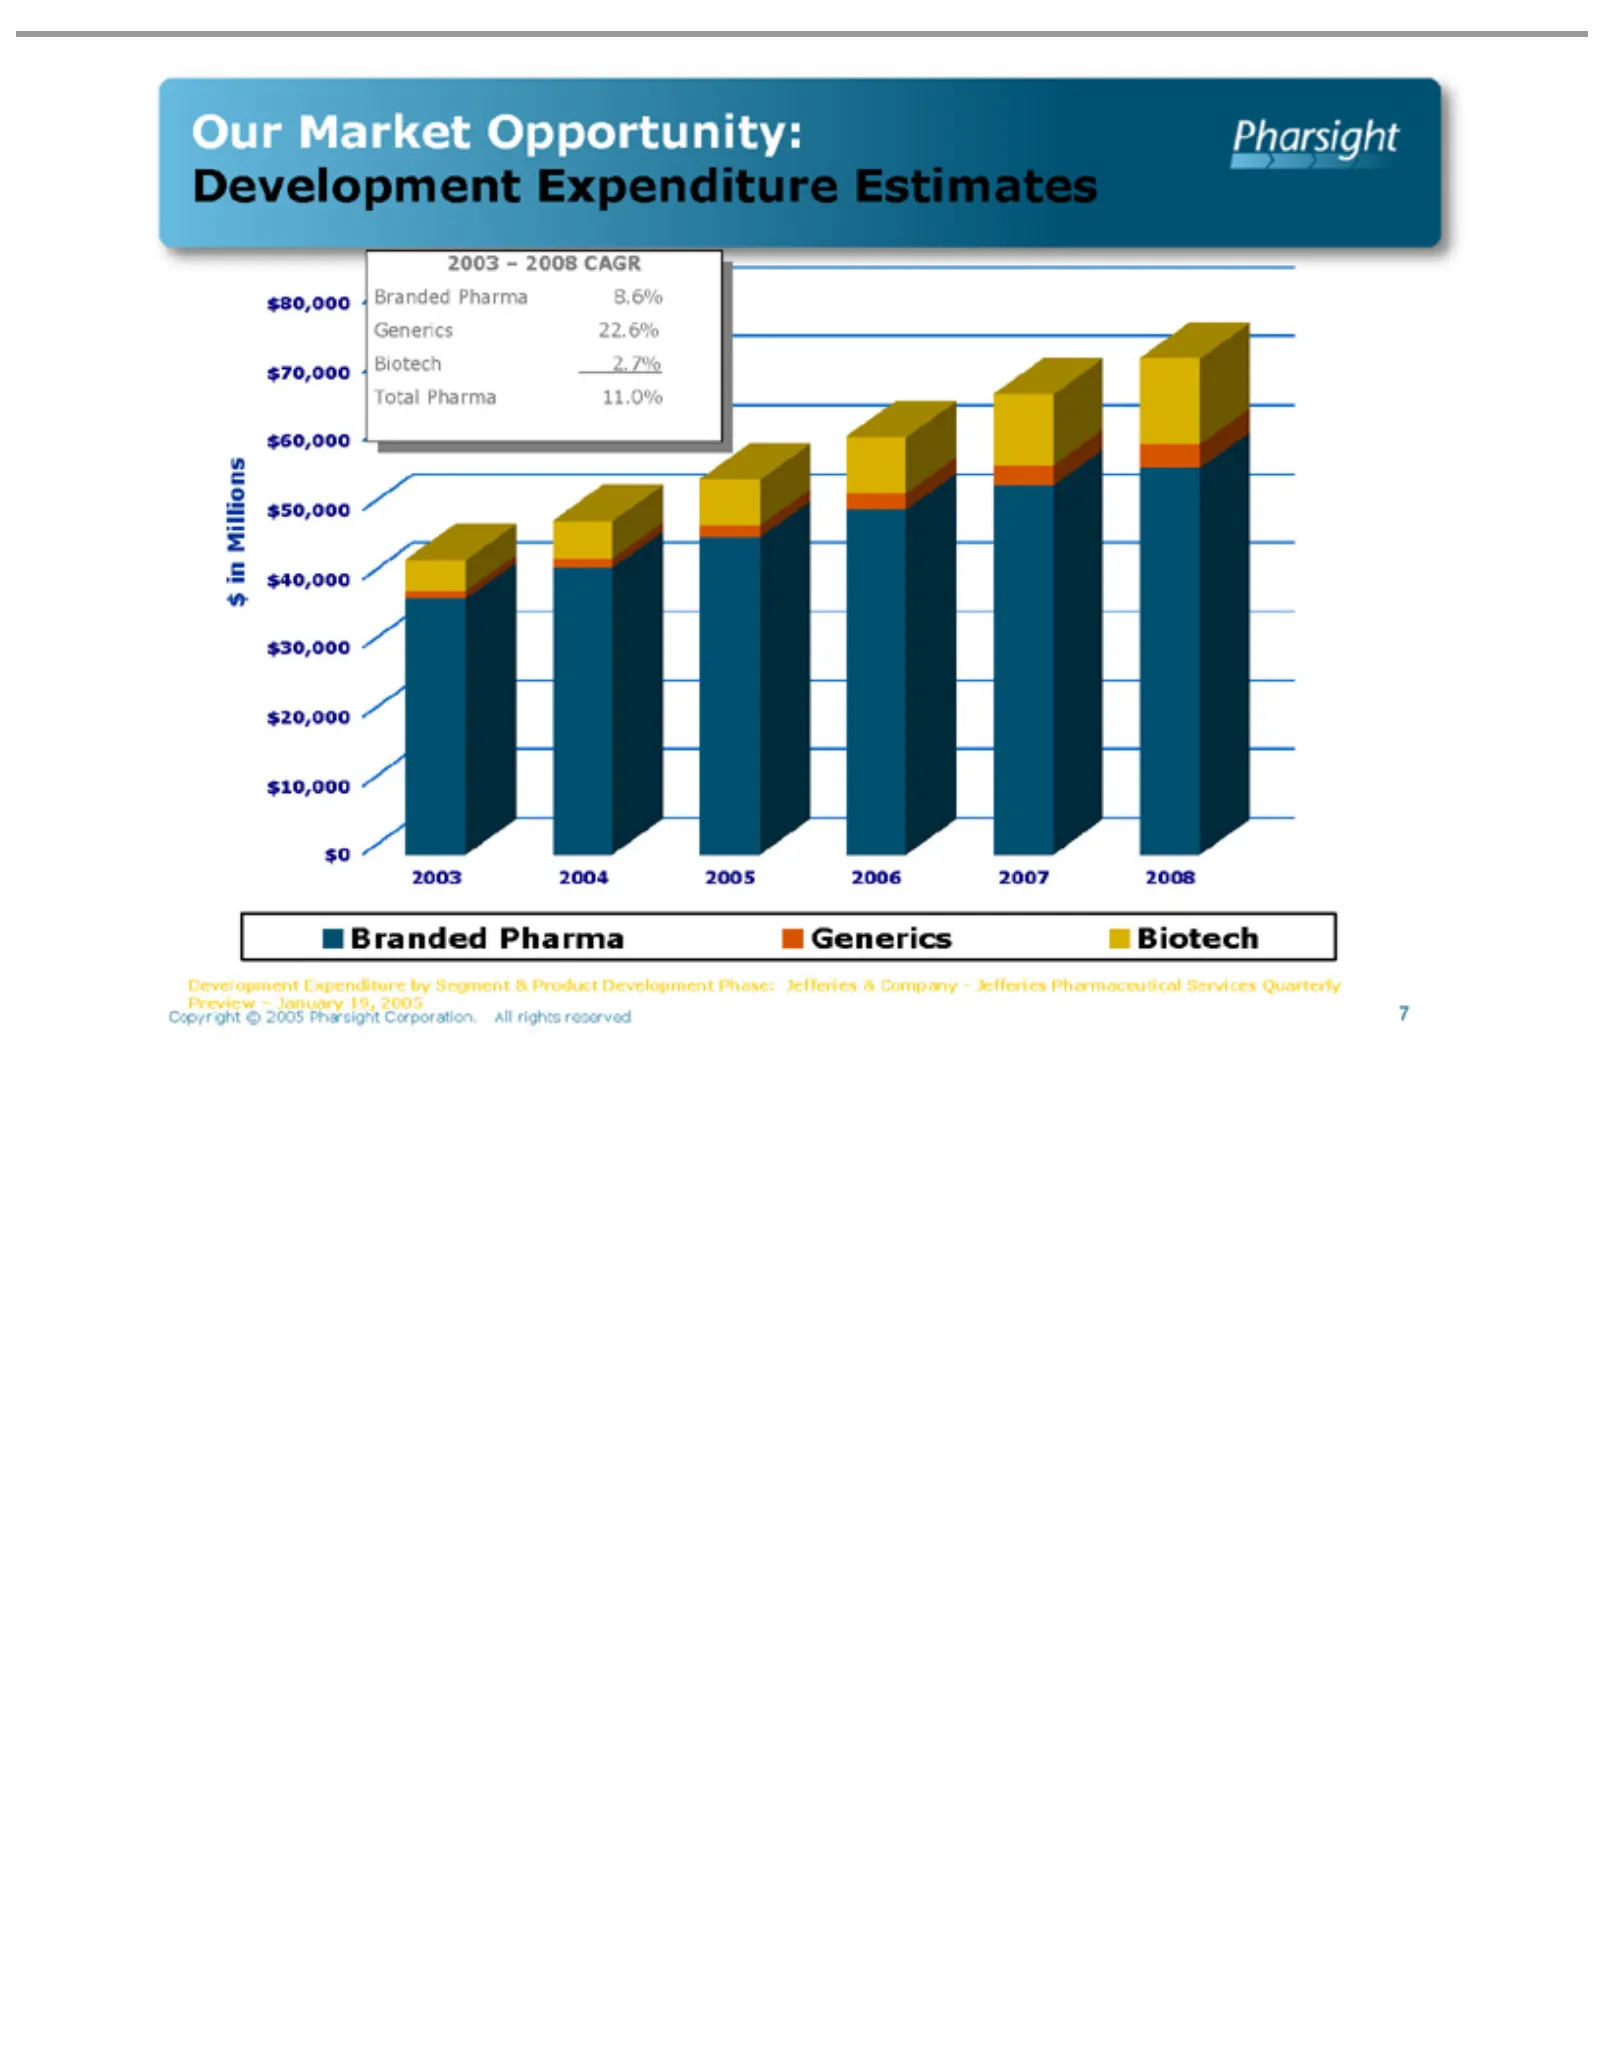
Our Market Total 2003 Branded Development Biotech Generics Copyright –Pharma 2004 2008 2.7% Pharma 22.6% ©2005 Opportunity: CAGR 2005 11.0% Expenditure 2006 8.6% Pharsight 2007by Estimates 2008 Corporation. Segment & Product All rights Development reserved. 7 Phase: Jefferies & Company—Jefferies Pha
Slide 8: Our Market Opportunity: Decreasing Drug Approval Failure Rates
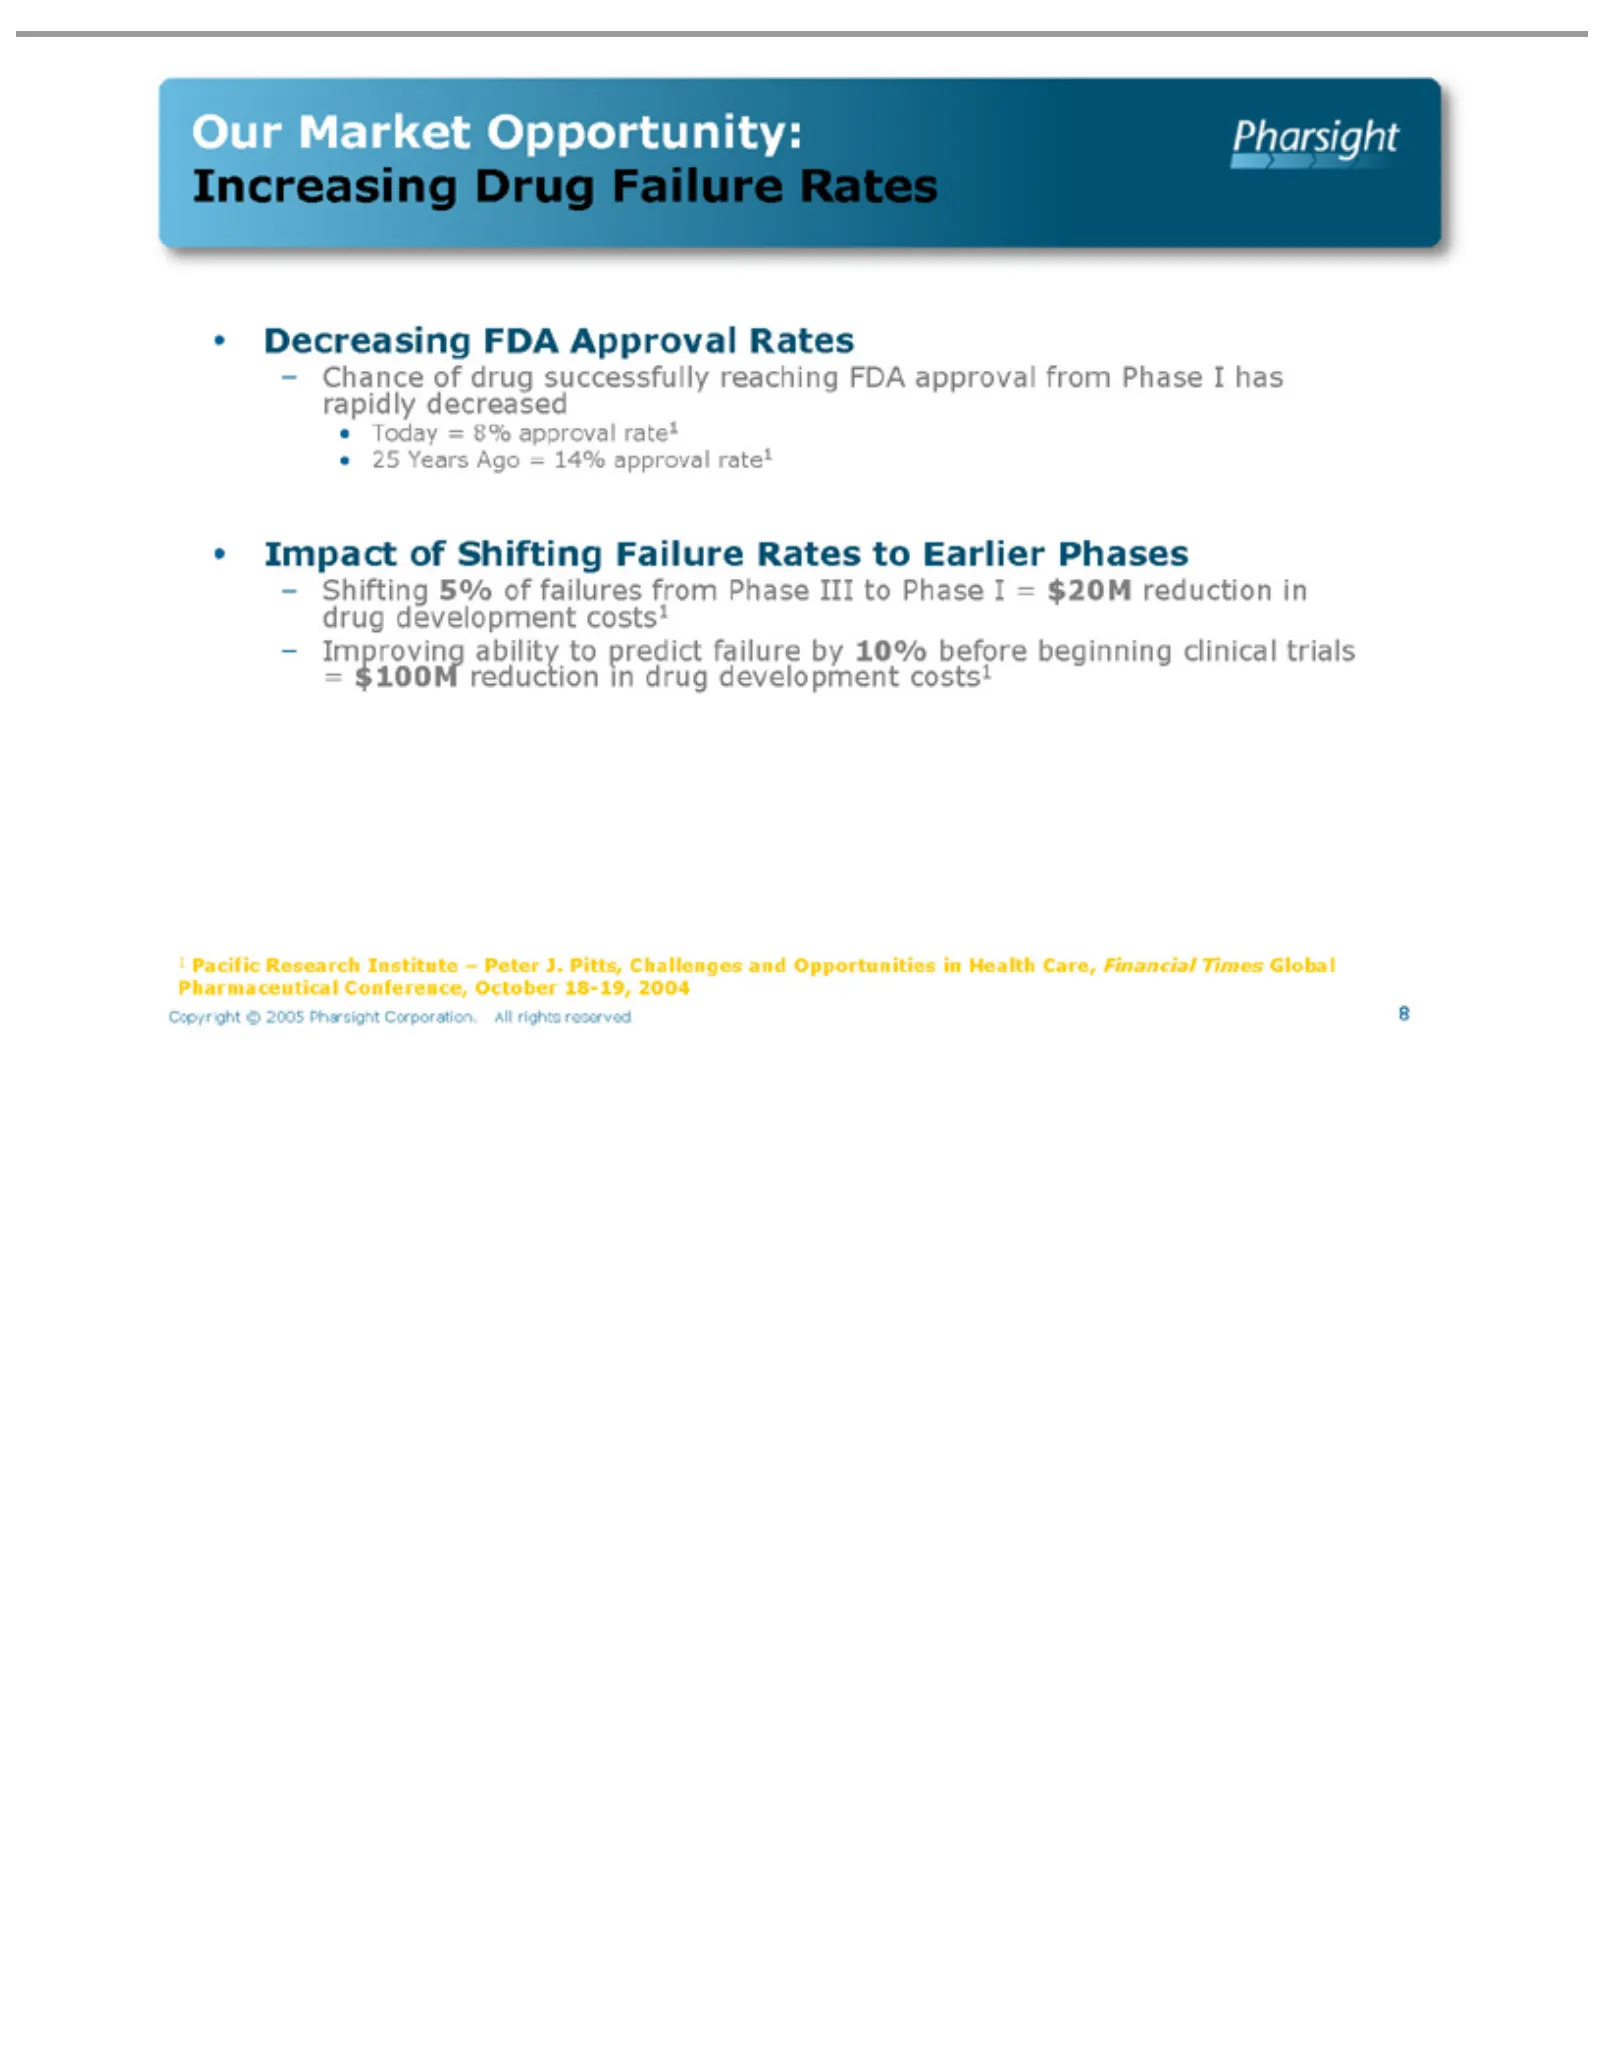
Our Decreasing C Today 25 Impact – = 1 Copyright 8 hance Shifting Improving Pacific $Years 100M Market =of of 8% Ago Research Shifting reduction 5% © drug FDA Opportunity: approval ability 2005 =ofsuccessfully 14% Approval failures Pharsight Failure Institute to inapproval rate1 predict drug from In
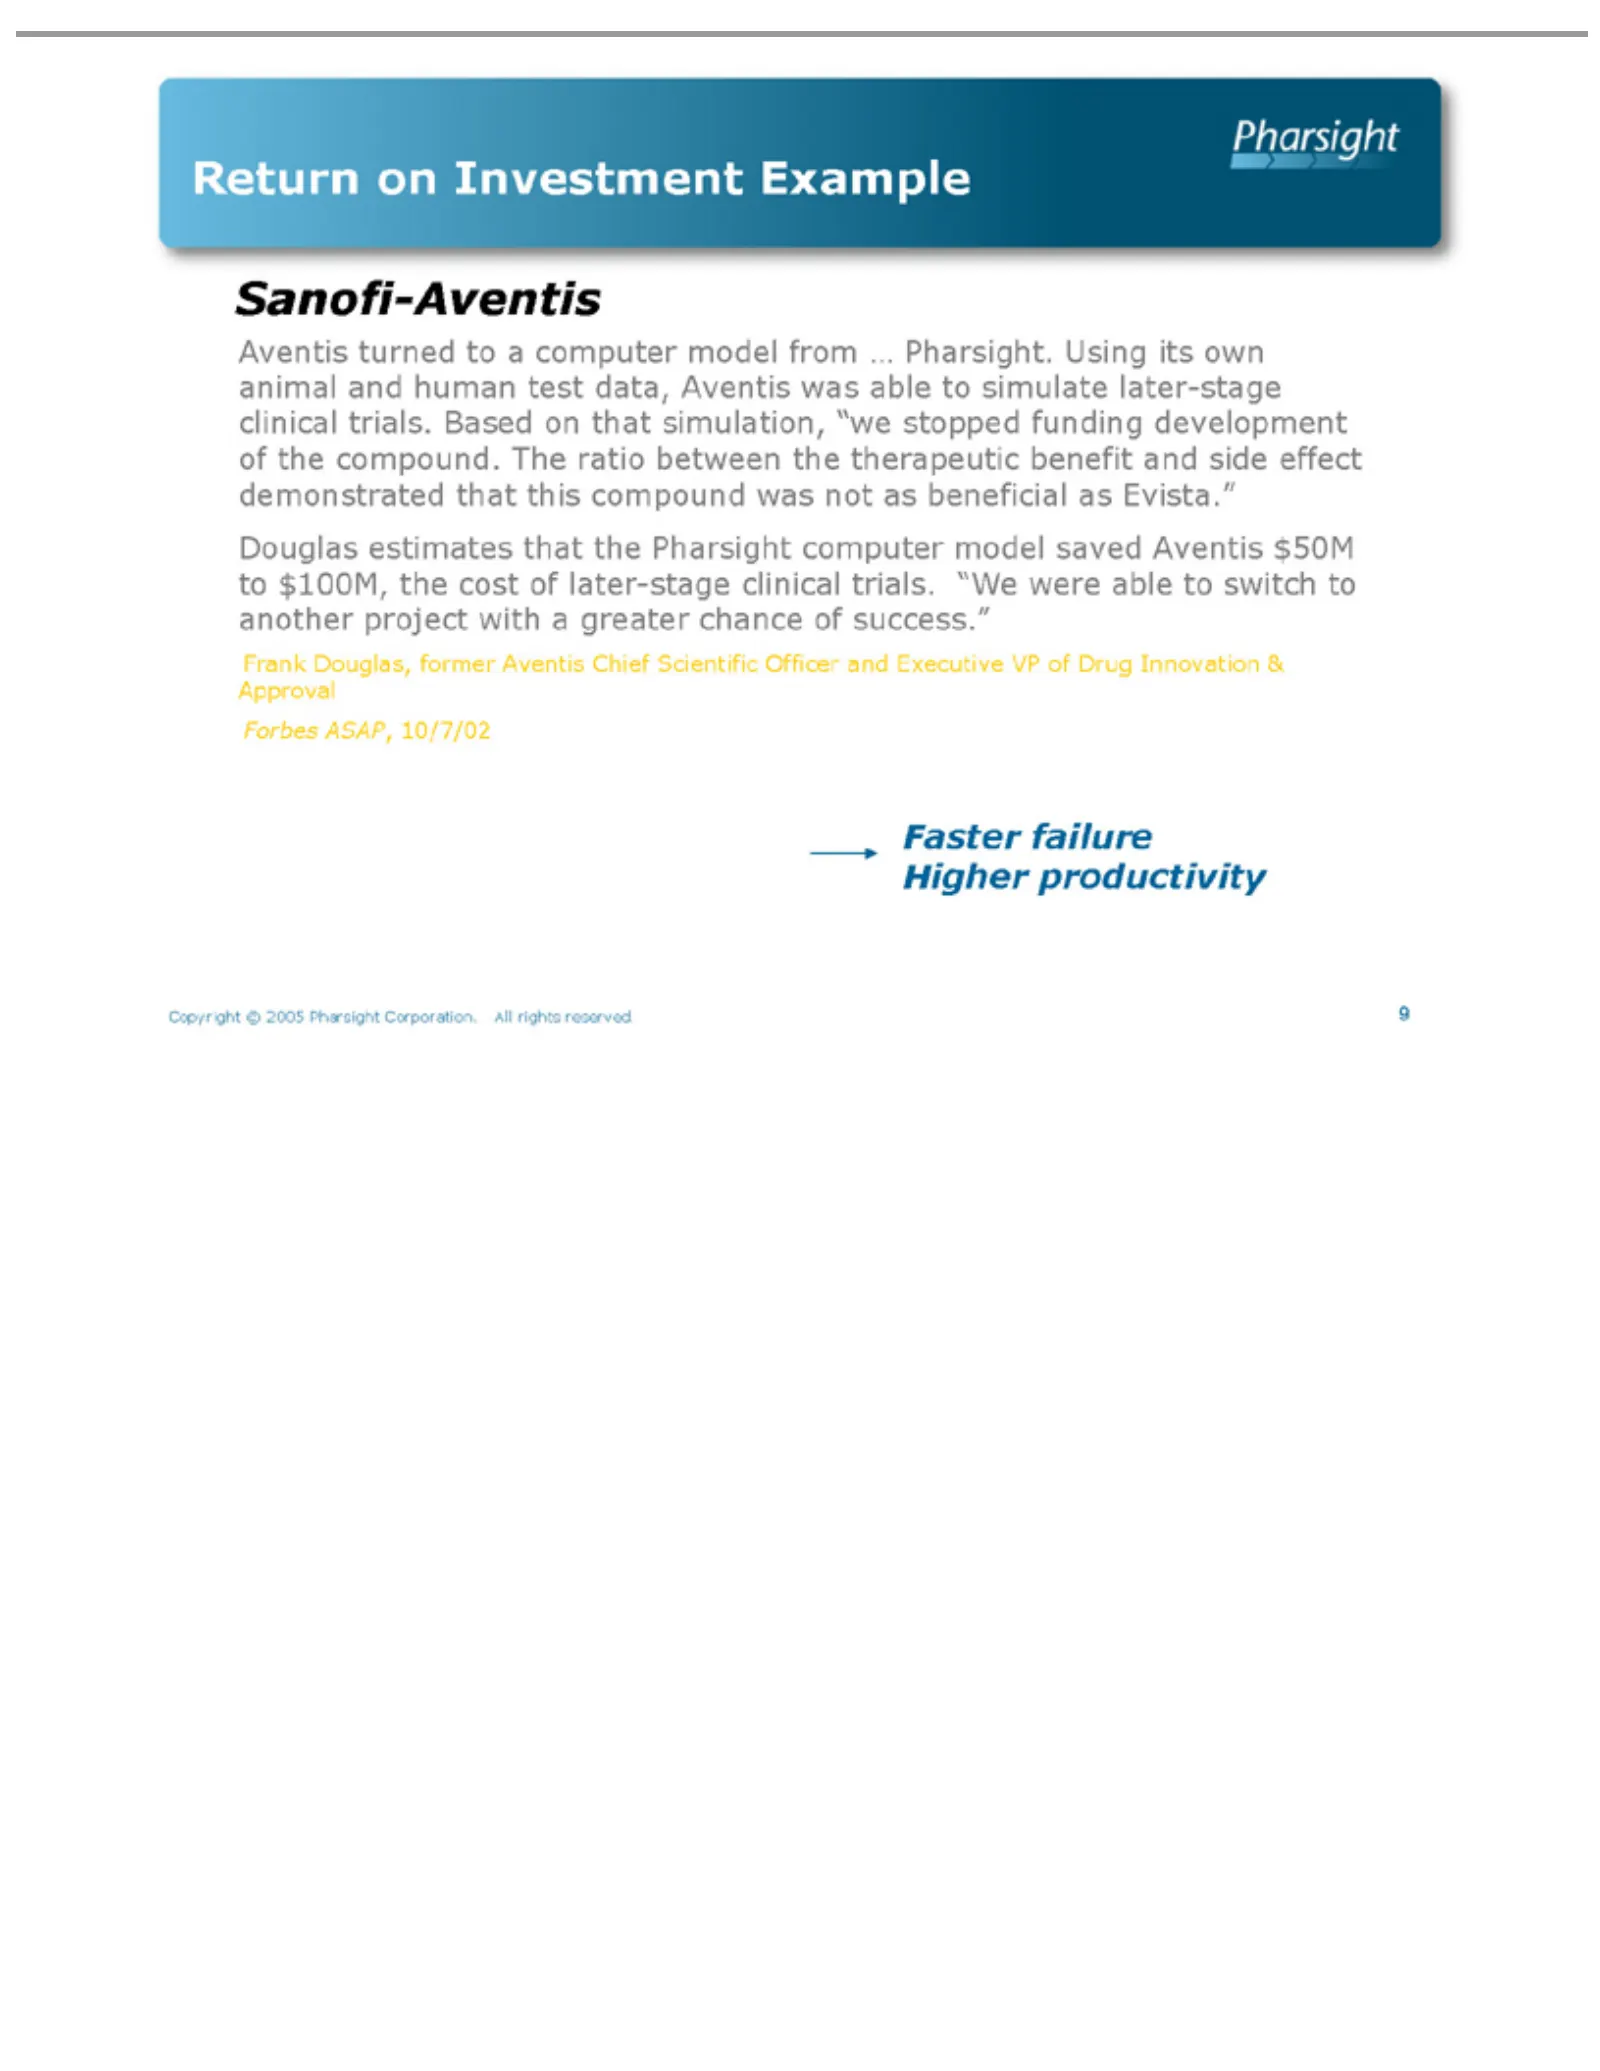
Slide 9: Return on Investment Example: Aventis
ReturnDouglas, Aventis Sanofi-Aventis funding computer Frank Forbes Faster Copyright 9 failure ASAP, on turned development model Investment © 2005 Higher 10/7/02 toformer saved aPharsight computer productivity of Example Aventis the compound. Corporation. model $50M Chieffrom Scientific to The $100M
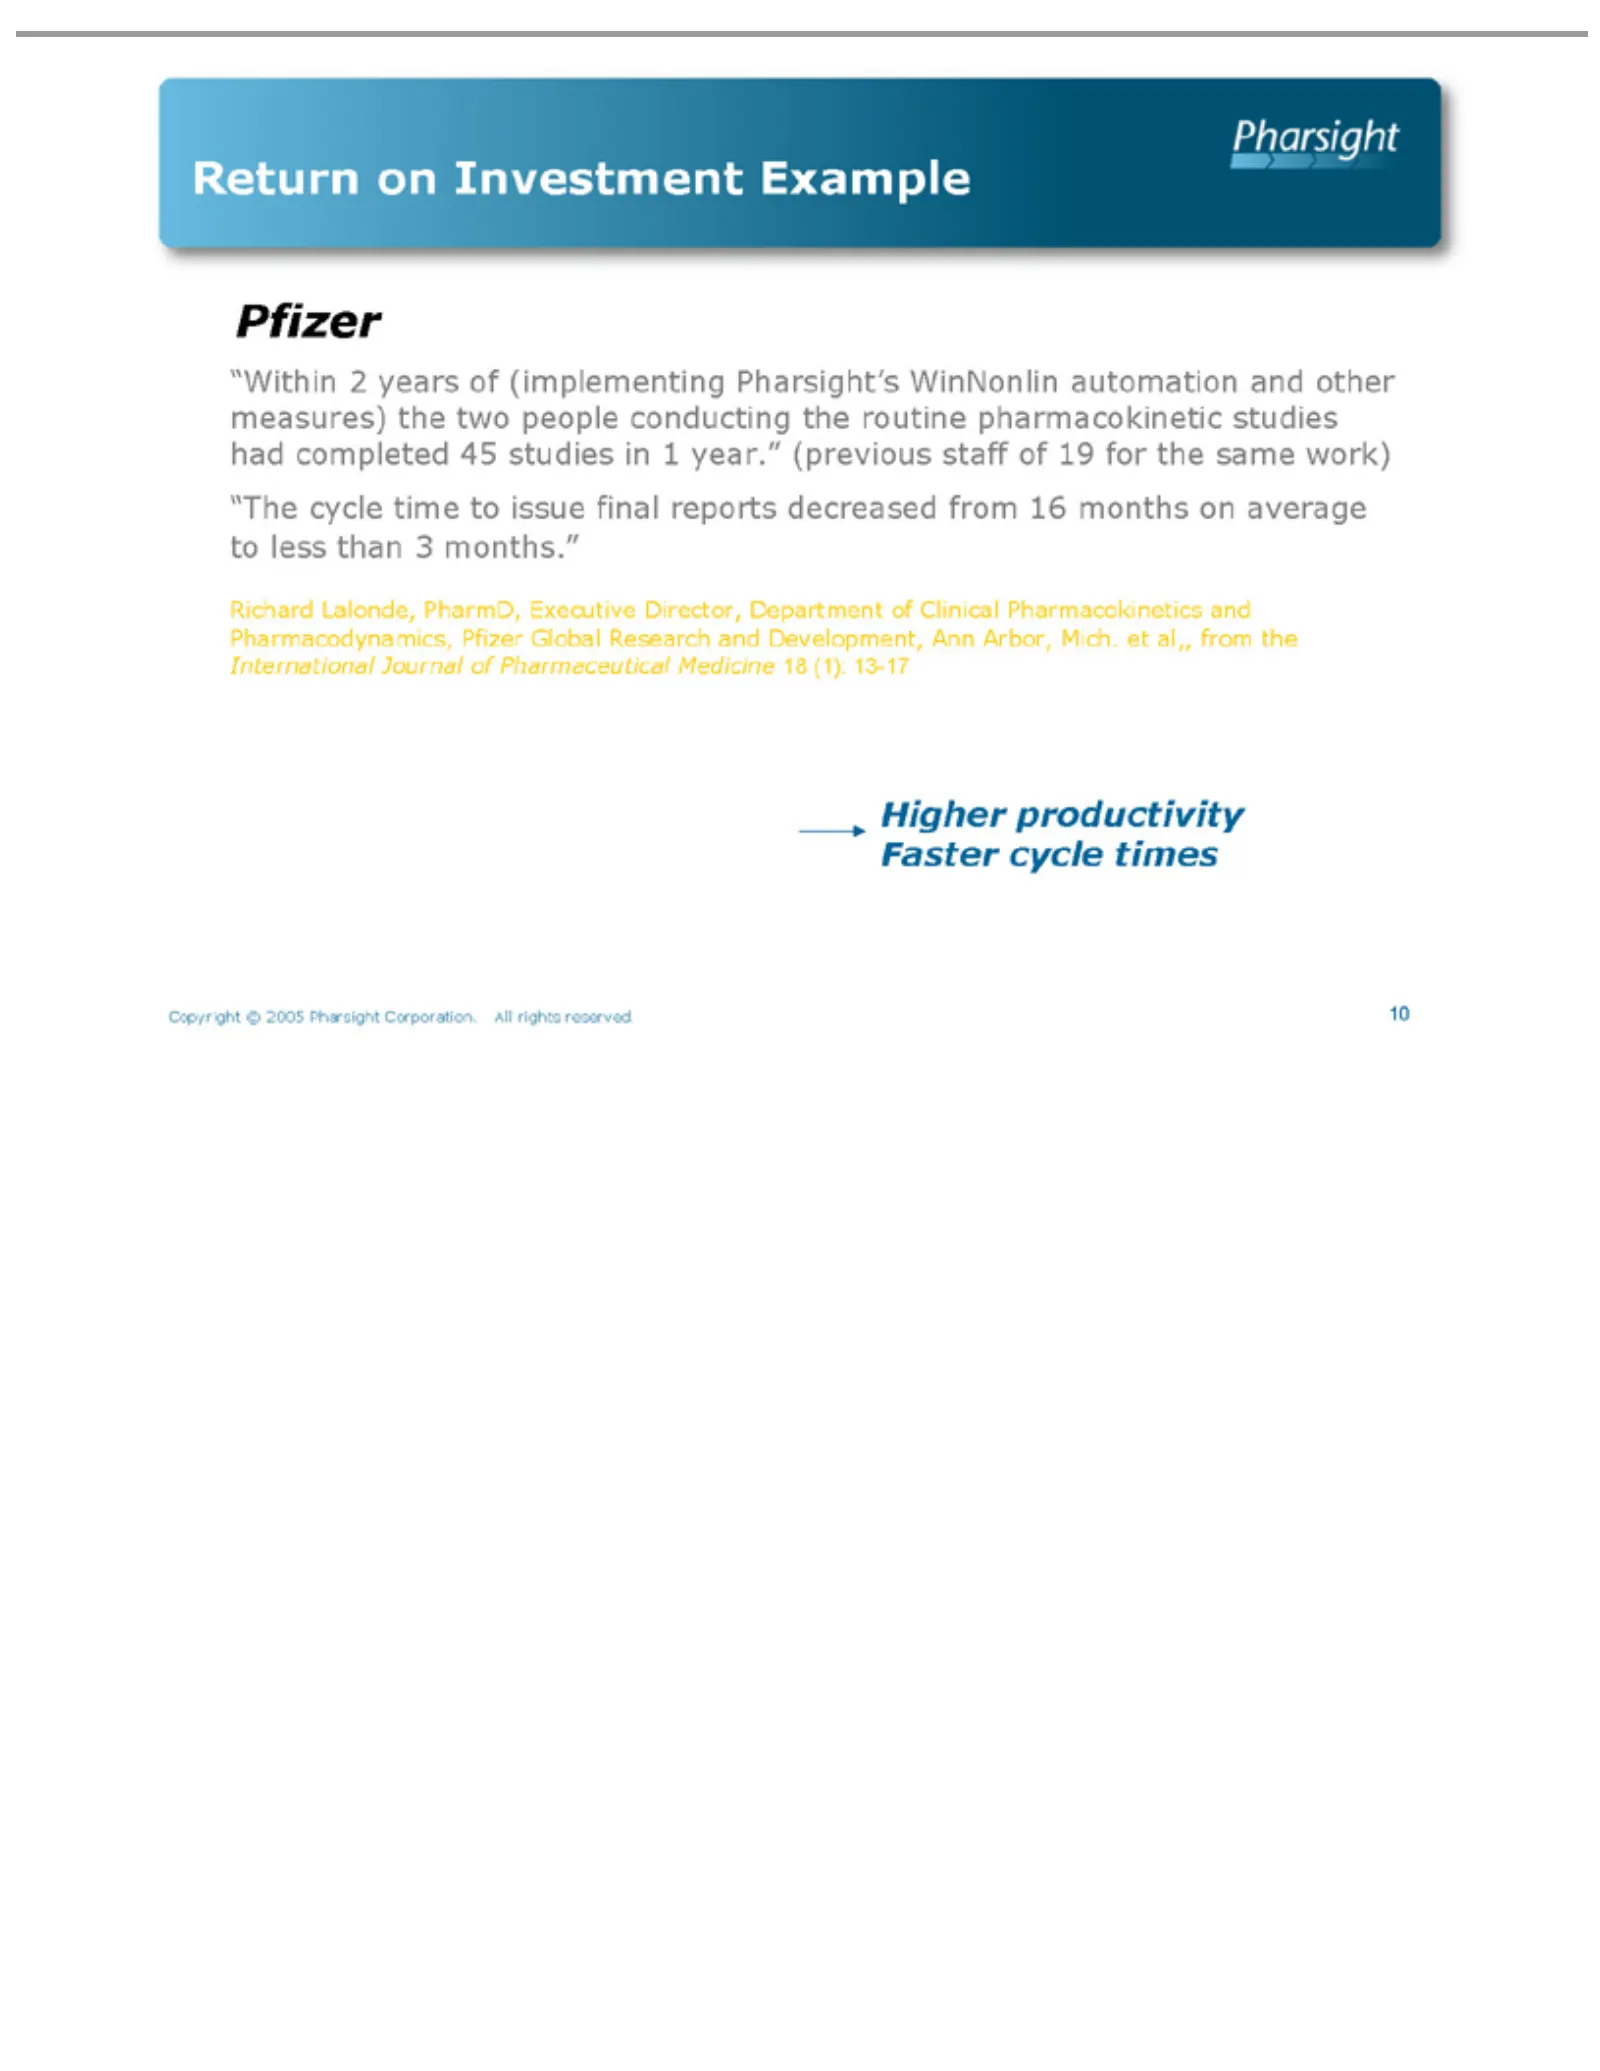
Slide 10: Return on Investment Example: Pfizer
Return on “Within Pfizer (previous Richard International Higher Copyright 10 productivity Lalonde, 2 staff years Investment © 2005 Journal ofof19 PharmD, Pharsight (implementing Faster for ofExample Pharmaceutical thecycle Executive same Corporation. times work) Pharsight’s Director, Medicine “The A
Slide 11: Pharsight Software Products
Pharsight Software Products
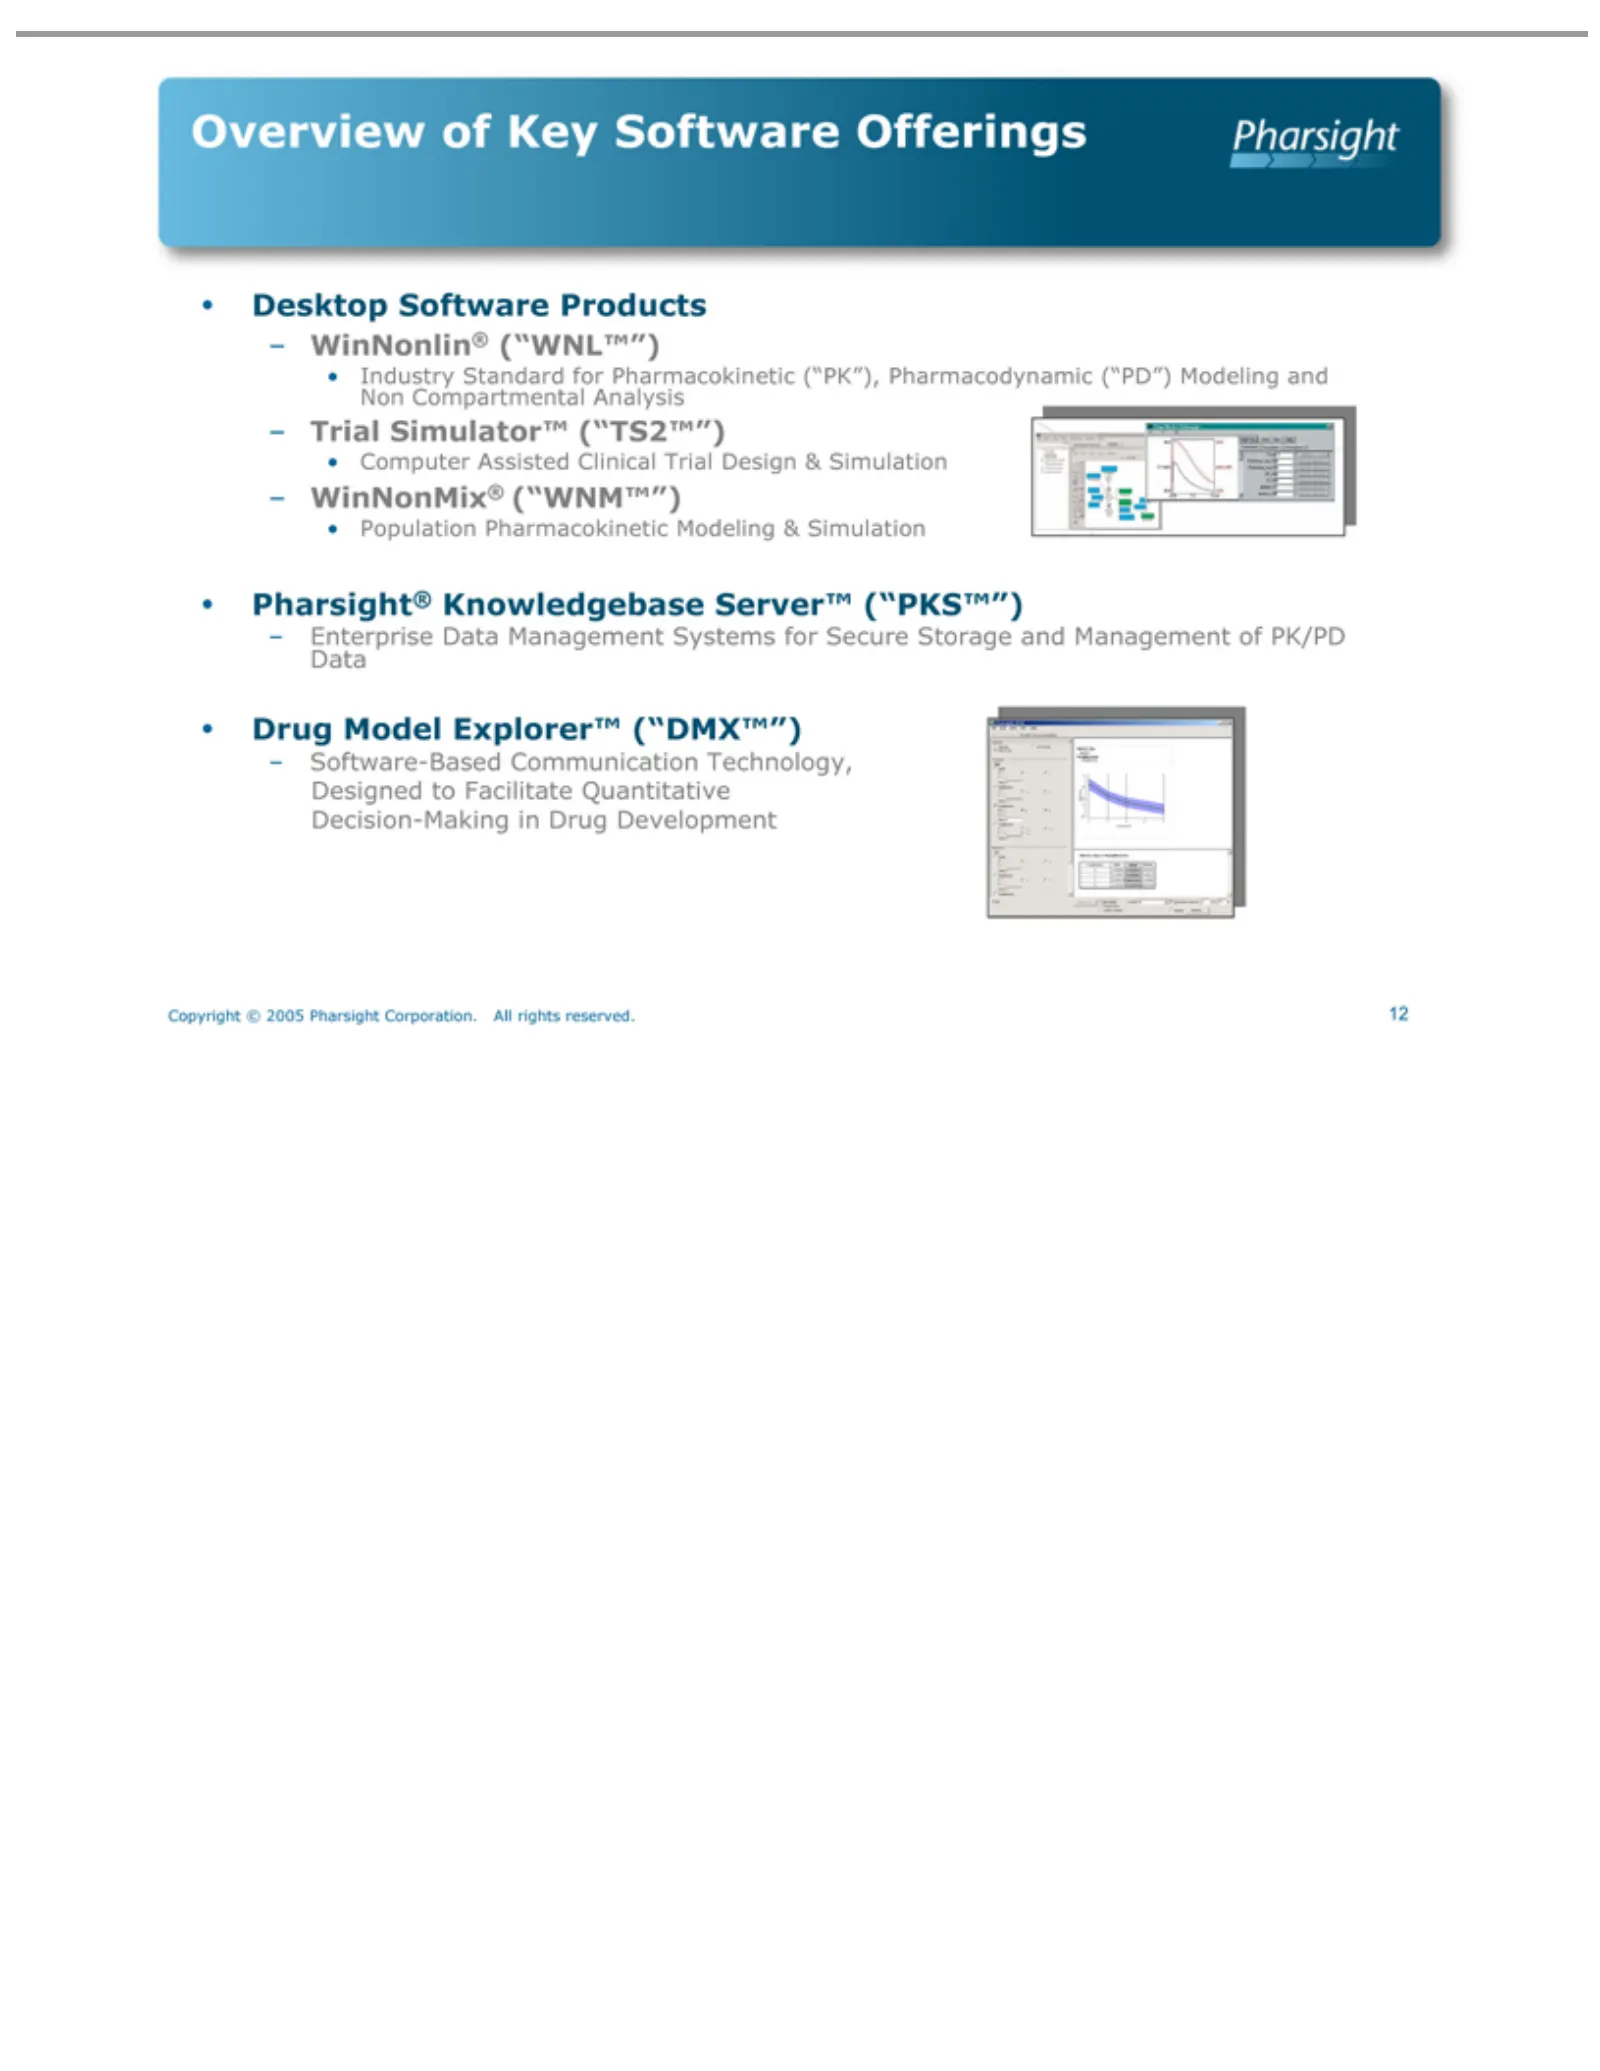
Slide 12: Software Products Overview
Overview Desktop Industry Computer Population Pharsight® Drug – Copyright 12WinNonlin® Trial WinNonMix® Enterprise Software-Based Model Simulator™ Standard Software of Assisted ©Pharmacokinetic Knowledgebase Data Explorer™ Key 2005 (“WNL™”) (“WNM™”) Software Management Communication for Products Pha
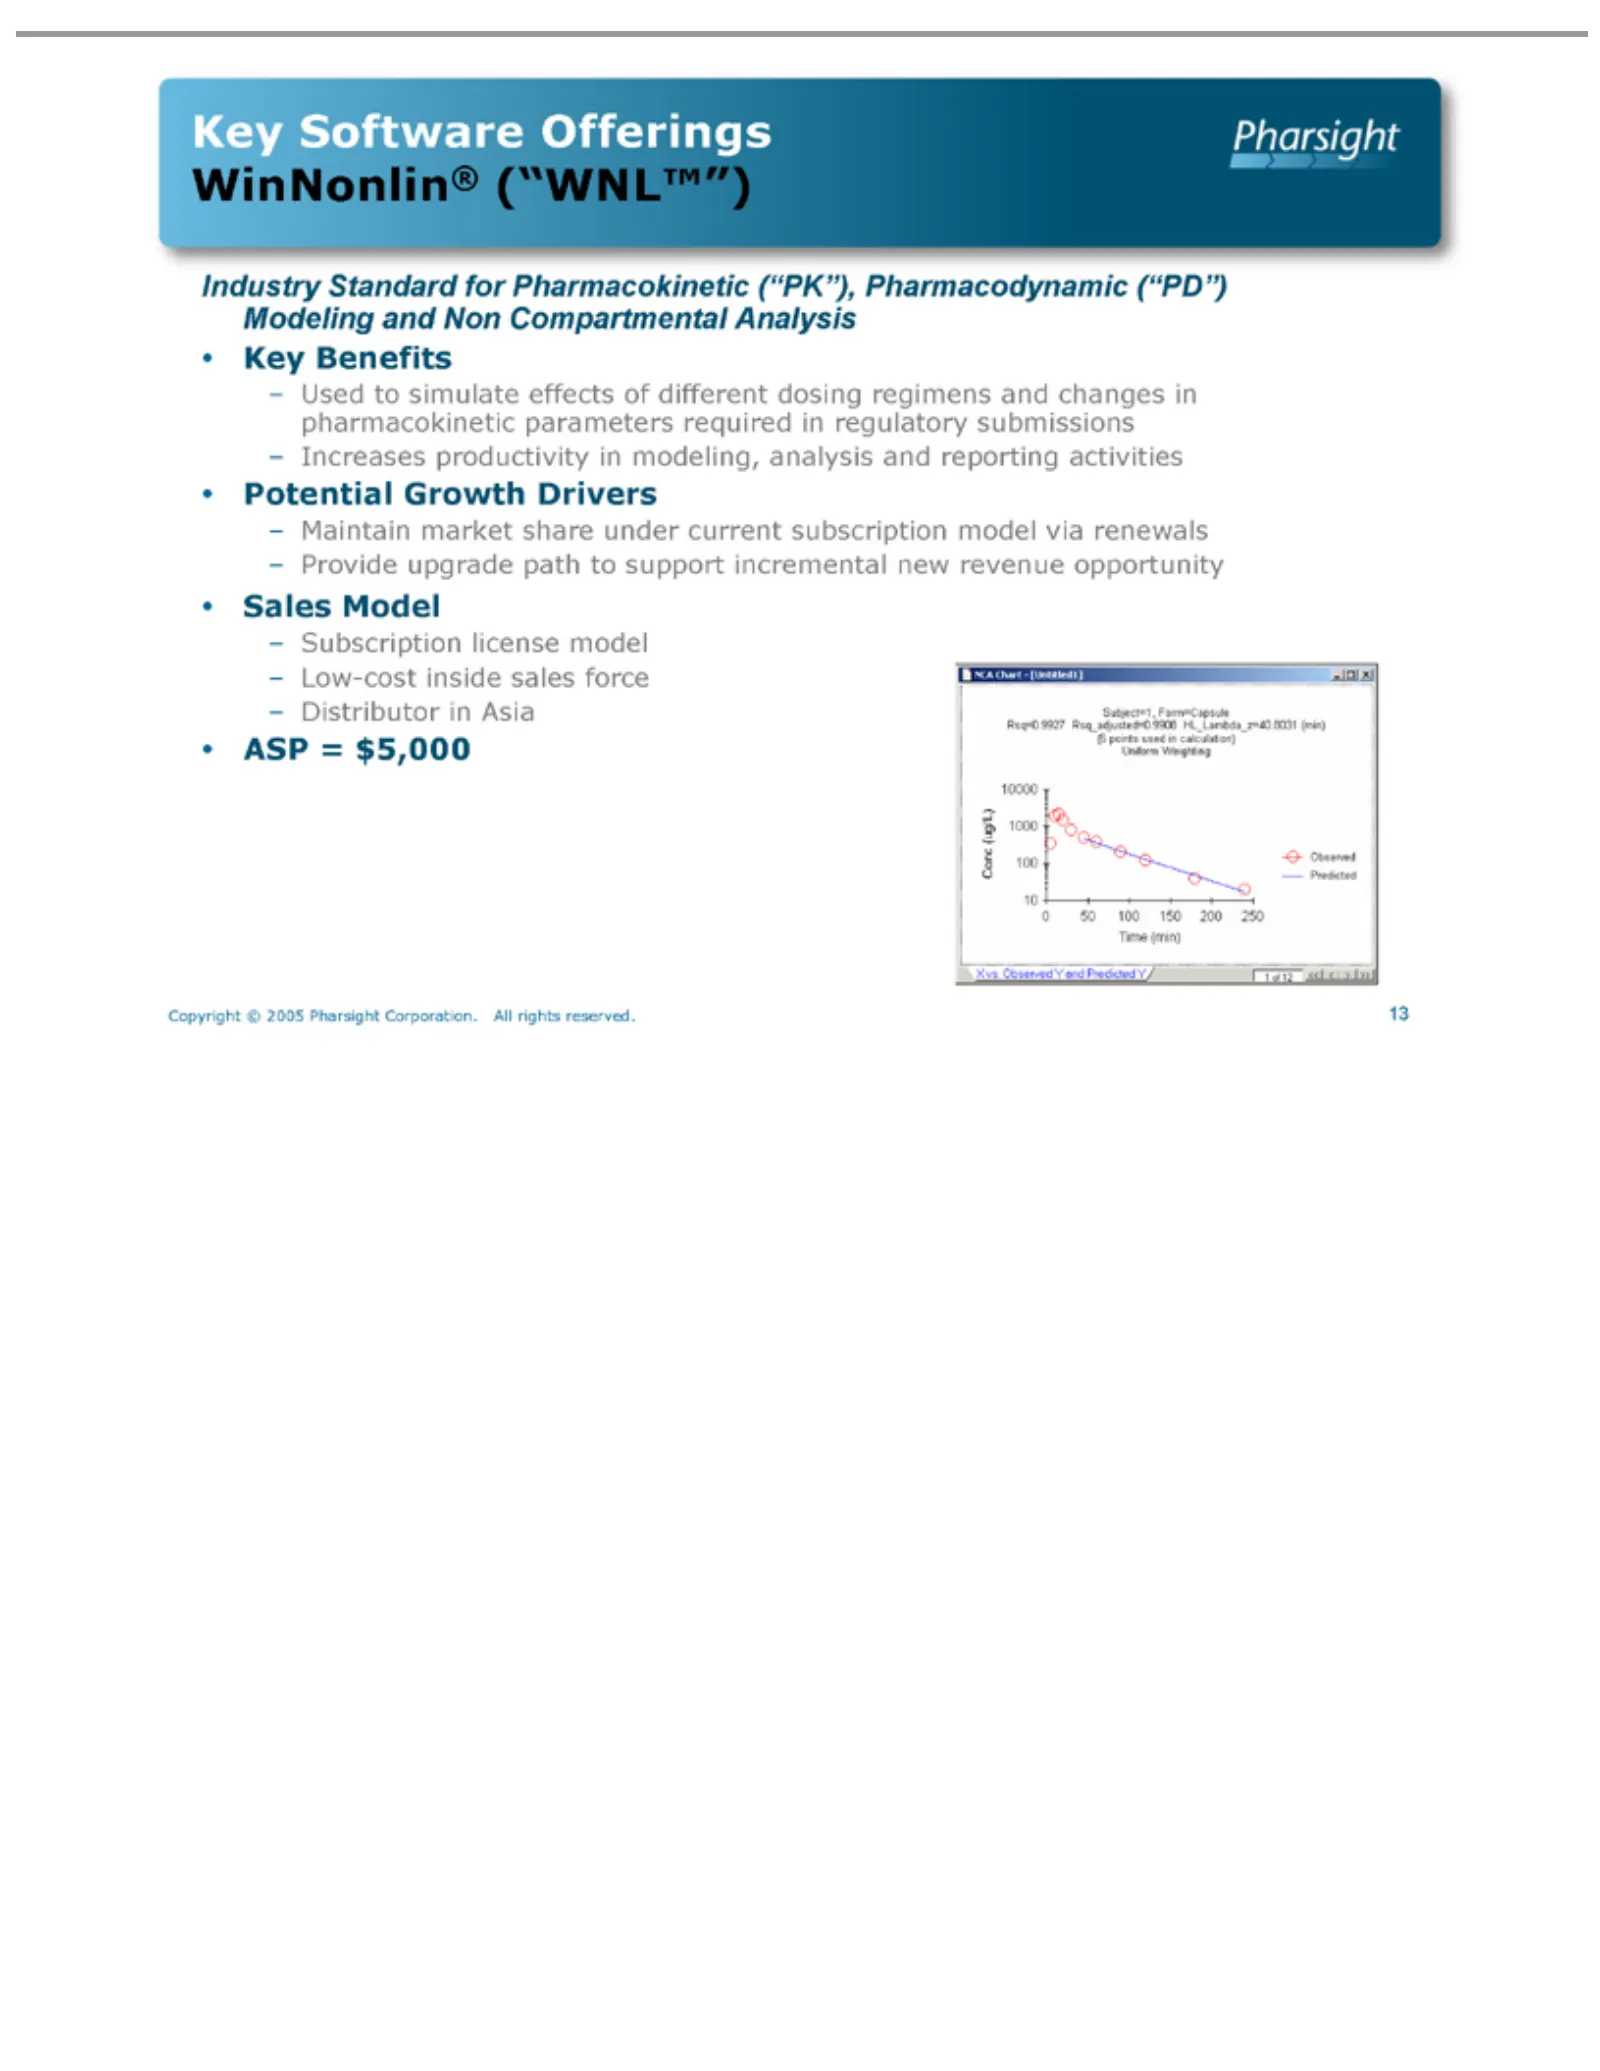
Slide 13: Industry Standard Pharmacokinetic Software: WinNonlin
Industry Key – Used Software Benefits Standard to simulate Increases Potential – Maintain Growth Provide Offerings forpath effects Pharmacokinetic productivity marketDriversWinNonlin® share inof different modeling, under (“WNL™”) current(“PK”), dosing analysisPharmacodynamic regimens and subscriptio
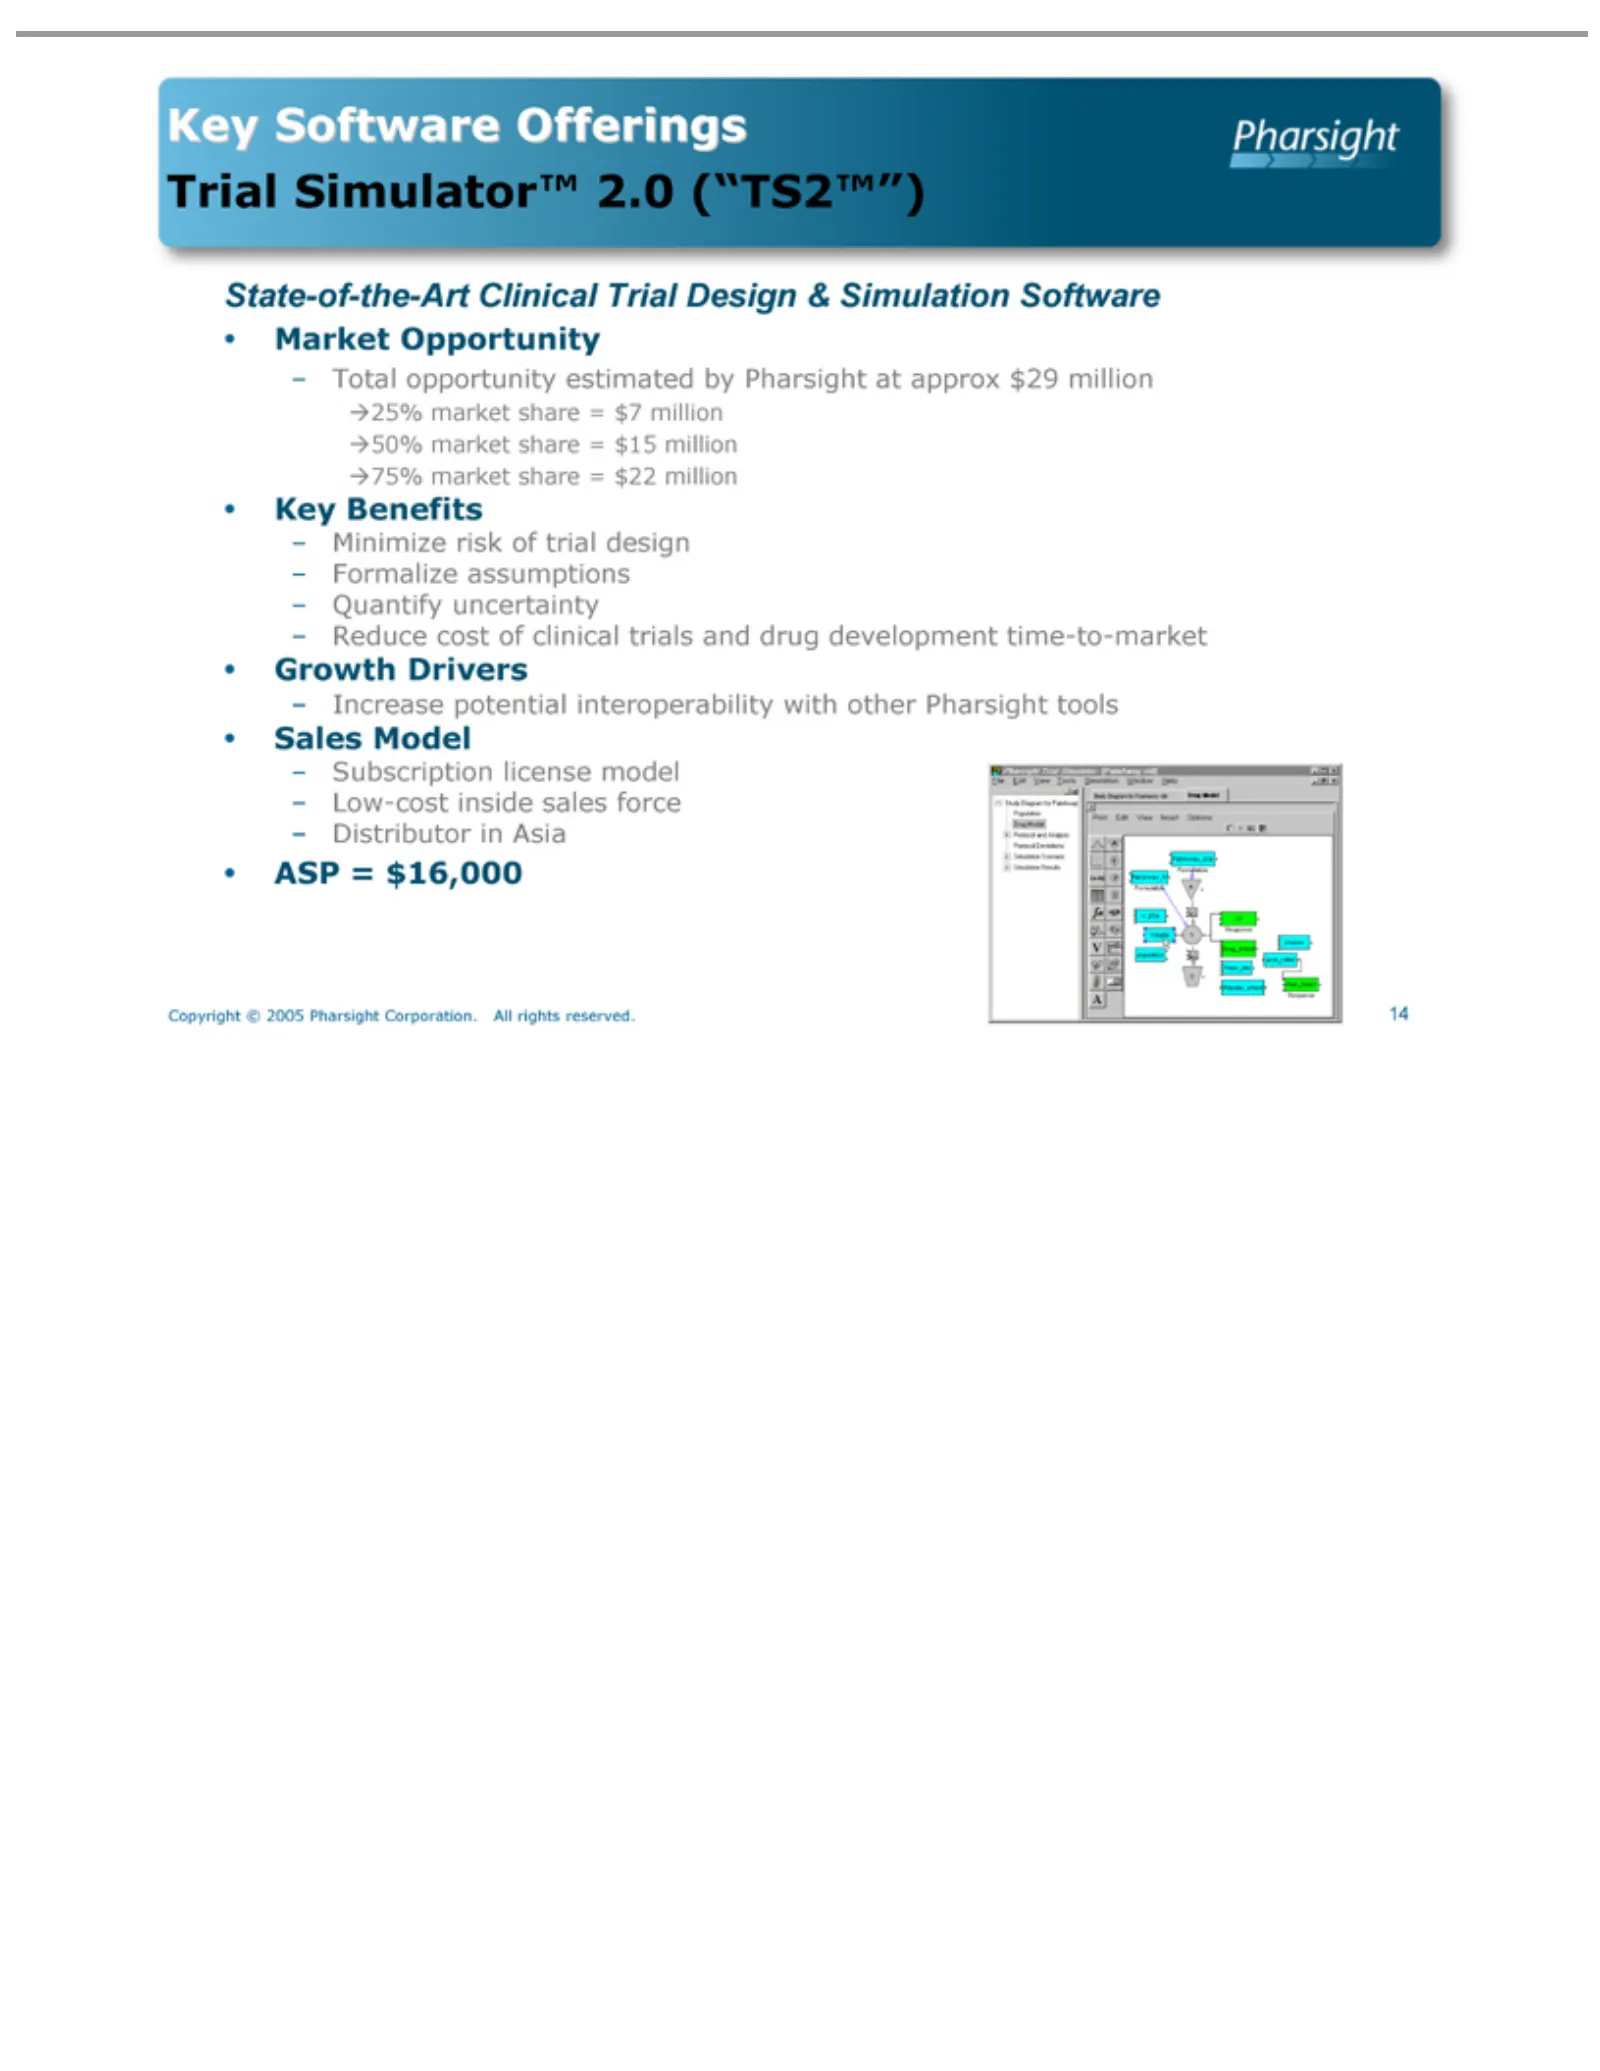
Slide 14: State-of-the-Art Trial Simulator Software
State-of-the-Art Market – 25% Key – Software Opportunity Total Benefits market opportunity Offerings Minimize Clinical share Formalize Quantify Reduce risk = $7ofTrial Trial estimated million trial assumptions uncertainty cost Simulator™ Design 50%by design &Pharsight Simulation market2.0 (“TS2™”) s
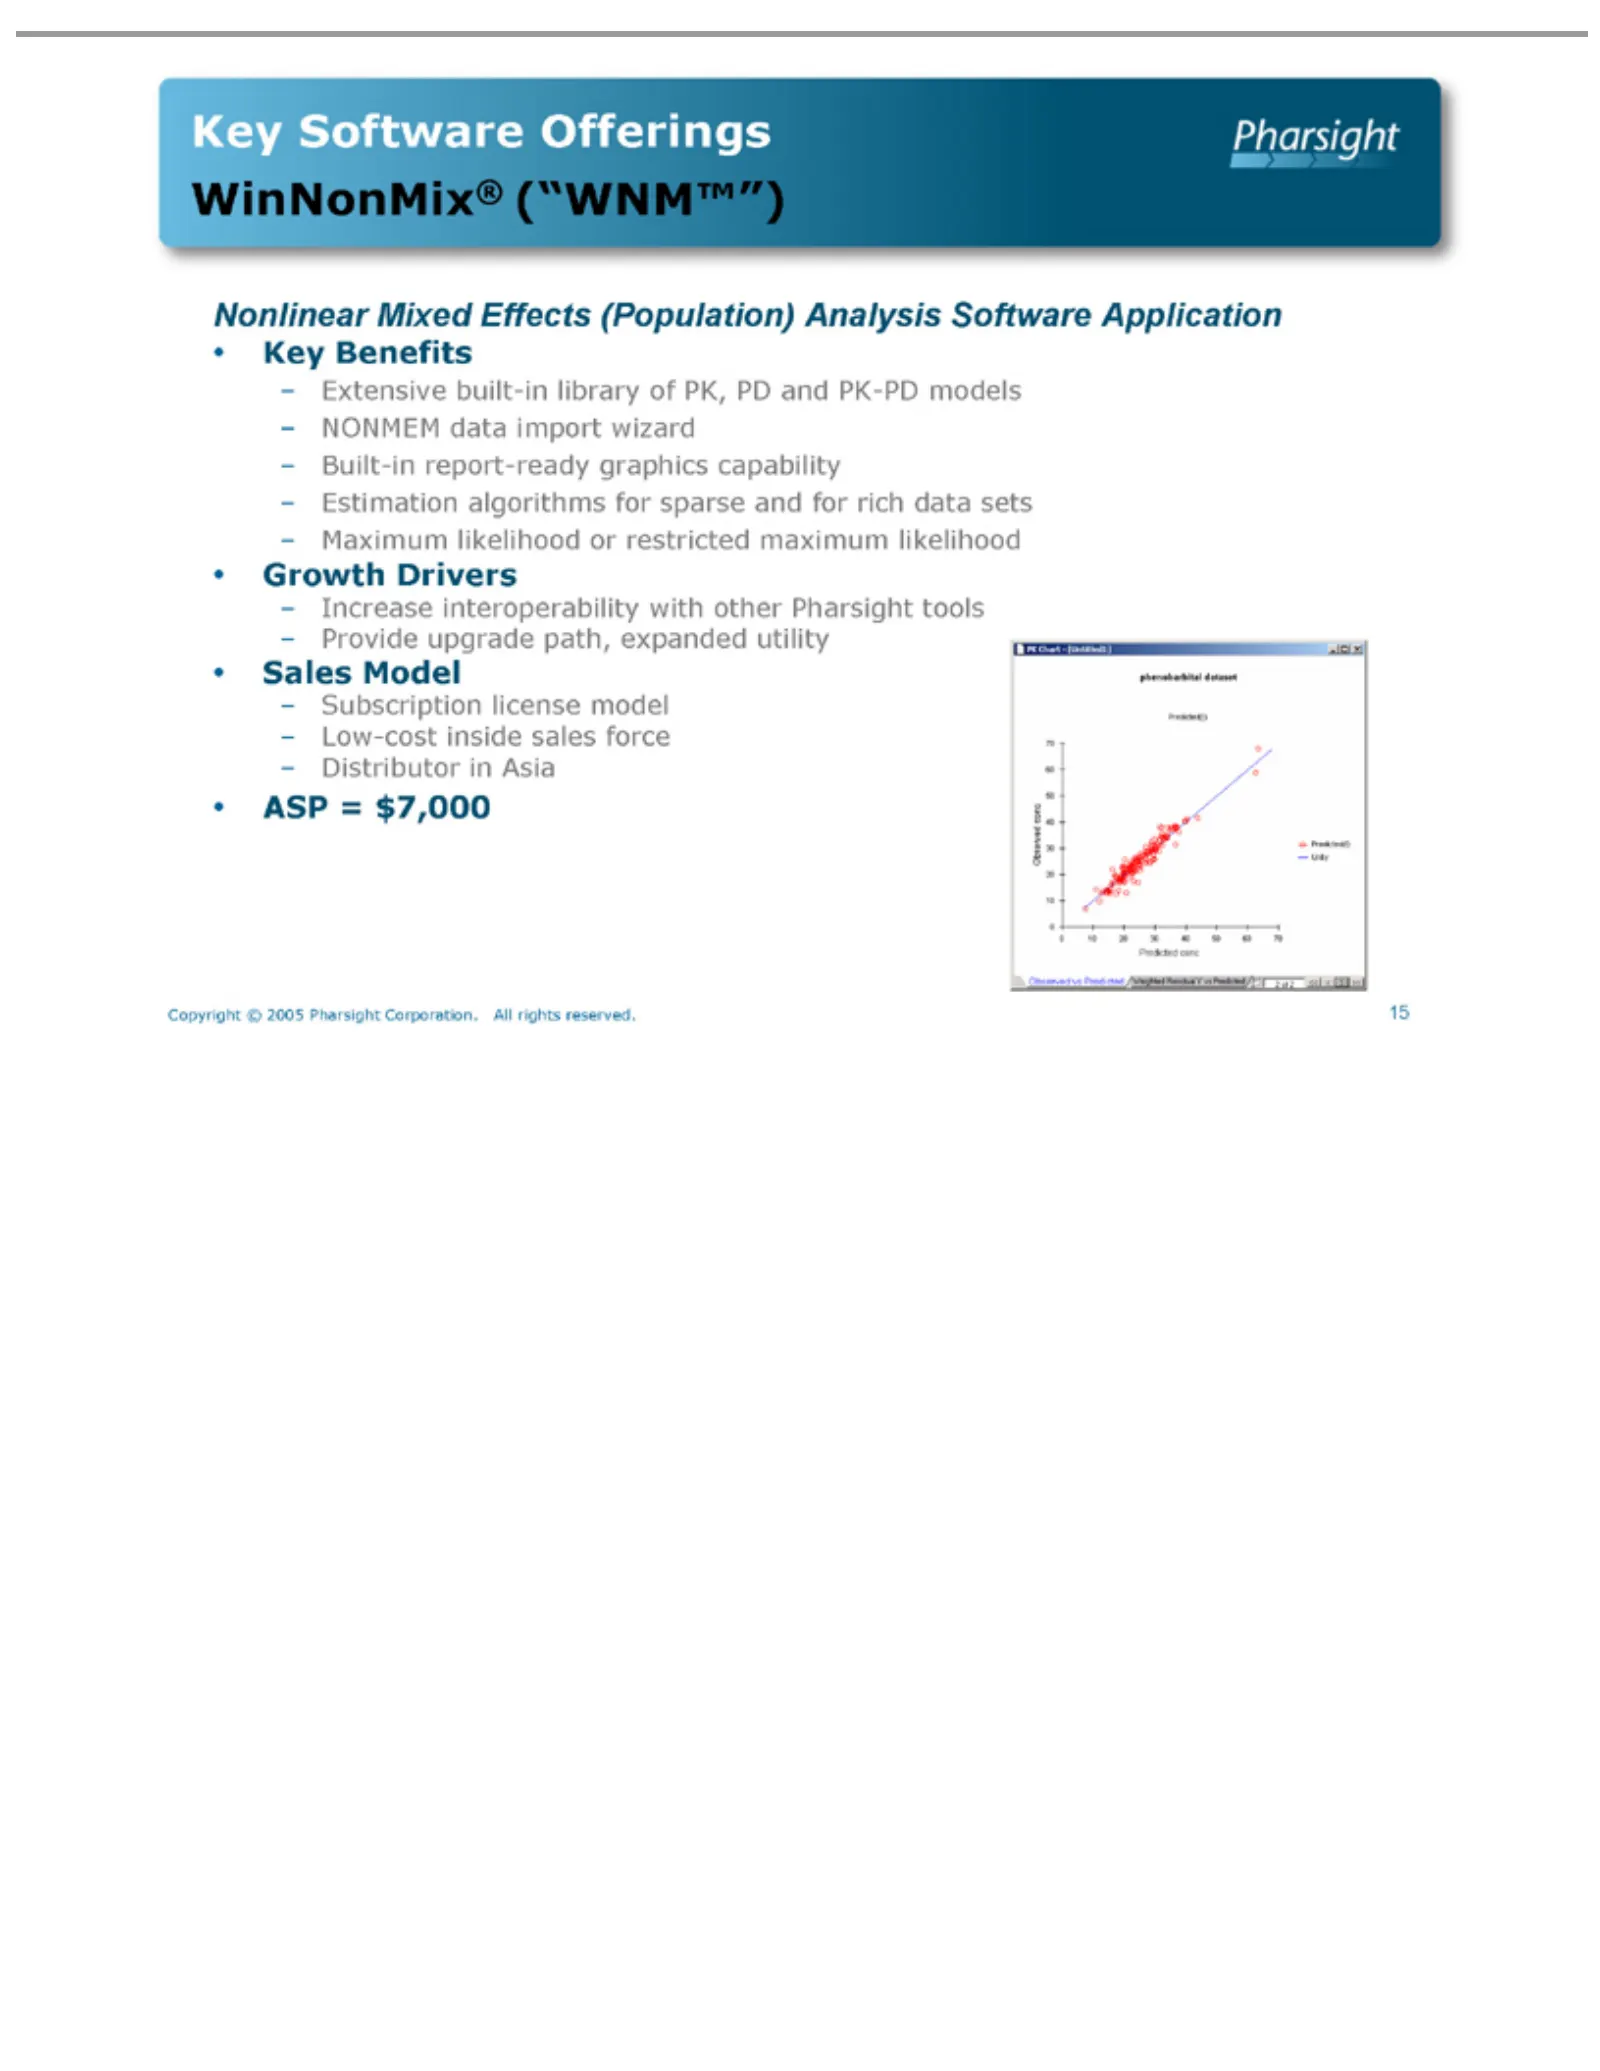
Slide 15: Nonlinear Mixed Effects Software: WinNonMix
Nonlinear Key Growth Sales – ASP Copyright 15Extensive NONMEM Built-in Estimation Maximum Increase Provide Subscription Low-cost Distributor Software Benefits =Model $7,000 Drivers upgrade report-ready Mixed © interoperability inside built-in likelihood 2005 algorithms in data Offerings license Asia
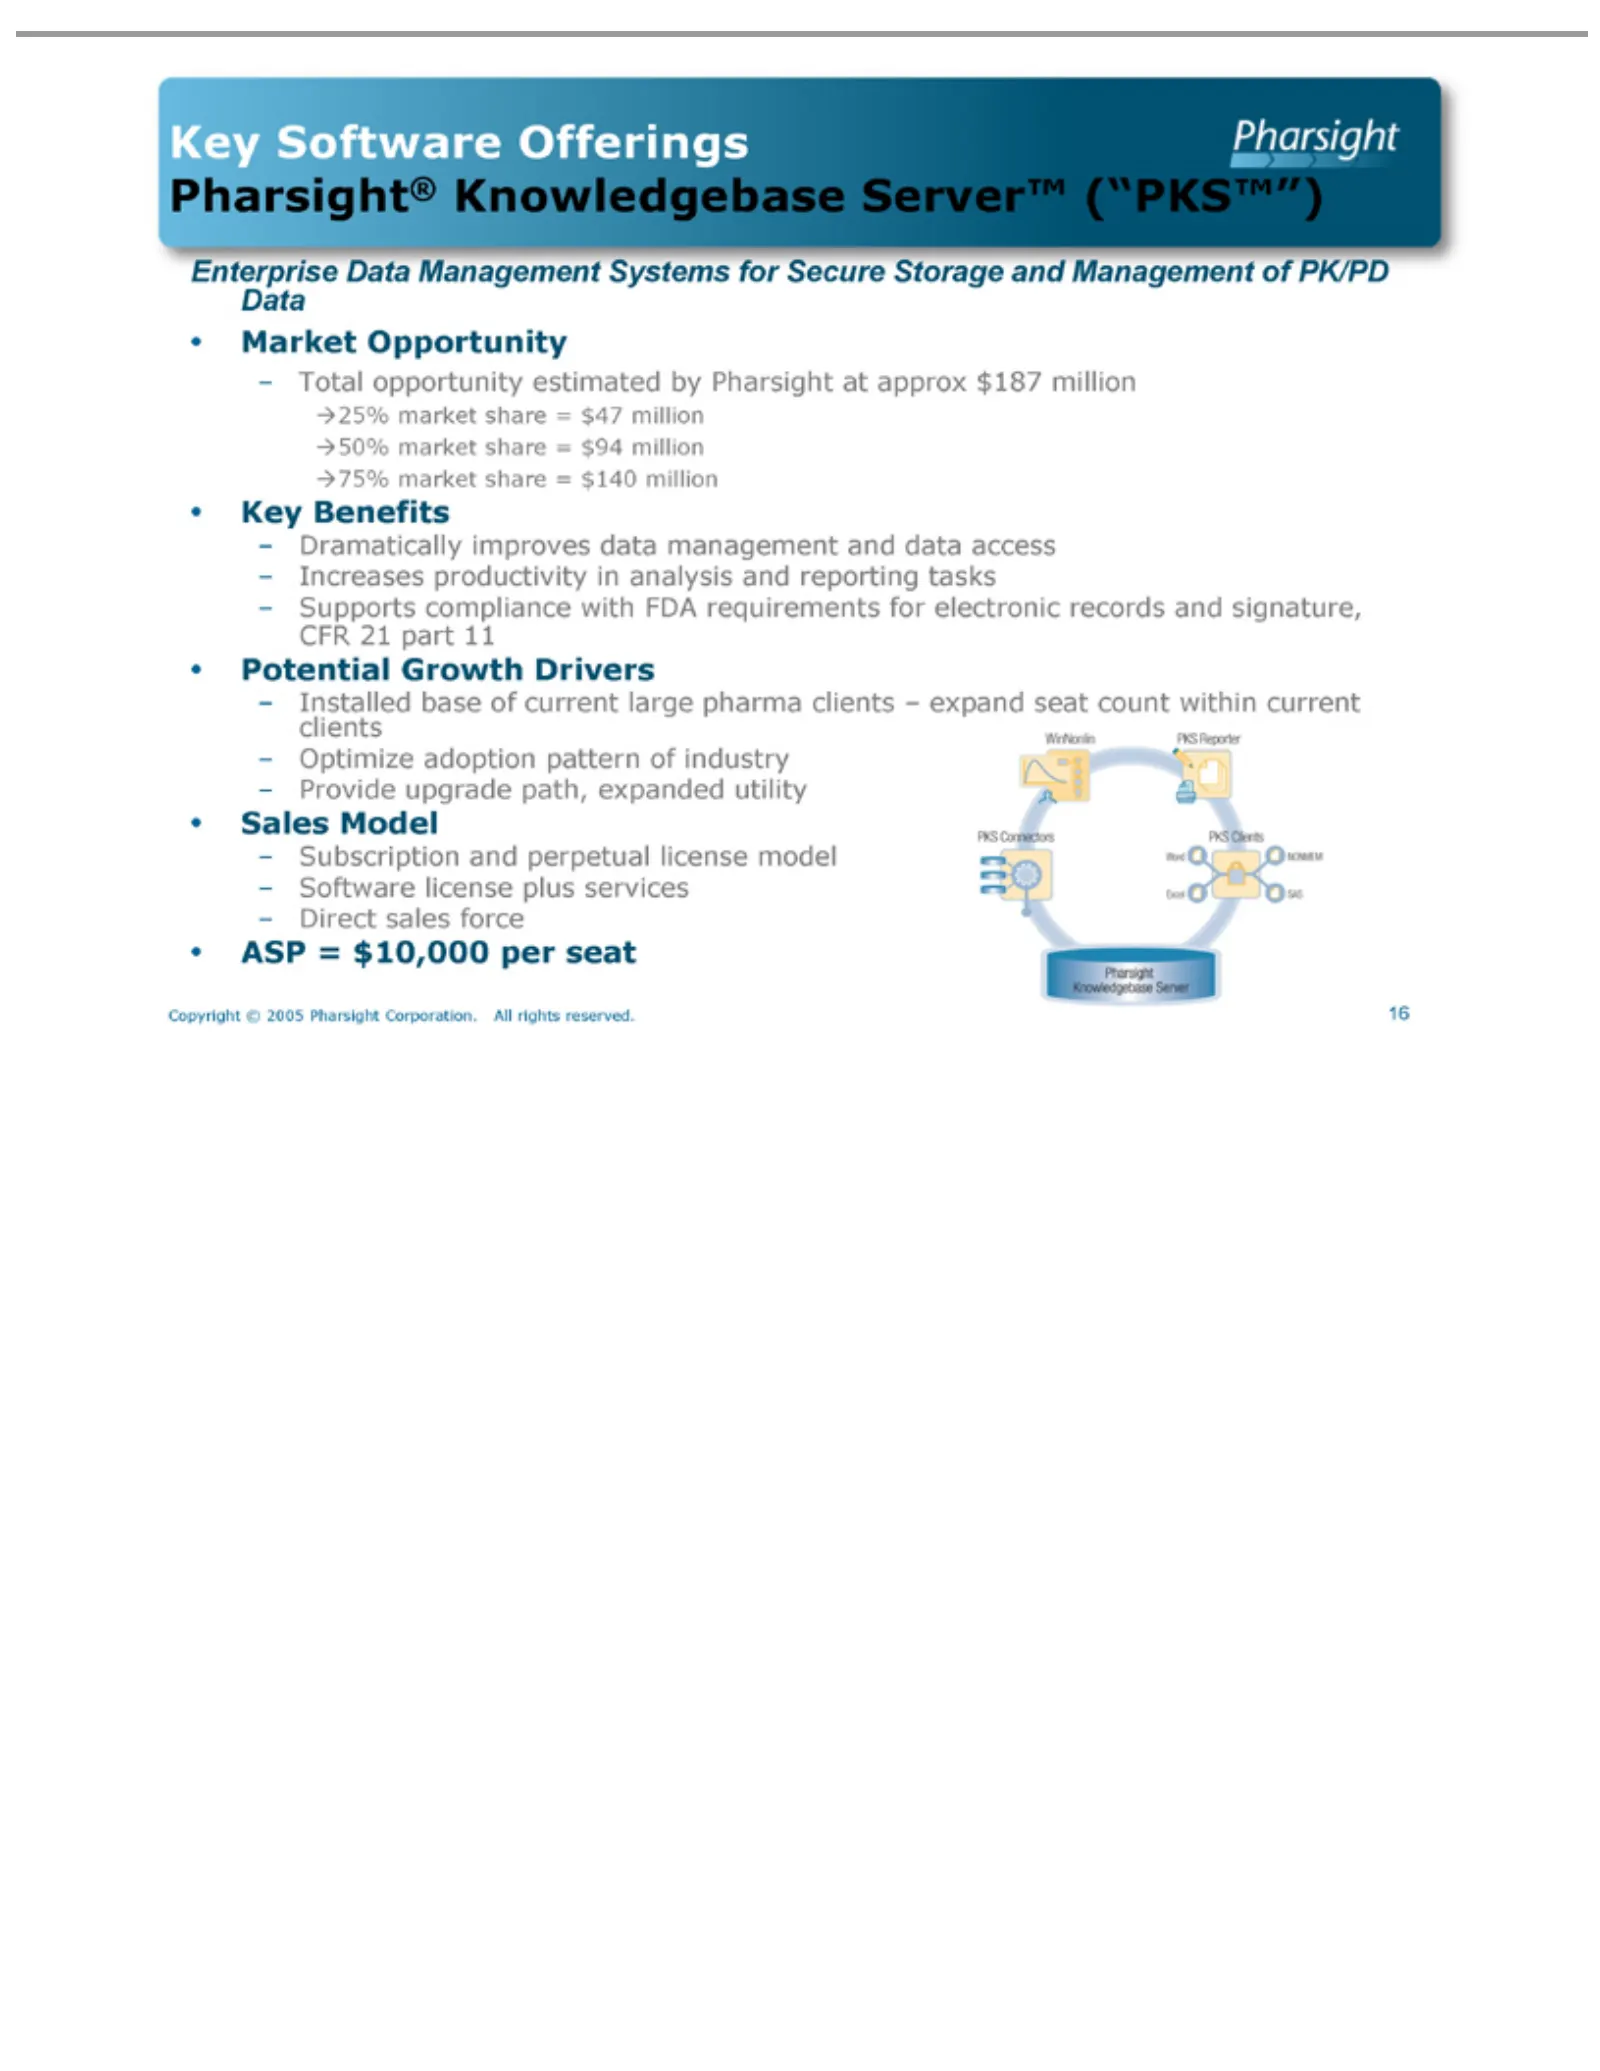
Slide 16: Pharsight Knowledgebase Server
Pharsight® Enterprise Market Data – 25% Key – Software Opportunity Total Data Knowledgebase Benefits market opportunity Offerings Increases Supports Potential Installed Growth Management Dramatically share = $47 estimated improves productivity compliance base Drivers Server™ Systems millionindata wi
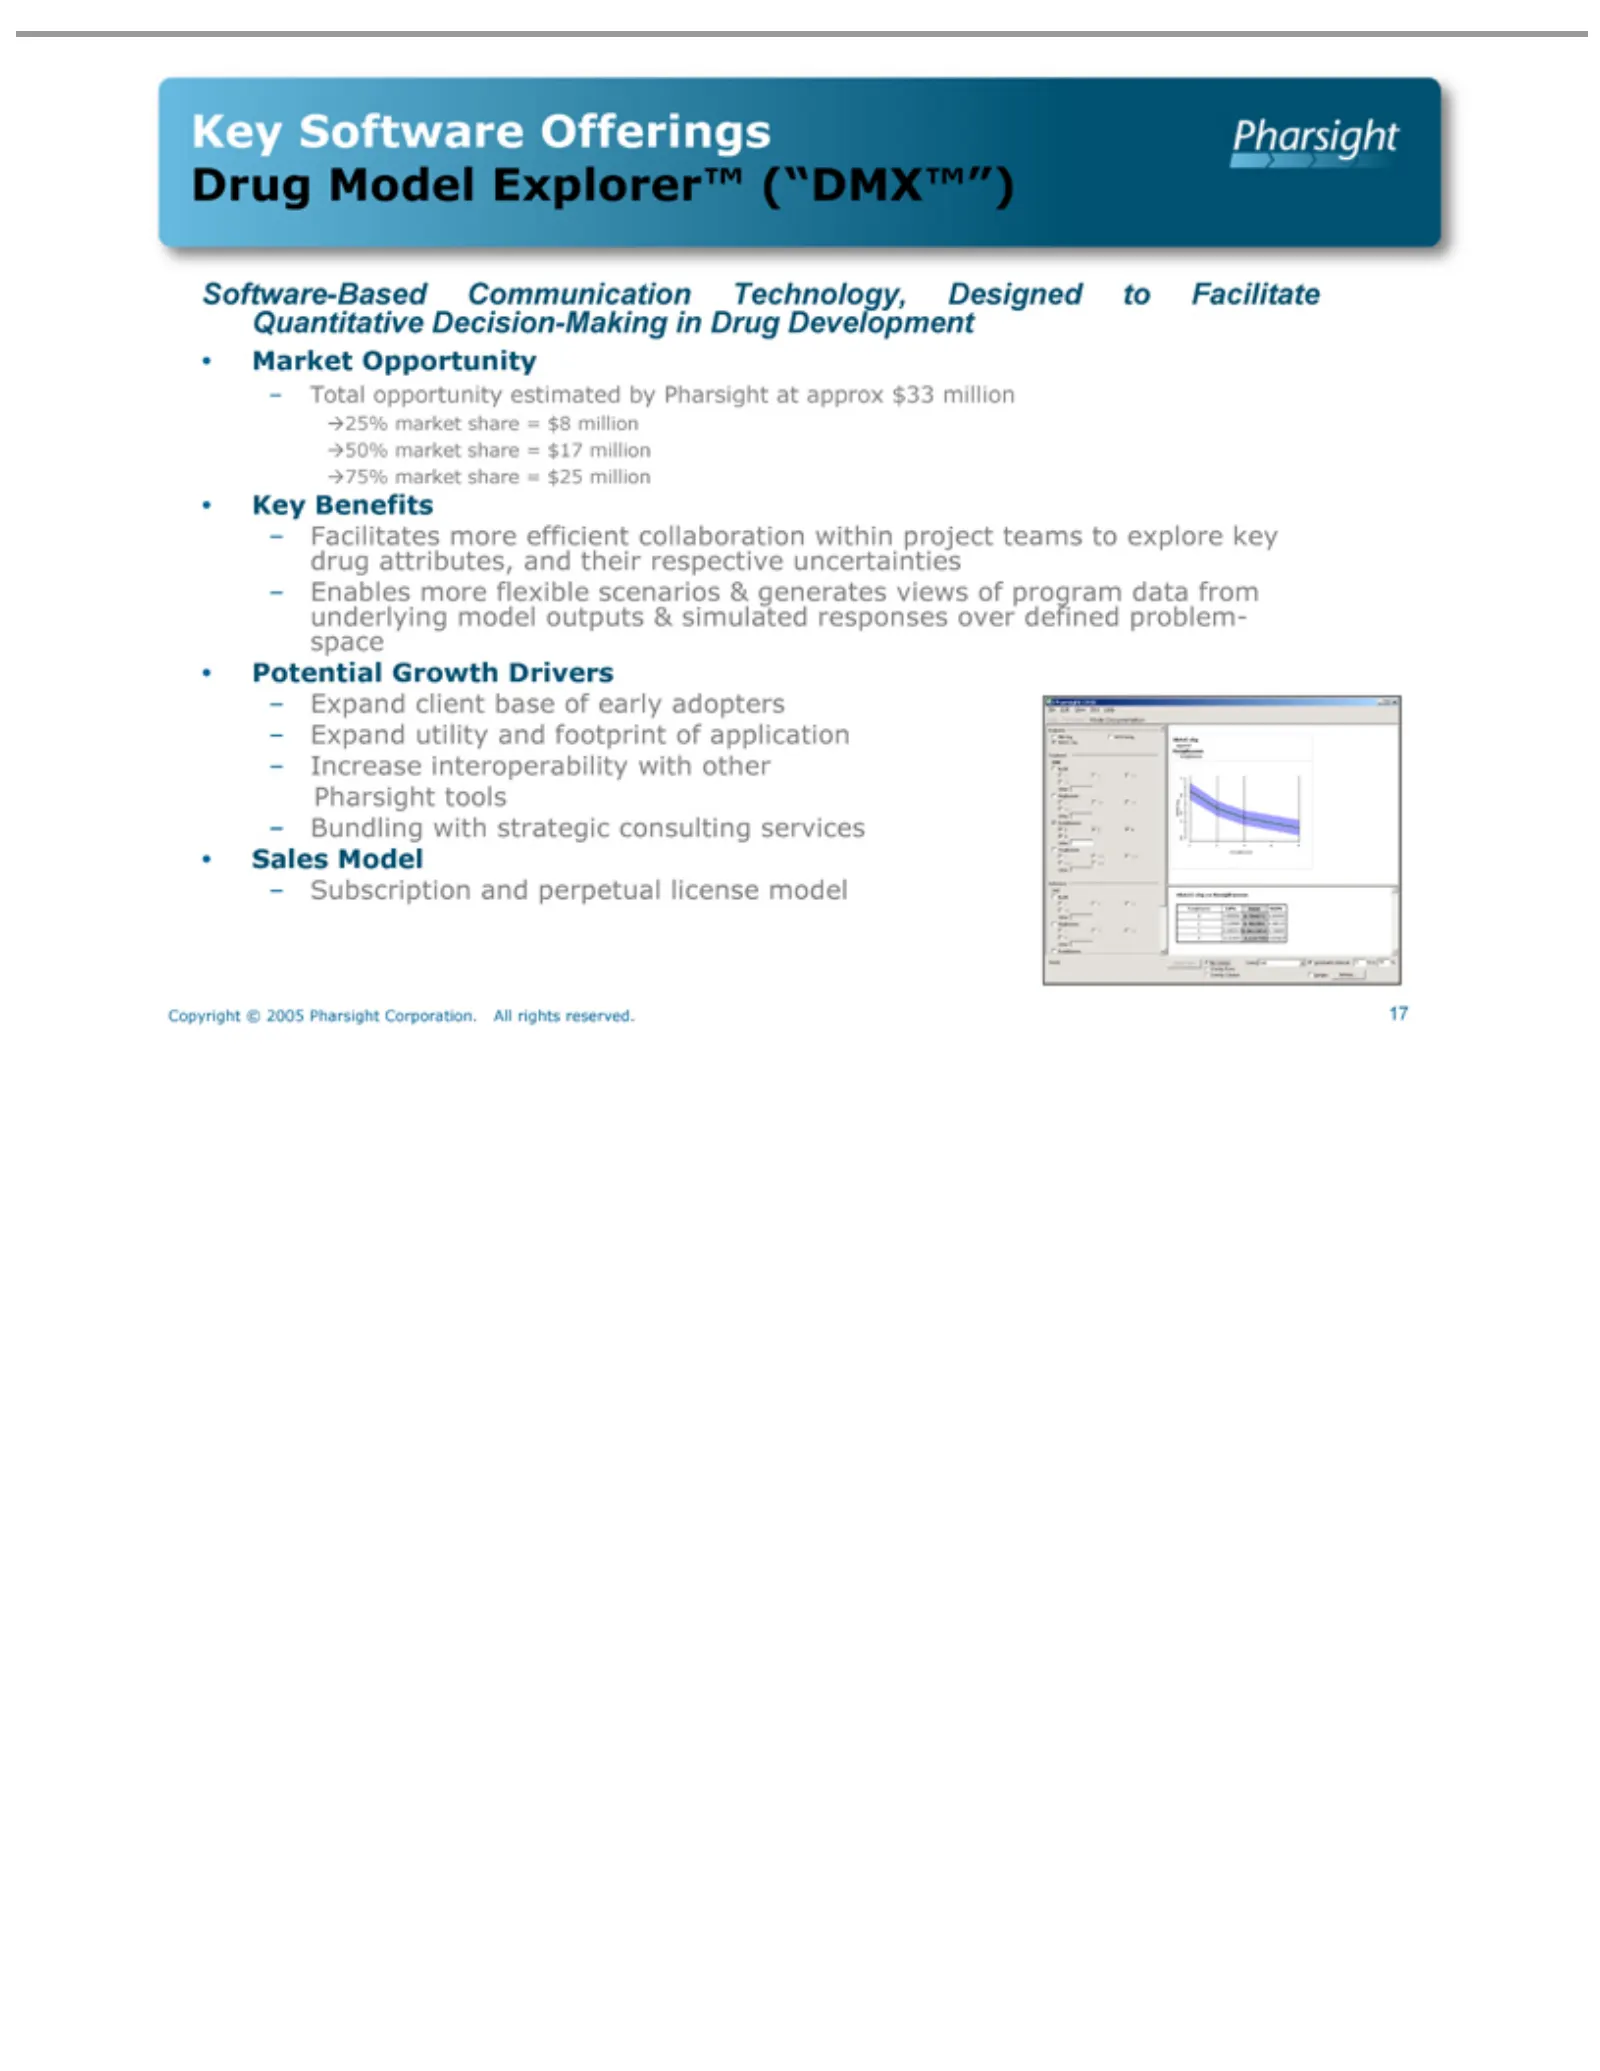
Slide 17: Drug Model Explorer
Drug Software-Based Market 25% Key Potential Sales – Copyright 17Total Facilitates Enables Expand Increase Bundling Subscription Software Benefits market Model opportunity Opportunity Growth client utility more © interoperability with share more Explorer™ 2005 Offerings and flexible base Communicati
Slide 18: Software Market Acceptance
Software Over All Our 3 9 – 1 2 Copyright 18As ofTop 13 Over Pharma software the active of 1,000 500 June Top 50Products Exec © Pharma2 PKSTM active customers 50 30, 2005 applications 50: Pharma2 2005 seats Pharsight Market Pharmaceutical customers license as are ofare Acceptance1 June at Corporatio
Slide 19: Strategic Consulting Services
Strategic Consulting Services
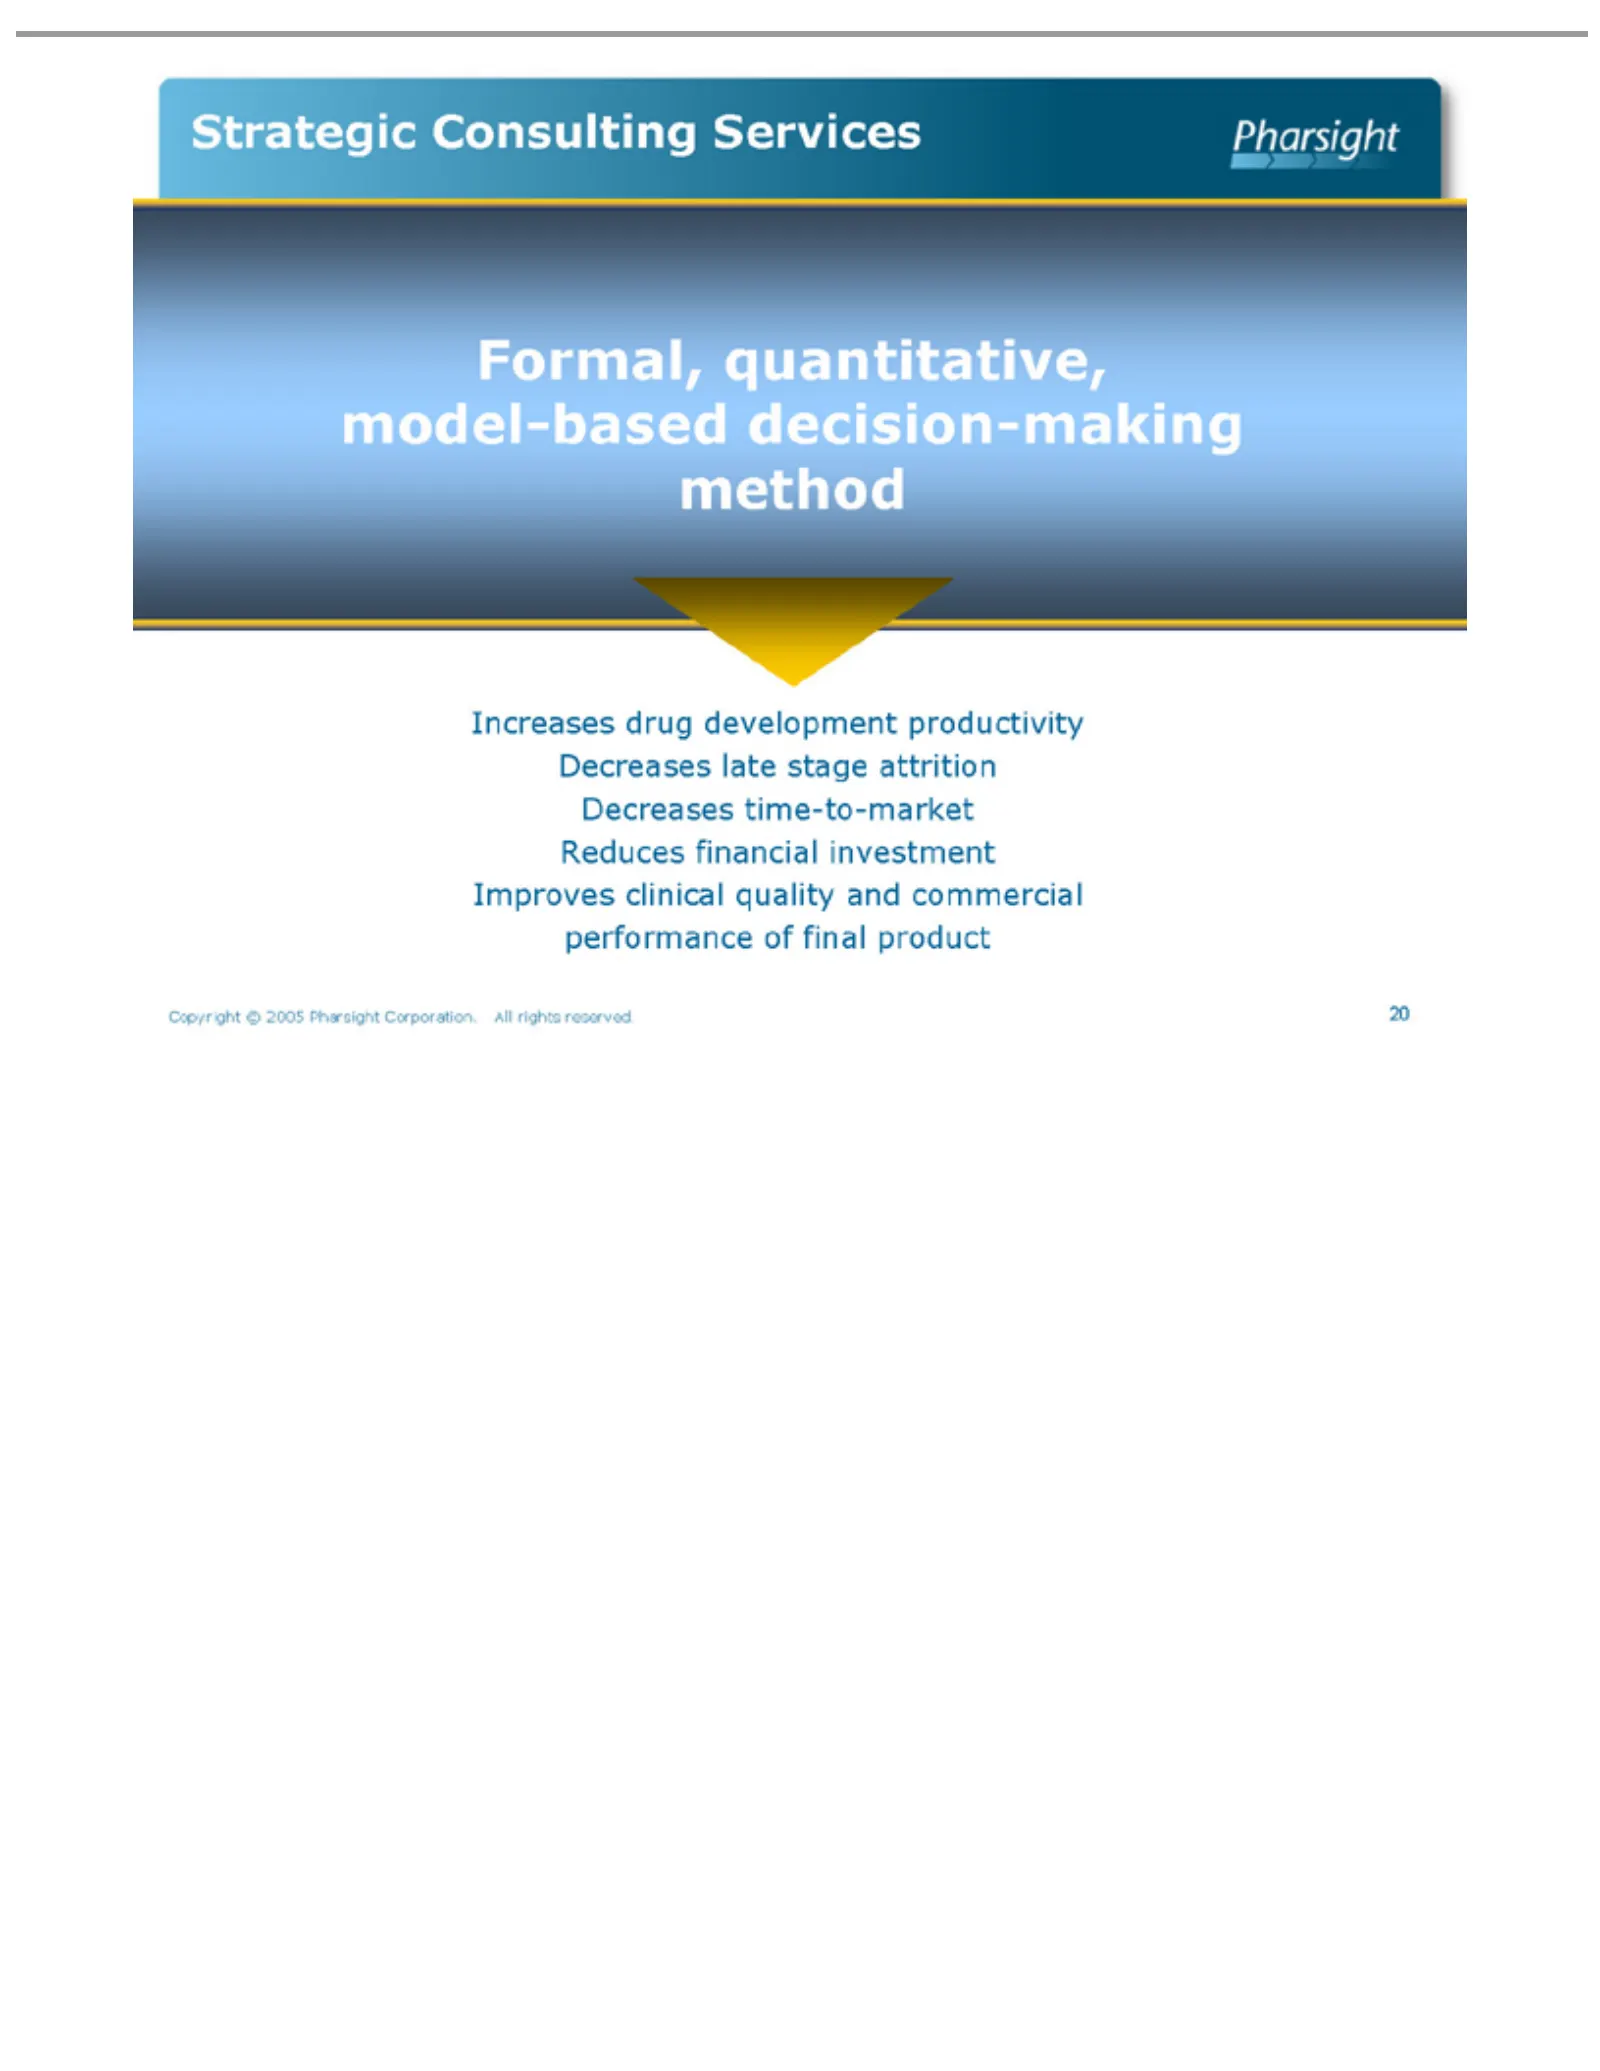
Slide 20: Strategic Consulting
Strategic Copyright 20 IncreasesConsulting drug © 2005 development Pharsight ServicesCorporation. productivity All Decreases rights reserved. late stage attritionFormal, Decreases quantitative, time-to-market model-based Reducesdecision-making financial investment method Improves clinical quality an
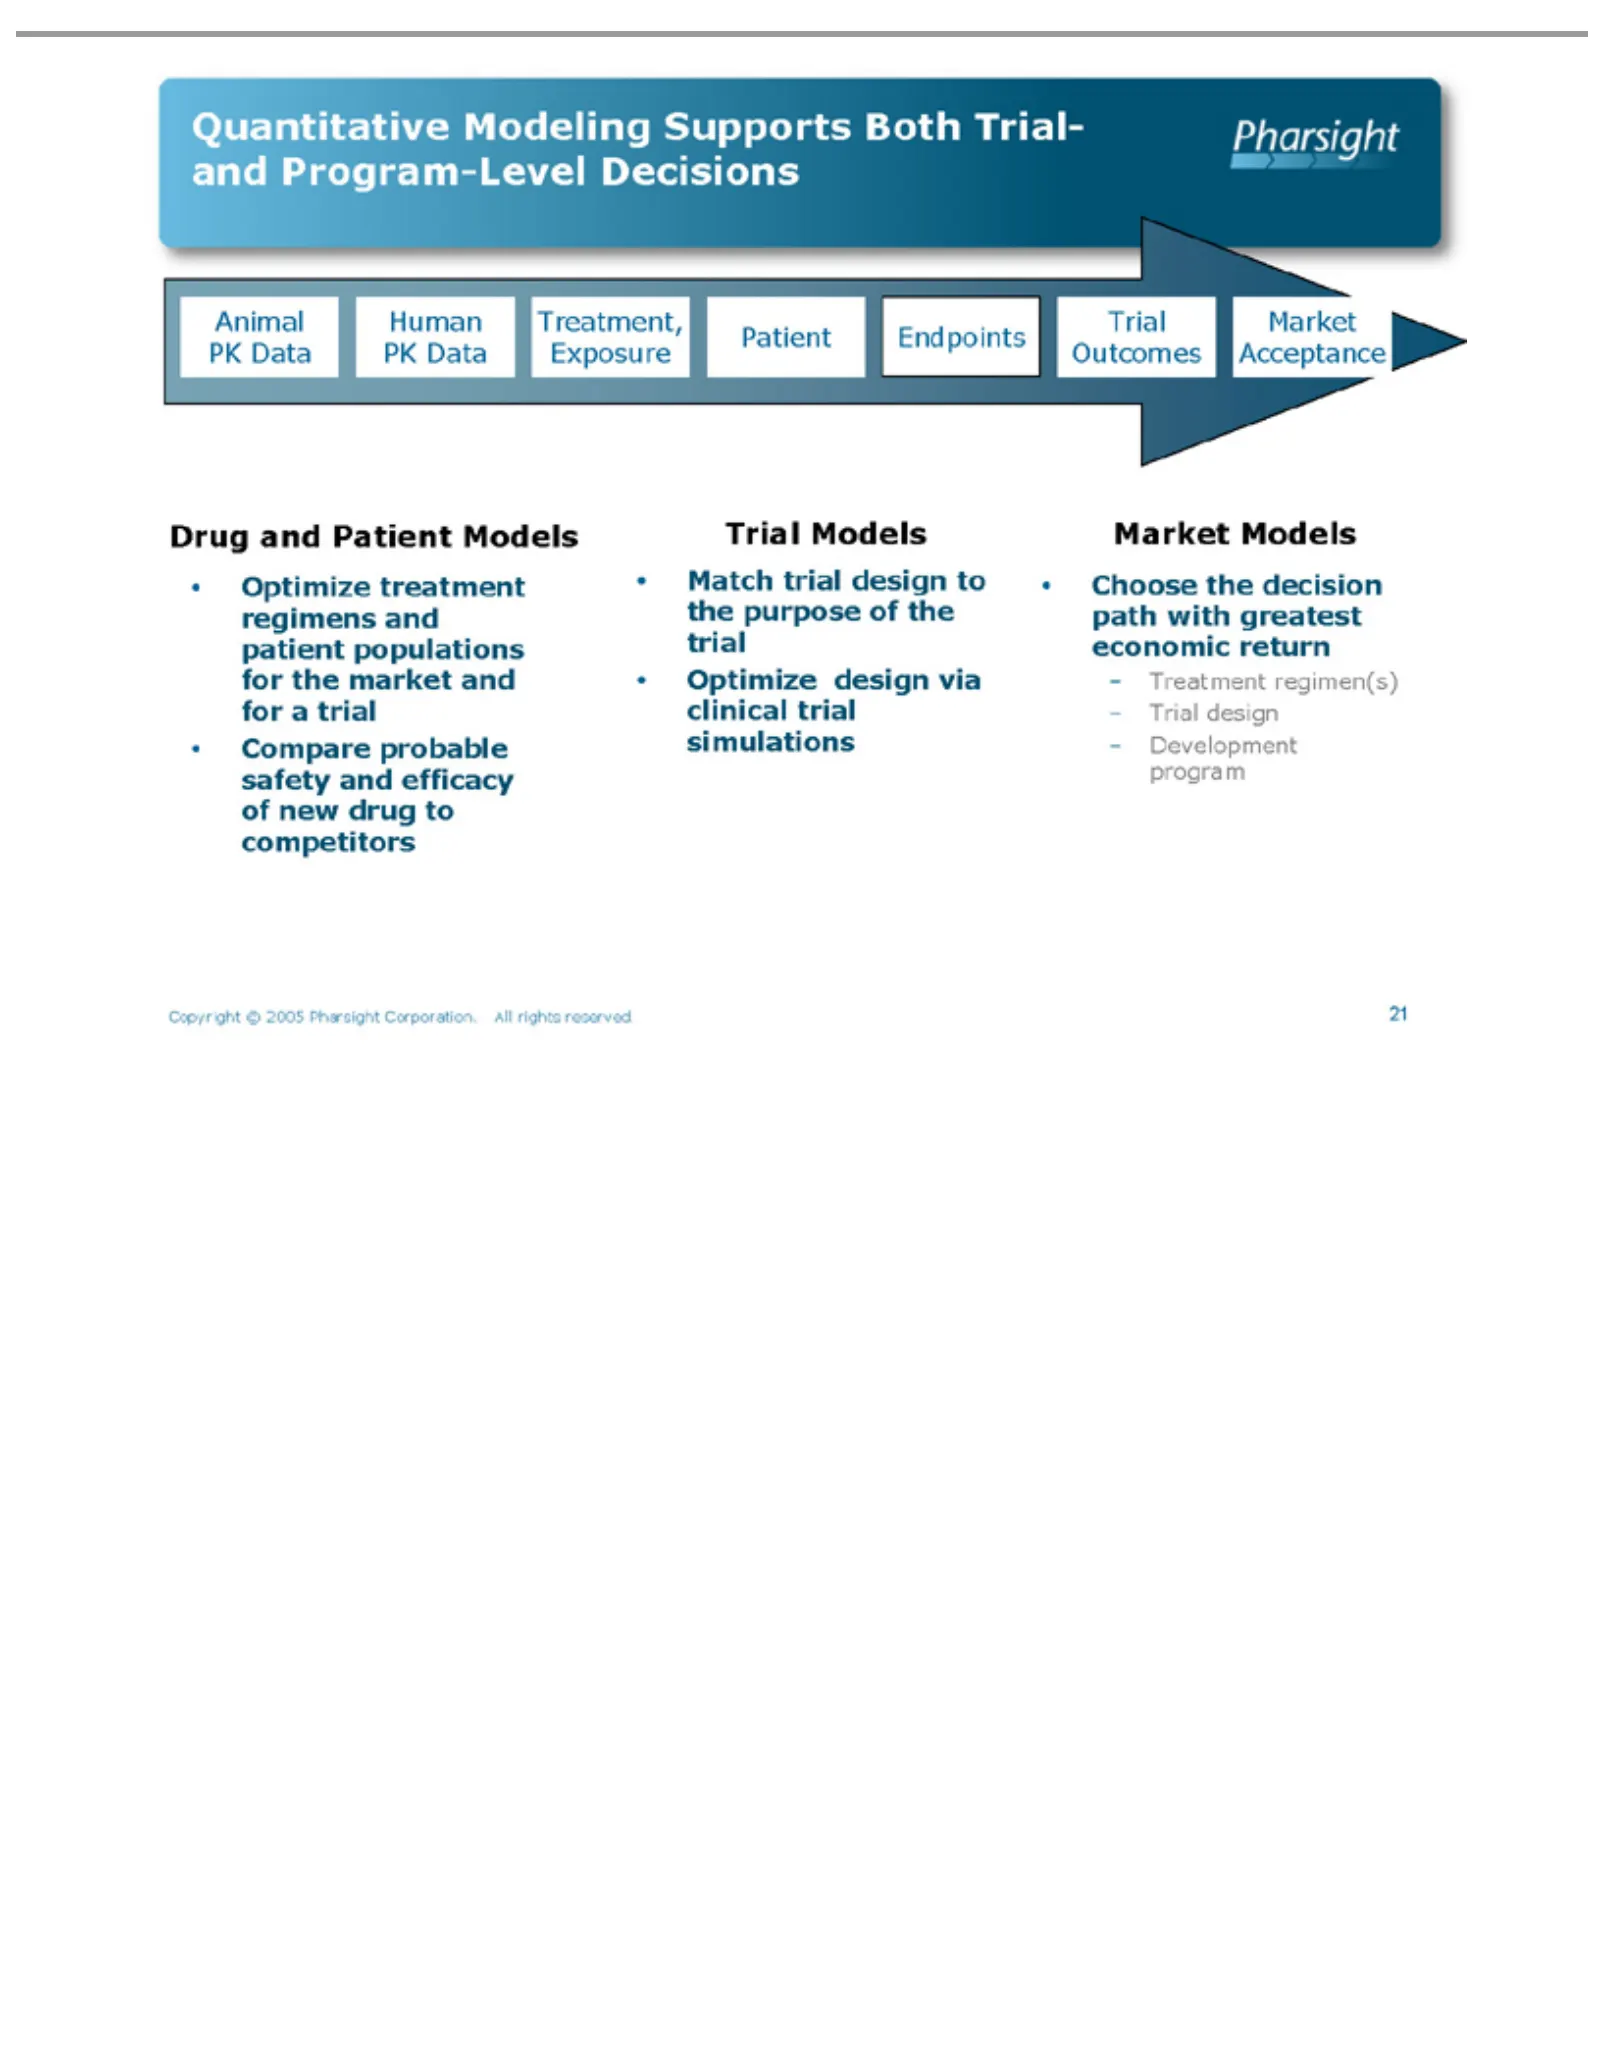
Slide 21: Quantitative Models in Drug Development
Quantitative Animal Human Treatment, Endpoints Patient Drug Optimize Trial Match Market Choose – Copyright 21Treatment Trial Development Outcomes Models and trial design Acceptance Models PK the treatment Patient ©Exposure design decision Data regimen(s) Modeling 2005 program Models to Pharsight reg
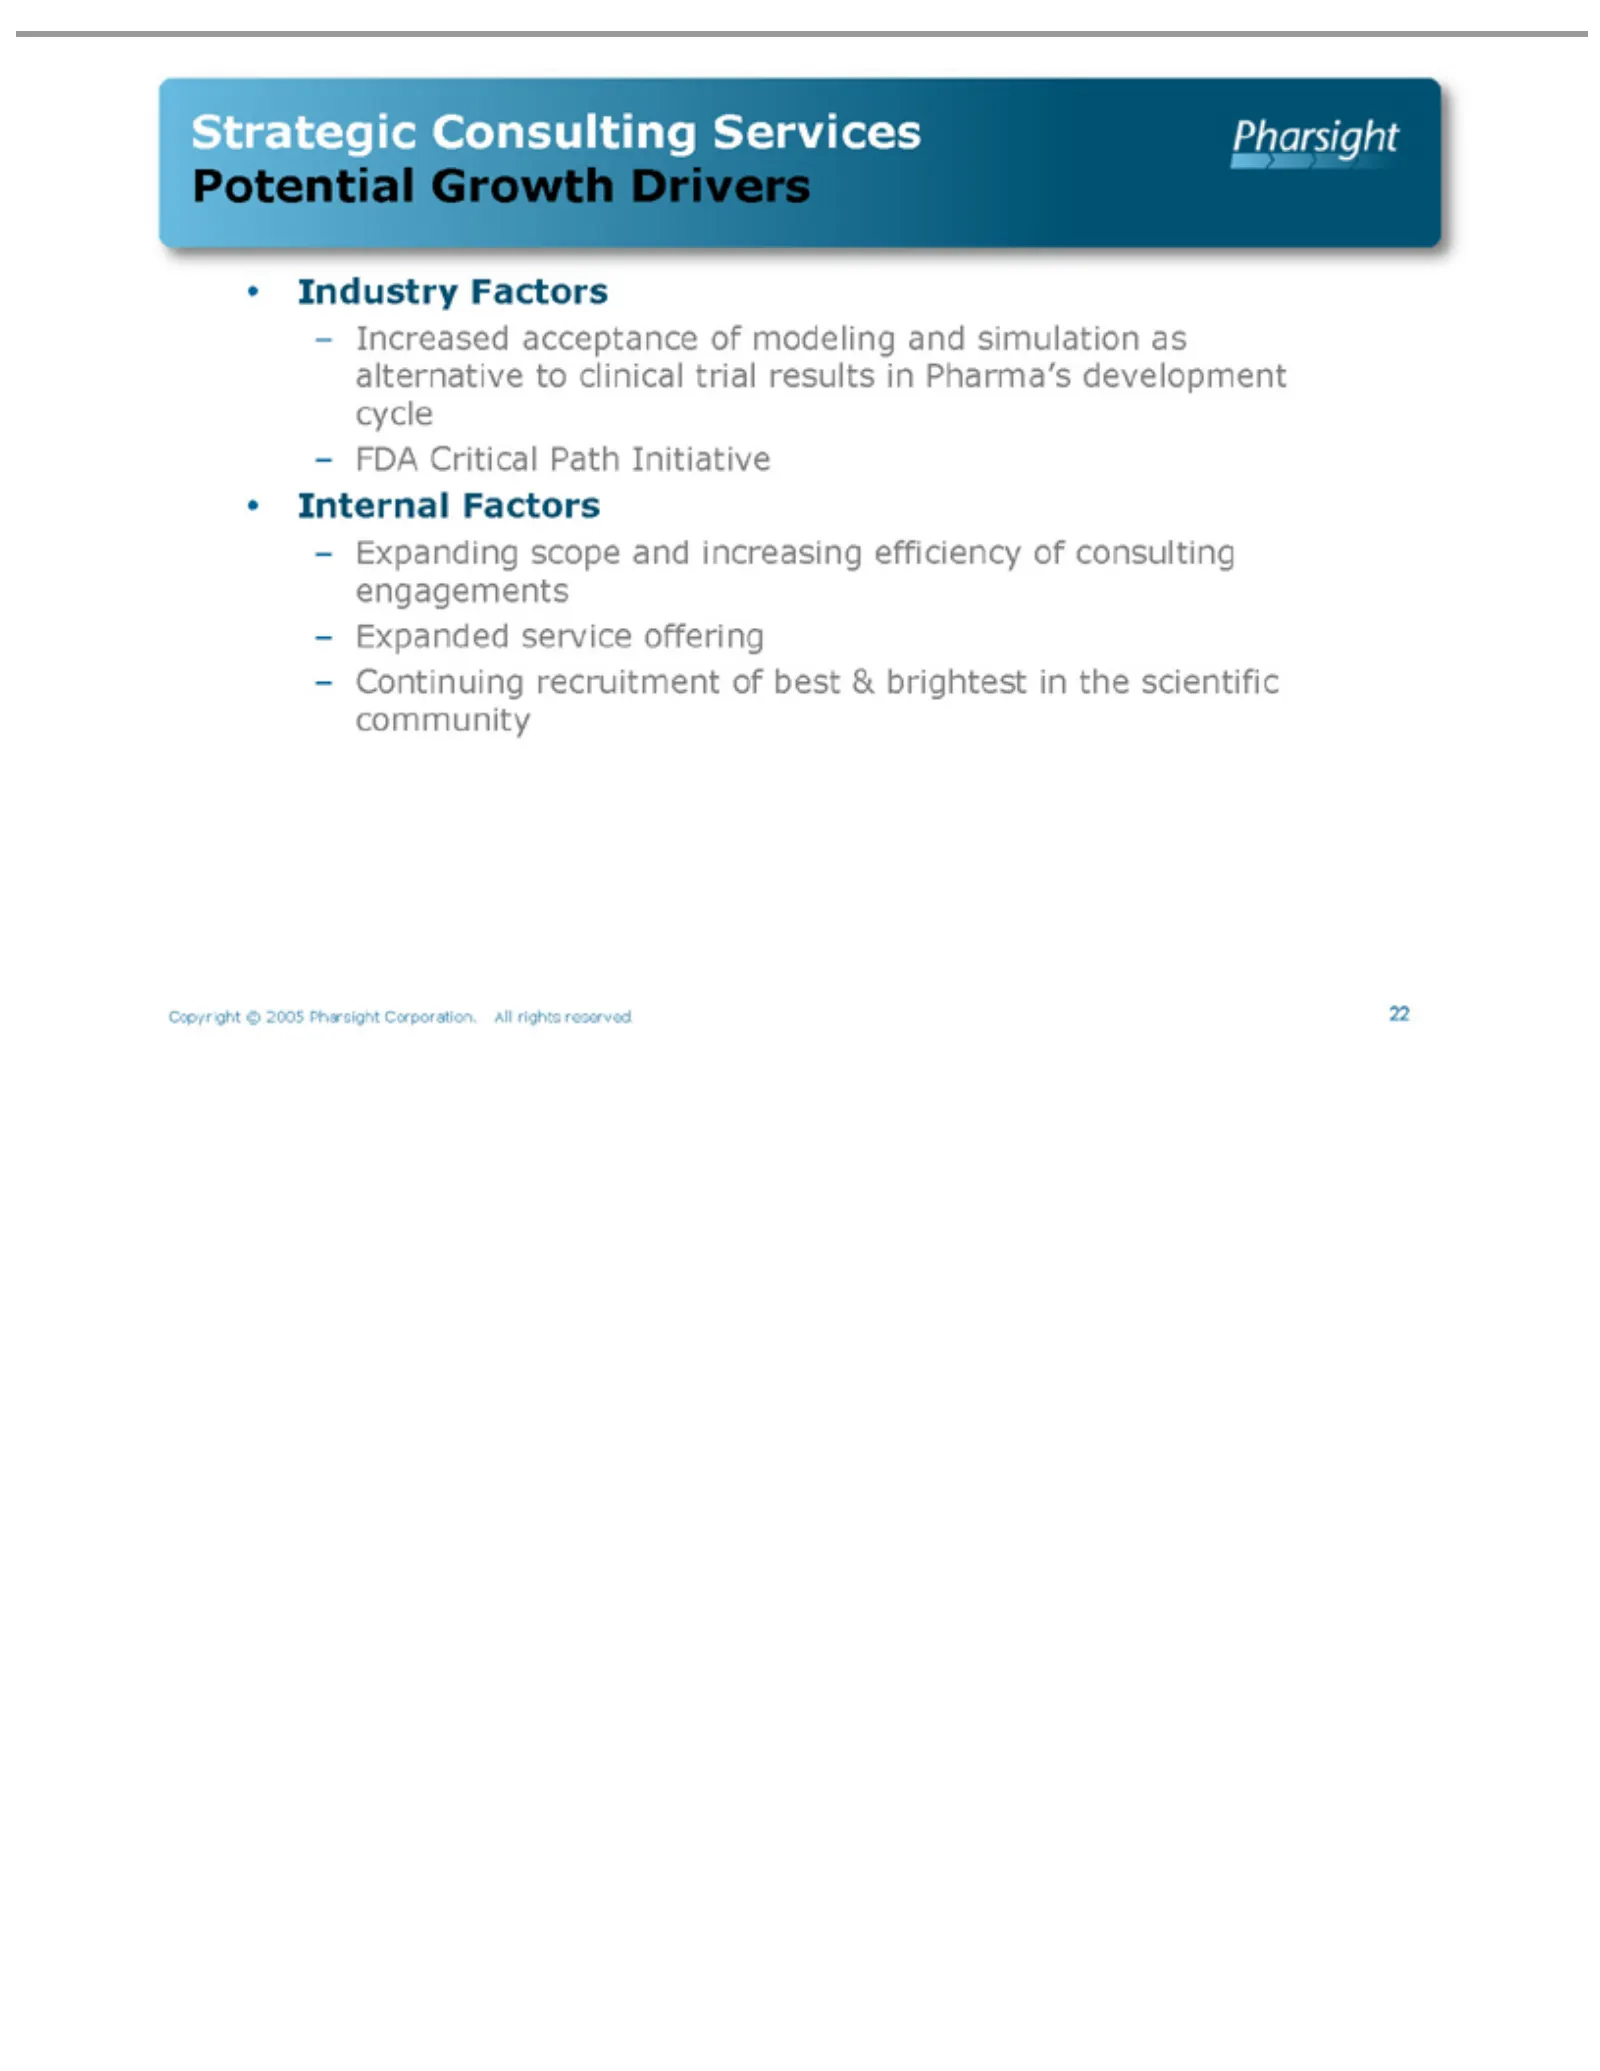
Slide 22: Strategic Consulting Growth Drivers
Strategic Industry Internal – Copyright 22Increased FDA Expanding Expanded Continuing Critical Factors Factors Consulting ©acceptance service 2005 scope recruitment PathPharsight and offering Initiative Services of increasing of modeling best Corporation. Potential &efficiency brightest andGrowth si
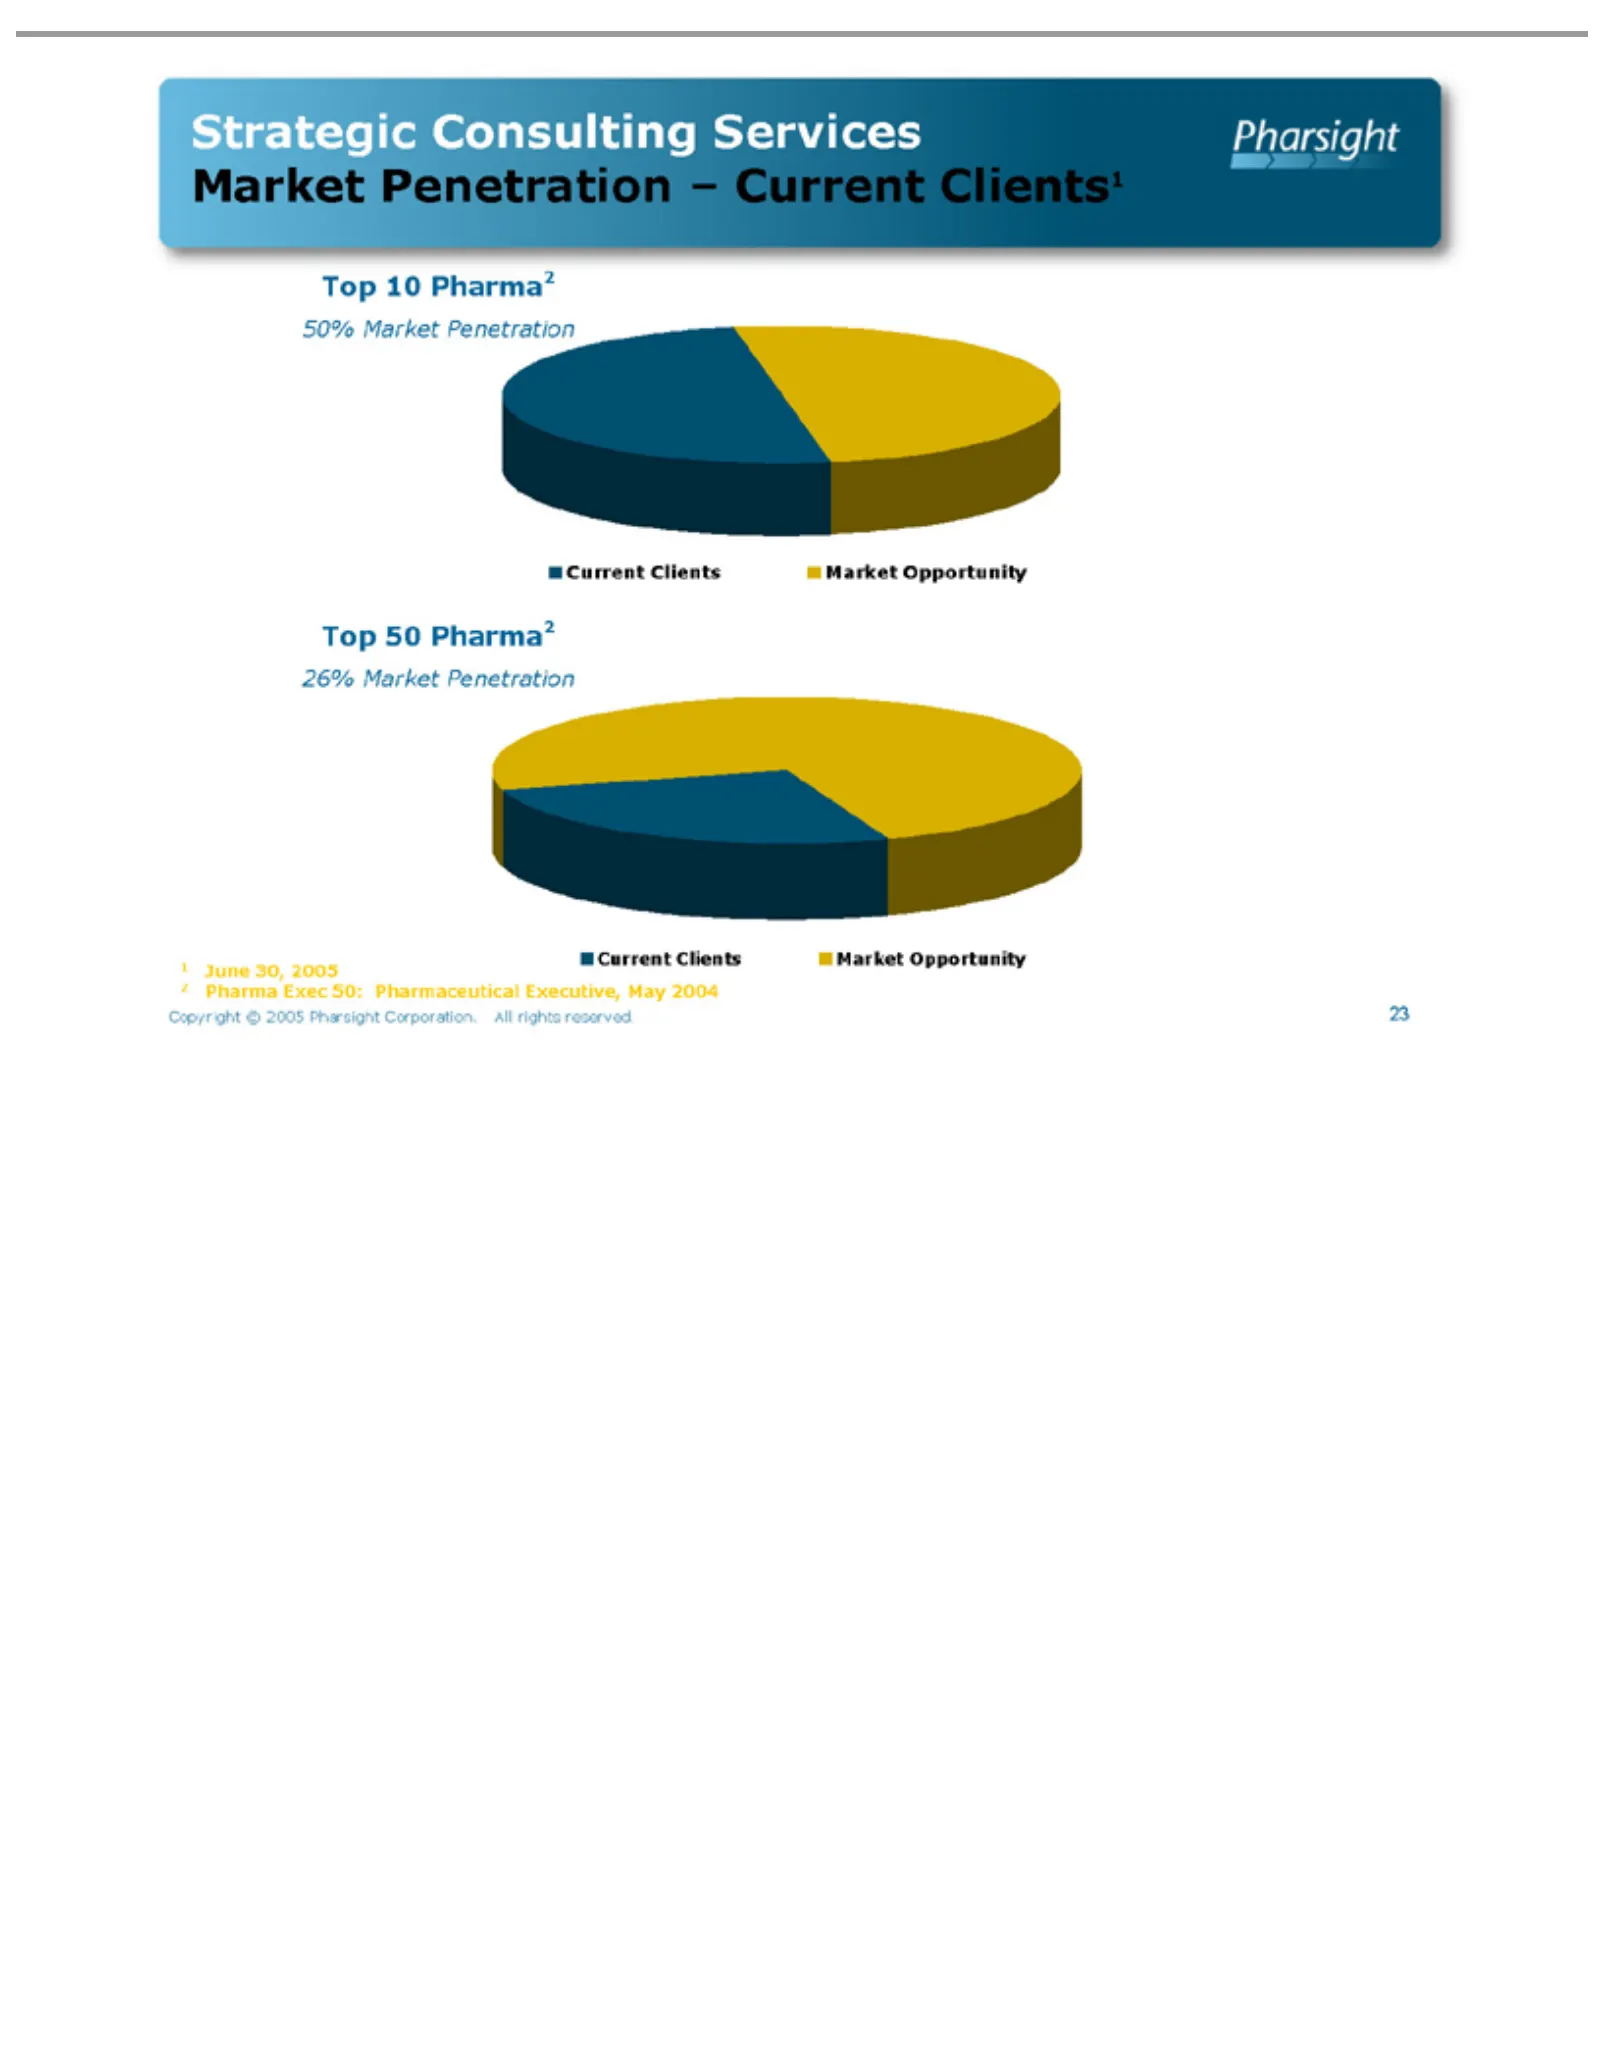
Slide 23: Strategic Consulting Market Penetration
Strategic 50% Top 26% Current Market 1 2 23 June 10 50 Market Pharma2 Opportunity Clients Pharma Copyright 30, Consulting 2005 Penetration ©Exec 200550: Services Market Executive, Pharmaceutical Pharsight Penetration Corporation. – Current May All rights 2004 Clients1 reserved.
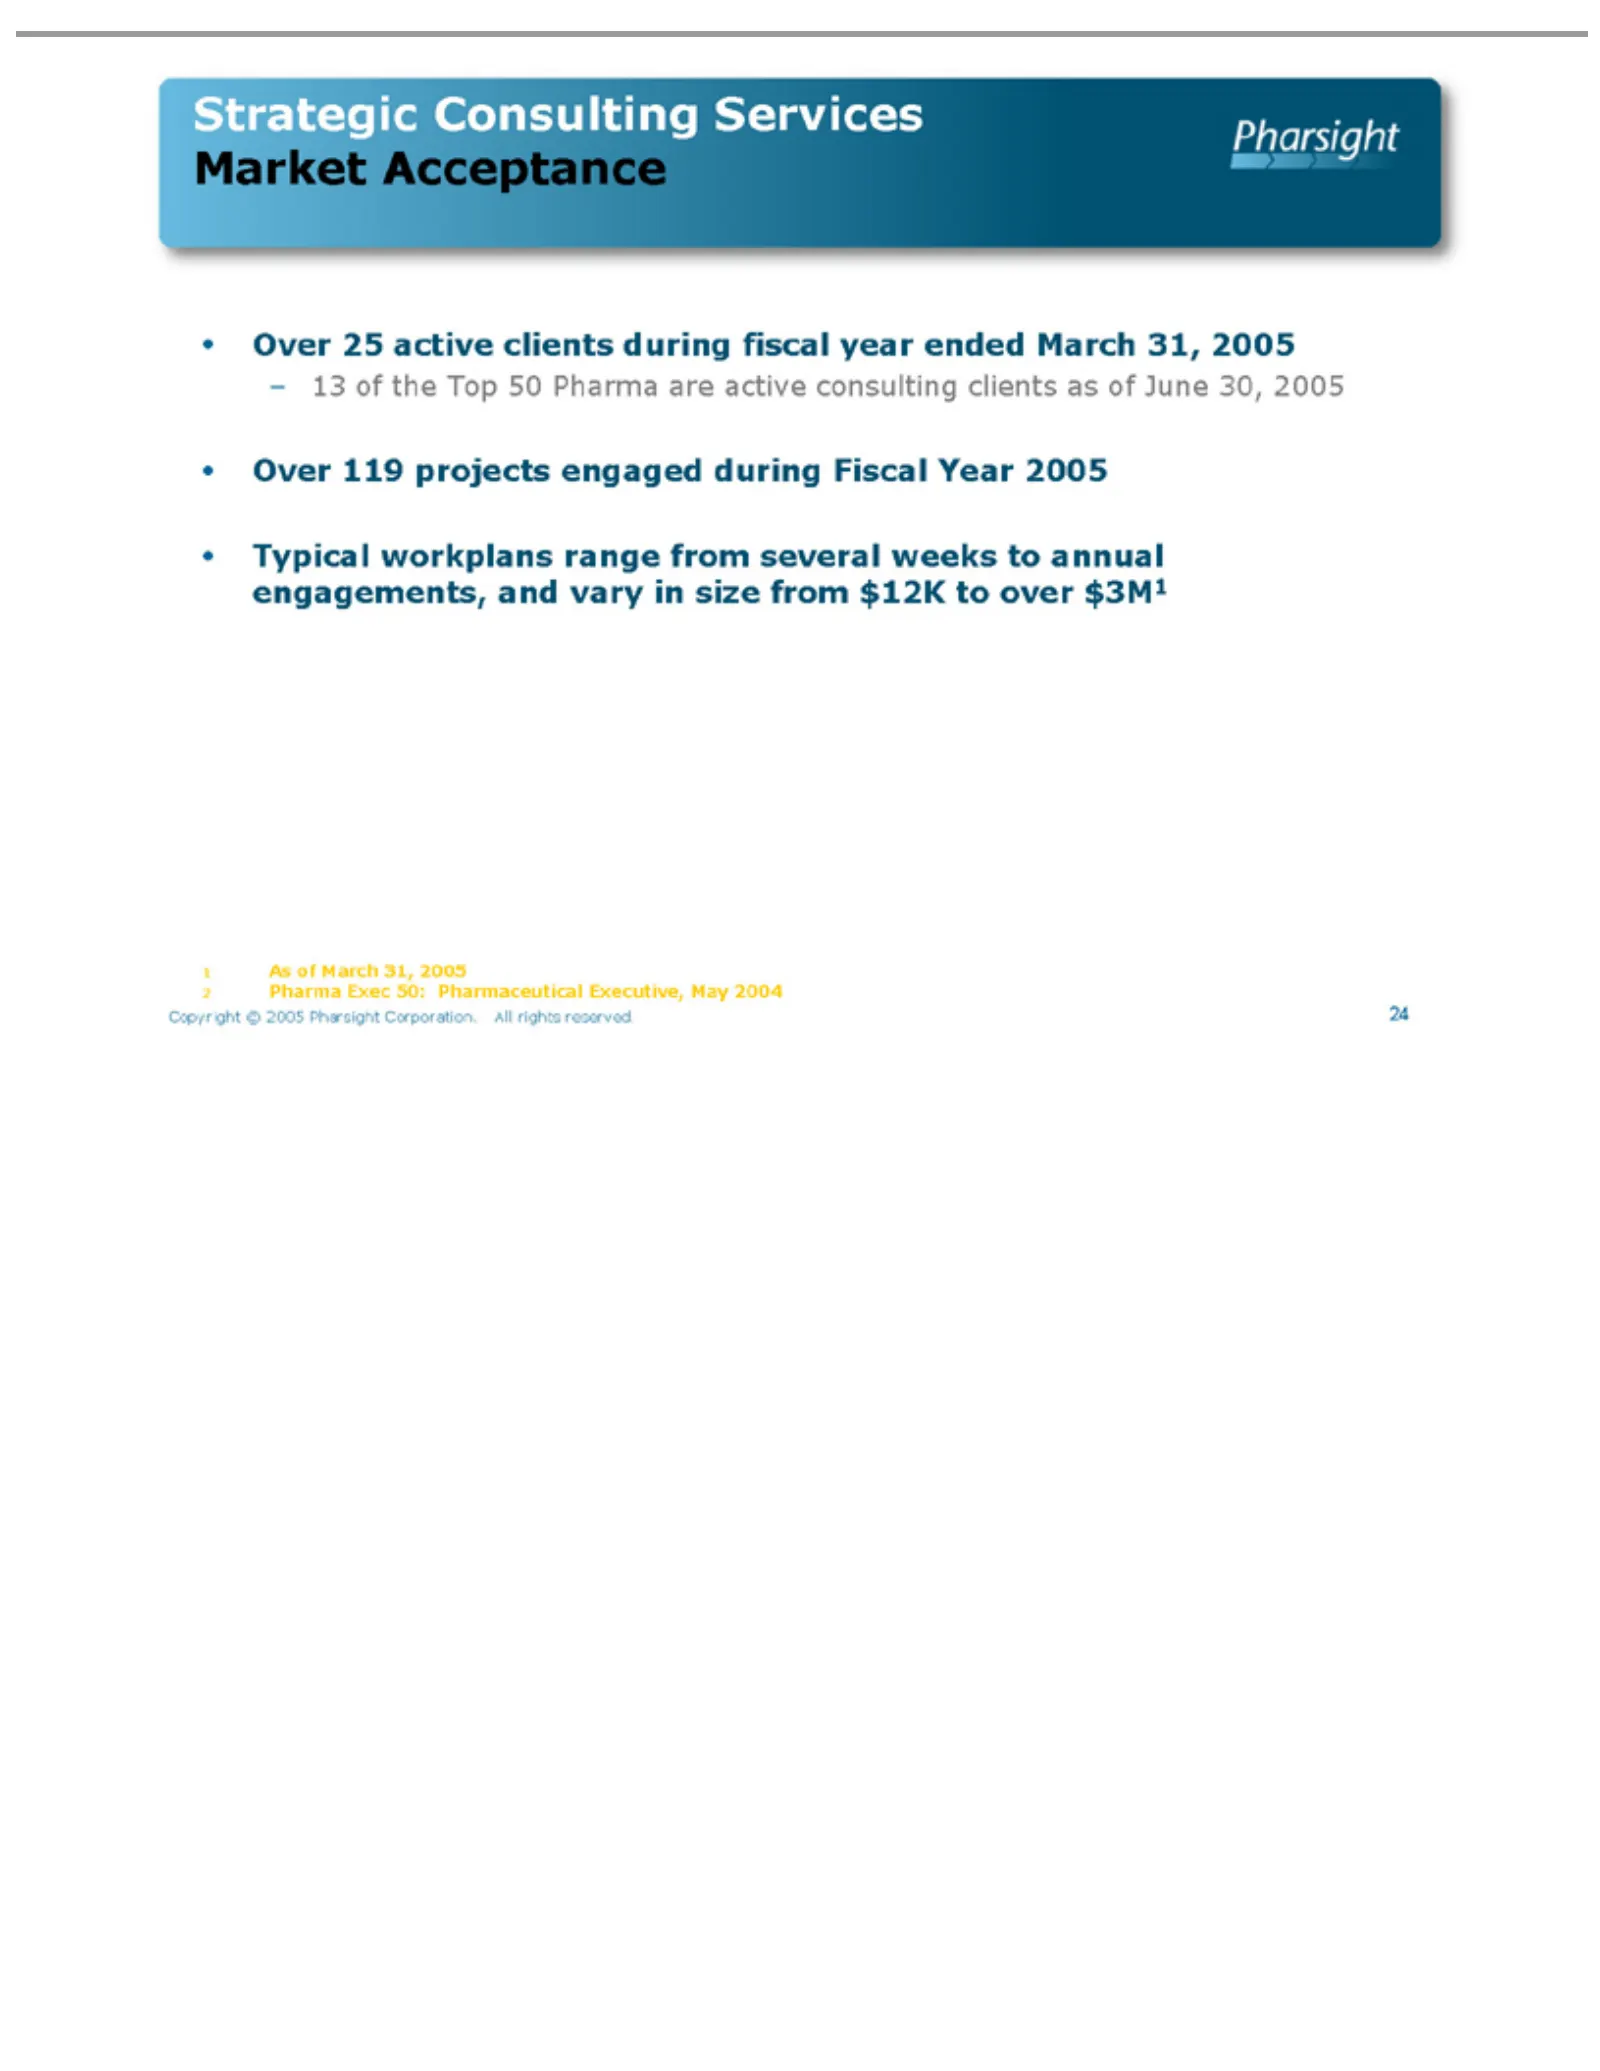
Slide 24: Strategic Consulting Market Acceptance
Strategic – Over Typical 1 2 Copyright 24As 13 of Pharma 25the 119 March workplans active Consulting projects Exec © Top 2005 31, clients 50: 50 engaged 2005 Pharsight Pharma range Pharmaceutical Services during from are during Corporation. fiscal Market several active Fiscal Executive, year consult
Slide 25: Pharsight Financial Overview
Pharsight Financial Overview
Slide 26: FY05 Accomplishments and FY06 Objectives
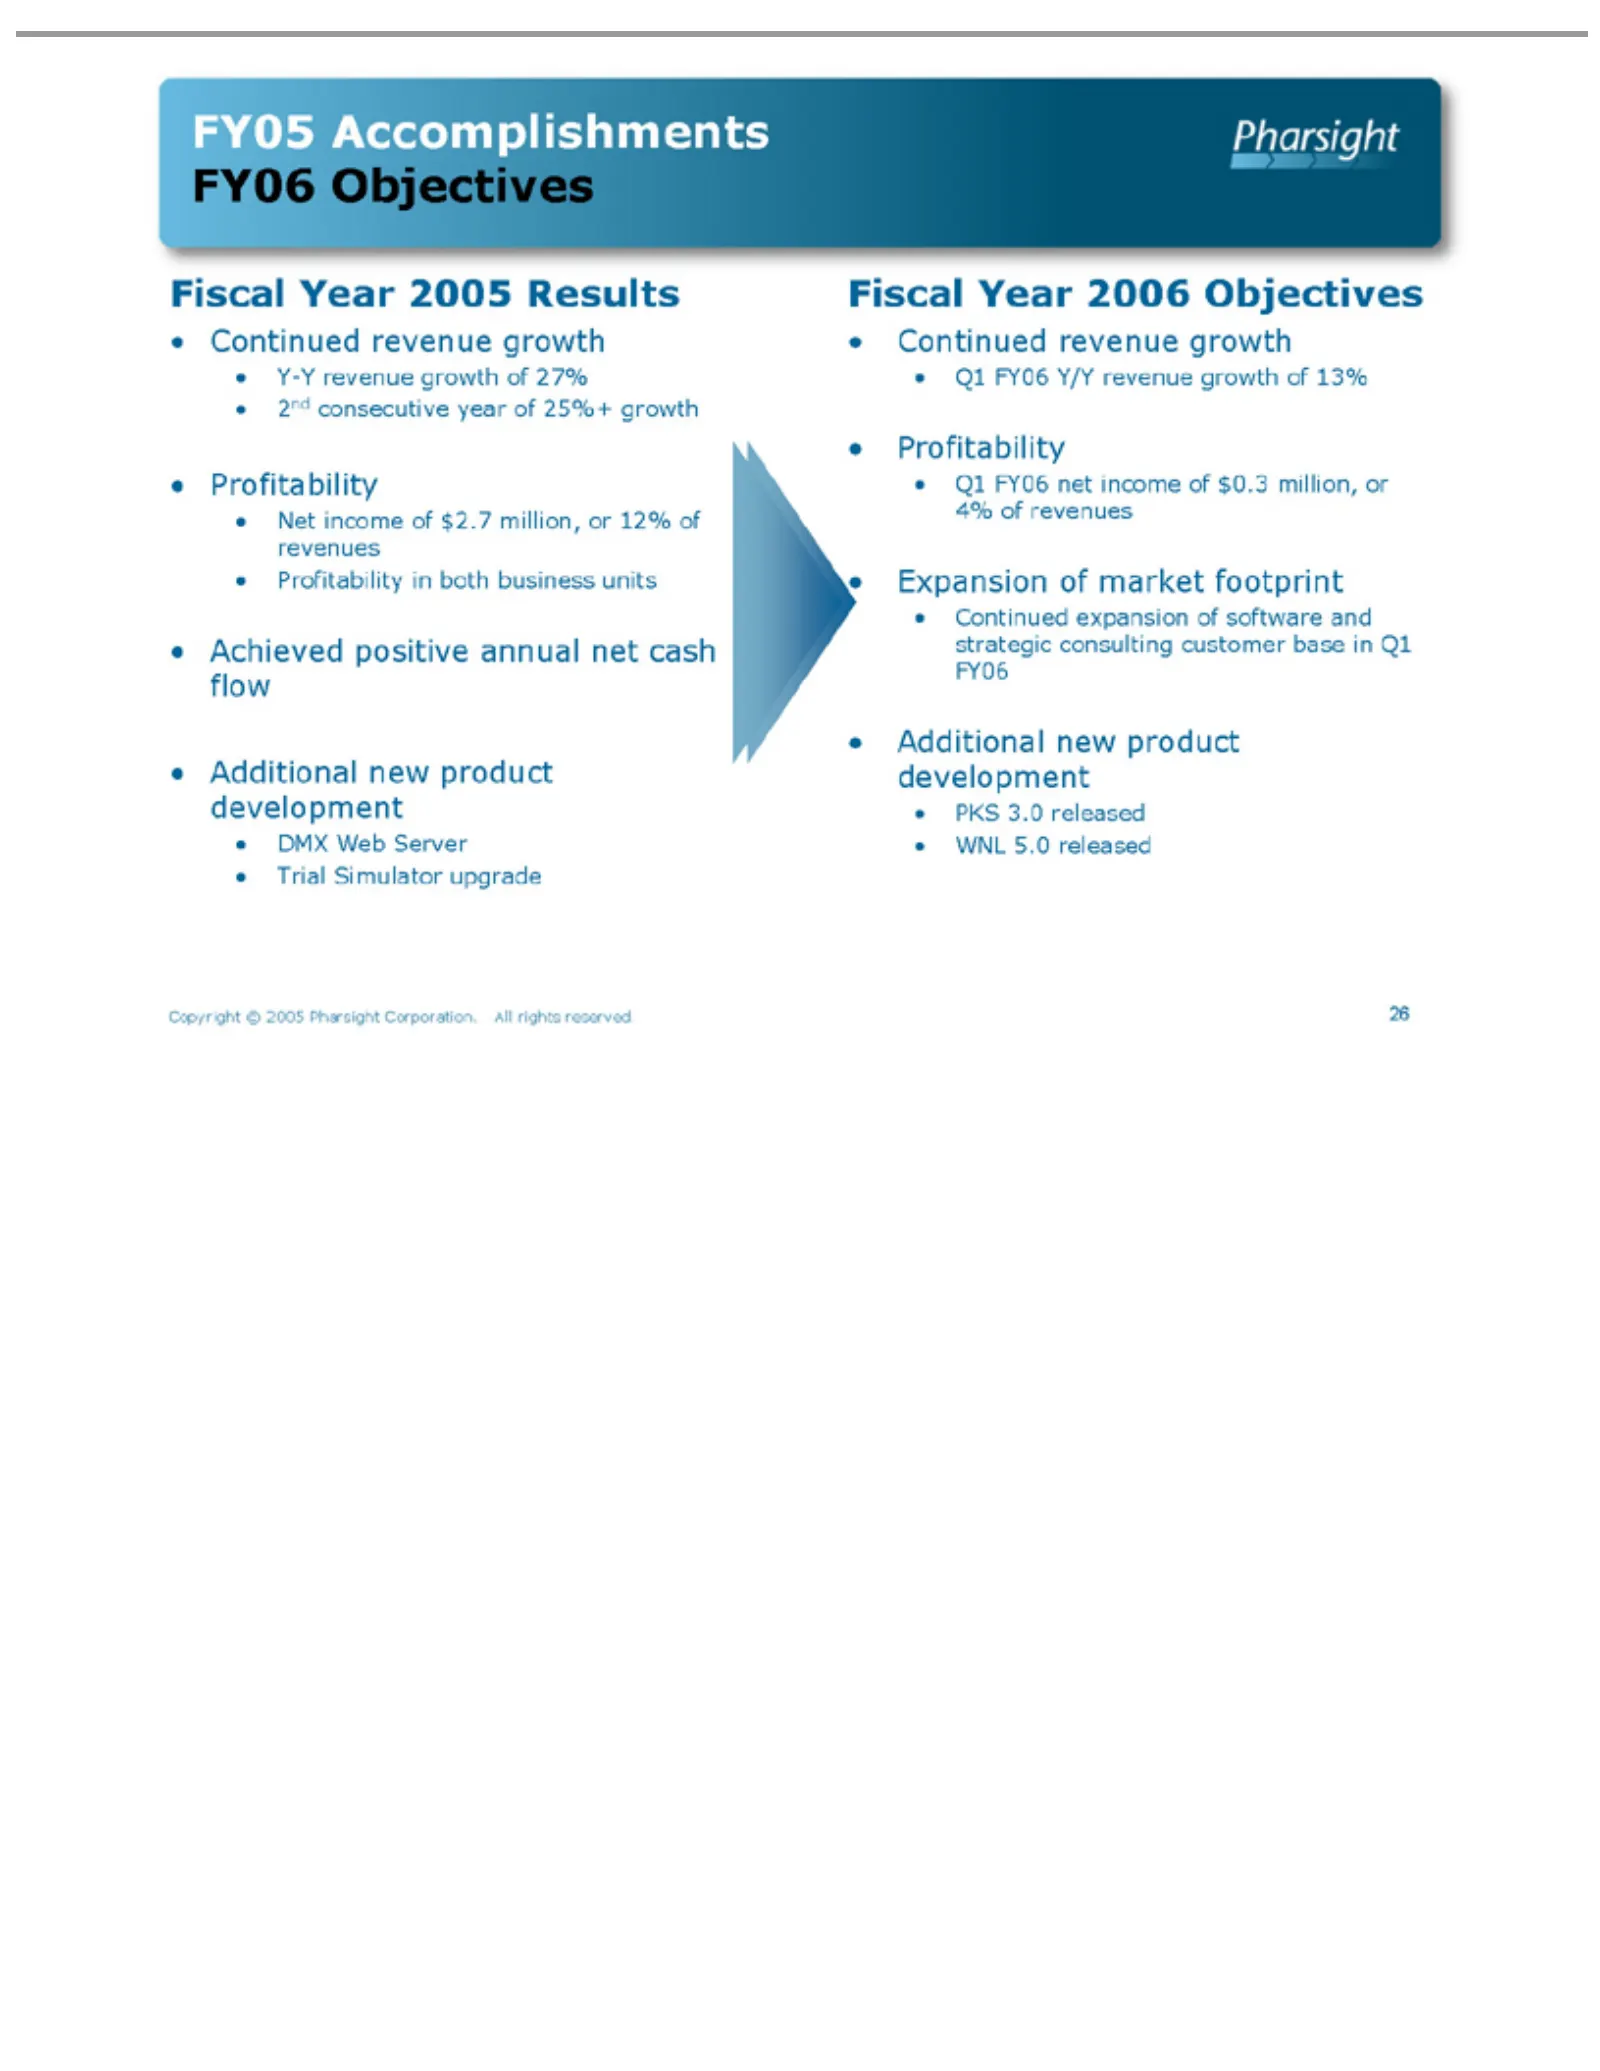
FY05 Y-Y 2nd Net Achieved DMX Trial Fiscal Q1 Profitability Expansion Continued Additional PKS WNL Copyright 26 FY06 income consecutive revenue 3.0 Simulator Accomplishments 5.0 Web Year released Y/Y released net positive © revenue expansion of new Server 2005 2006 of in growth 2005 income market re
Slide 27: Summary Statement of Operations Y/Y
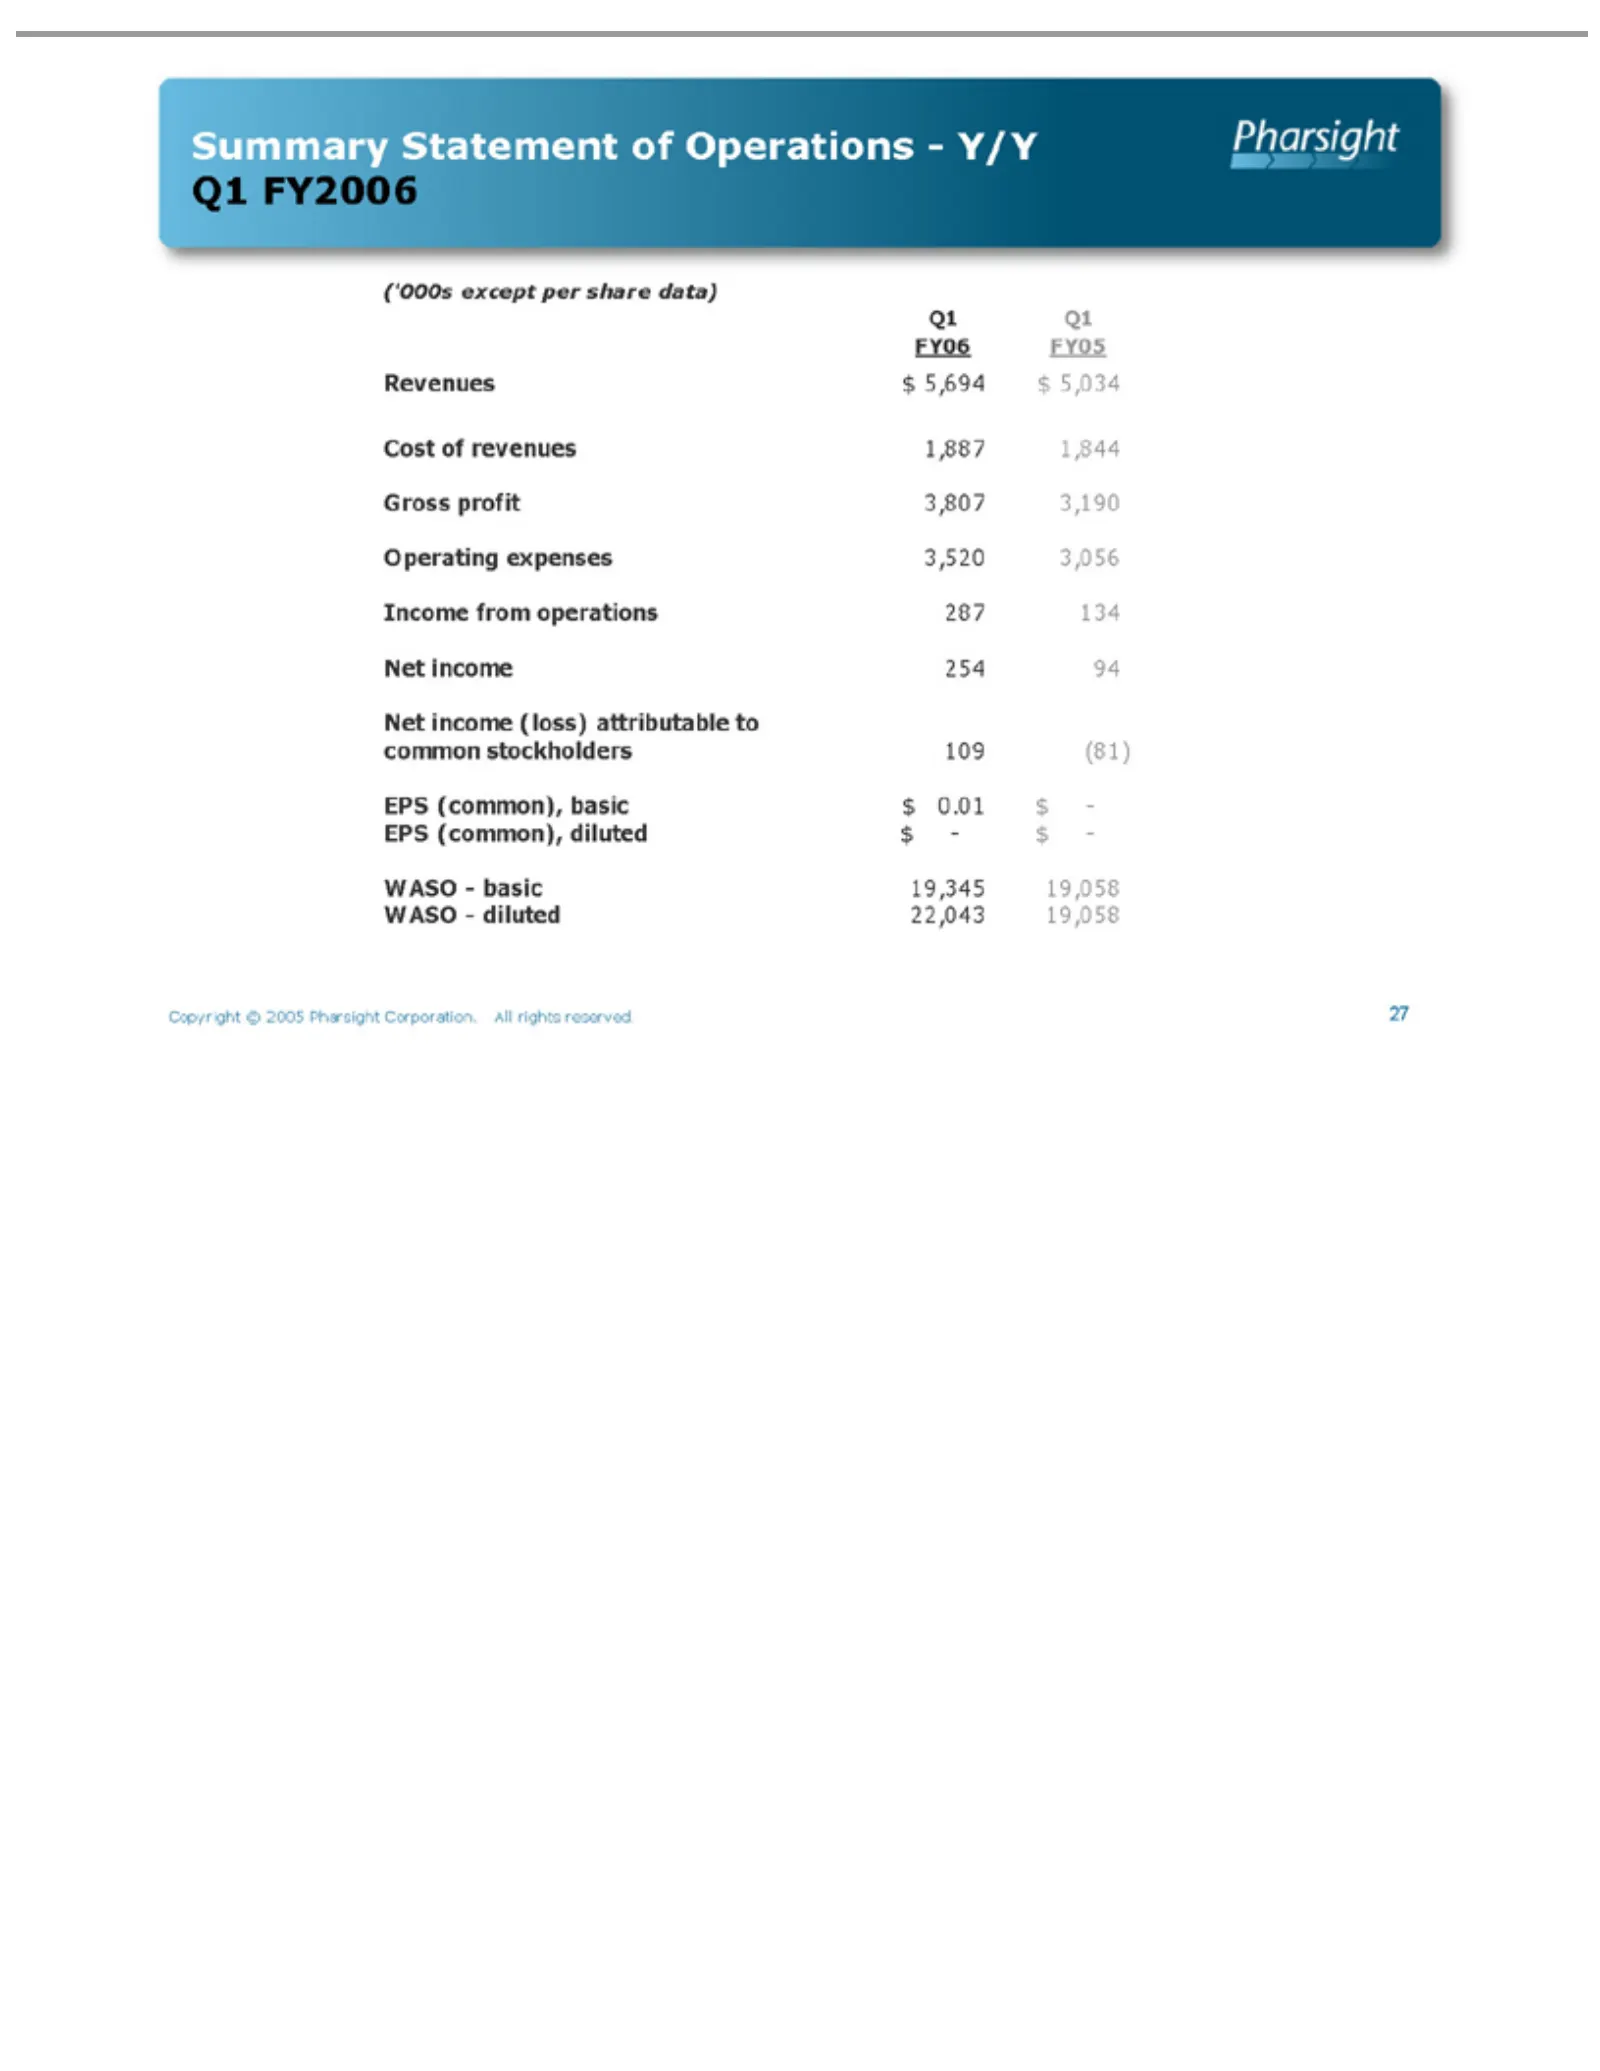
Summary (‘000s Q1 Revenues Cost Gross Operating Income Net common EPS WASO—basic WASO—diluted Copyright 27 FY06 income (common), ofprofit except revenues from stockholders Q1 $Statement expenses ©(loss) 254 5,694 3,807 2005 operations FY05 per 19,345 94 basic diluted 22,043 1,887 share attributable
Slide 28: Summary Q1 FY06 Results: Software Products
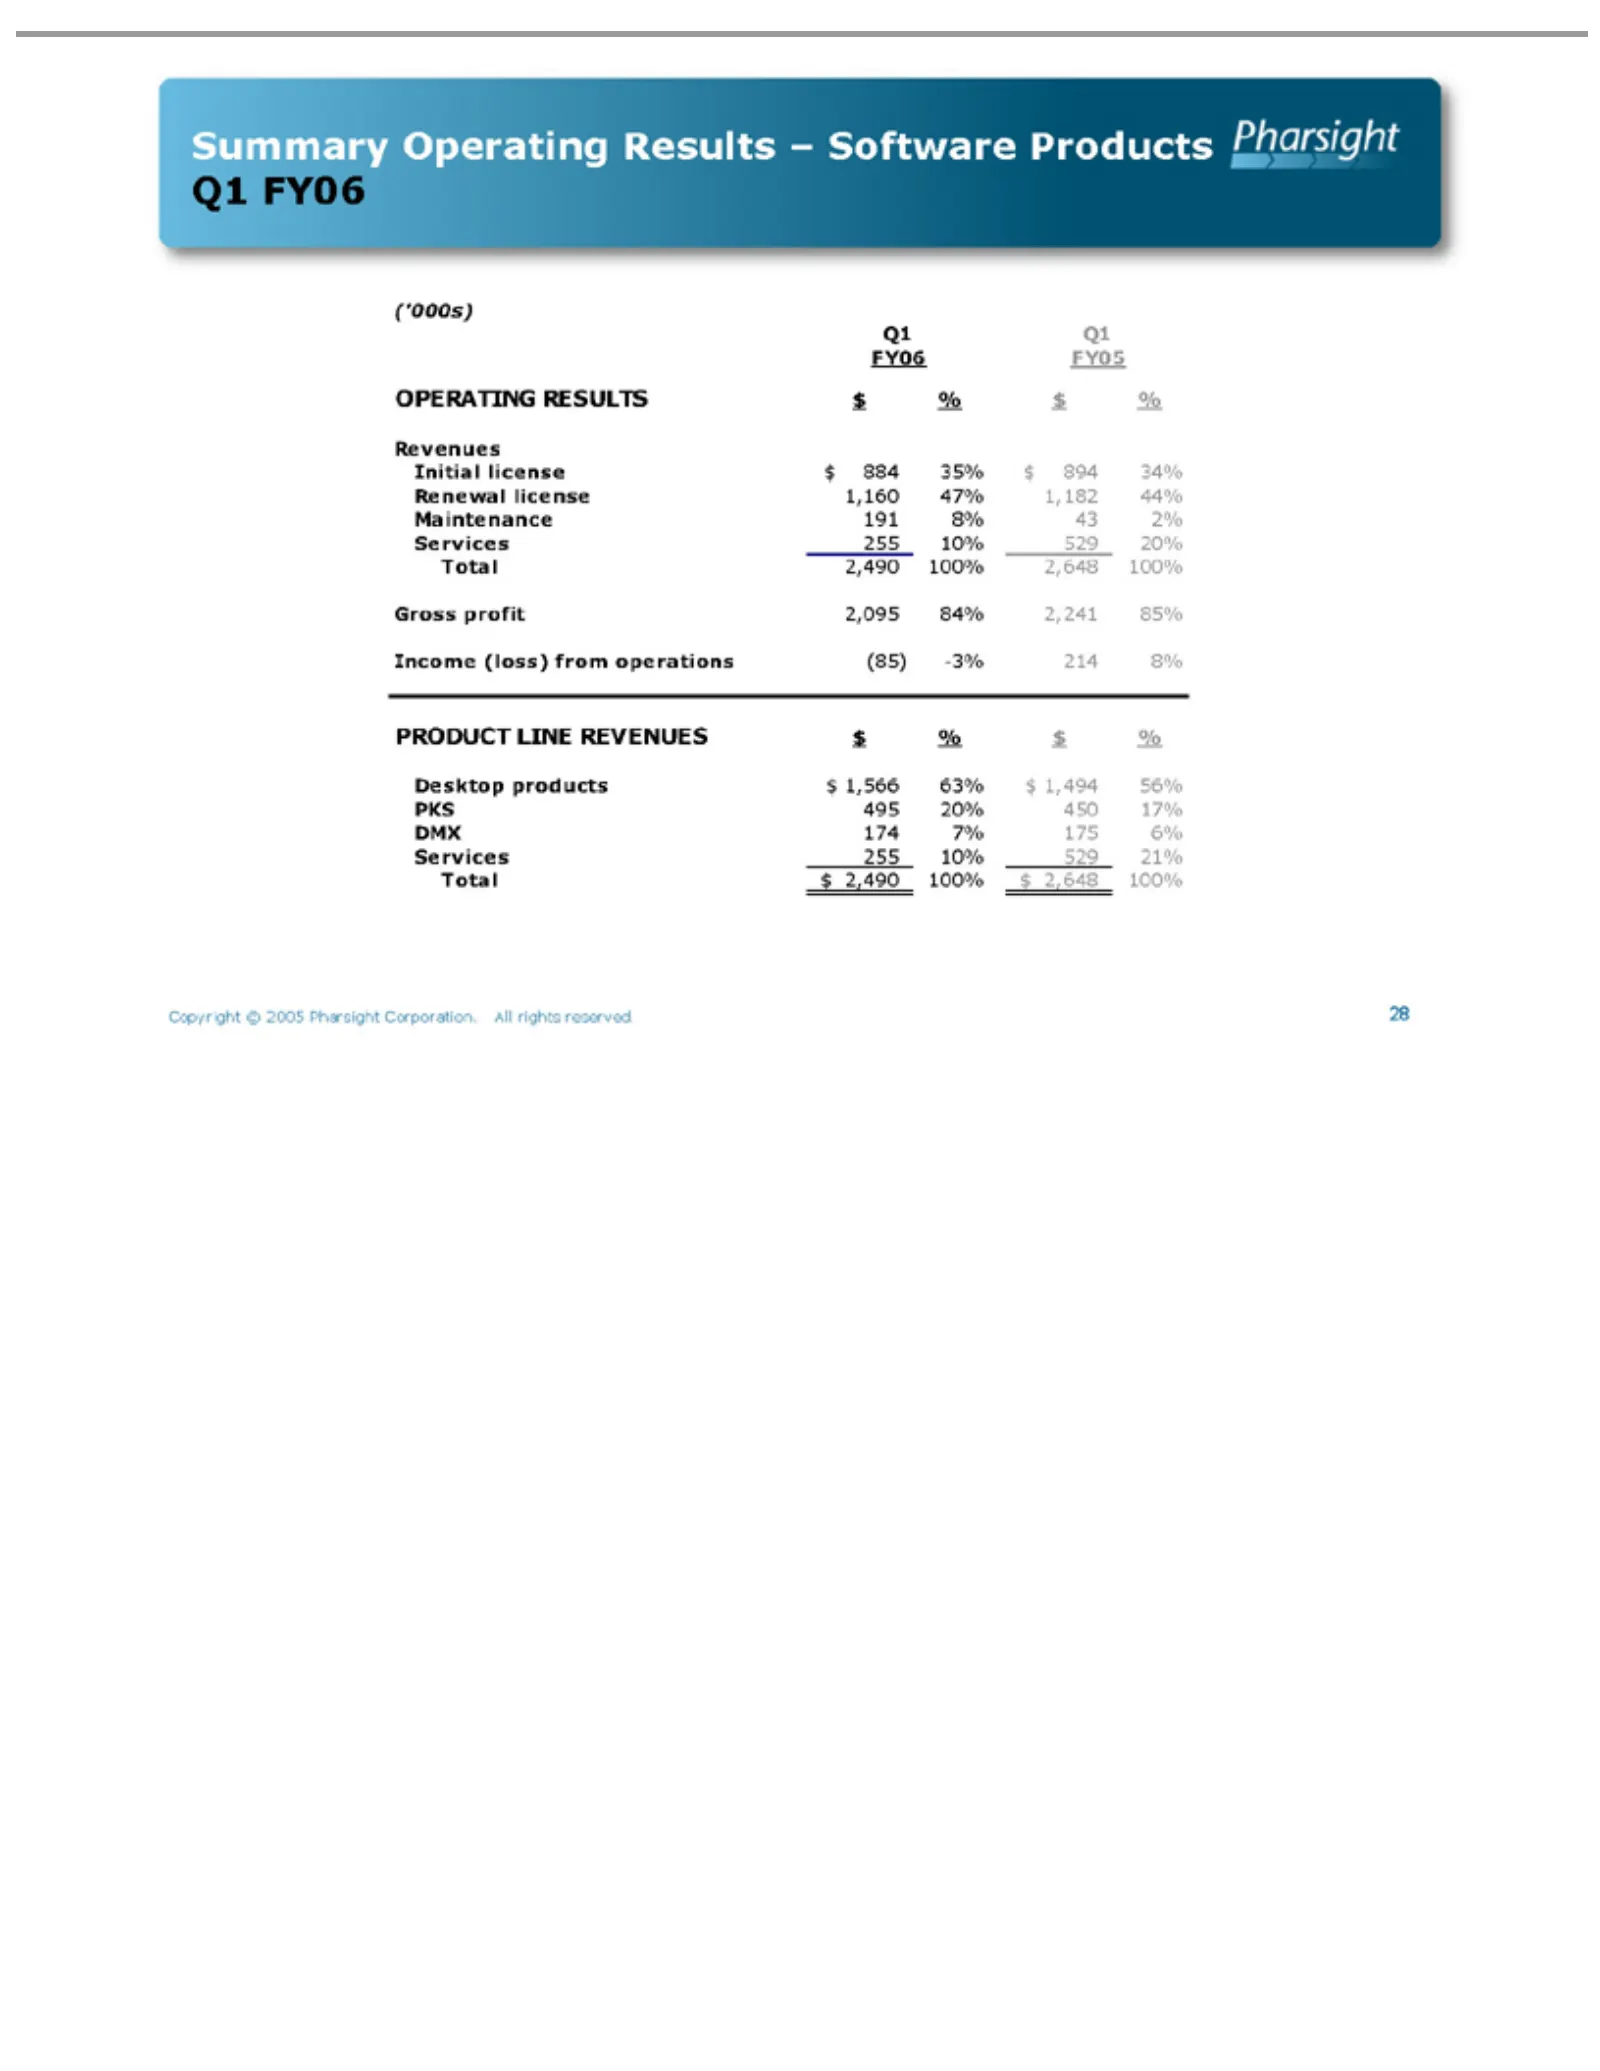
Summary Q1 (‘000s) OPERATING Initial Revenues Renewal Maintenance Gross Income PRODUCT Desktop PKS DMX Services Total Copyright 28 FY06 495 $2,490 174 profit license 2,490 (loss) products 255 license 20% Q1 Operating © 7% 100% LINE 2,095 2005 10% 191 FY05 100% $from RESULTS 175 450 884 1,160 8% $2,6
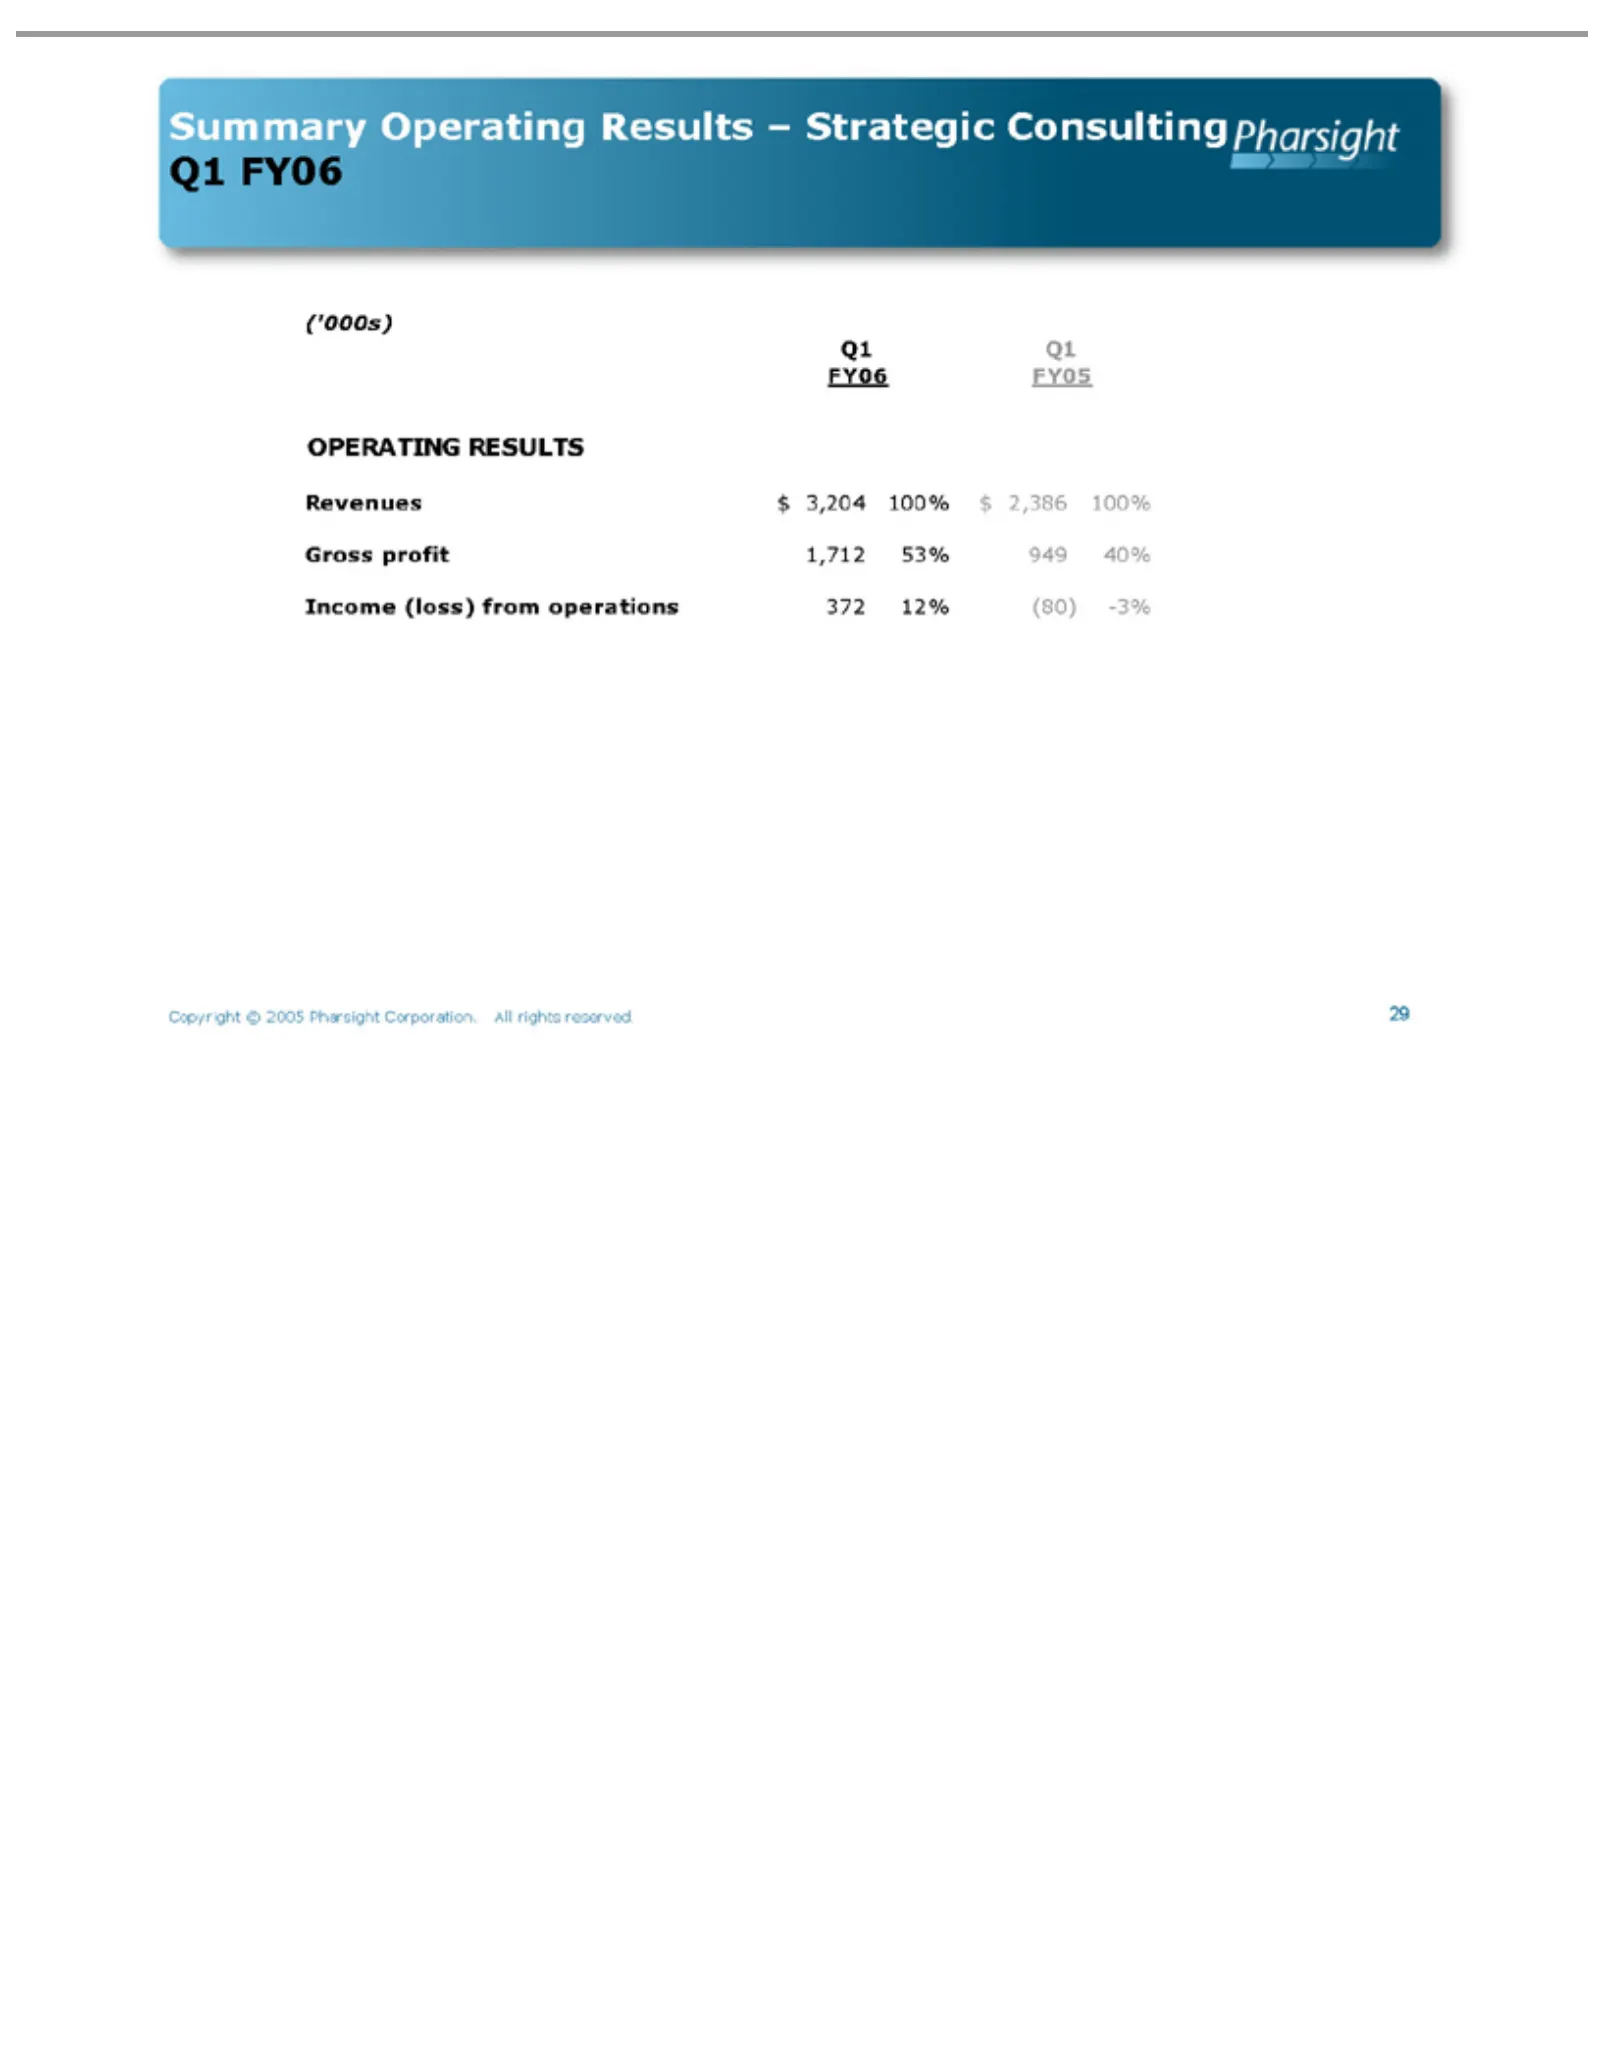
Slide 29: Summary Q1 FY06 Results: Strategic Consulting
Summary Q1 (‘000s) OPERATING Revenues Gross Income Copyright 29 FY06 profit (loss) Q1 $Operating ©3,204 1,712 2005 FY05 from RESULTS 100% 53% Pharsight operations Results 949 $ 2,386 40% –Corporation. 372 Strategic 100% 12% Consulting (80) All-3% rights Q1 reserved. FY06
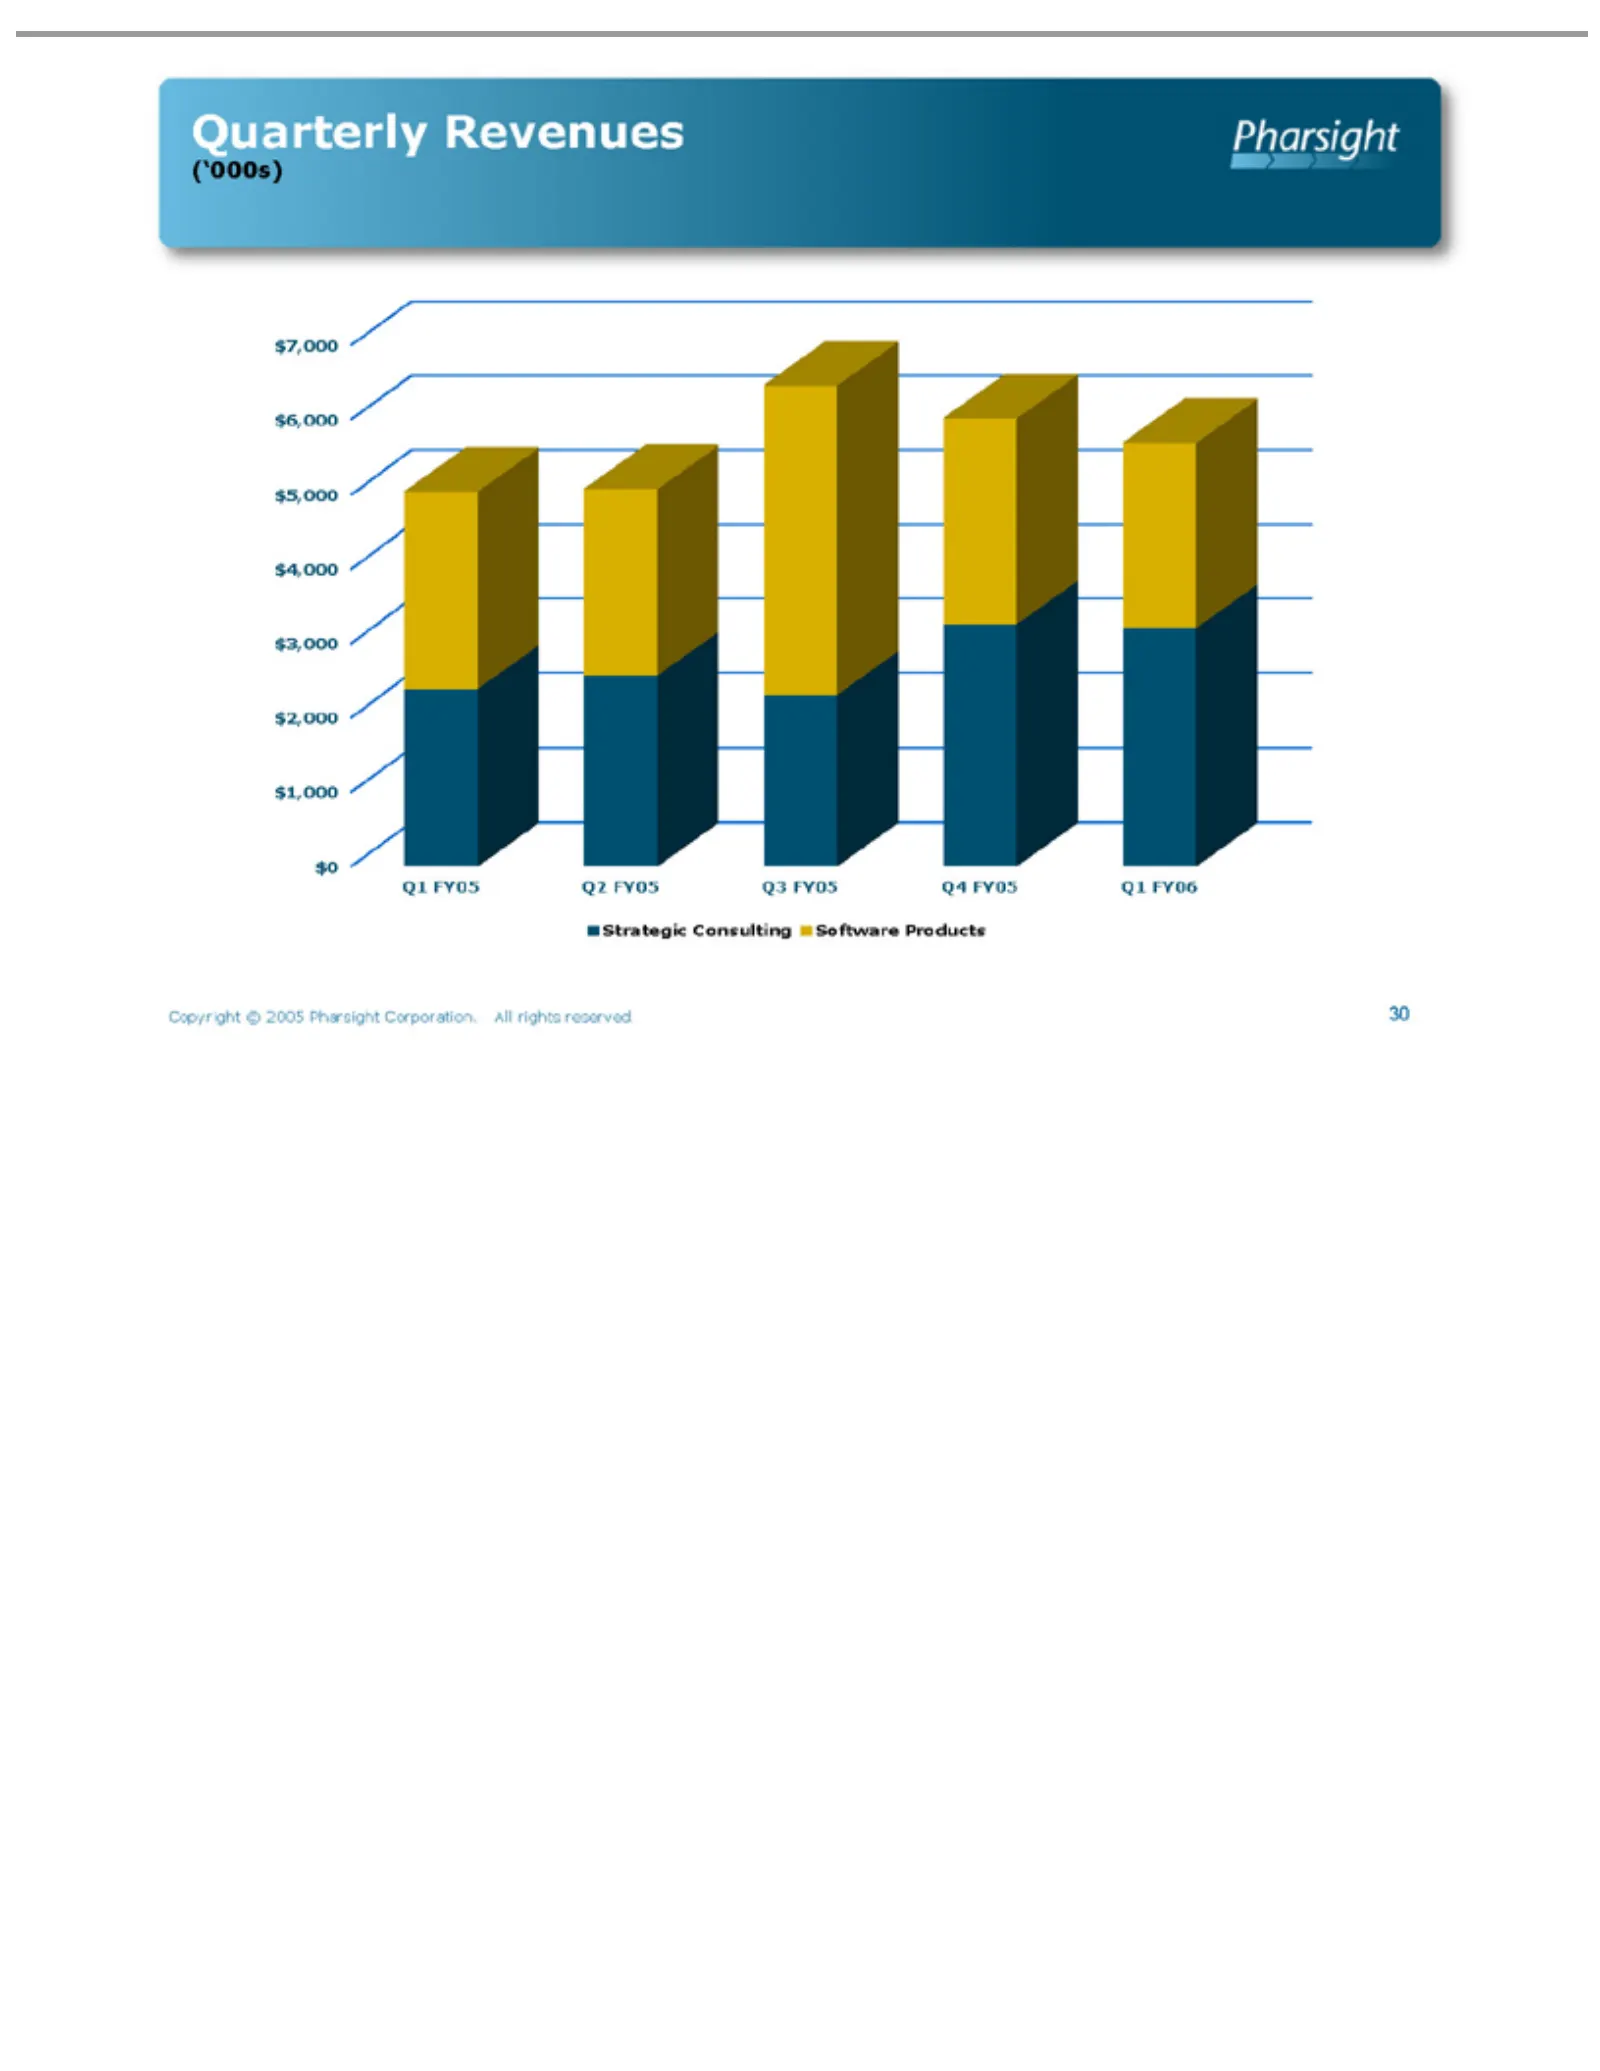
Slide 30: Quarterly Revenues by Segment
Quarterly (‘000s) Q1 Strategic Software Copyright 30 FY05$7,000 Consulting Products Q2 Revenues © 2005 FY05 $6,000 Pharsight Q3$5,000 FY05Corporation. Q4 $4,000 FY05$3,000 Q1All FY06 $2,000 rights reserved. $1,000 $0
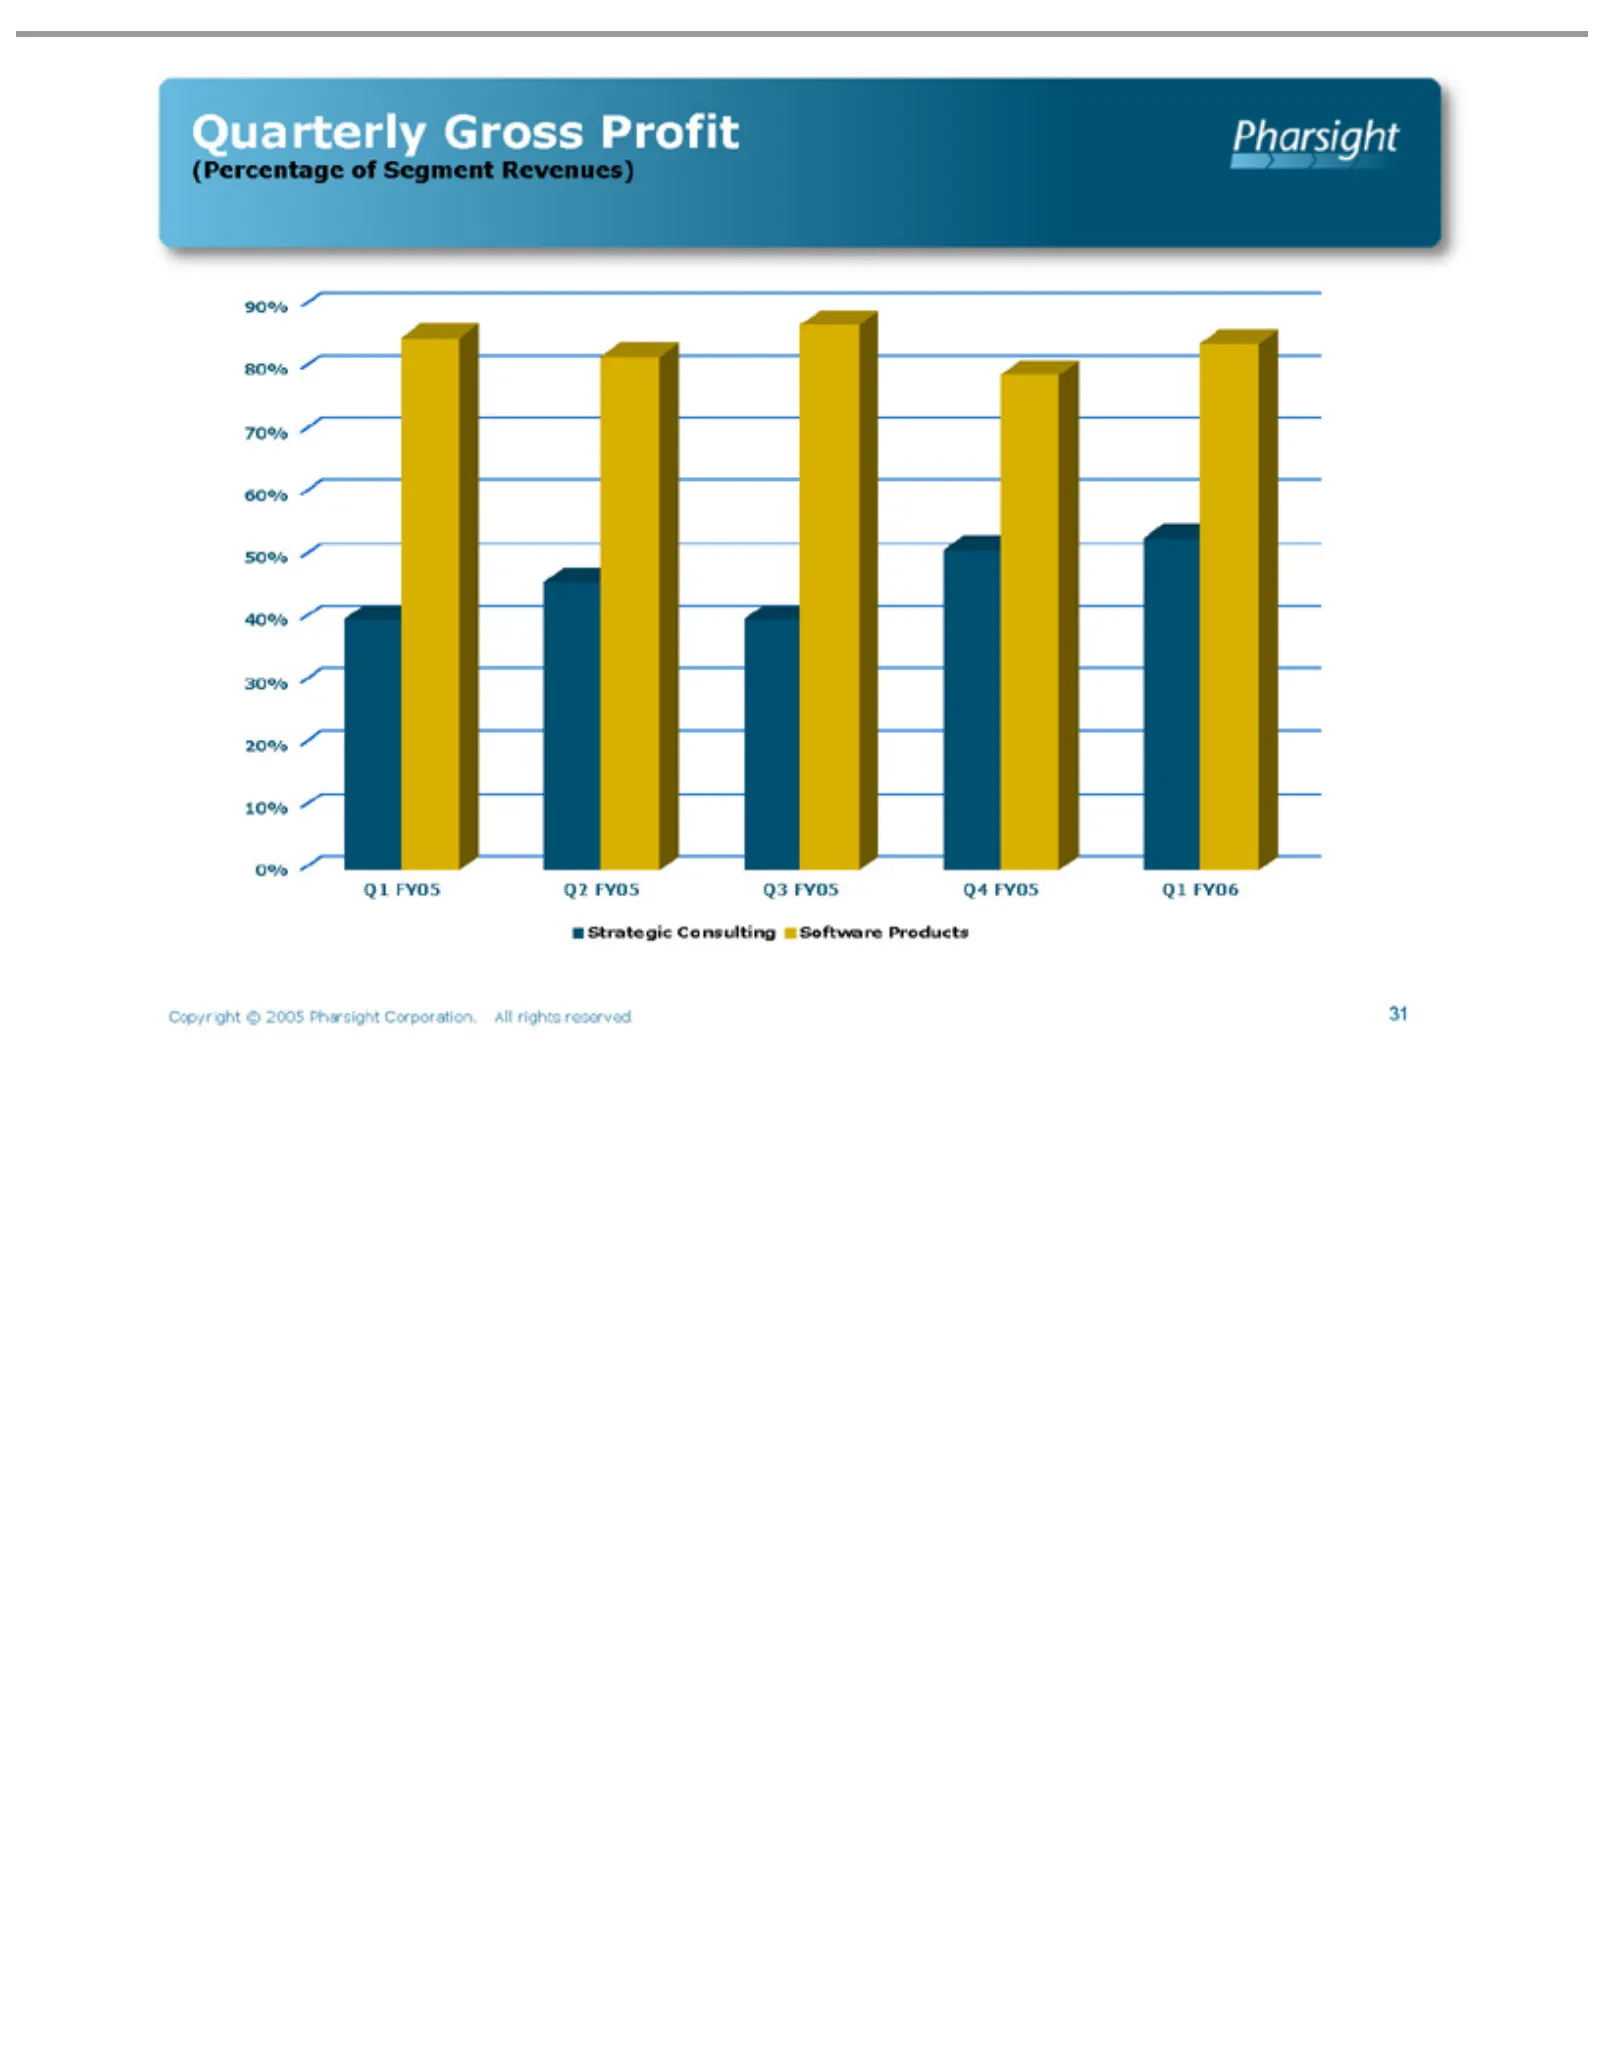
Slide 31: Quarterly Gross Profit by Segment
Quarterly (Percentage Q1 Strategic Software Copyright 31 FY05 Consulting Products Q2 Gross ©of2005 FY05 Segment Profit Pharsight Q3 FY05 Revenues) Corporation. Q4 FY05 Q1All FY06 rights reserved. 90% 80% 70% 60% 50% 40% 30% 20% 10% 0%
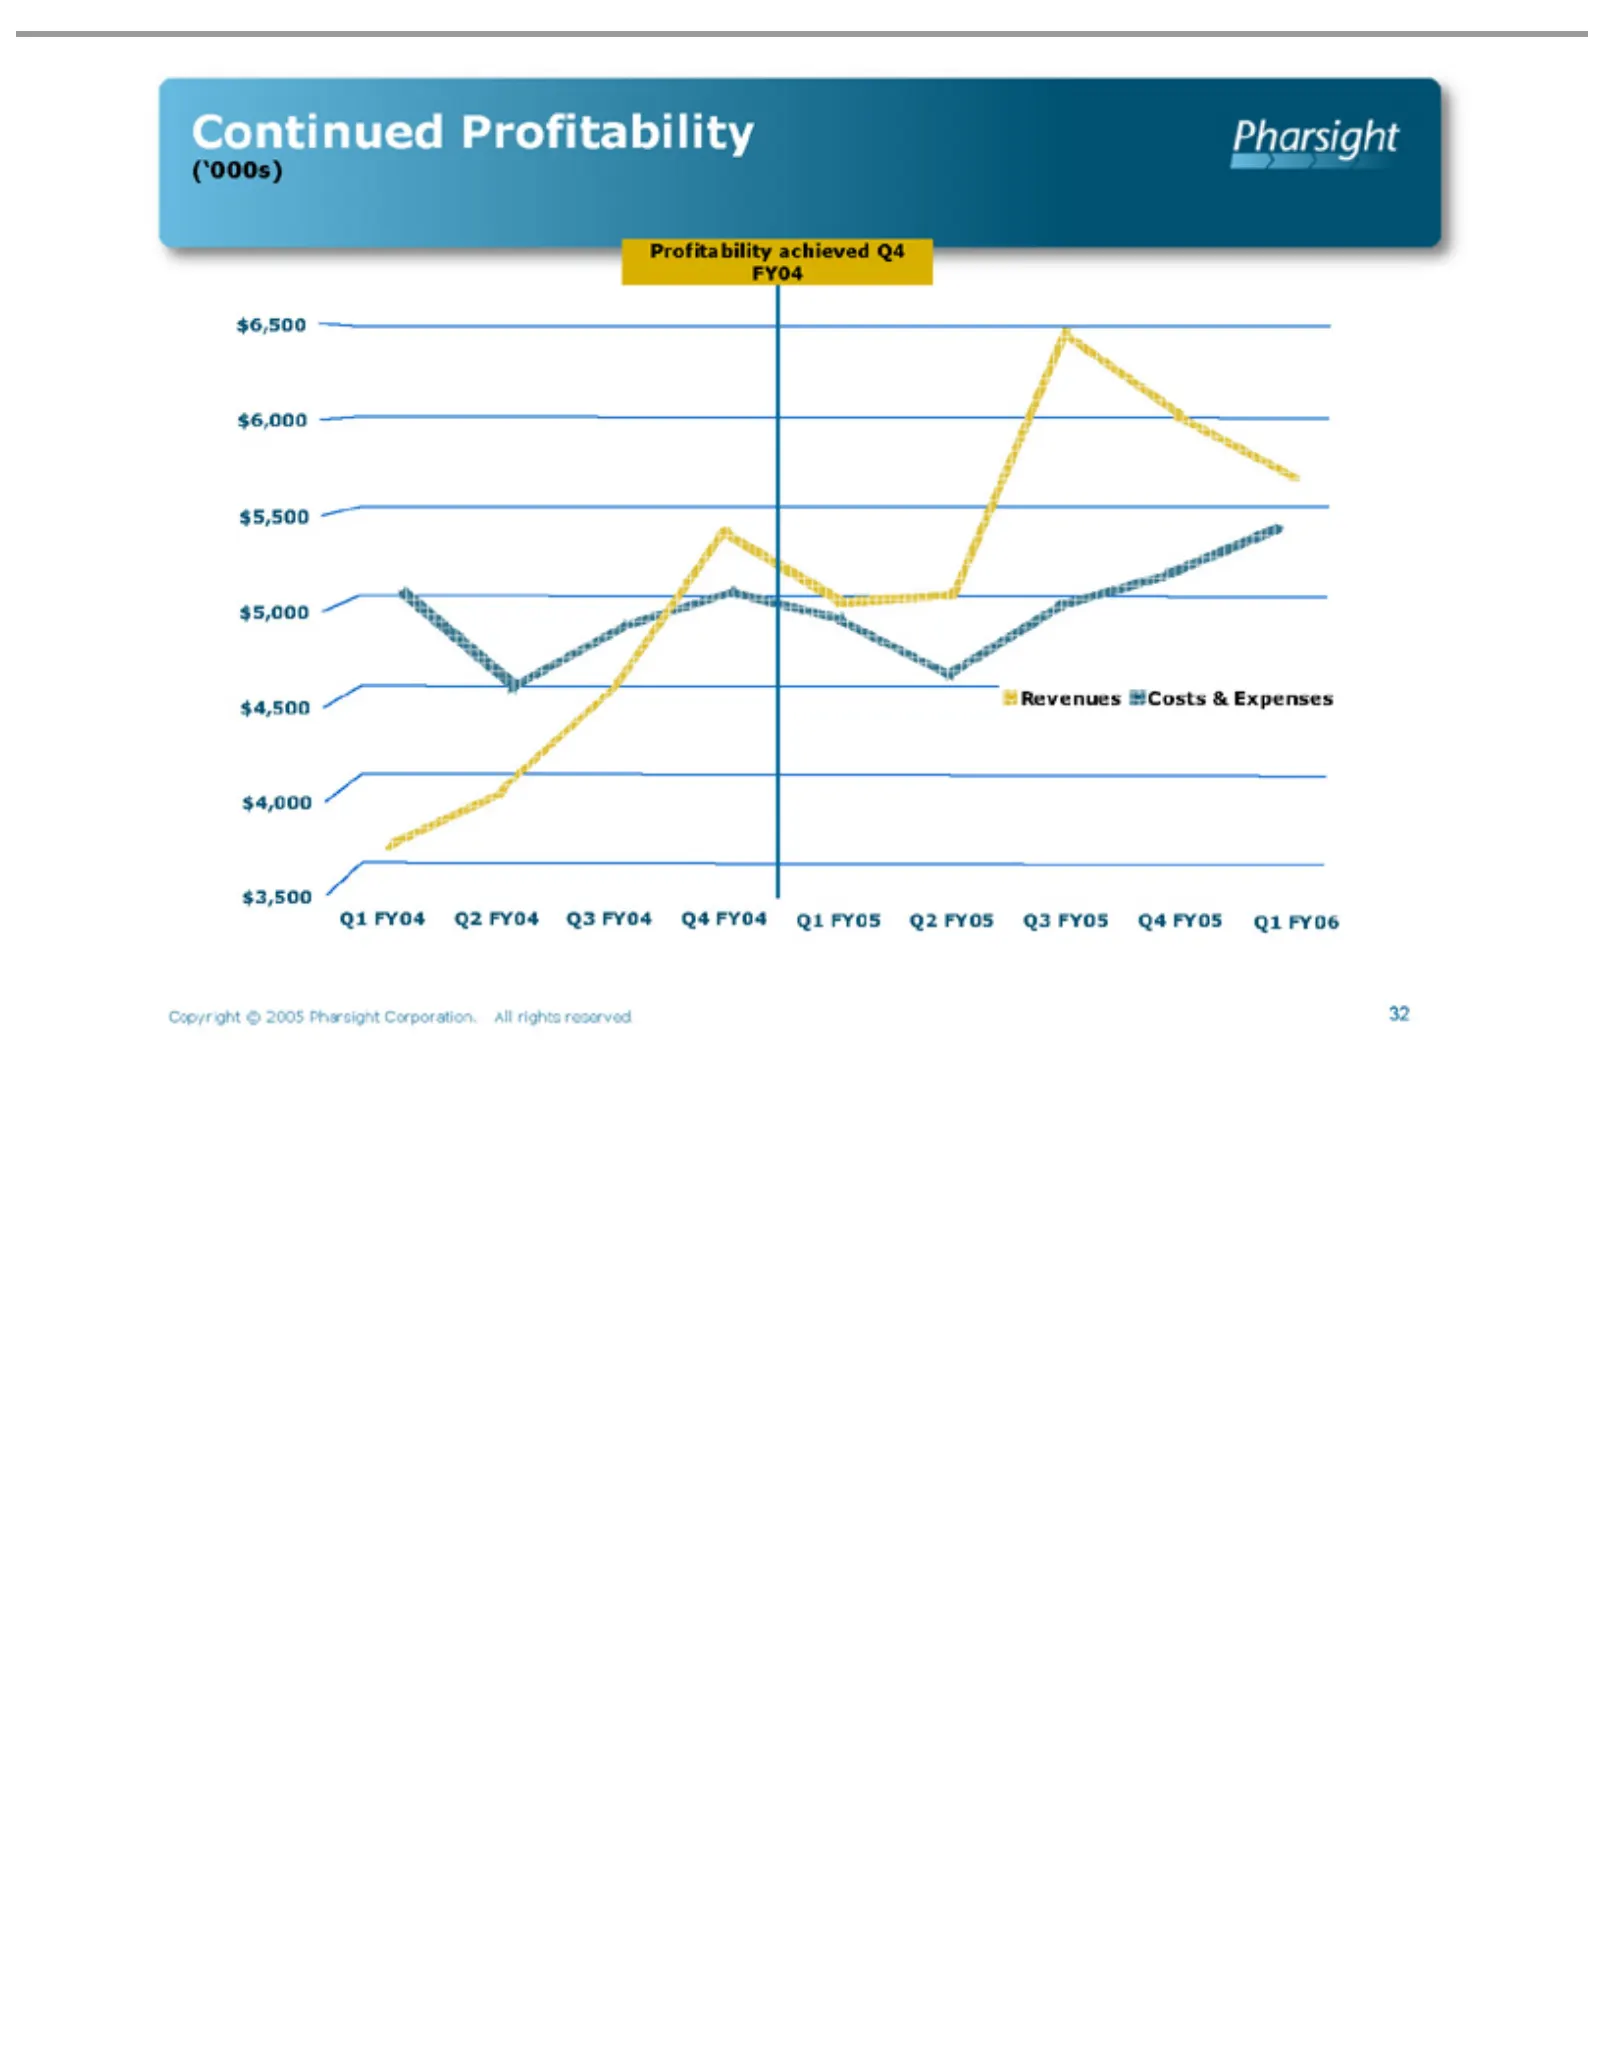
Slide 32: Continued Profitability: Revenues and Costs
Continued Profitability (‘000s) Q1 Costs Revenues Copyright 32 FY04 & Expenses Q2 © Profitability achieved 2005 FY04Pharsight Q3Q4 FY04 FY04 Corporation. Q4$6,500 FY04 $6,000 Q1All FY05 rights $5,500 Q2reserved. FY05 $5,000 Q3$4,500 FY05 $4,000 Q4 FY05 $3,500 Q1 FY06
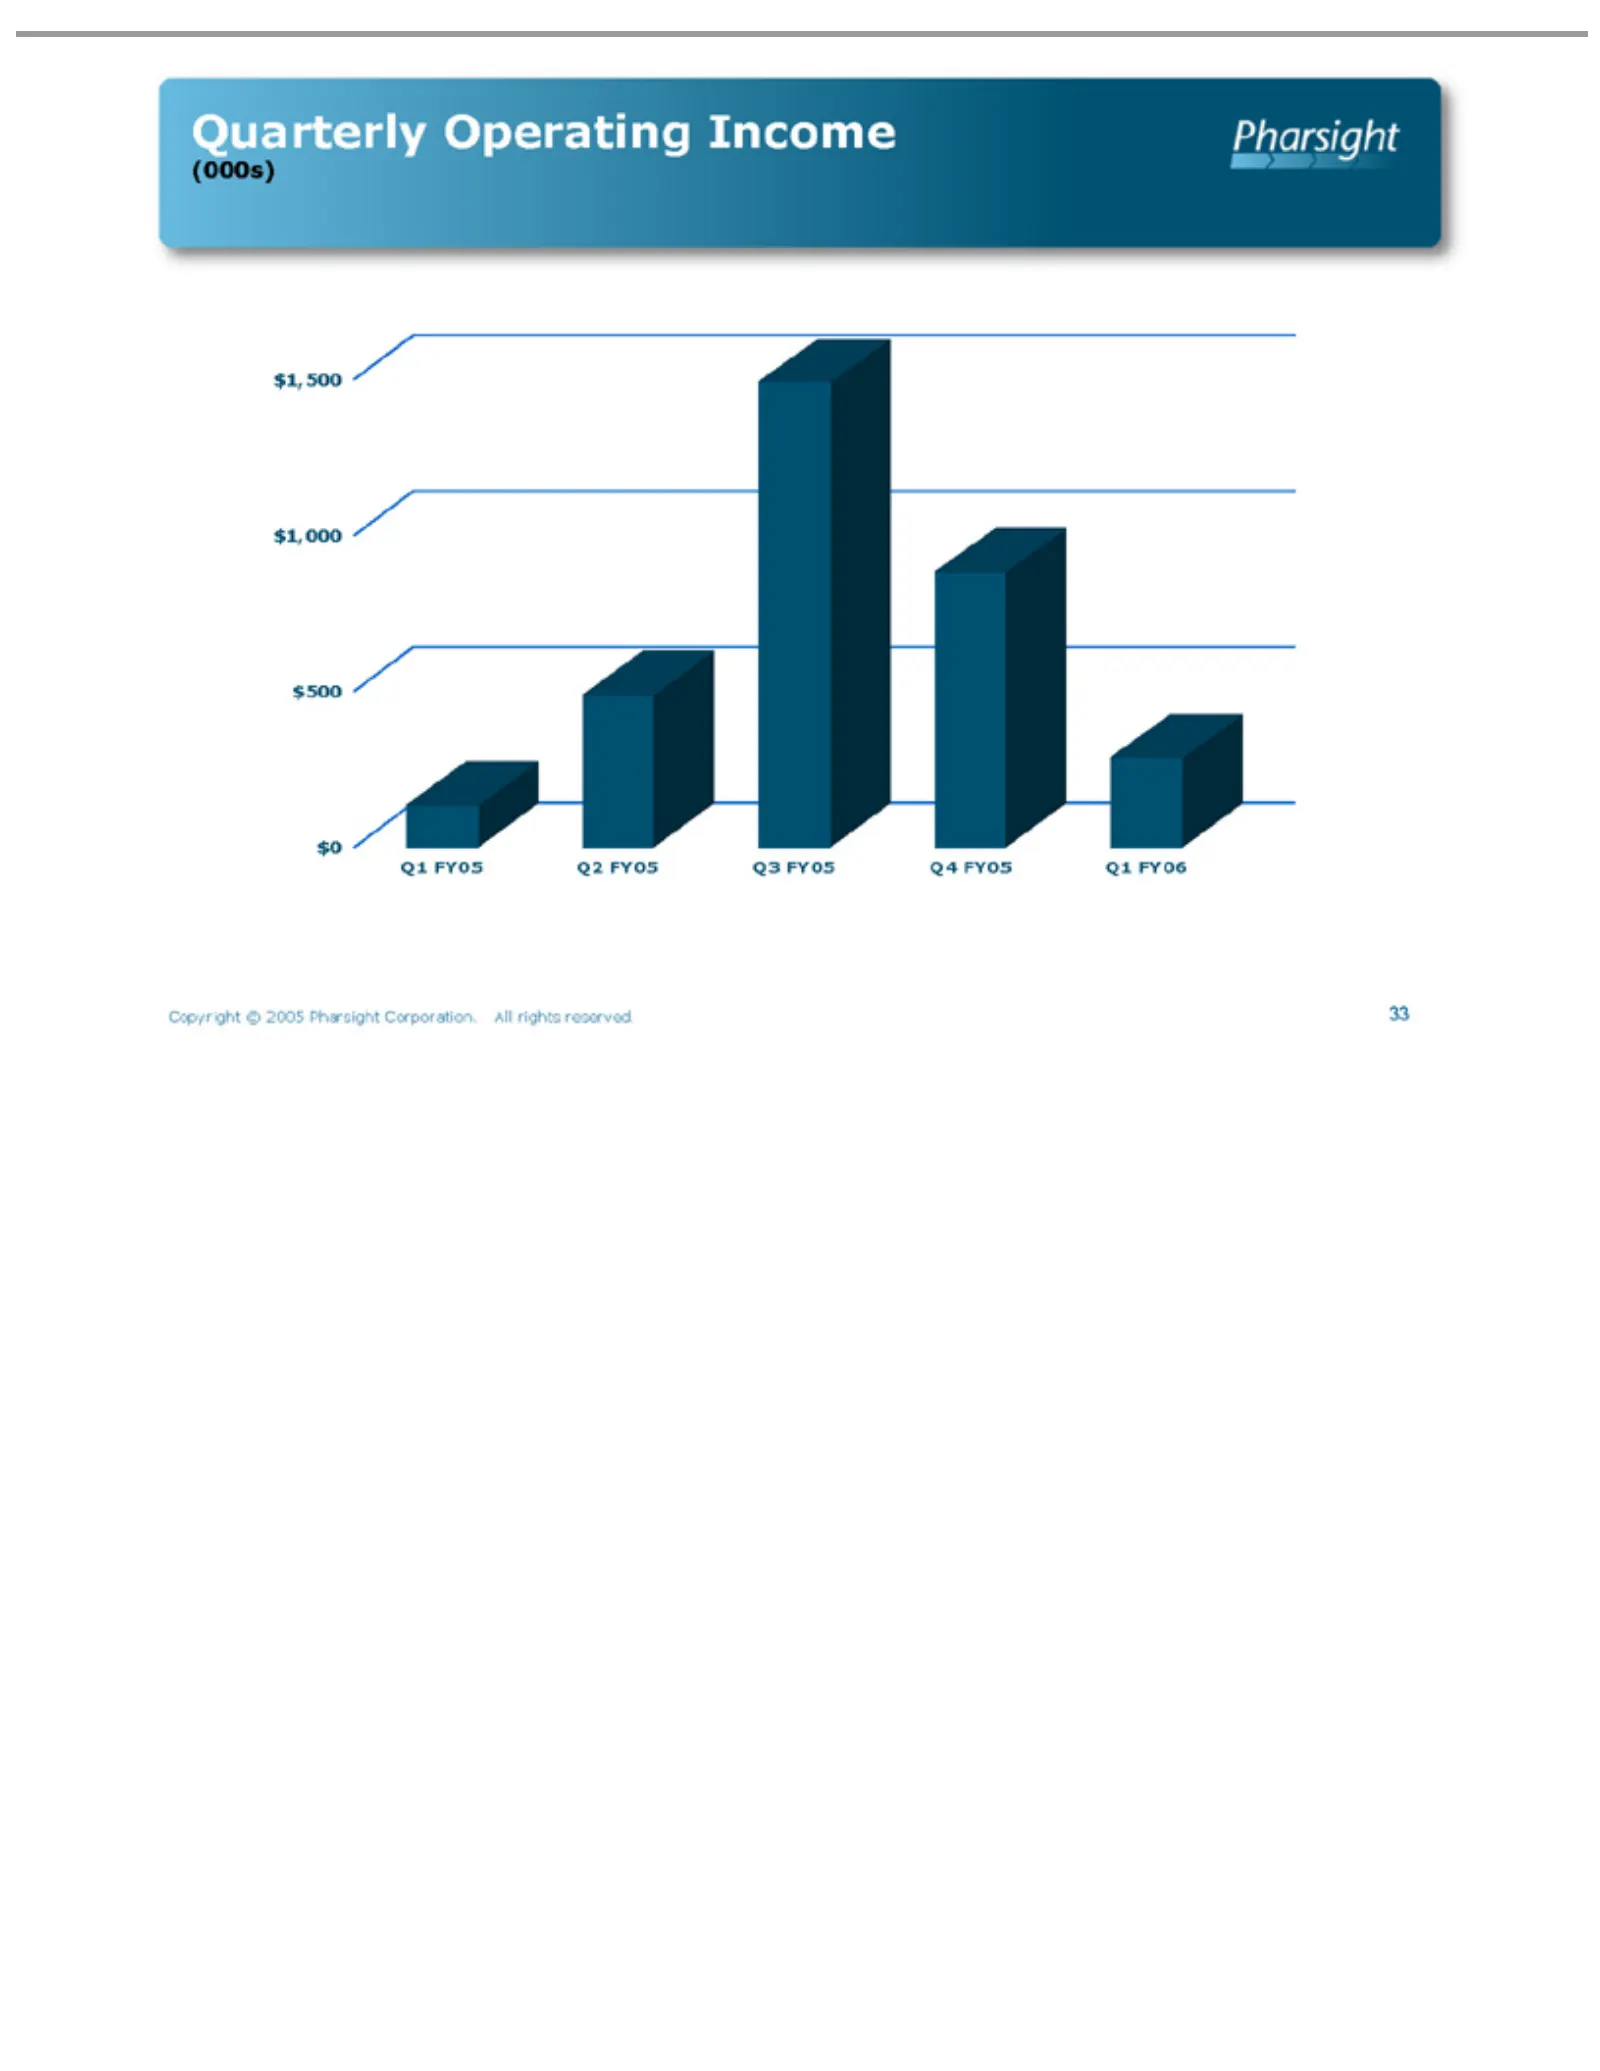
Slide 33: Quarterly Operating Income
Quarterly (000s) Q1 Copyright 33 FY05$1,500 Q2 Operating © 2005 FY05 $1,000 Pharsight Q3 Income $500 FY05 $0Corporation. Q4 FY05 Q1All FY06 rights reserved.
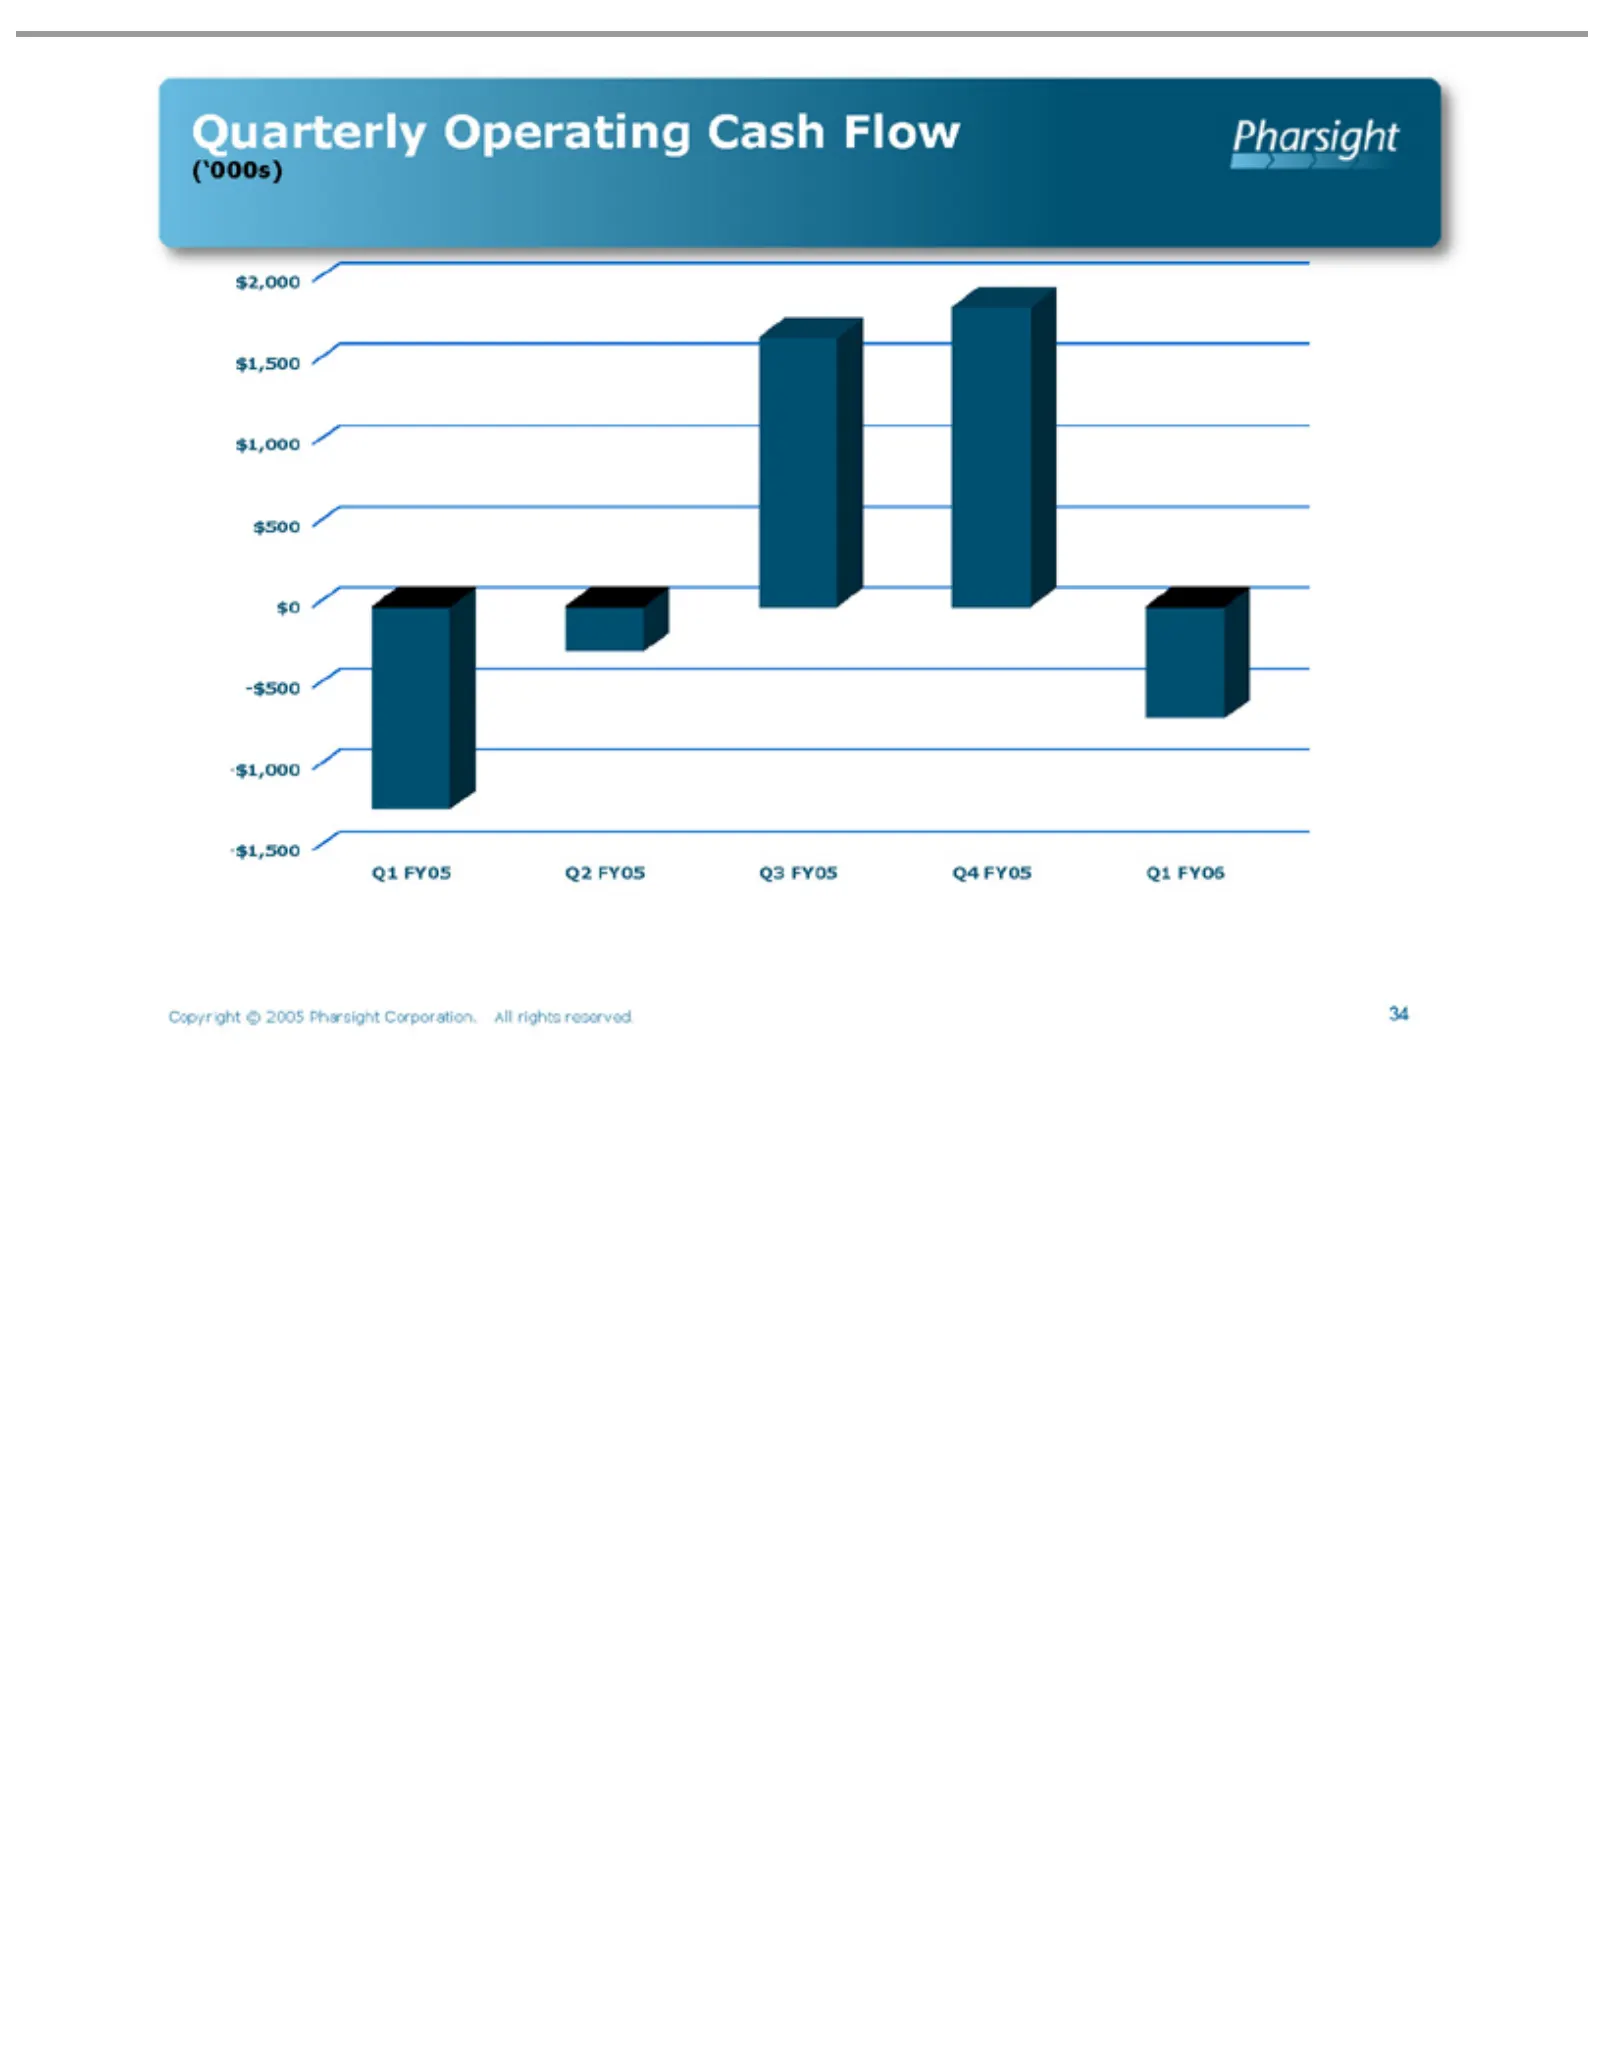
Slide 34: Quarterly Cash Flow
Quarterly (‘000s) -$500 Q1 Copyright 34 FY05 $1,000 $2,000 Q2 Operating © 2005 FY05 $1,500 $1,500 Pharsight Q3 Cash $1,000 FY05 Flow Corporation. Q4 $500 FY05 $0 Q1All FY06 rights reserved.
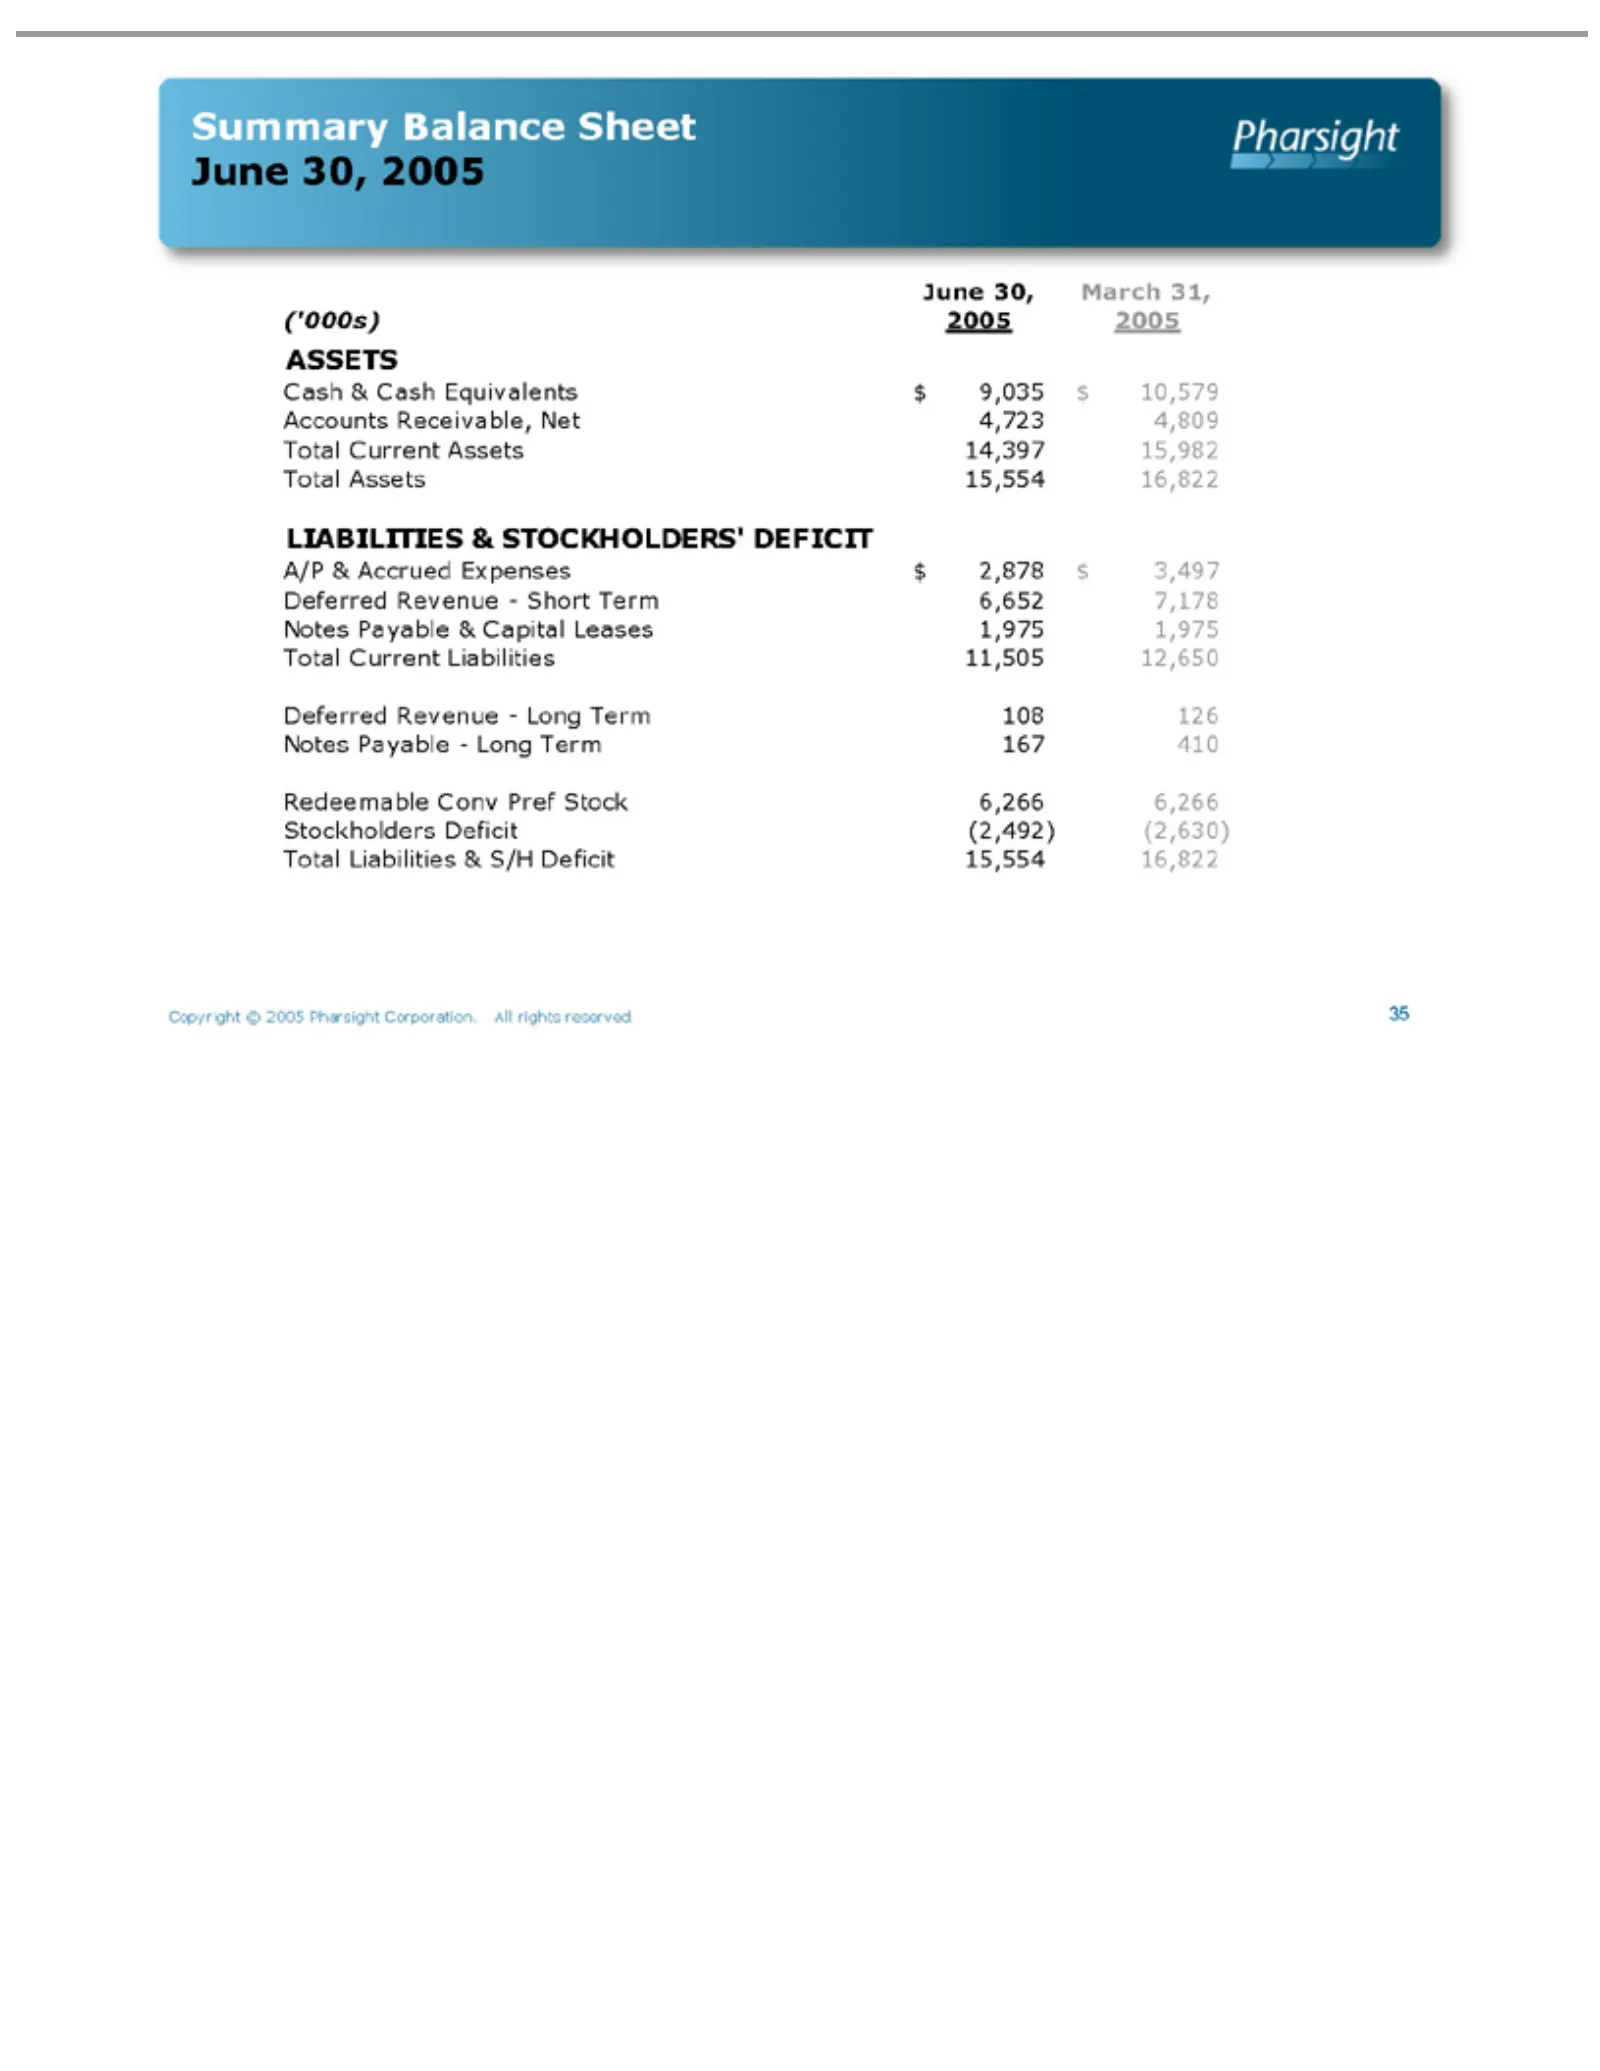
Slide 35: Summary Balance Sheet
Summary (‘000s) Cash ASSETS Accounts LIABILITIES A/P Deferred Notes Redeemable Stockholders Total Copyright 35 &Assets & Current Liabilities Payable Payable—Long Accrued June Cash Revenue—Short Revenue—Long Receivable, Balance © 15,554 Conv 30, 2005 Deficit Equivalents Assets Liabilities &Expenses &
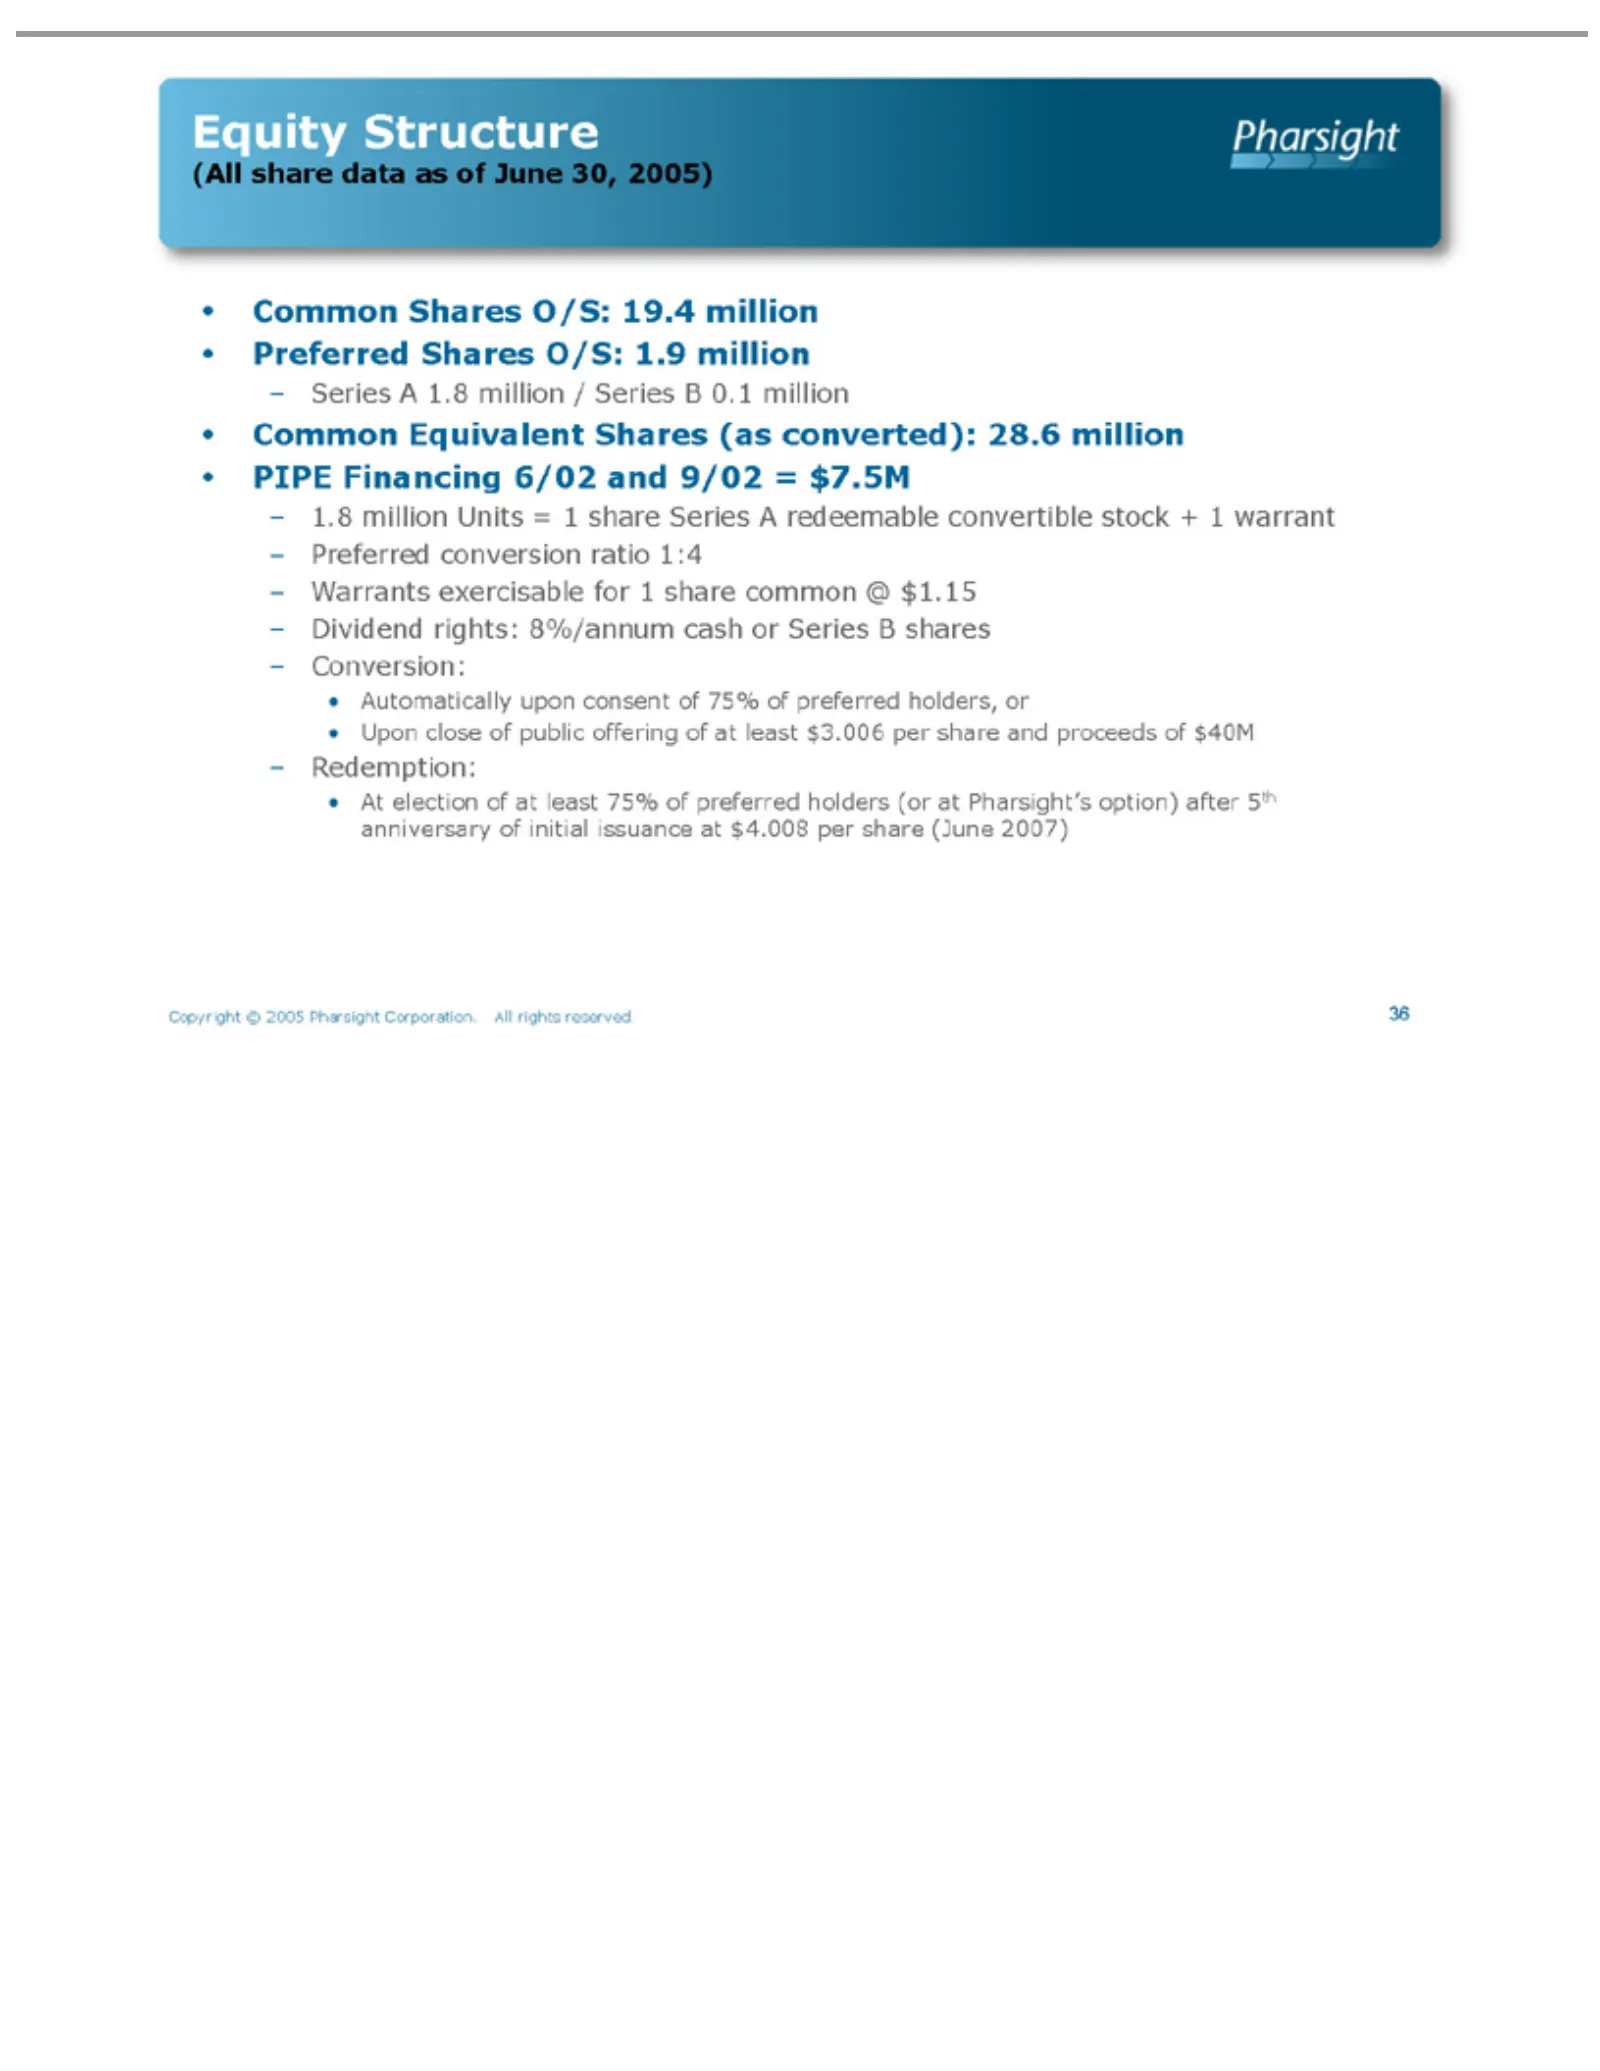
Slide 36: Equity Structure
Equity (All Common •– Copyright 36Automatically At Upon Warrants Series 1.8 Preferred Dividend Conversion: Redemption: election share million Structure close AEquivalent Shares data © 1.8 exercisable conversion rights: of 2005 of Units million as at public upon O/S: of least 8%/annum Pharsight =June
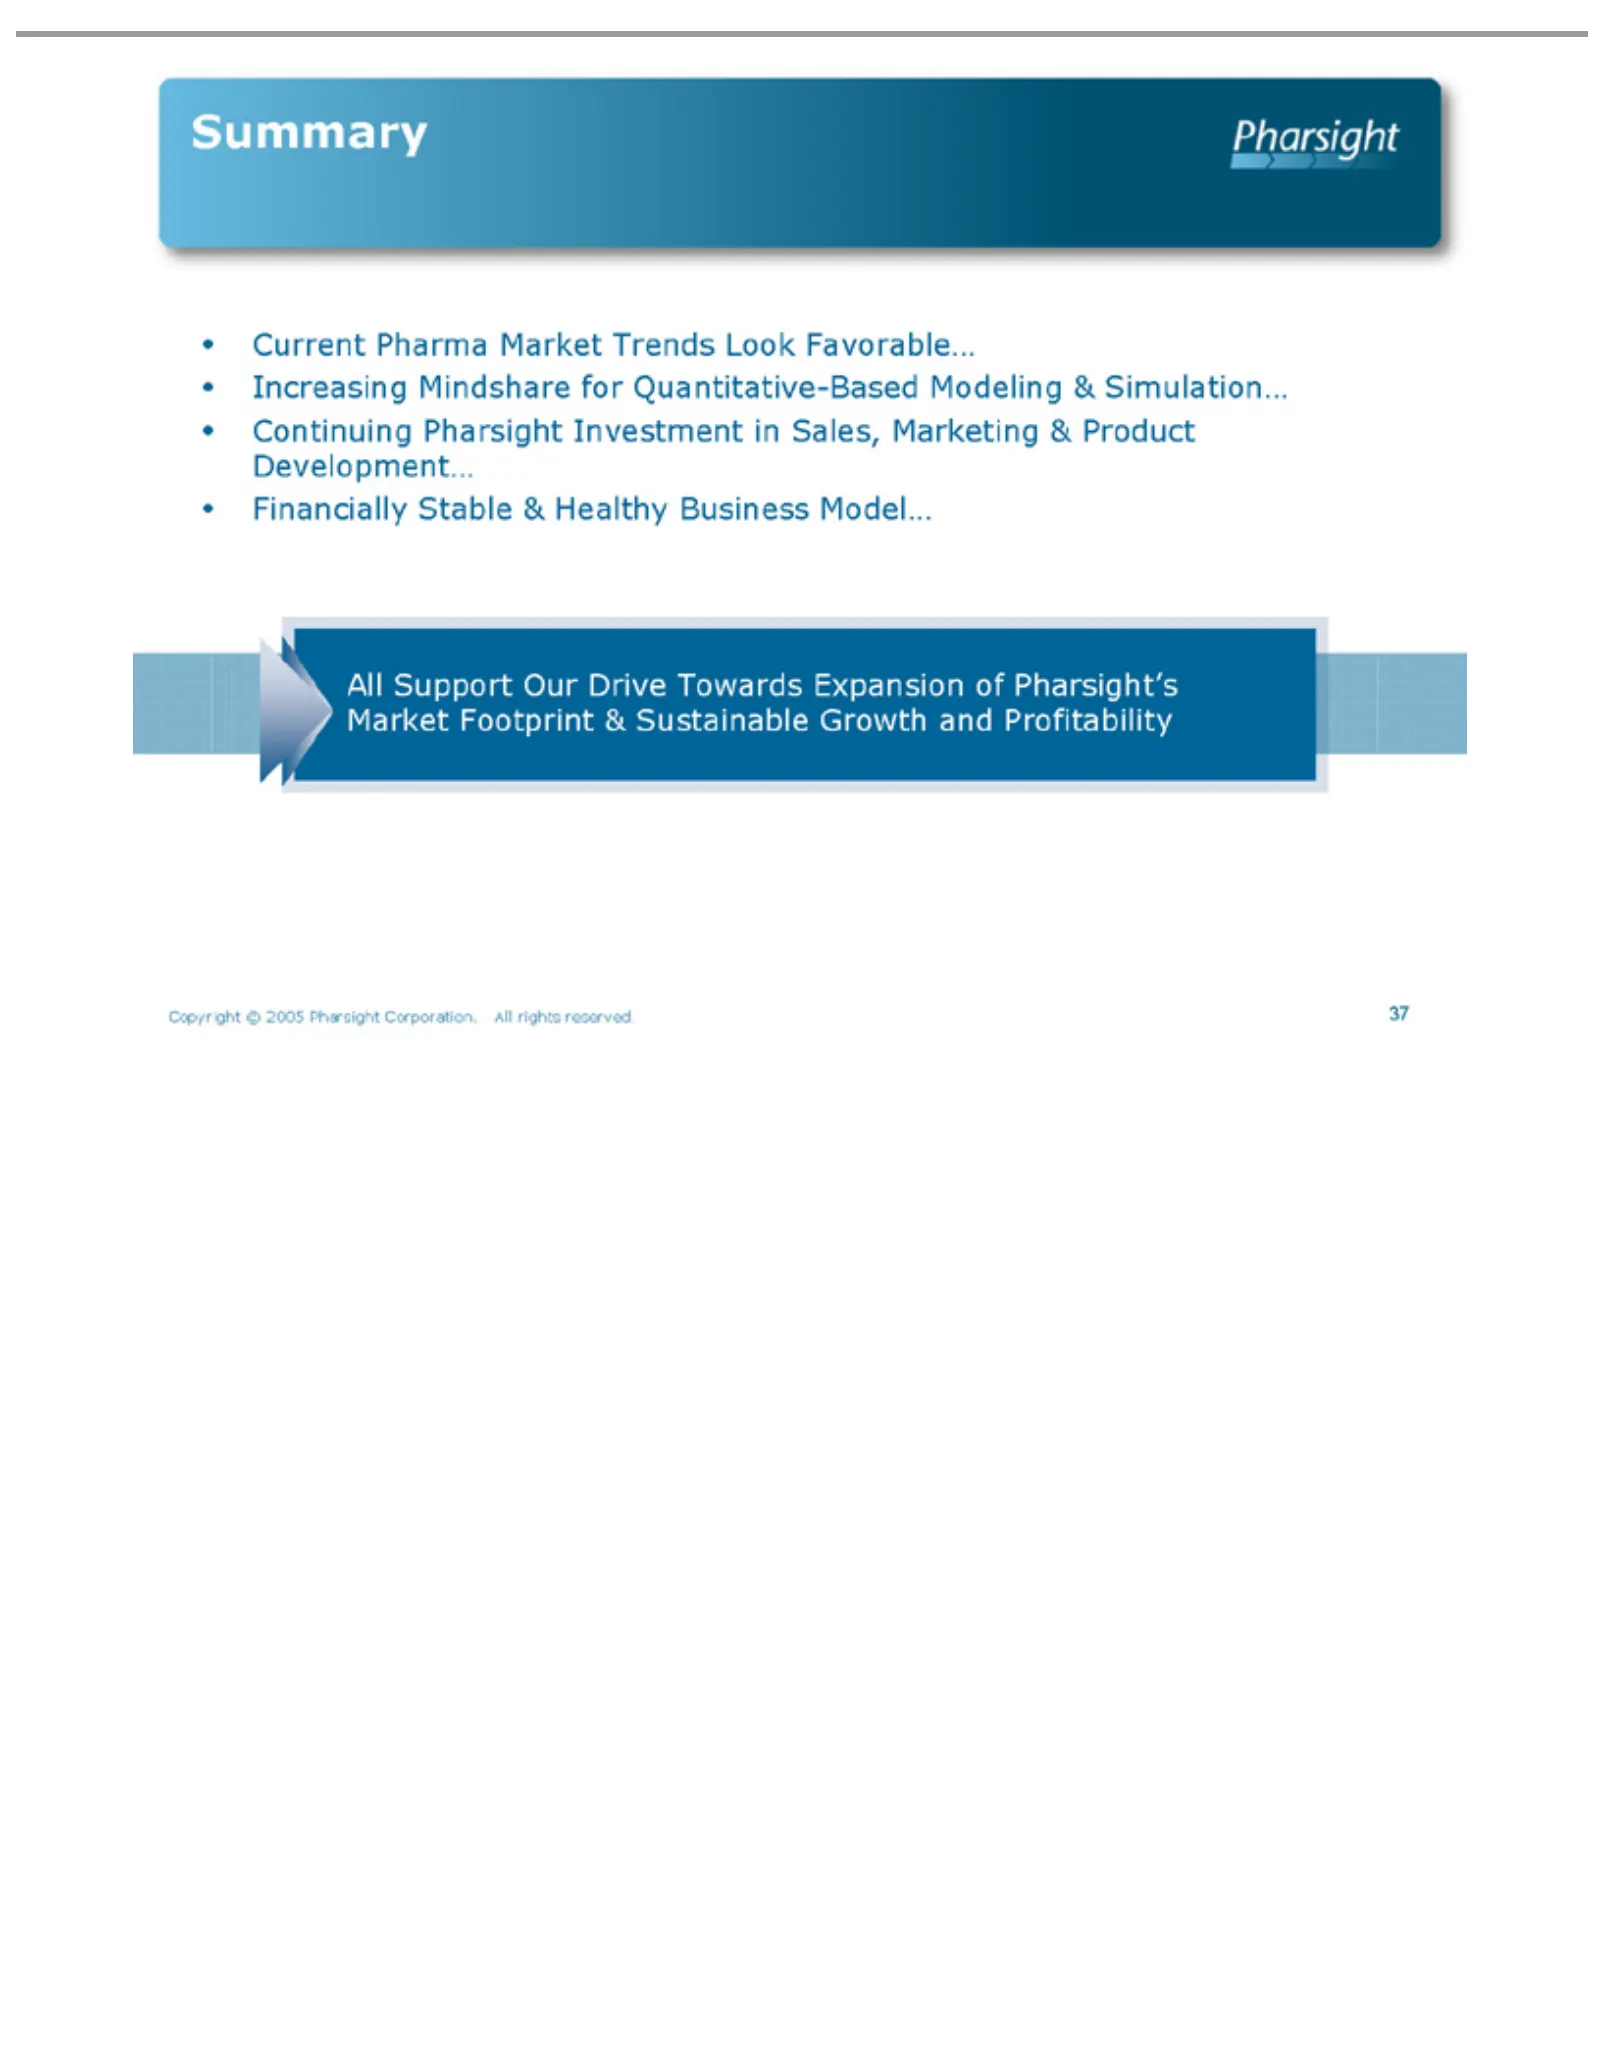
Slide 37: Current Summary
Current Summary Increasing All Model… Copyright 37 Support Pharma © Mindshare Our 2005 Market Drive Pharsight for Towards Trends Quantitative-Based Corporation. Look Expansion Favorable… All of Modeling rights Pharsight’s reserved. &Market Simulation… Footprint Continuing & Sustainable Pharsight Gro
Slide 38: Proprietary Notices
Proprietary Notices No Pharsight Model All Copyright 38 part contents other ExplorerTM, ofbrand Corporation. © this Notice Copyright 2005 document andPharsight product DMXTM, WinNonlin®, ©2005 may names Corporation. be Pharsight Trial reproduced are SimulatorTM?and WinNonMix® trademarks Corporation.

Slide 39: Pharsight
Pharsight
Source: SEC EDGAR · 8-K filed Aug 2, 2005
More decks from Pharsight Corp
 Q4 2007 Earnings Presentation45 slides · May 14, 2007
 Investor Presentation (January 2007)41 slides · Jan 26, 2007
 Q2 2007 Earnings Presentation33 slides · Nov 30, 2006
 Q1 FY2007 Earnings Presentation37 slides · Aug 3, 2006
 Investor Presentation (June 2006)36 slides · Jun 6, 2006
 Investor Presentation (February 2006)31 slides · Feb 2, 2006