Pharsight — Investor Presentation (June 2006)
36 slides from Pharsight's investor presentation, Jun 6, 2006
Slide 1: Pharsight Corporation Investor Presentation
Exhibit 99.1 Pharsight Corporation Investor Presentation June 2006 Shawn O’Connor President, Chairman and CEO Will Frederick CFO Confidential © Pharsight Corporation
Slide 2: Forward-Looking Statements
Forward-Looking Statements This presentation includes forward-looking statements, including statements regarding our financial model, growth opportunities and strategic investments, our market position, the demand and market opportunity for our products and services, financial and product performanc
Slide 3: Overview
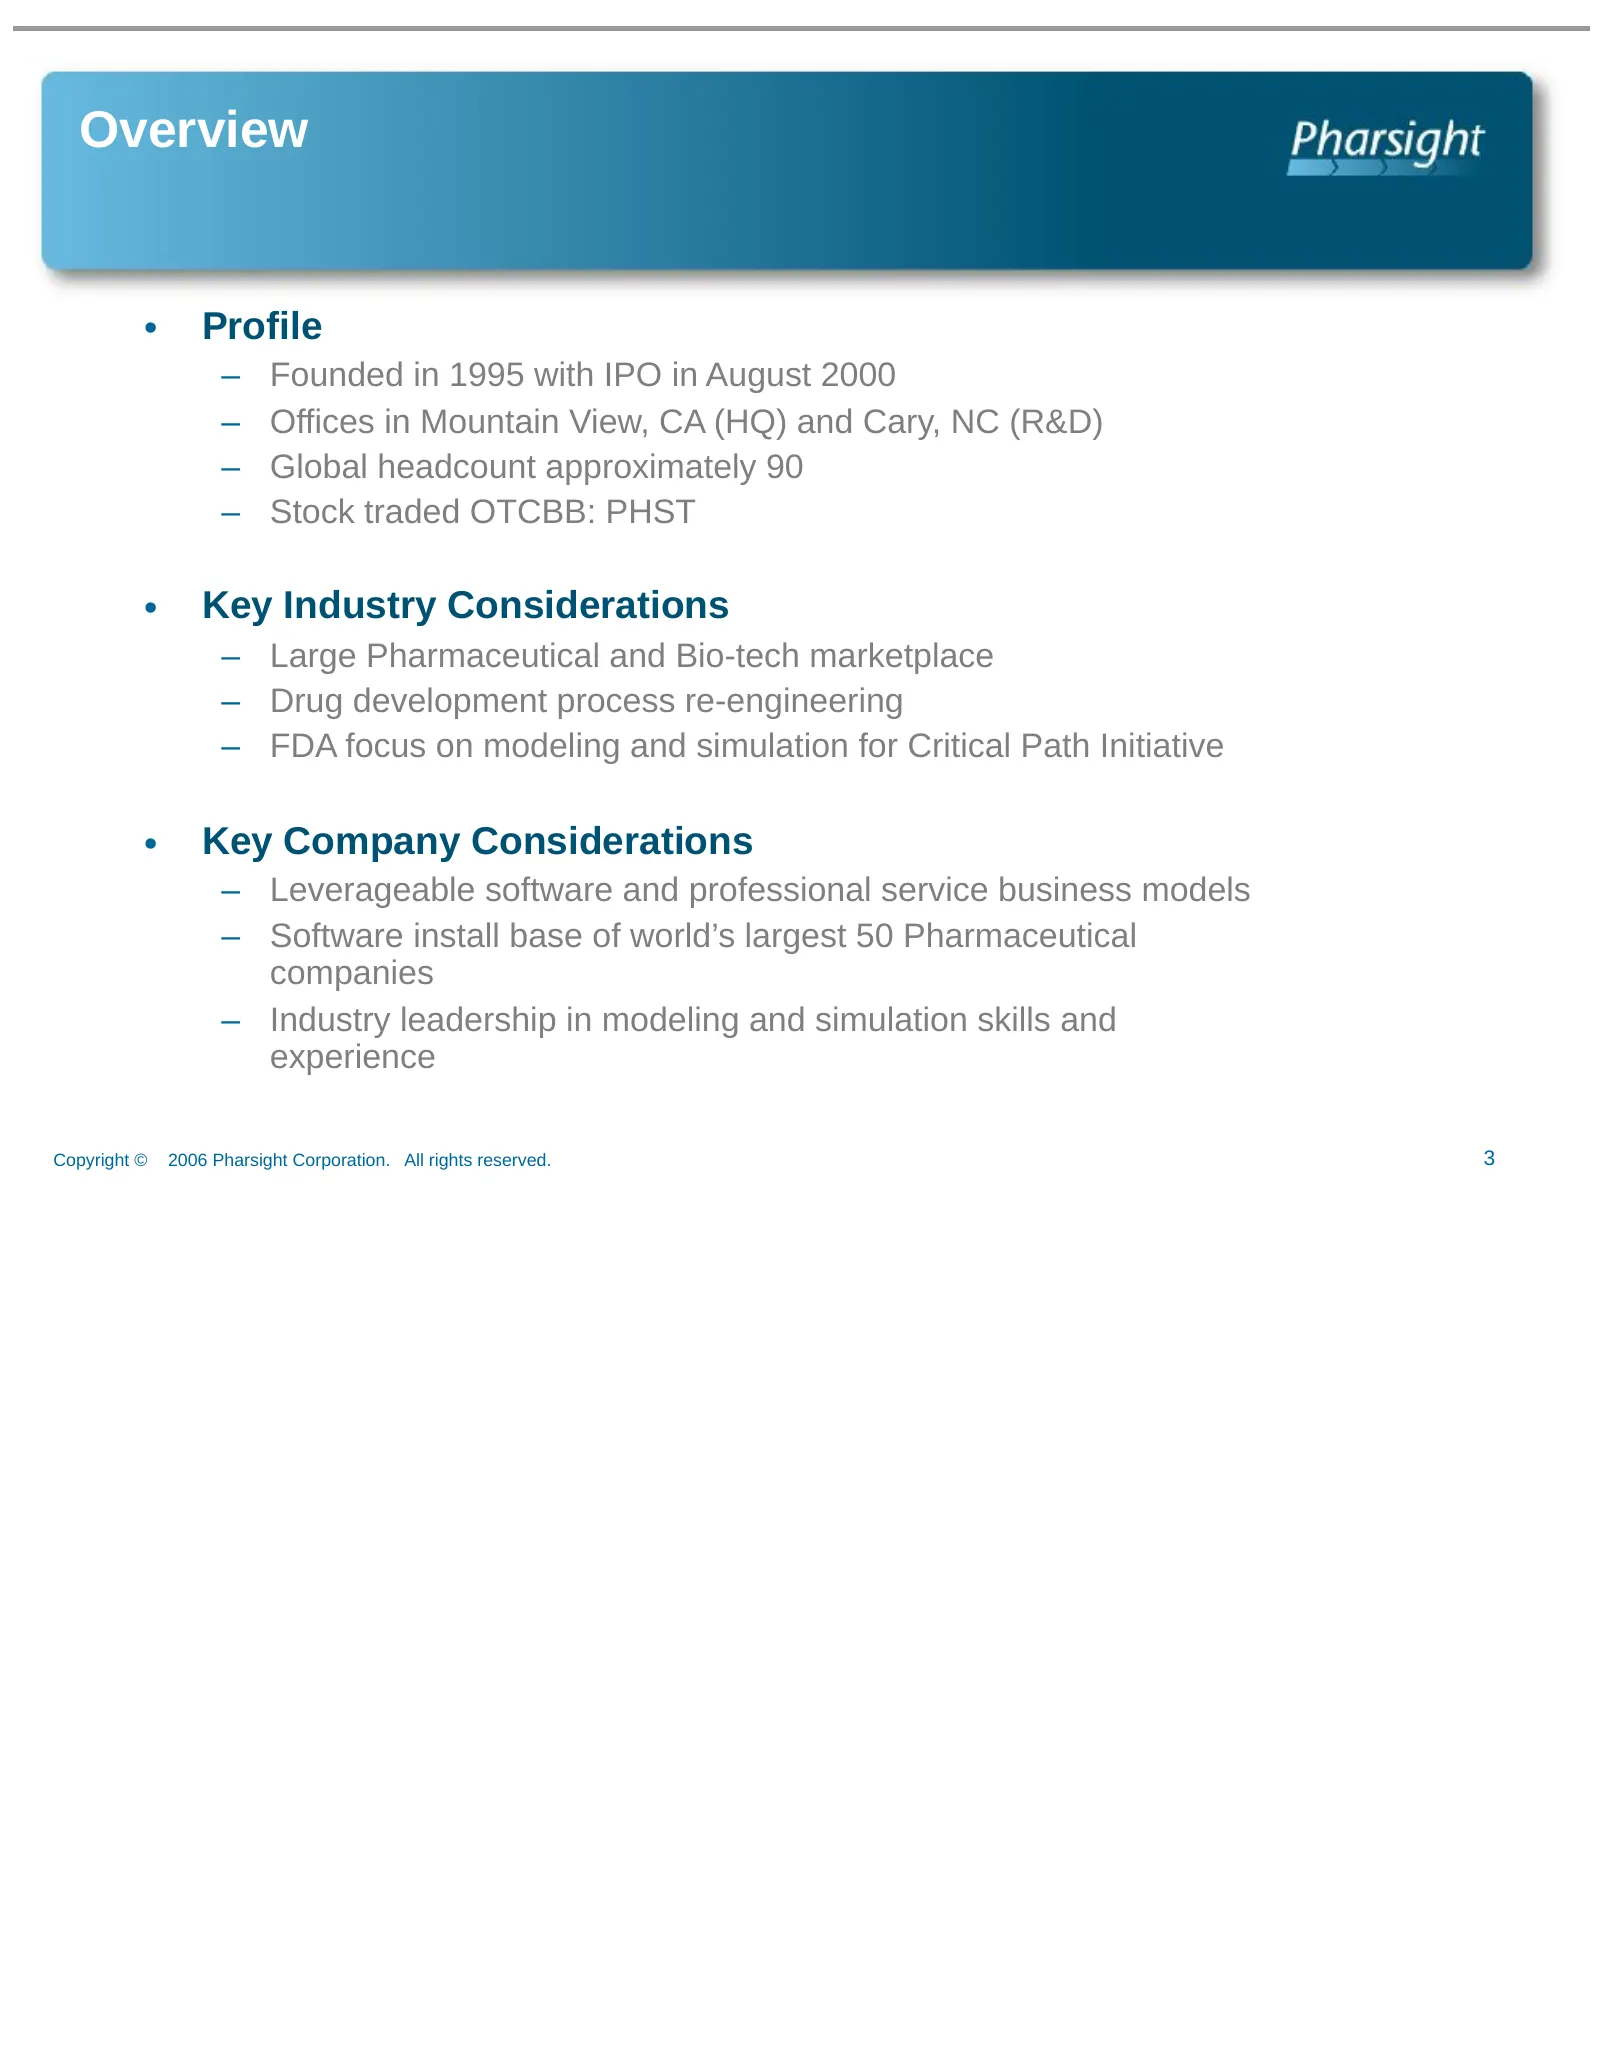
Overview • Profile – Founded in 1995 with IPO in August 2000 – Offices in Mountain View, CA (HQ) and Cary, NC (R&D) – Global headcount approximately 90 – Stock traded OTCBB: PHST • Key Industry Considerations – Large Pharmaceutical and Bio-tech marketplace – Drug development process re-engineering –
Slide 4: Pharsight Enables Strategic Decision Making in Clinical Drug Development
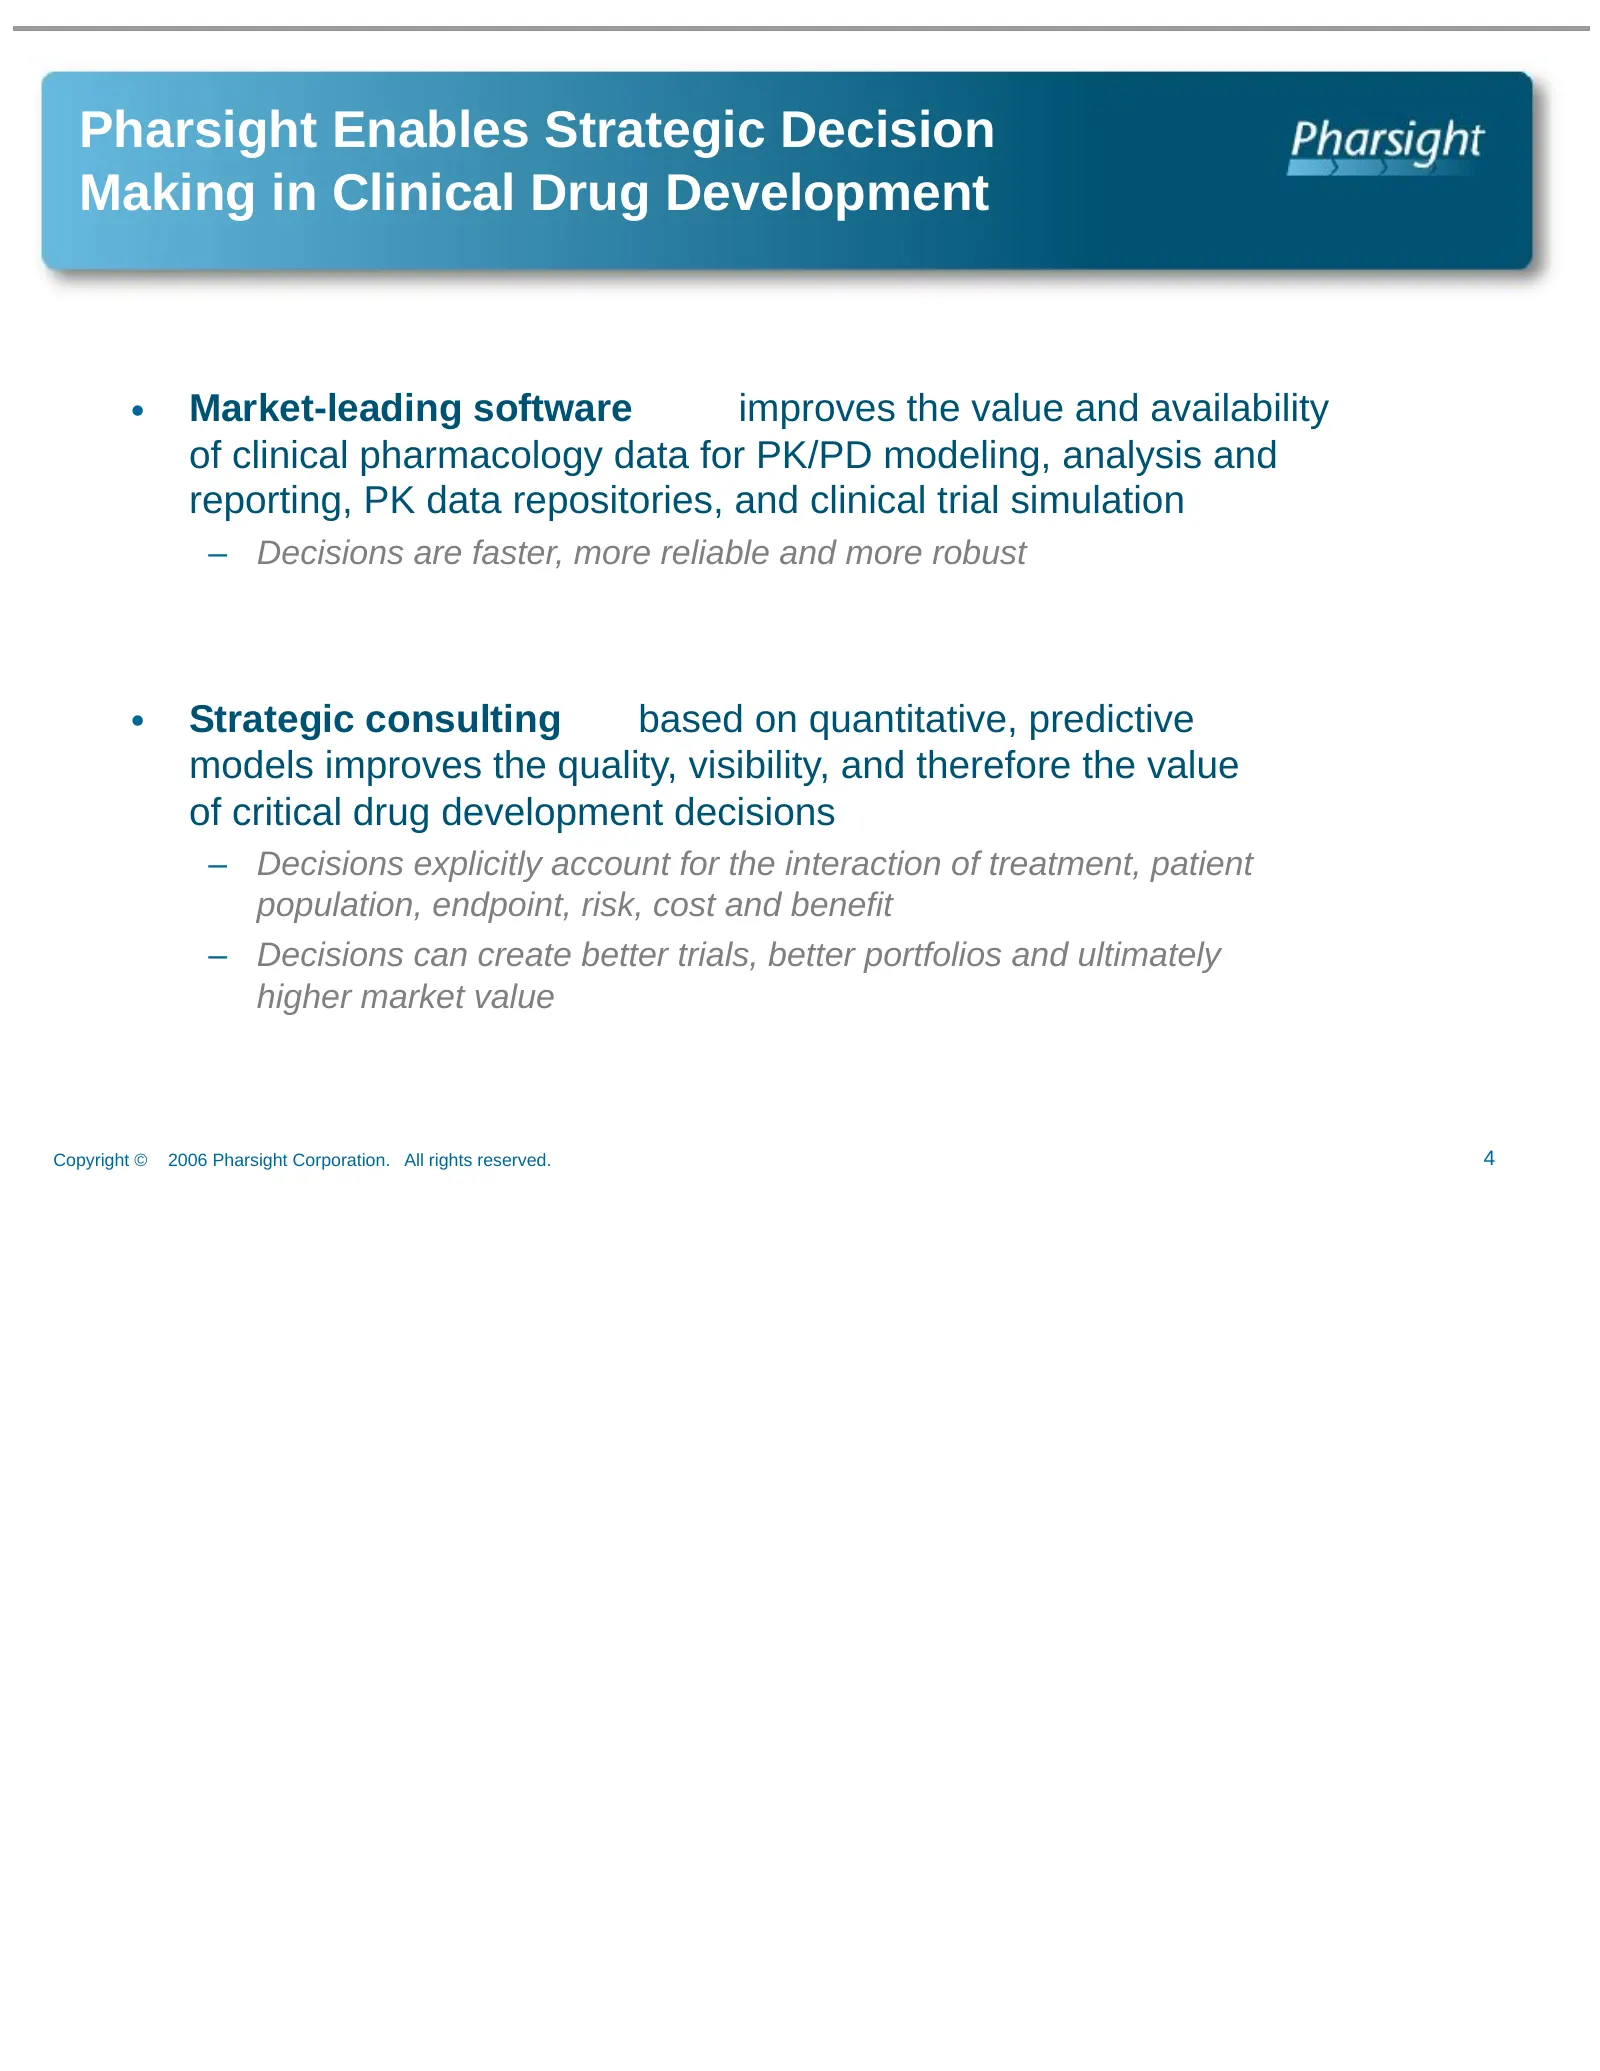
Pharsight Enables Strategic Decision Making in Clinical Drug Development • Market-leading software improves the value and availability of clinical pharmacology data for PK/PD modeling, analysis and reporting, PK data repositories, and clinical trial simulation – Decisions are faster, more reliable a
Slide 5: Management Team
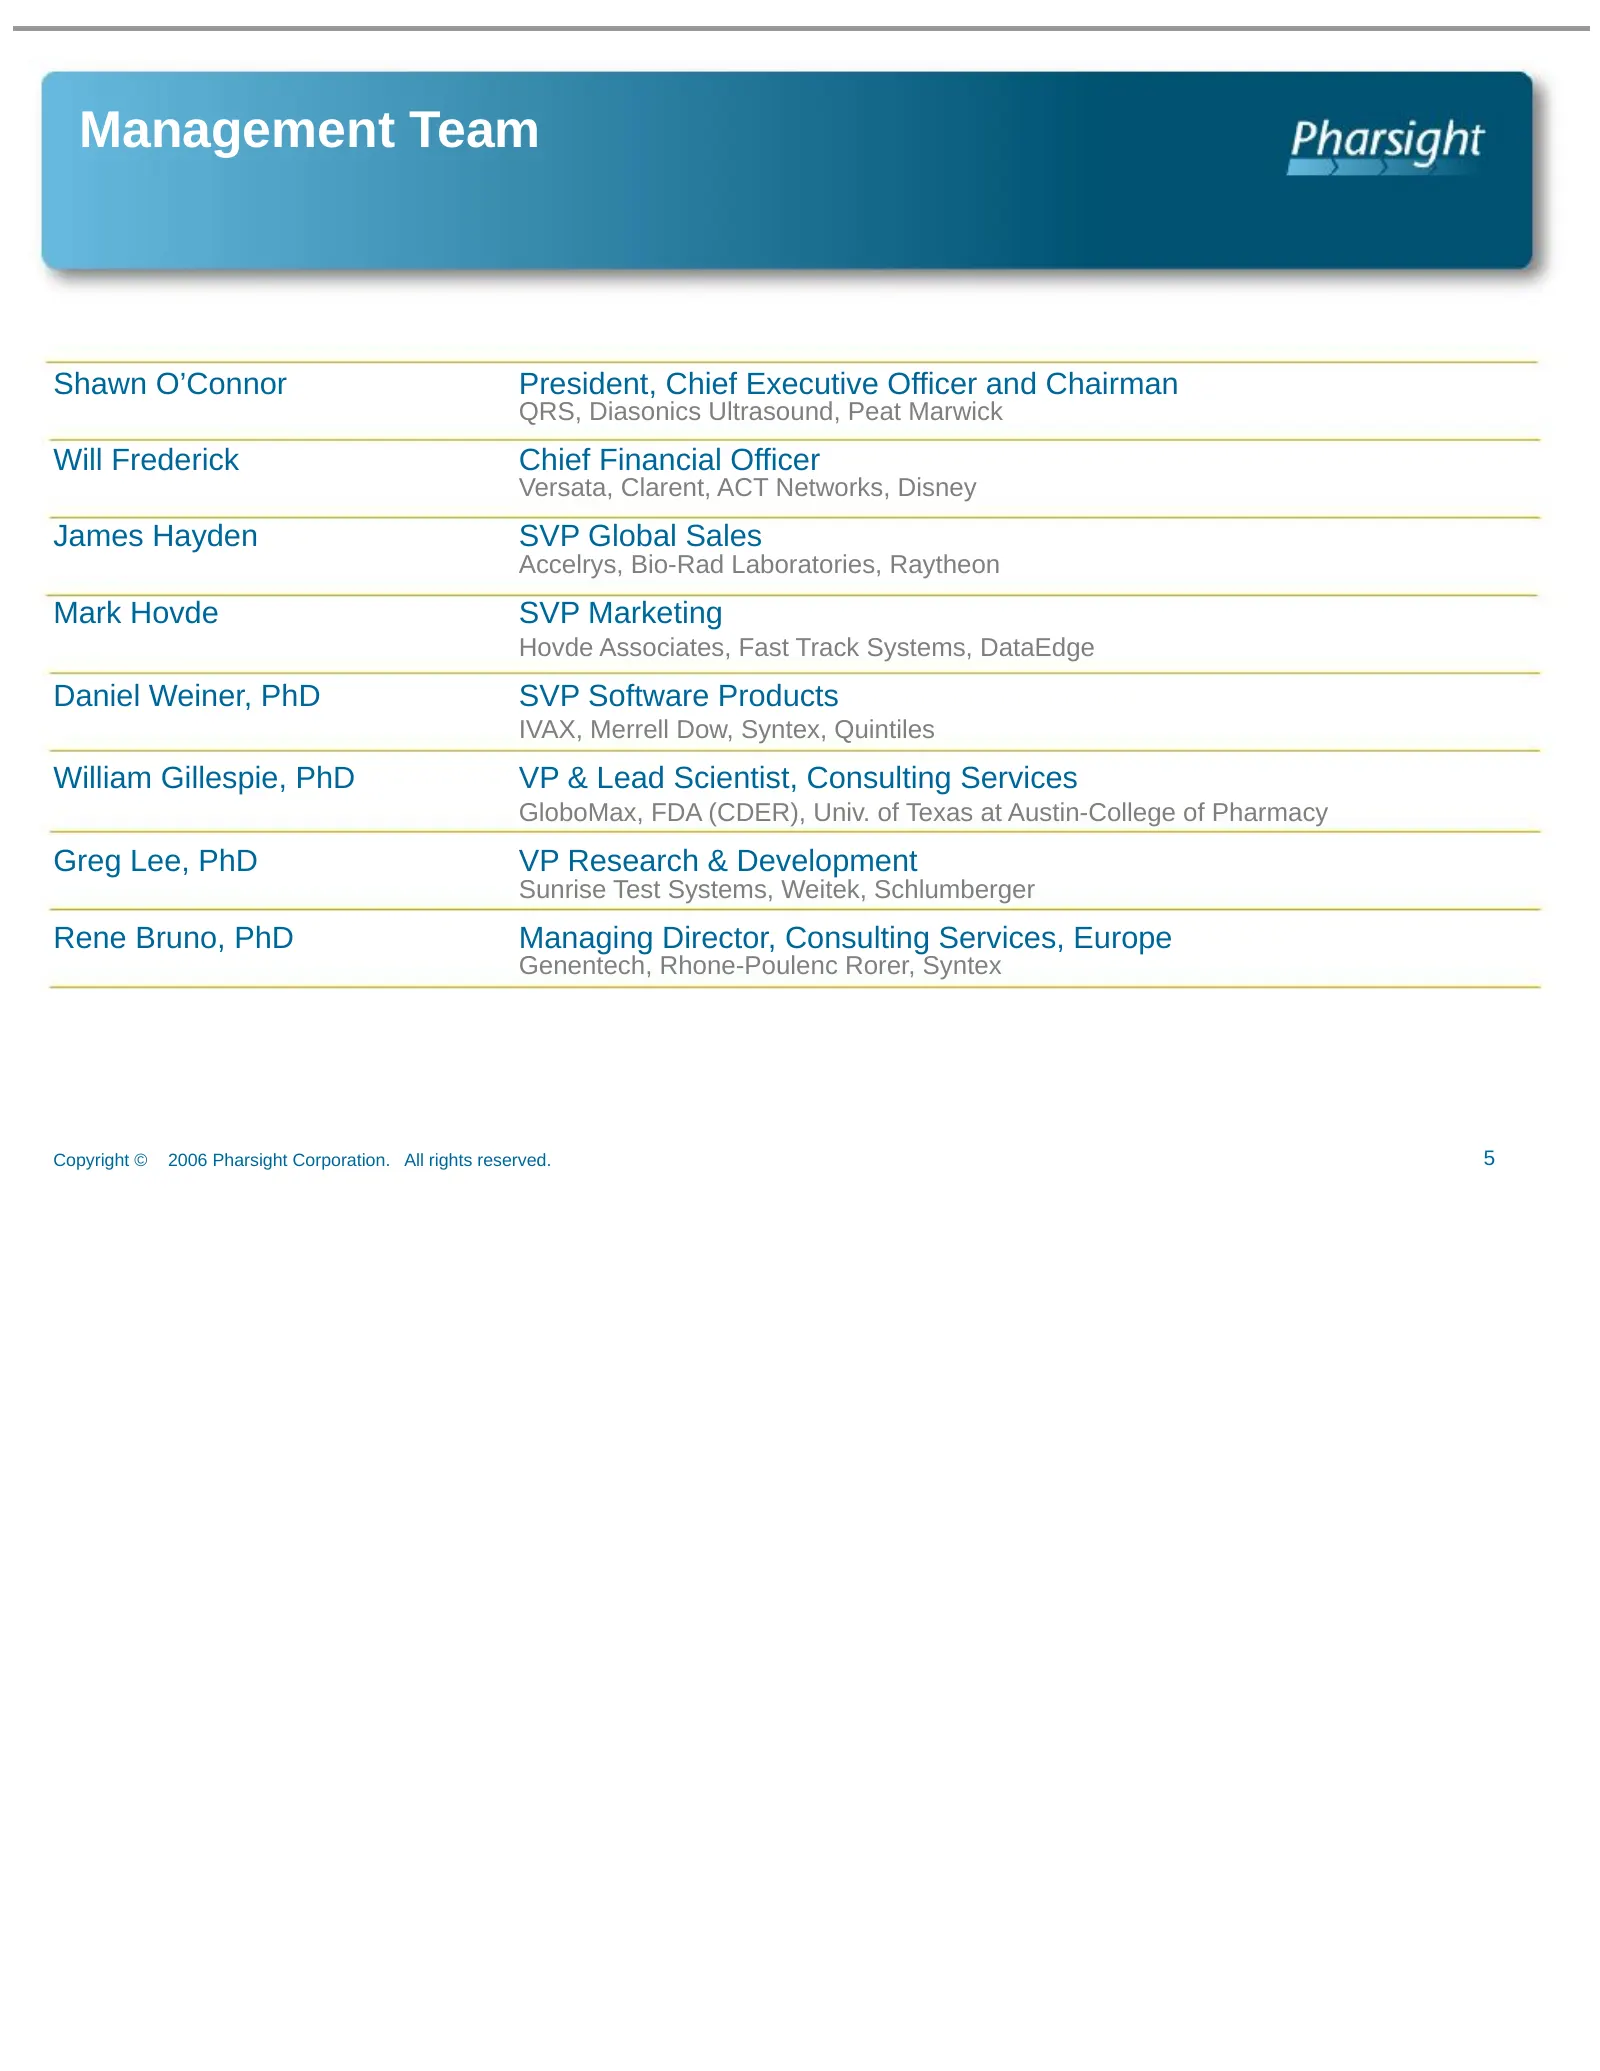
Management Team Shawn O’Connor President, Chief Executive Officer and Chairman QRS, Diasonics Ultrasound, Peat Marwick Will Frederick Chief Financial Officer Versata, Clarent, ACT Networks, Disney James Hayden SVP Global Sales Accelrys, Bio-Rad Laboratories, Raytheon Mark Hovde SVP Marketing Hovde A
Slide 6: Market Opportunity: Drug Development Cost and Timeline
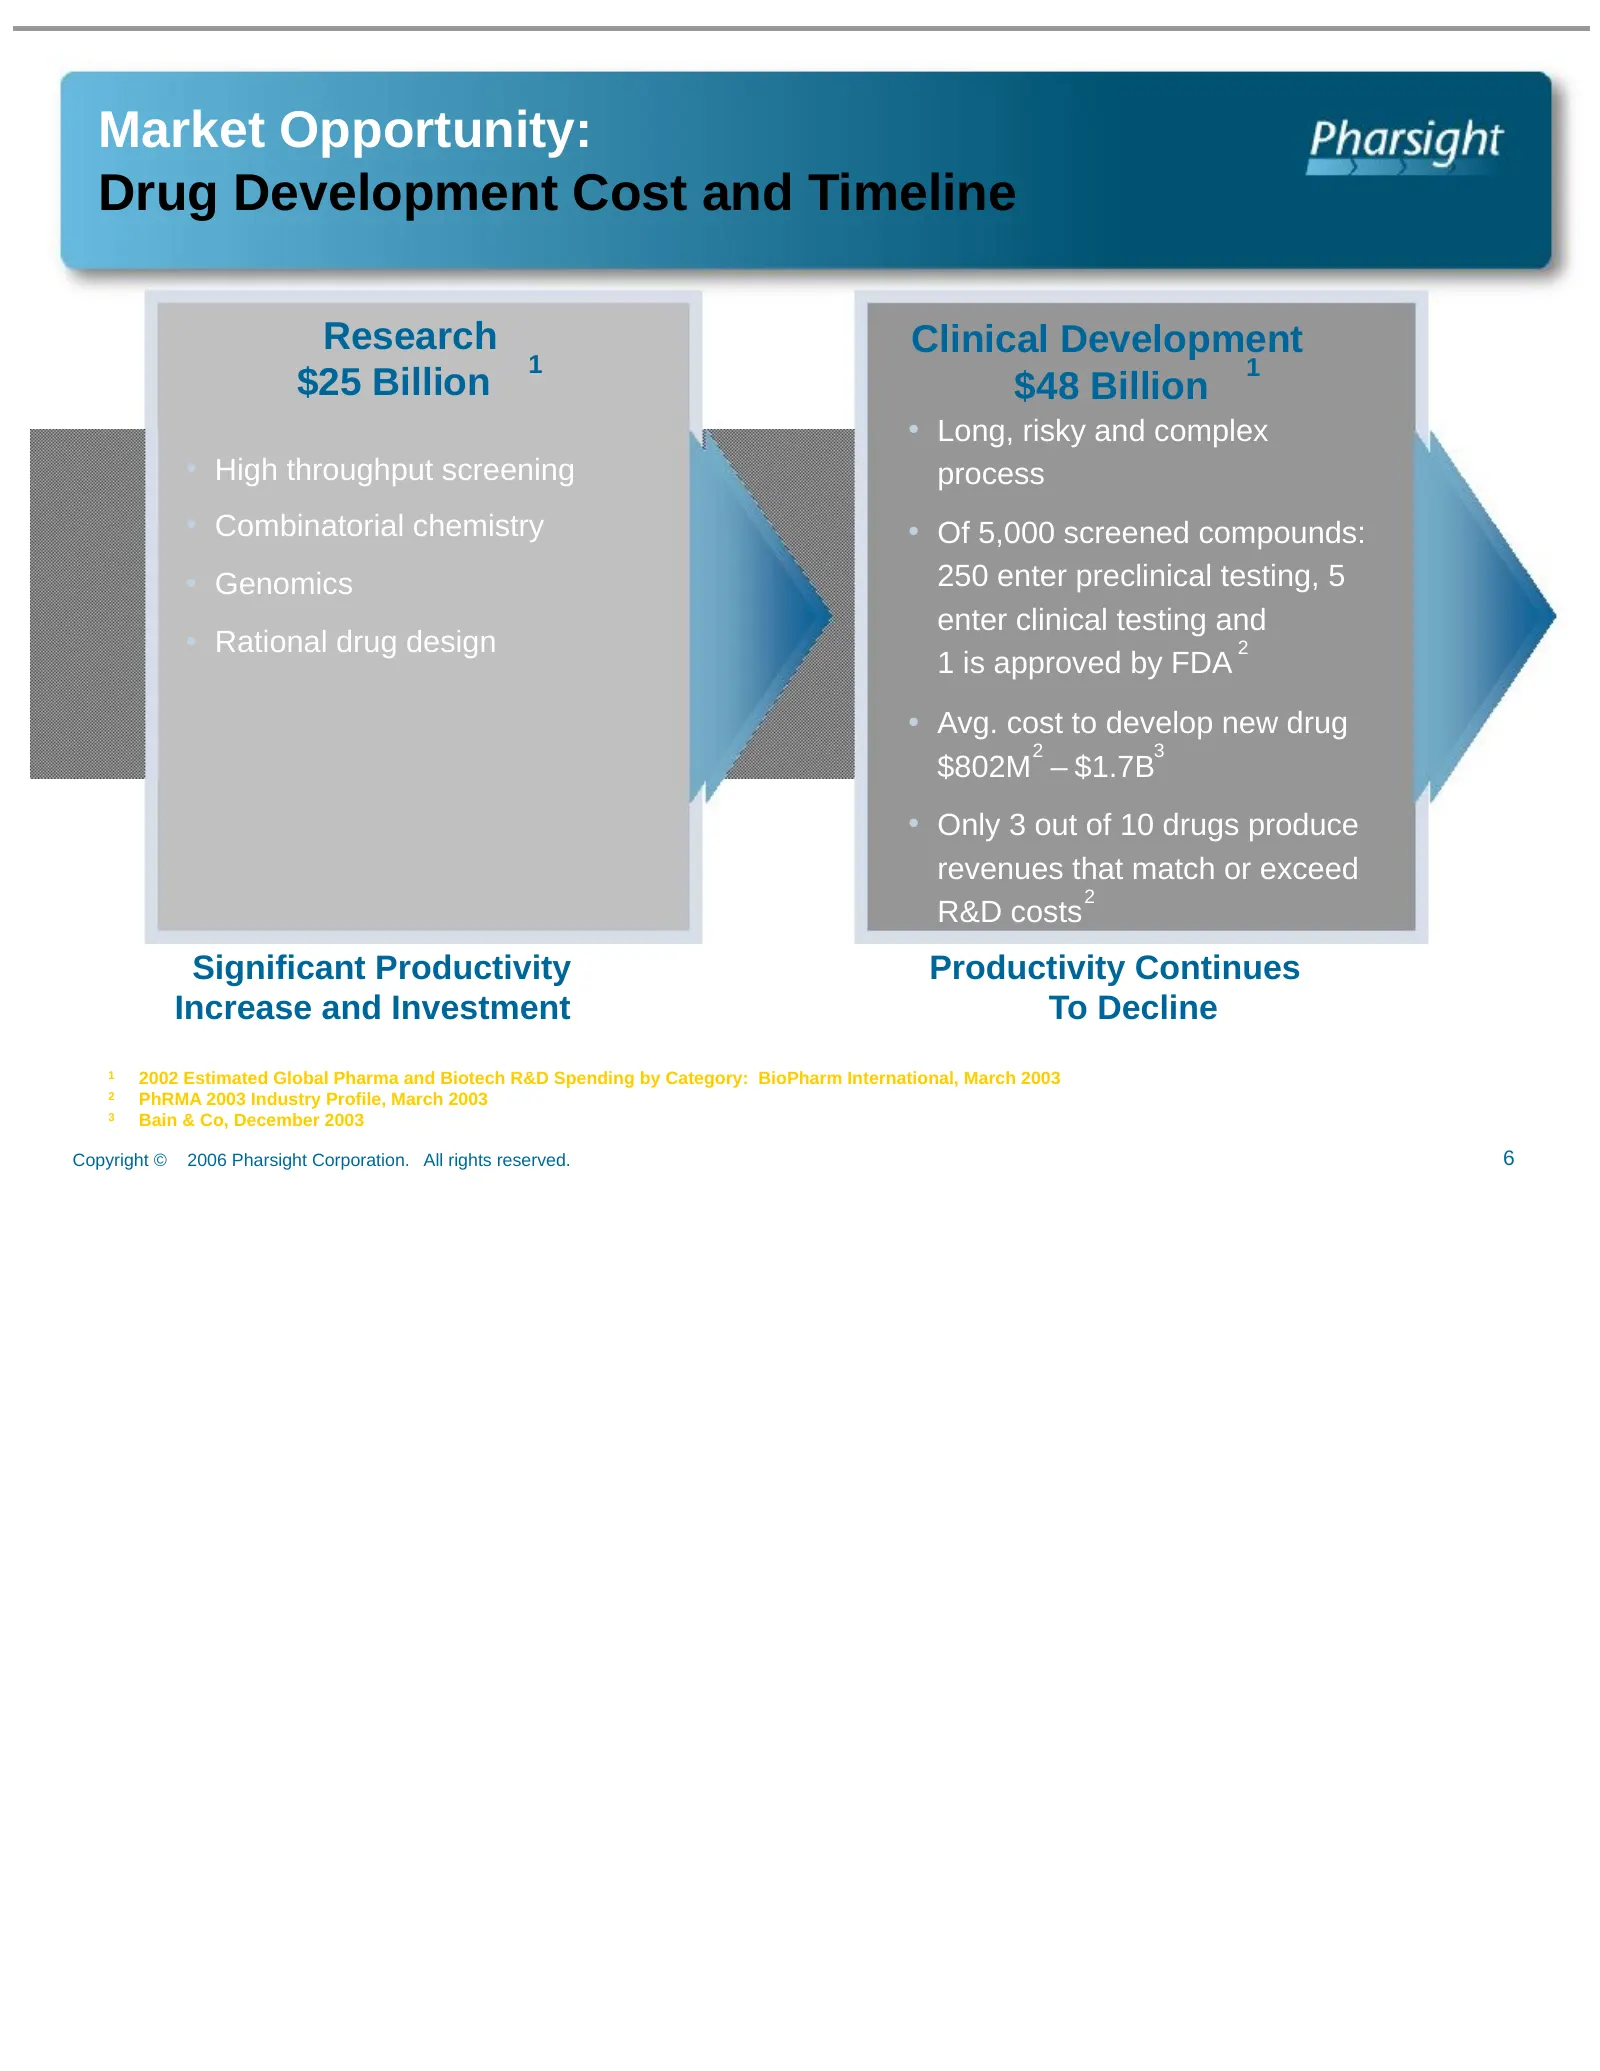
Market Opportunity: Drug Development Cost and Timeline Research Clinical Development 1 1 $25 Billion $48 Billion • Long, risky and complex • High throughput screening process • Combinatorial chemistry • Of 5,000 screened compounds: • Genomics 250 enter preclinical testing, 5 enter clinical testing a
Slide 7: Market Opportunity: Development Expenditure Estimates
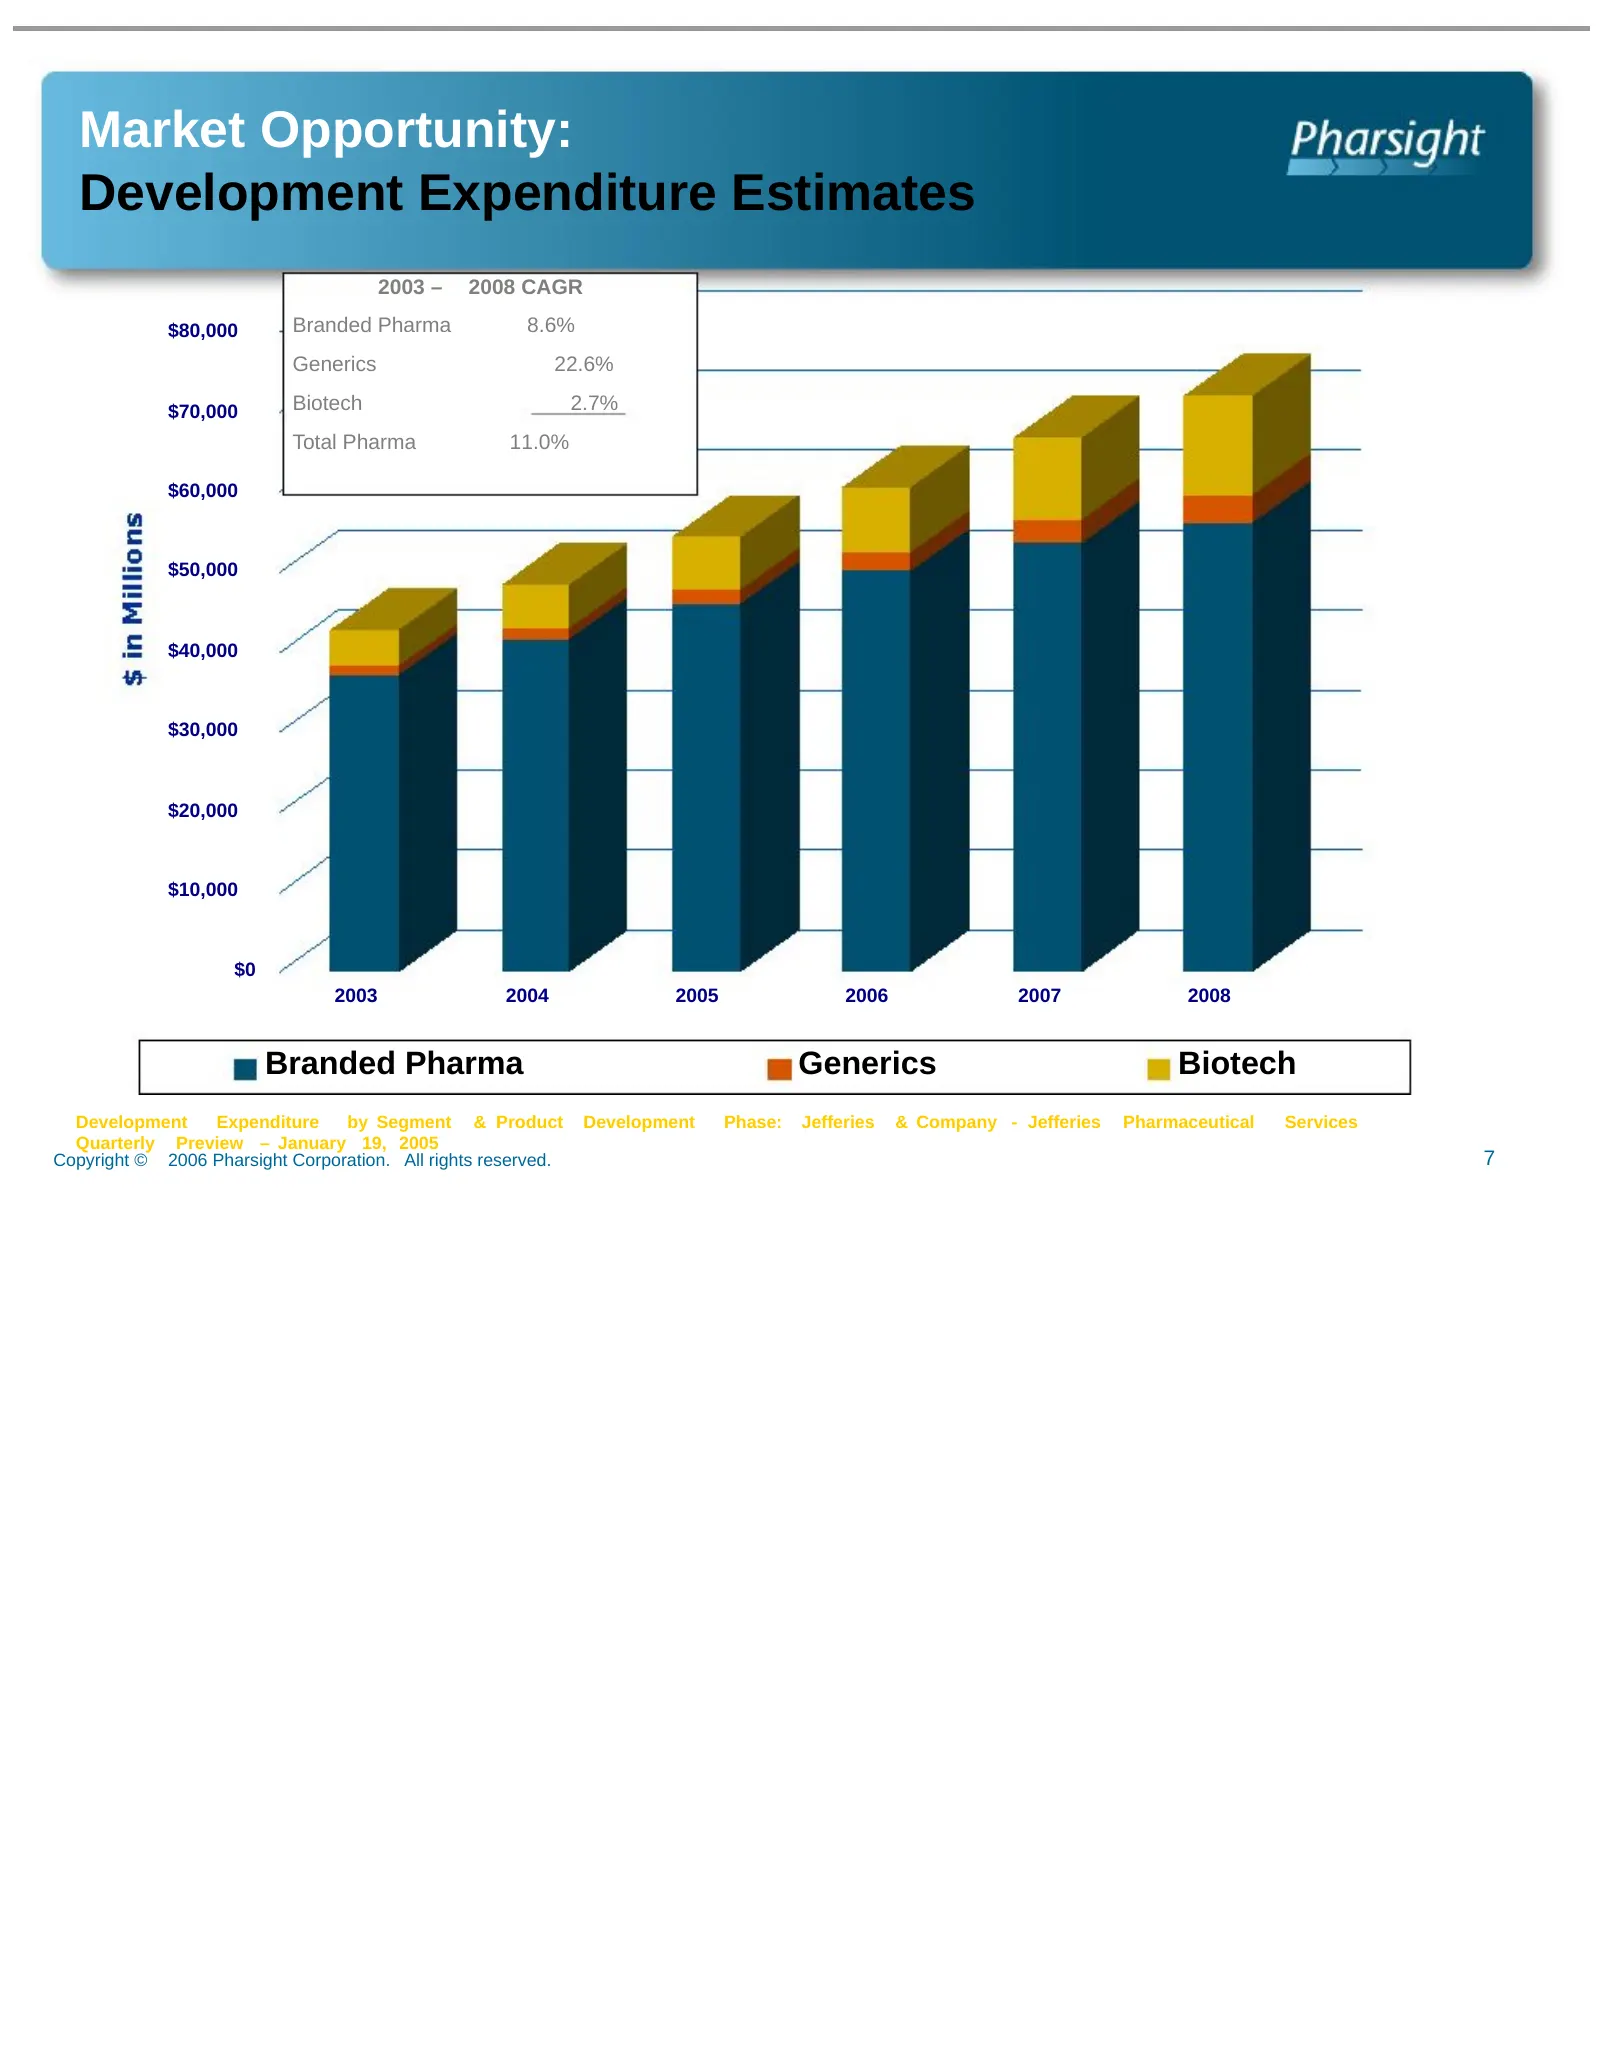
Market Opportunity: Development Expenditure Estimates 2003 – 2008 CAGR $80,000 Branded Pharma 8.6% Generics 22.6% $70,000 Biotech 2.7% Total Pharma 11.0% $60,000 $50,000 $40,000 $30,000 $20,000 $10,000 $0 2003 2004 2005 2006 2007 2008 Branded Pharma Generics Biotech Development Expenditure by Segmen
Slide 8: Market Opportunity: Understanding PK/PD Data
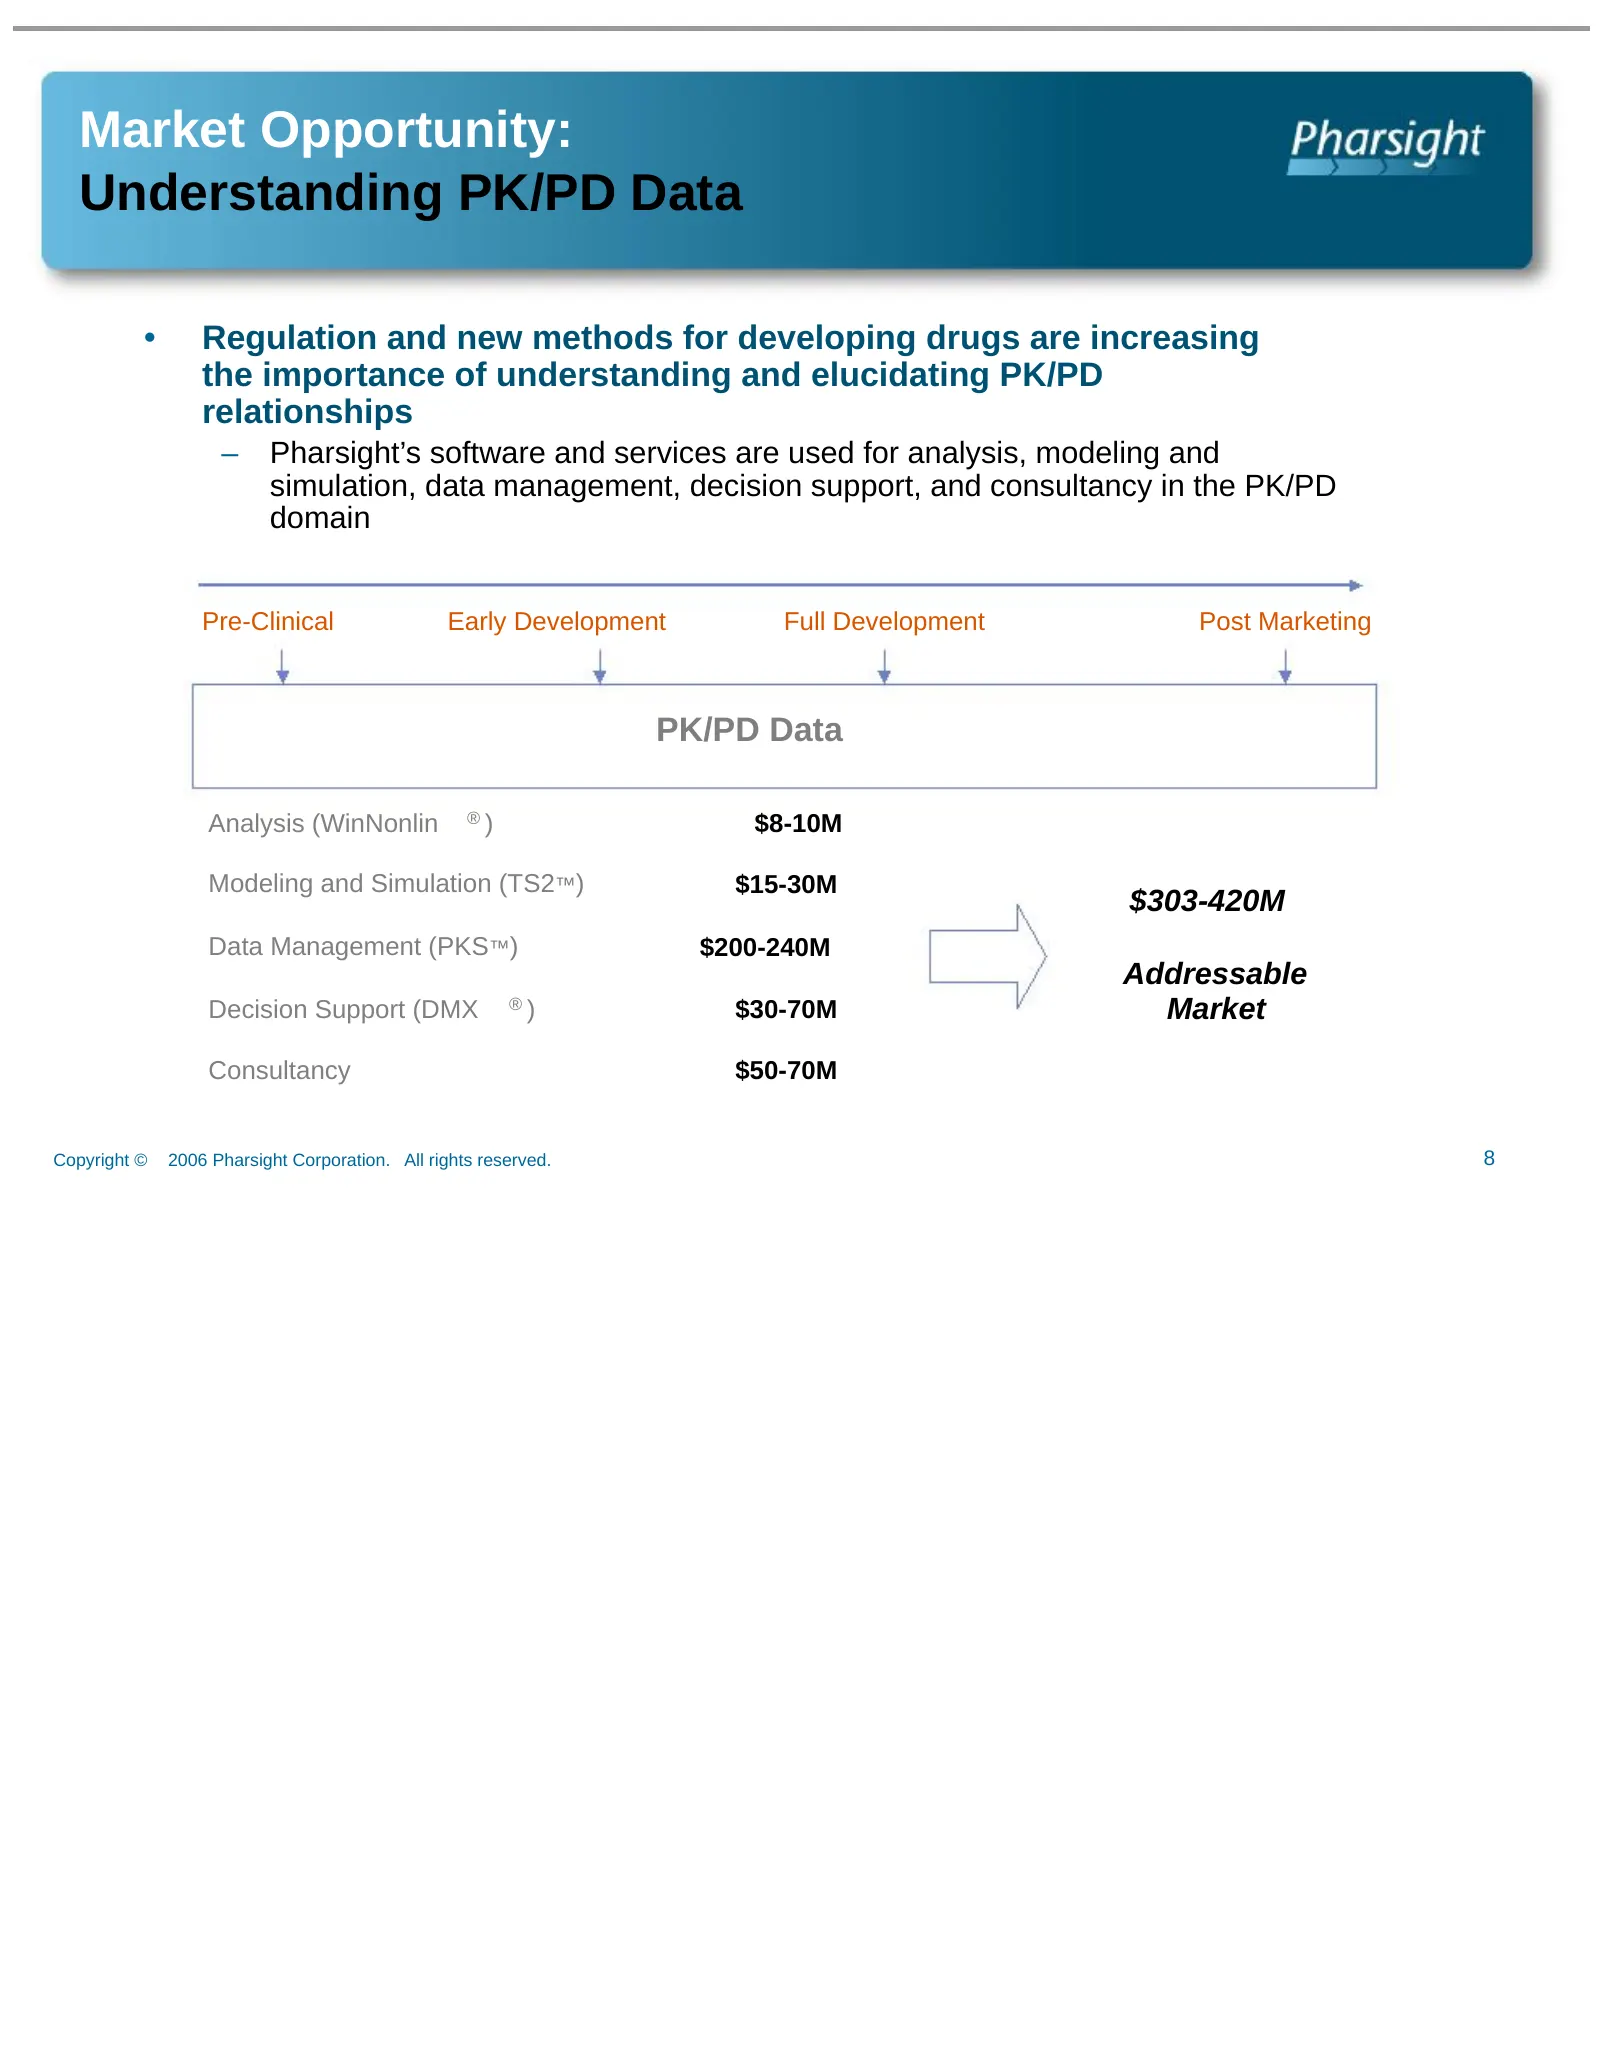
Market Opportunity: Understanding PK/PD Data • Regulation and new methods for developing drugs are increasing the importance of understanding and elucidating PK/PD relationships – Pharsight’s software and services are used for analysis, modeling and simulation, data management, decision support, and
Slide 9: Return on Investment Example sanofi-aventis
Return on Investment Example sanofi-aventis Aventis turned to a computer model from … Pharsight. Using its own animal and human test data, Aventis was able to simulate later-stage clinical trials. Based on that simulation, “we stopped funding development of the compound. The ratio between the therap
Slide 10: Return on Investment Example Pfizer
Return on Investment Example Pfizer “Within 2 years of (implementing Pharsight’s WinNonlin automation and other measures) the two people conducting the routine pharmacokinetic studies had completed 45 studies in 1 year.” (previous staff of 19 for the same work) “The cycle time to issue final reports
Slide 11: Software Products
Software Products Confidential © Pharsight Corporation
Slide 12: Overview of Key Software Offerings
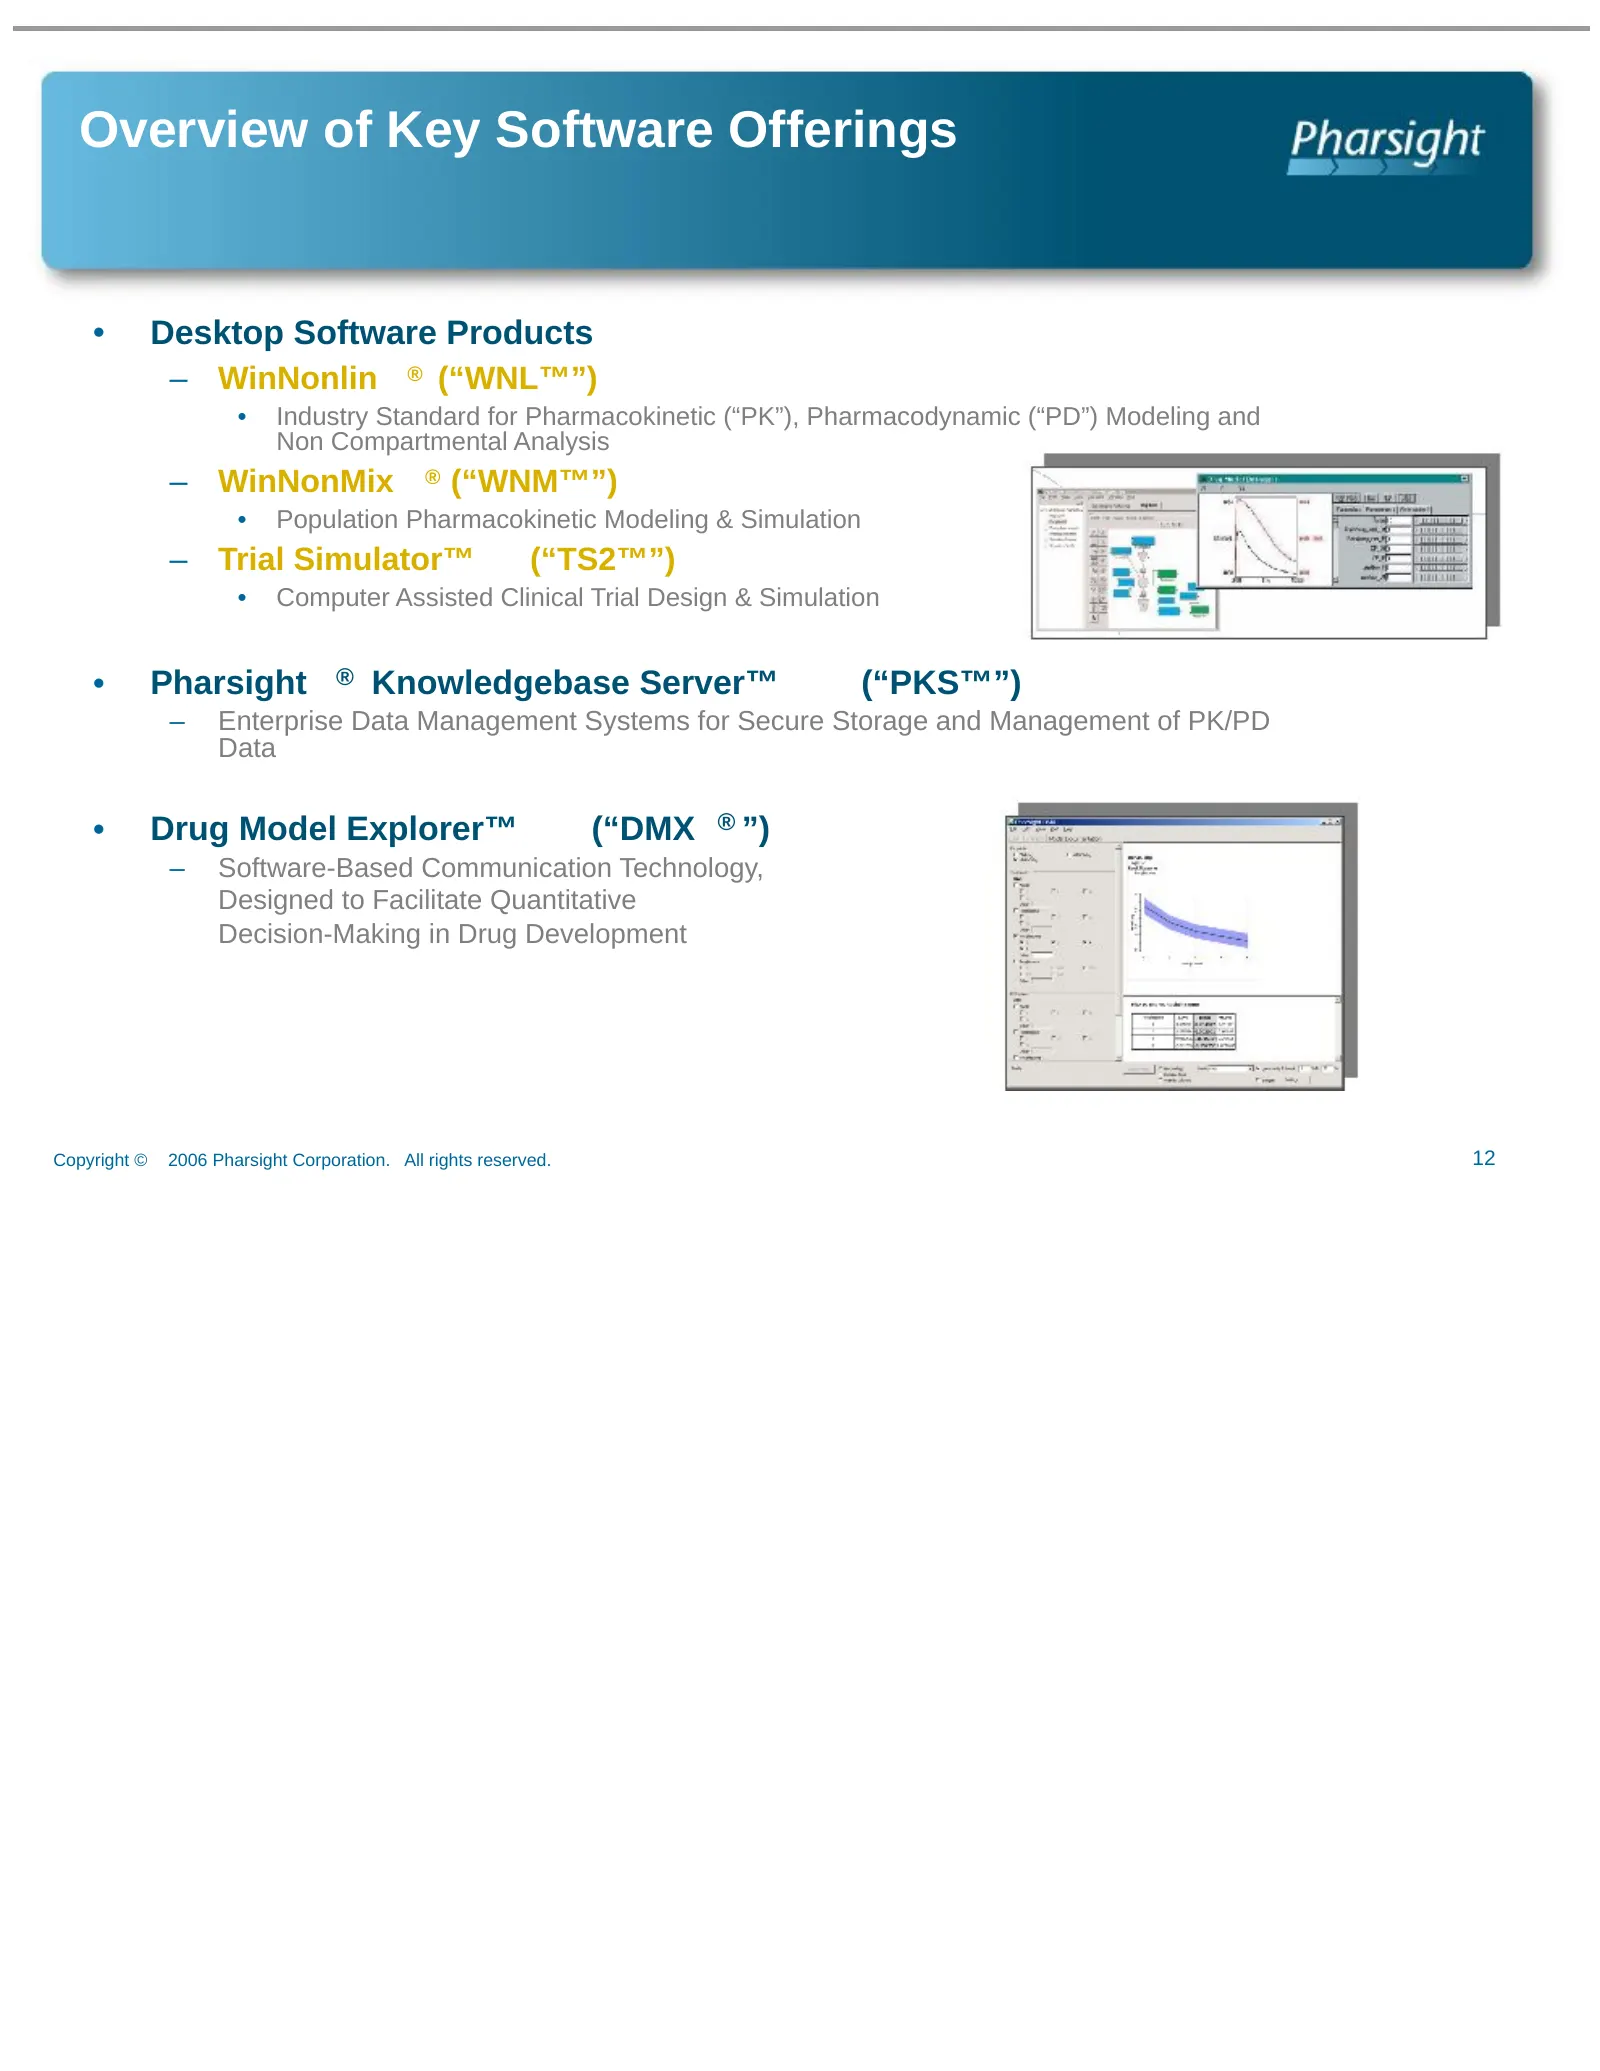
Overview of Key Software Offerings • Desktop Software Products – WinNonlin ® (“WNL™”) • Industry Standard for Pharmacokinetic (“PK”), Pharmacodynamic (“PD”) Modeling and Non Compartmental Analysis – WinNonMix ® (“WNM™”) • Population Pharmacokinetic Modeling & Simulation – Trial Simulator™ (“TS2™”) •
Slide 13: Key Software Offerings WinNonlin
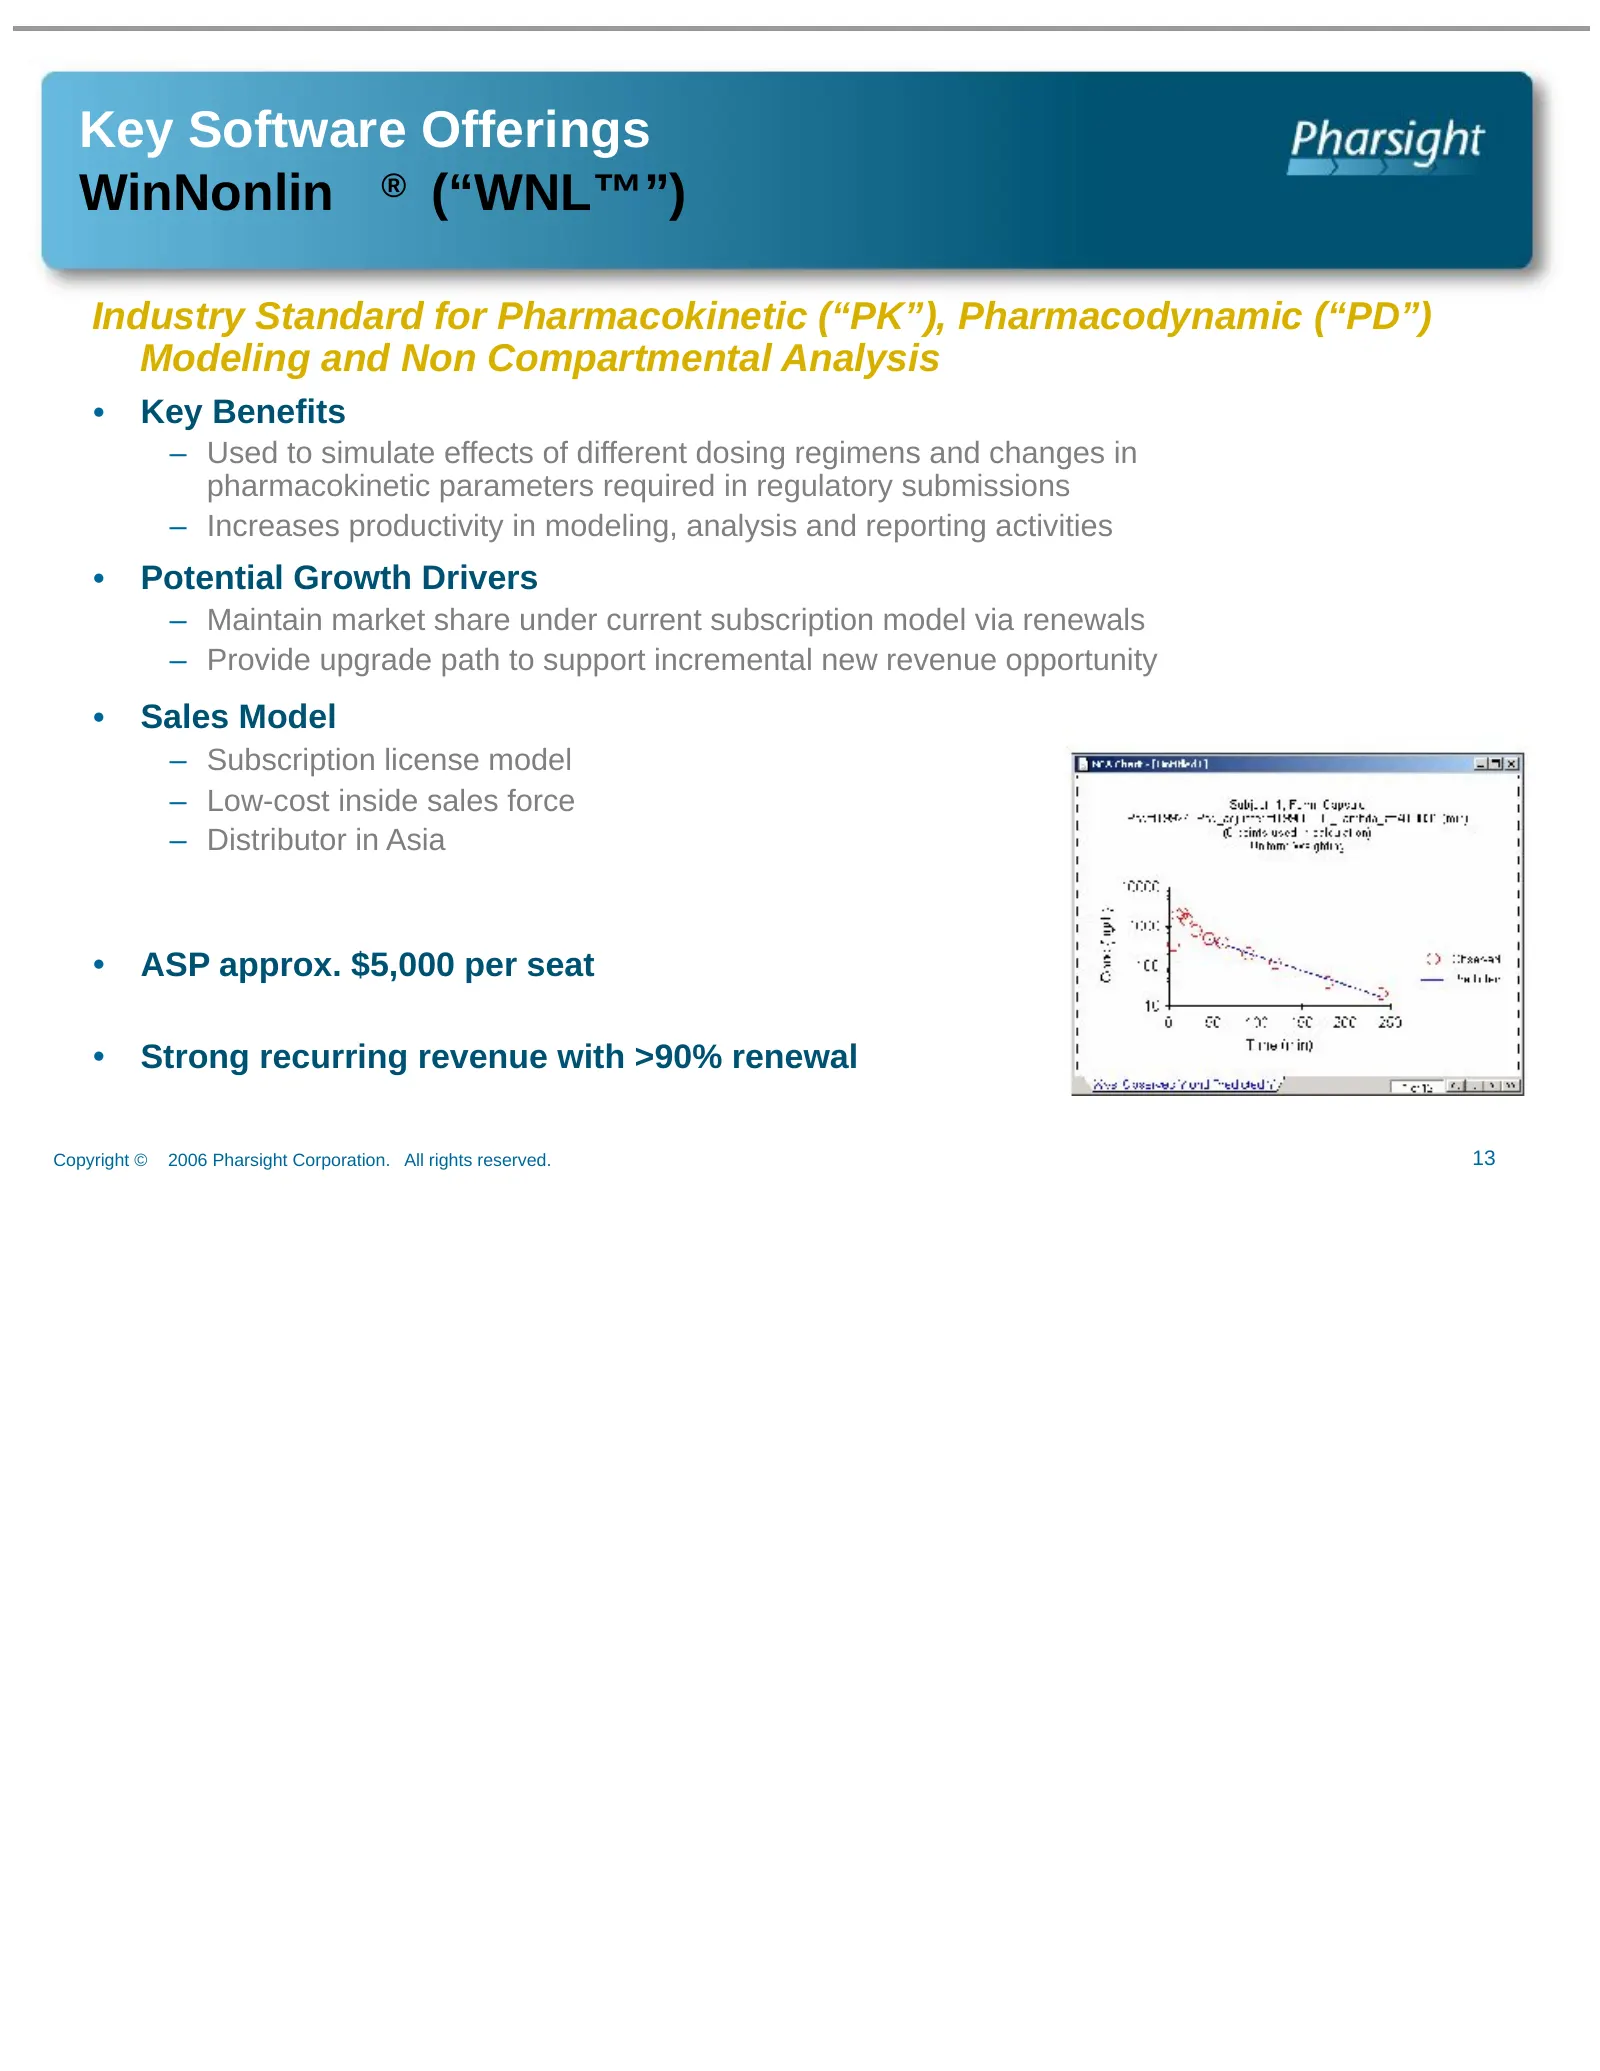
Key Software Offerings WinNonlin ® (“WNL™”) Industry Standard for Pharmacokinetic (“PK”), Pharmacodynamic (“PD”) Modeling and Non Compartmental Analysis • Key Benefits – Used to simulate effects of different dosing regimens and changes in pharmacokinetic parameters required in regulatory submissions
Slide 14: Key Software Offerings WinNonMix
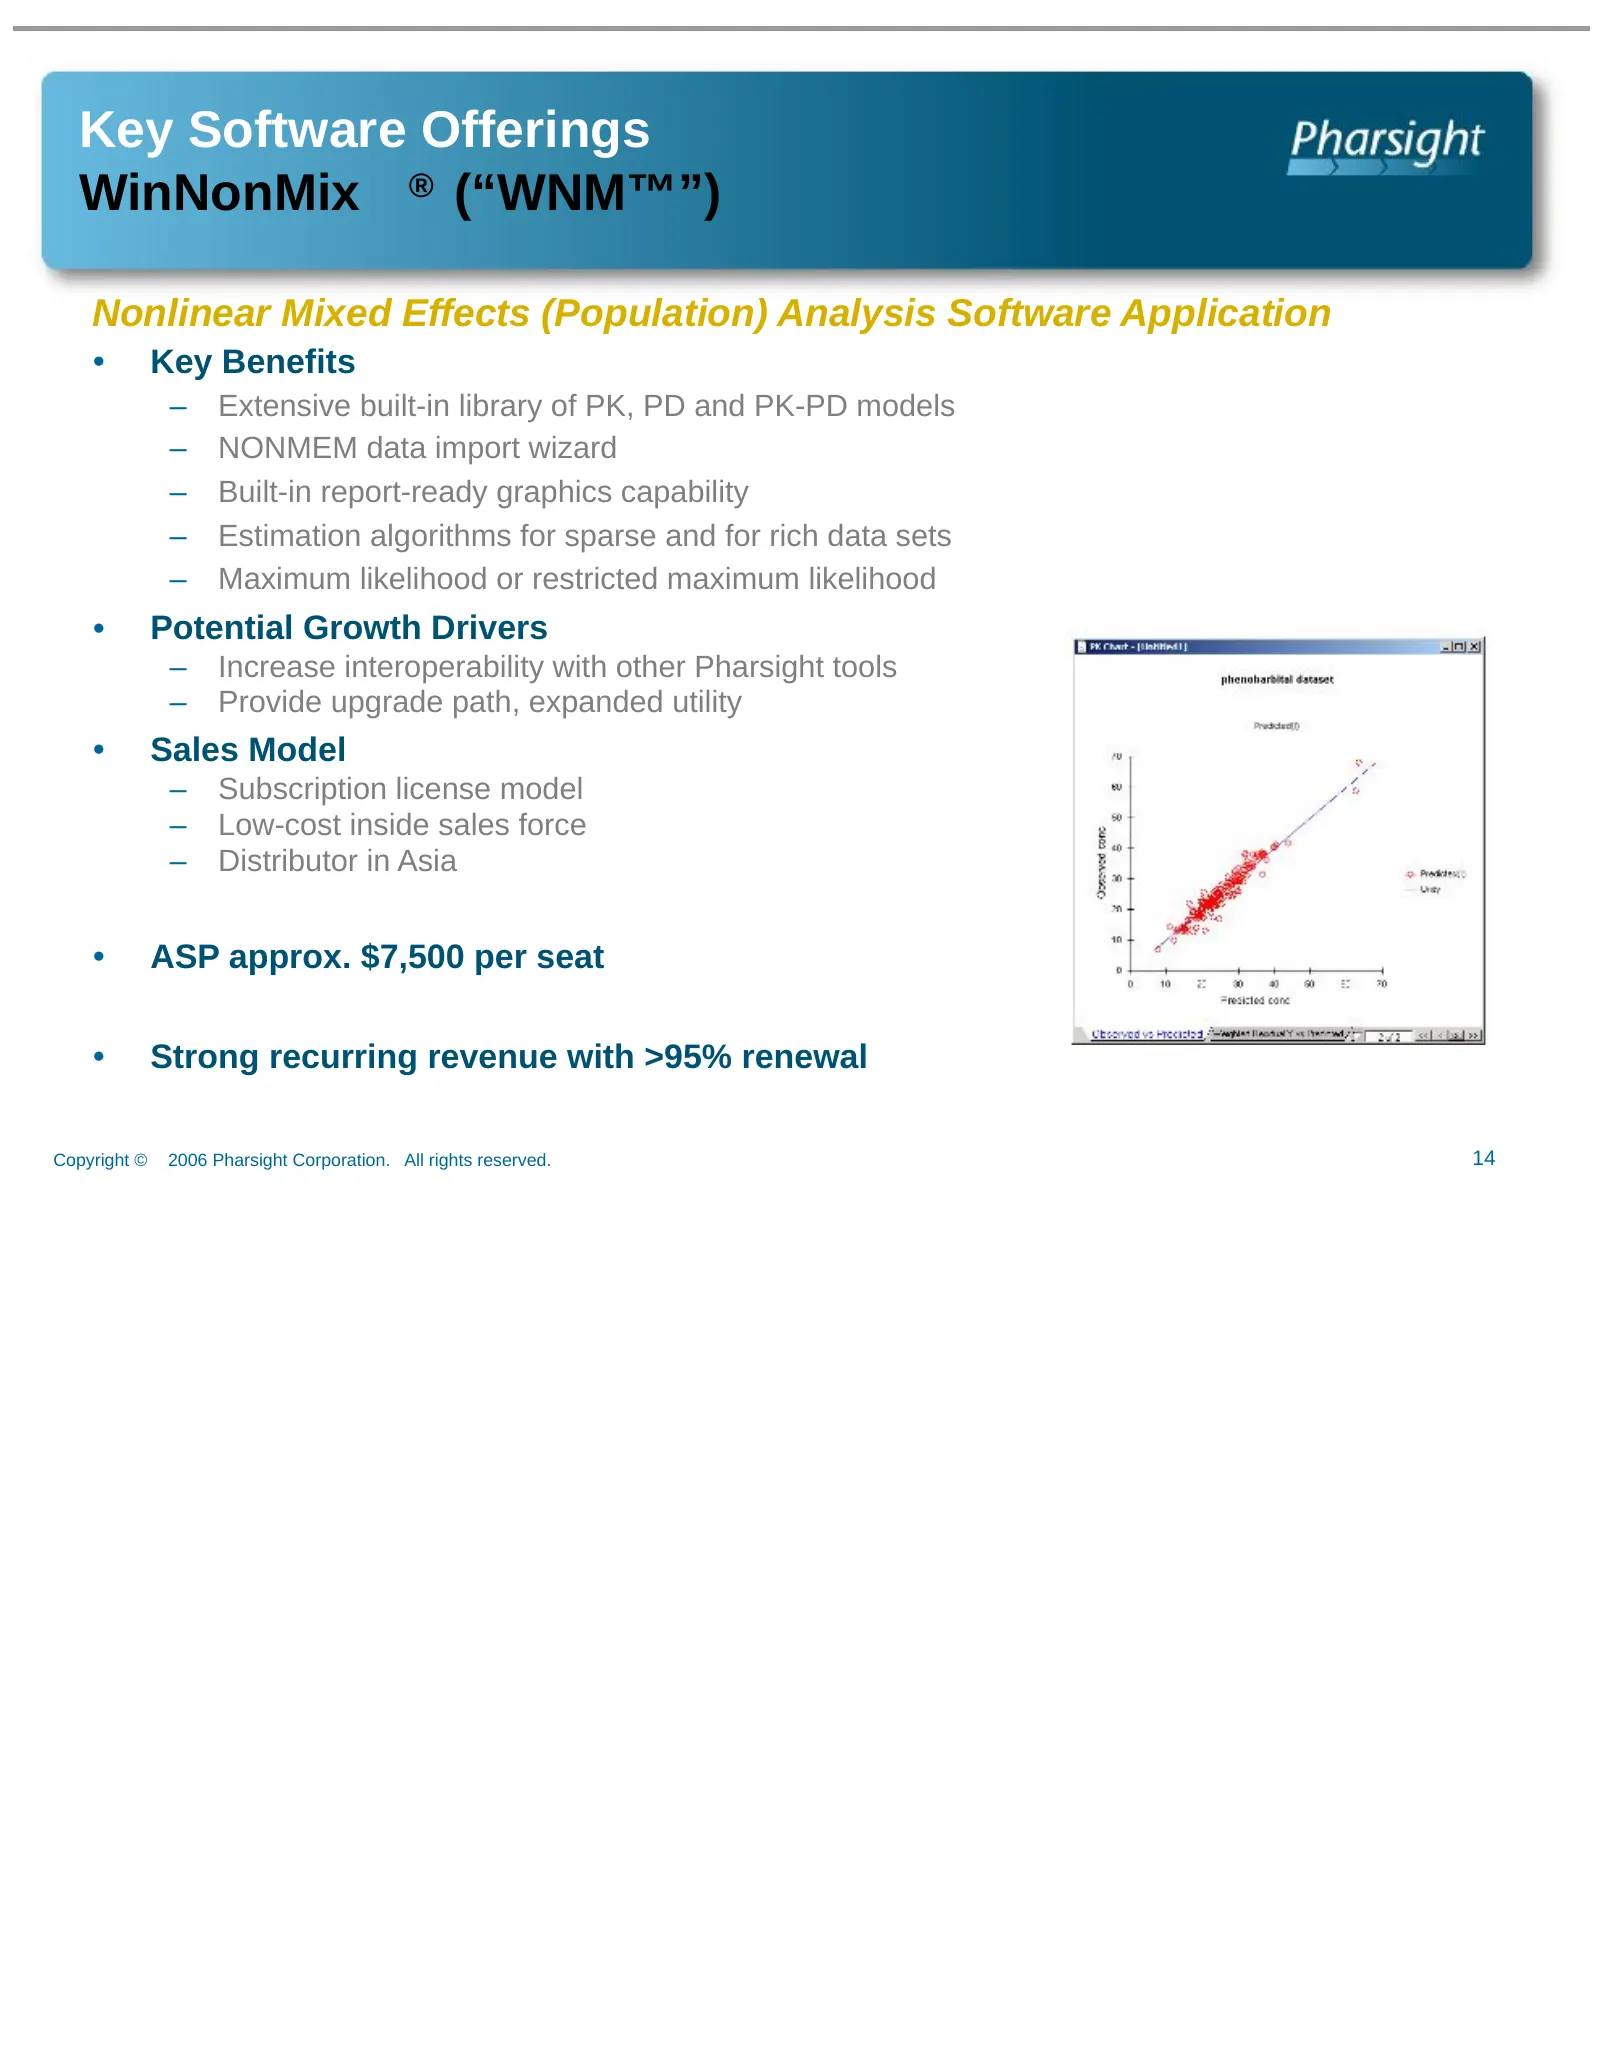
Key Software Offerings WinNonMix ® (“WNM™”) Nonlinear Mixed Effects (Population) Analysis Software Application • Key Benefits – Extensive built-in library of PK, PD and PK-PD models – NONMEM data import wizard – Built-in report-ready graphics capability – Estimation algorithms for sparse and for ric
Slide 15: Key Software Offerings Trial Simulator 2.0
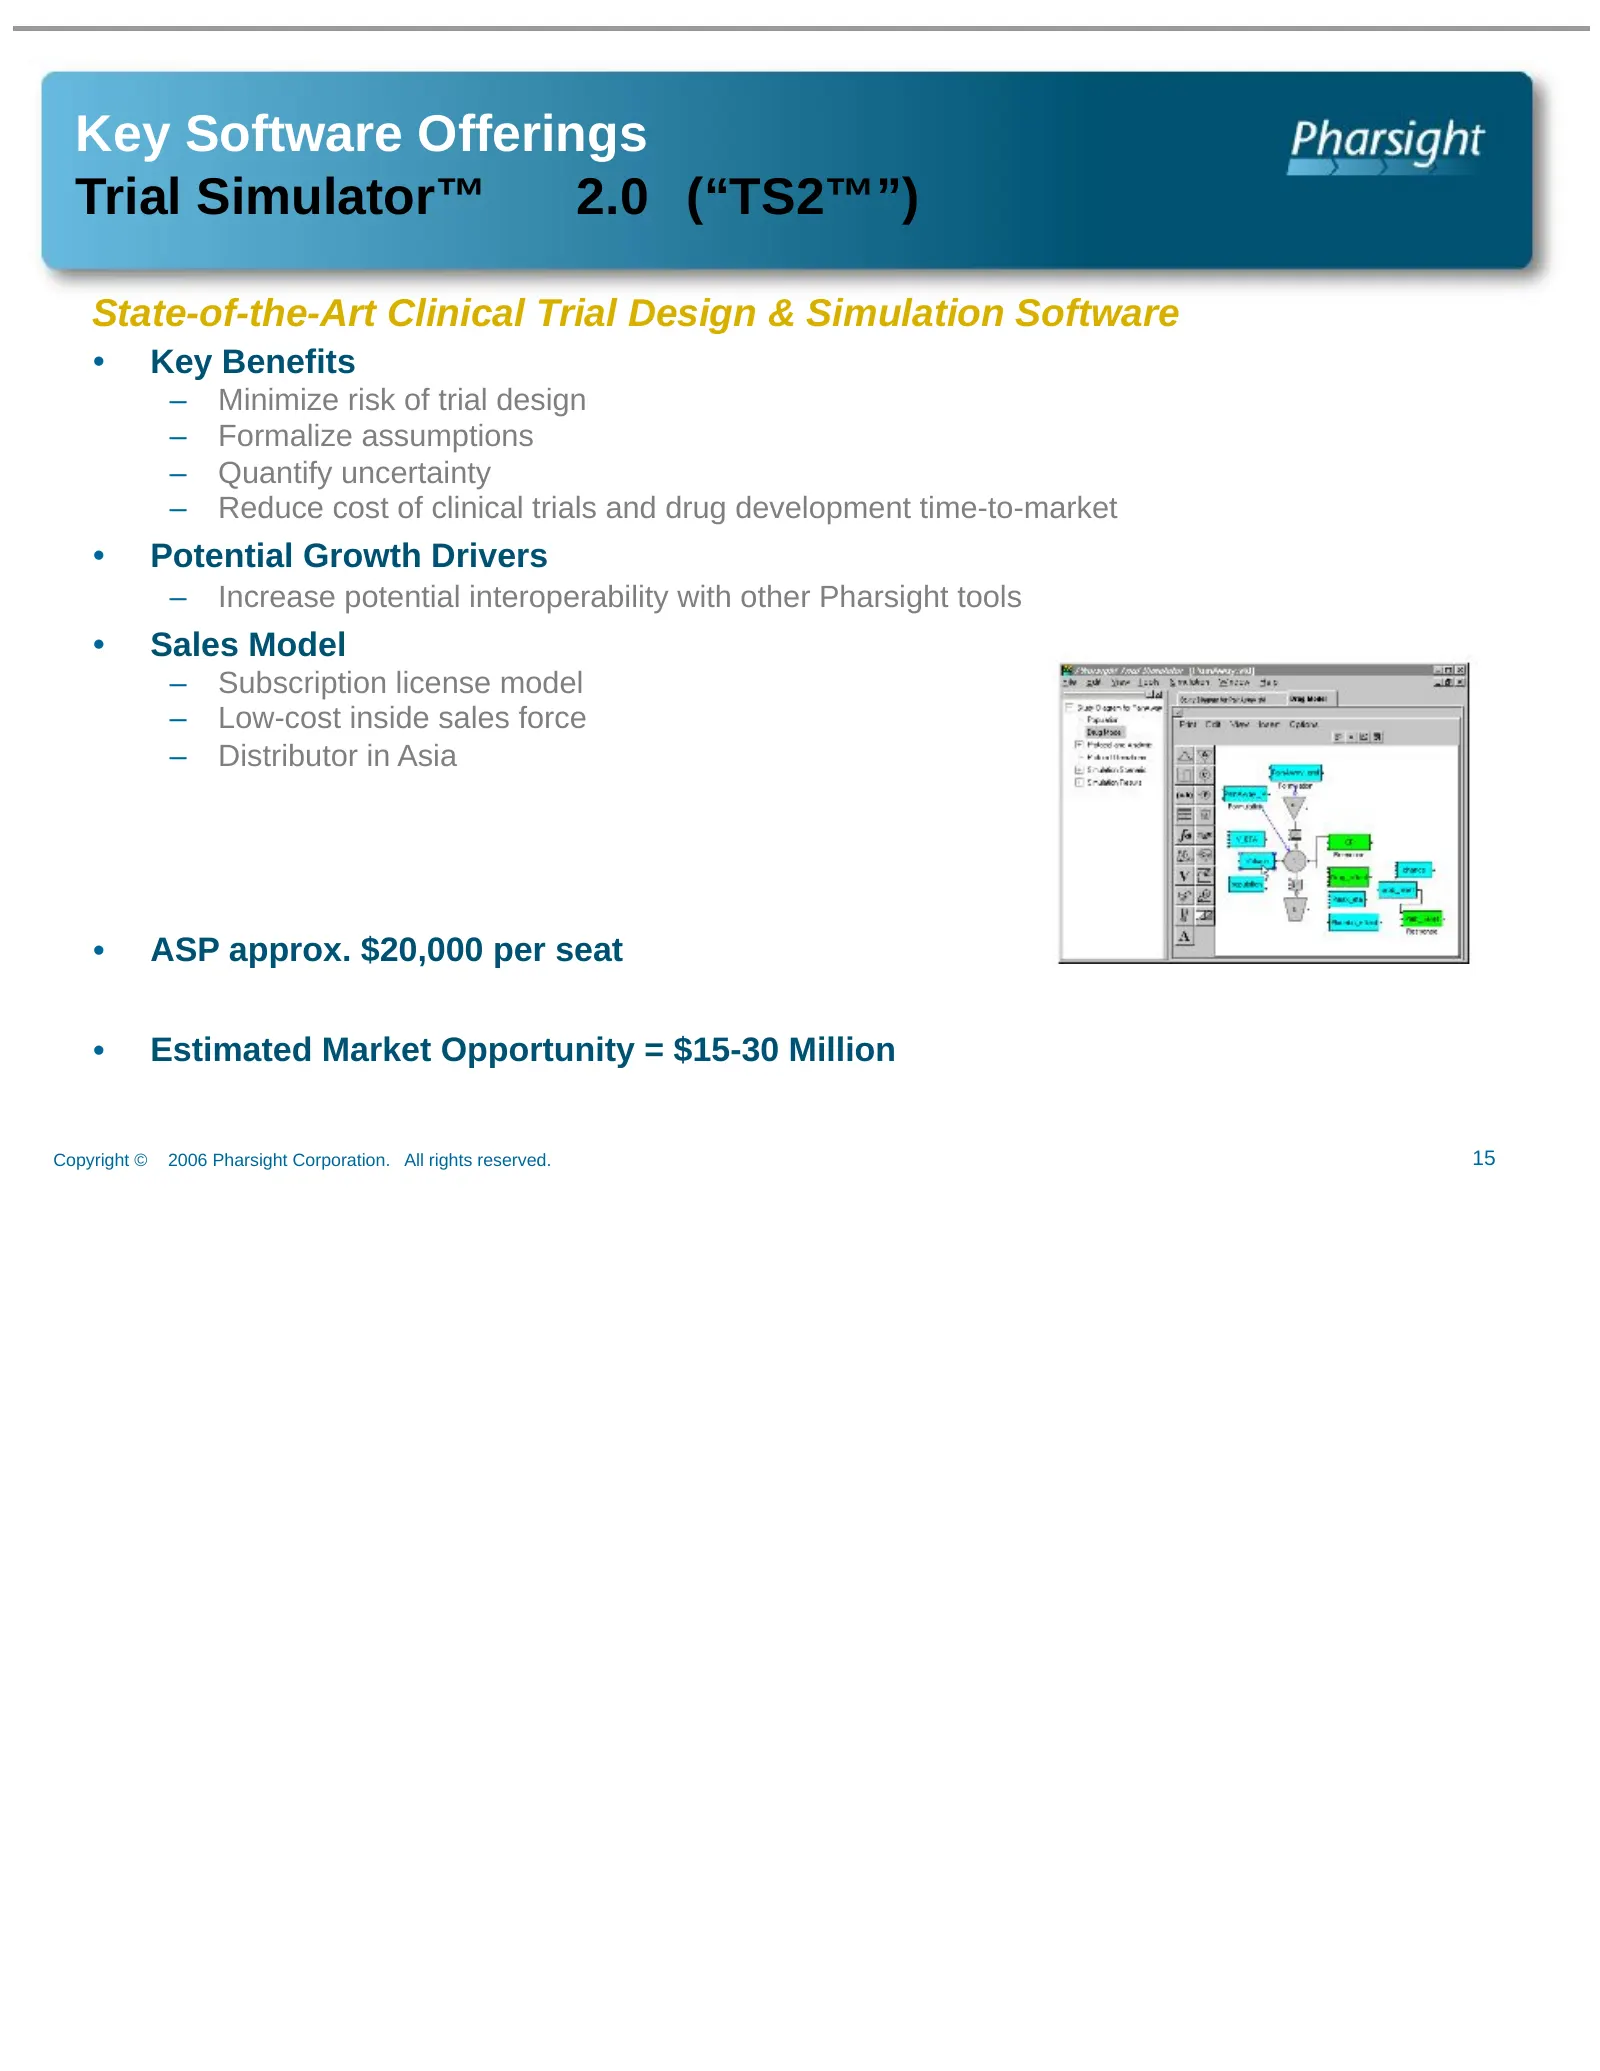
Key Software Offerings Trial Simulator™ 2.0 (“TS2™”) State-of-the-Art Clinical Trial Design & Simulation Software • Key Benefits – Minimize risk of trial design – Formalize assumptions – Quantify uncertainty – Reduce cost of clinical trials and drug development time-to-market • Potential Growth Driv
Slide 16: Key Software Offerings Pharsight Knowledgebase Server
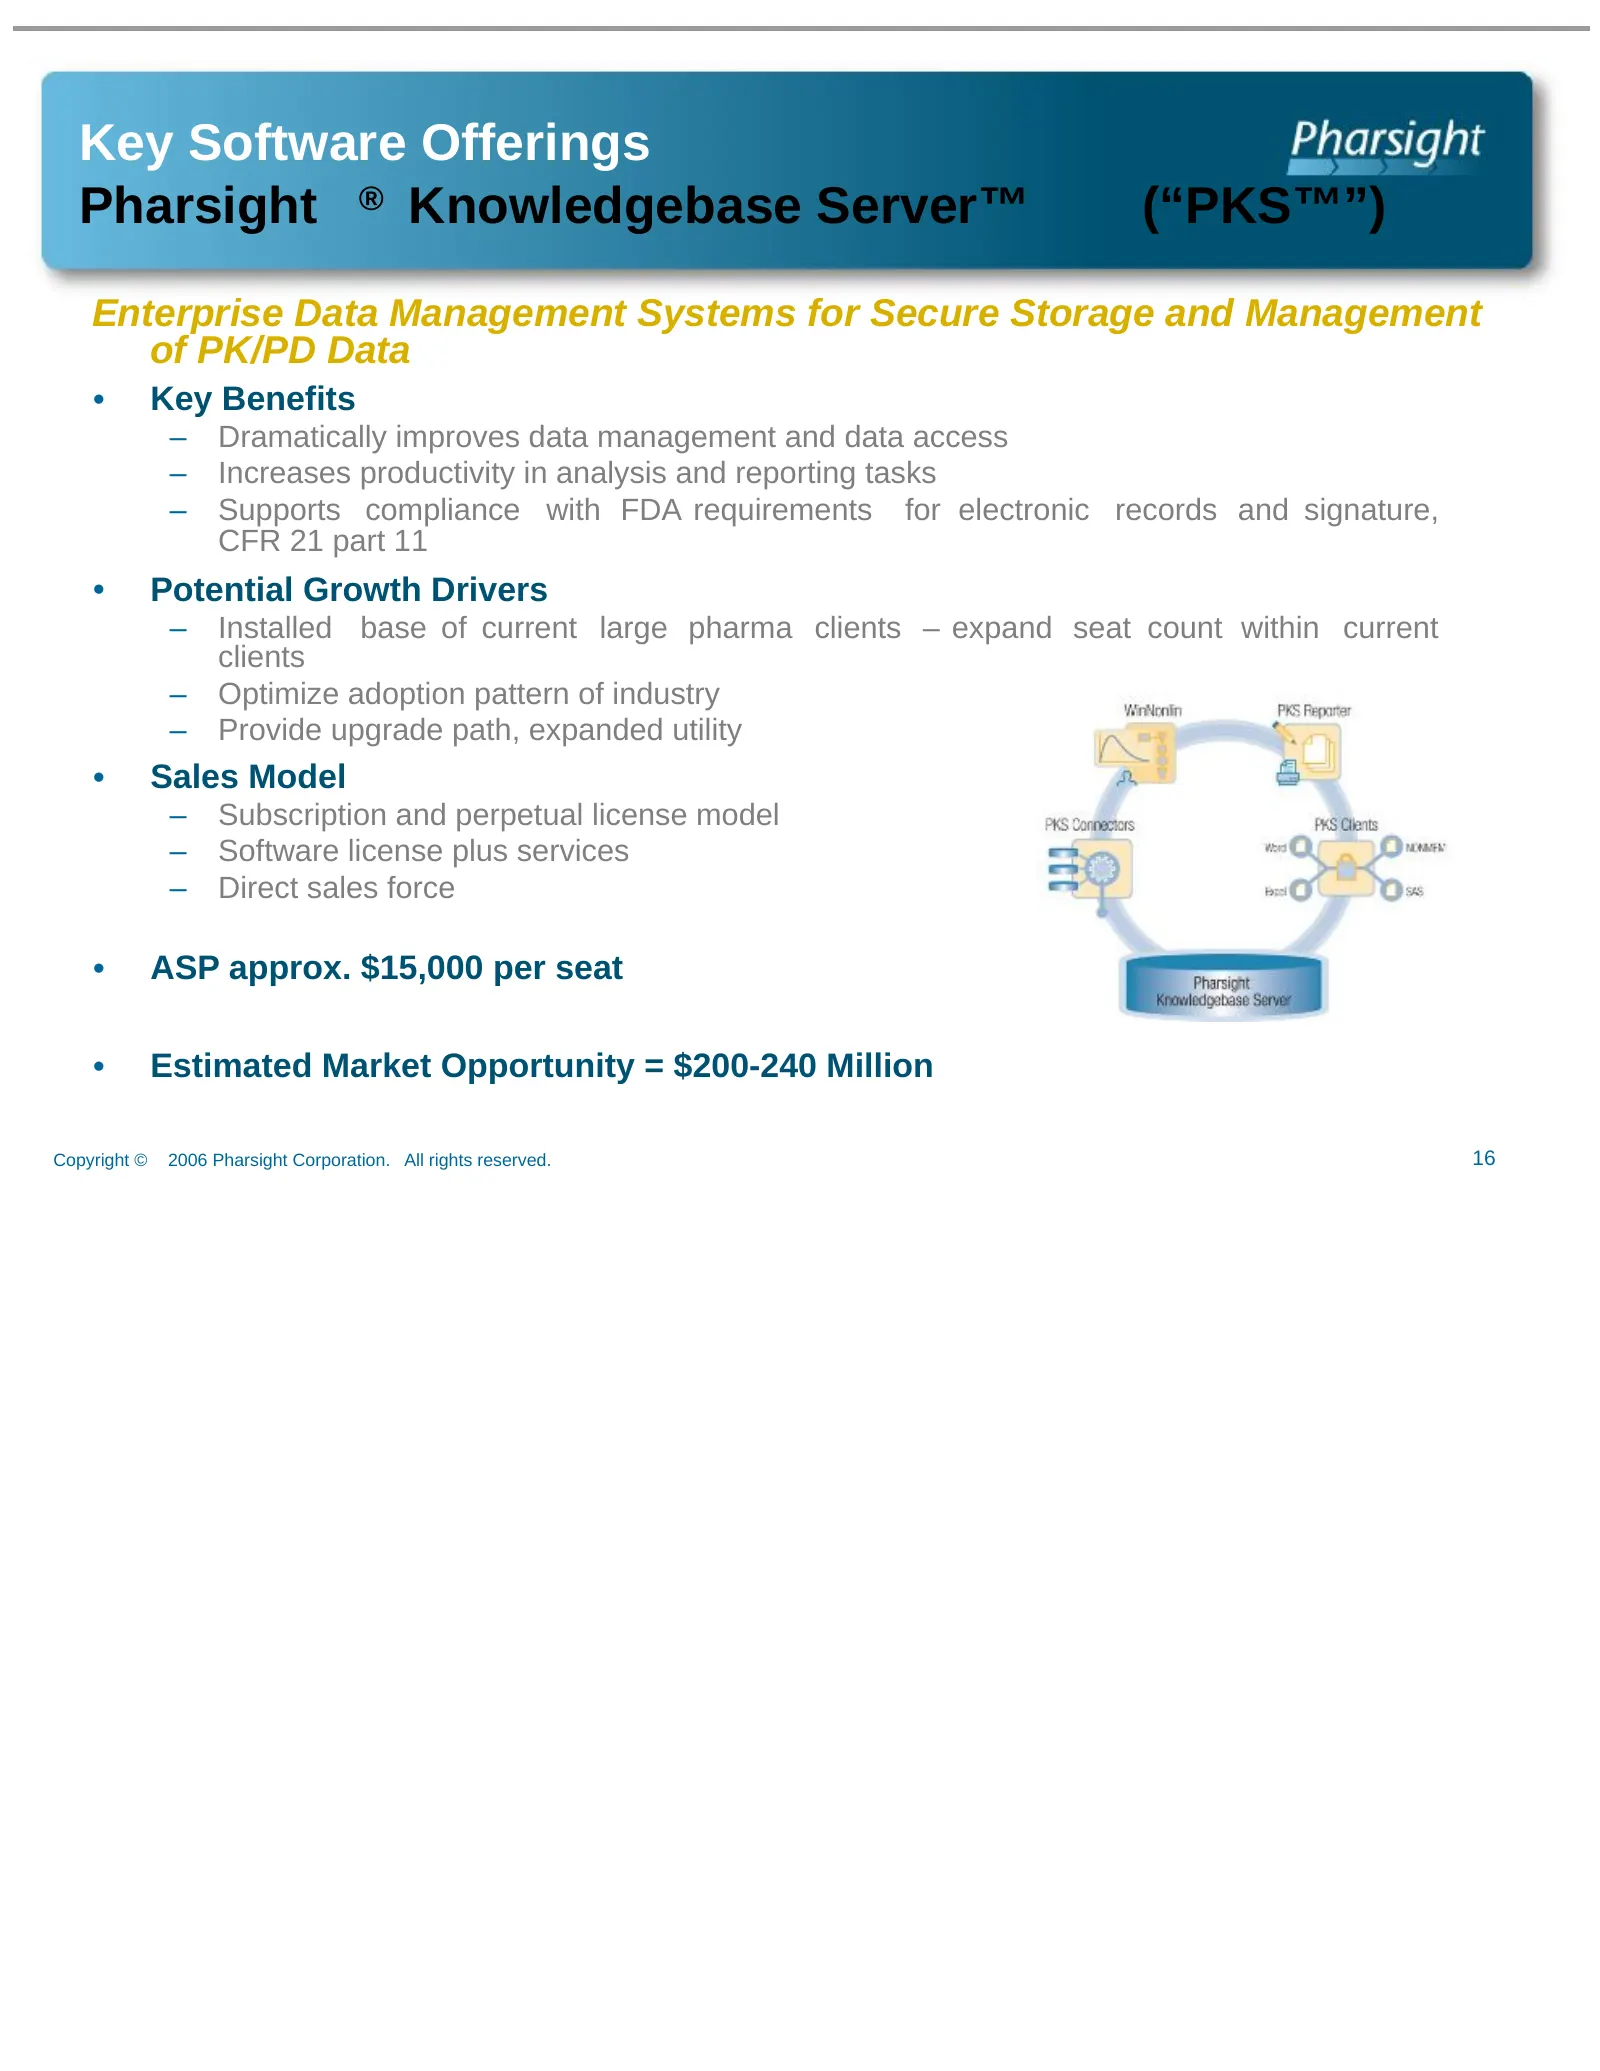
Key Software Offerings Pharsight ® Knowledgebase Server™ (“PKS™”) Enterprise Data Management Systems for Secure Storage and Management of PK/PD Data • Key Benefits – Dramatically improves data management and data access – Increases productivity in analysis and reporting tasks – Supports compliance w
Slide 17: Key Software Offerings Drug Model Explorer
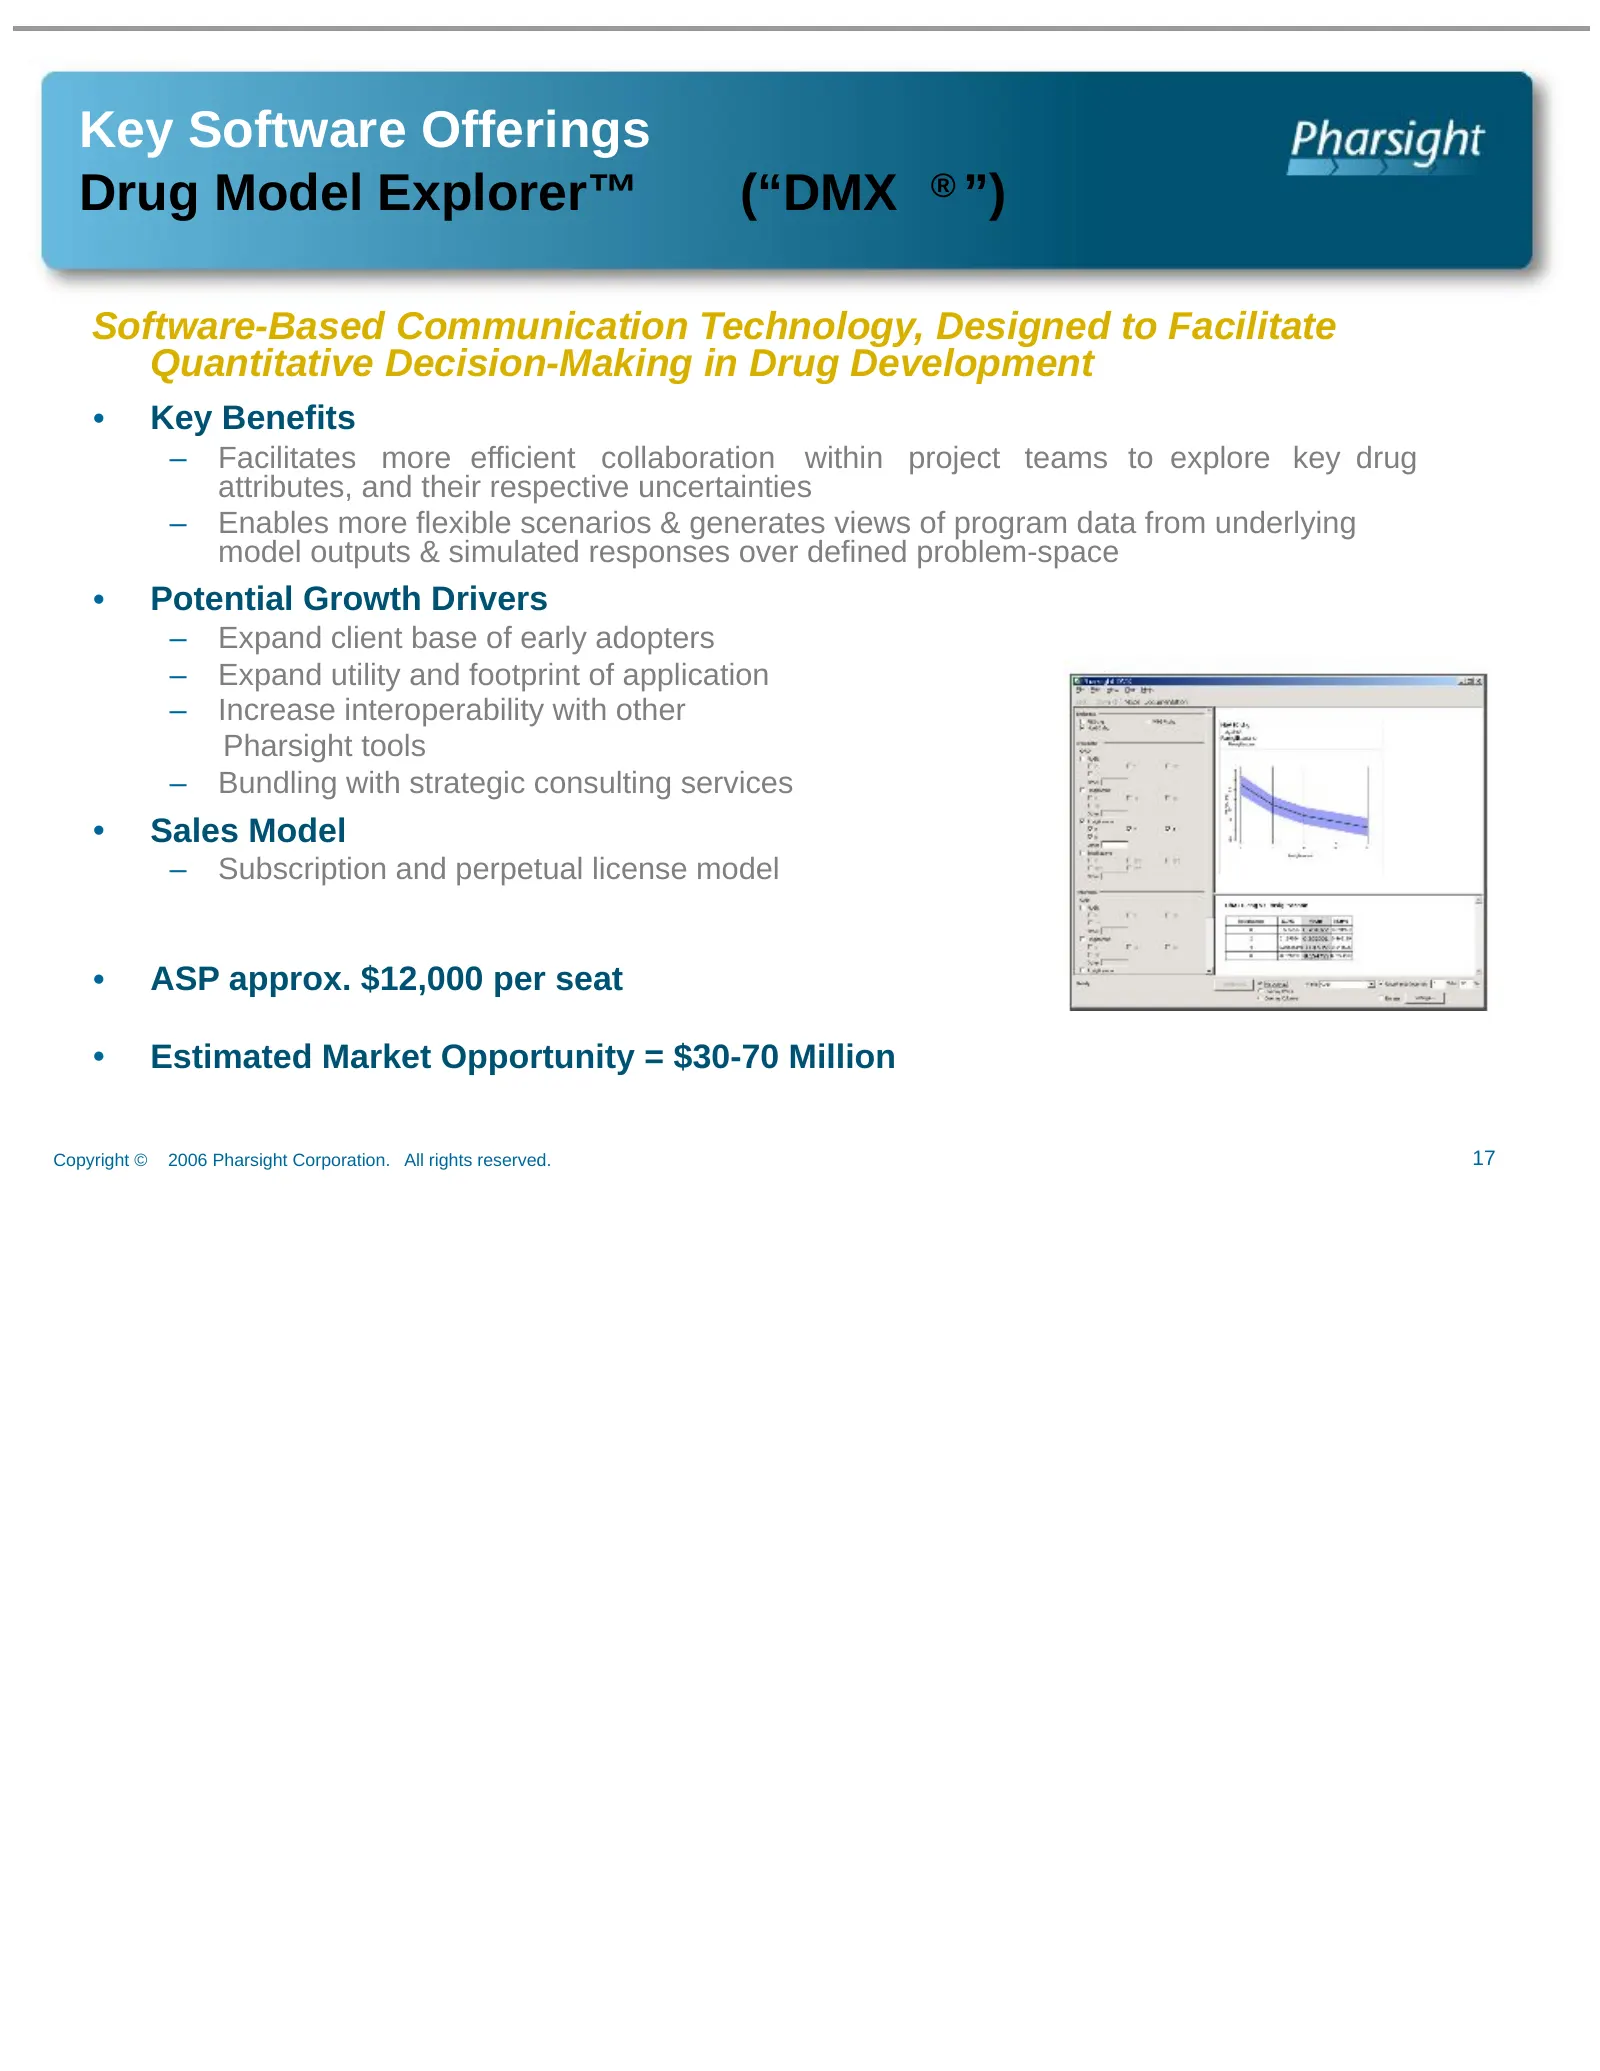
Key Software Offerings Drug Model Explorer™ (“DMX ® ”) Software-Based Communication Technology, Designed to Facilitate Quantitative Decision-Making in Drug Development • Key Benefits – Facilitates more efficient collaboration within project teams to explore key drug attributes, and their respective
Slide 18: Software Products Market Acceptance
Software Products 1 Market Acceptance • Over 800 active software customers 2 • All Top 50 Pharma license at least one of our software products • Our software applications are licensed for use on more than 4,000 desktops in industry, more than 900 desktops in academia 2 TM • 10 of the Top 50 Pharma a
Slide 19: Strategic Consulting Services
Strategic Consulting Services Confidential © Pharsight Corporation
Slide 20: Formal, quantitative, model-based decision-making method
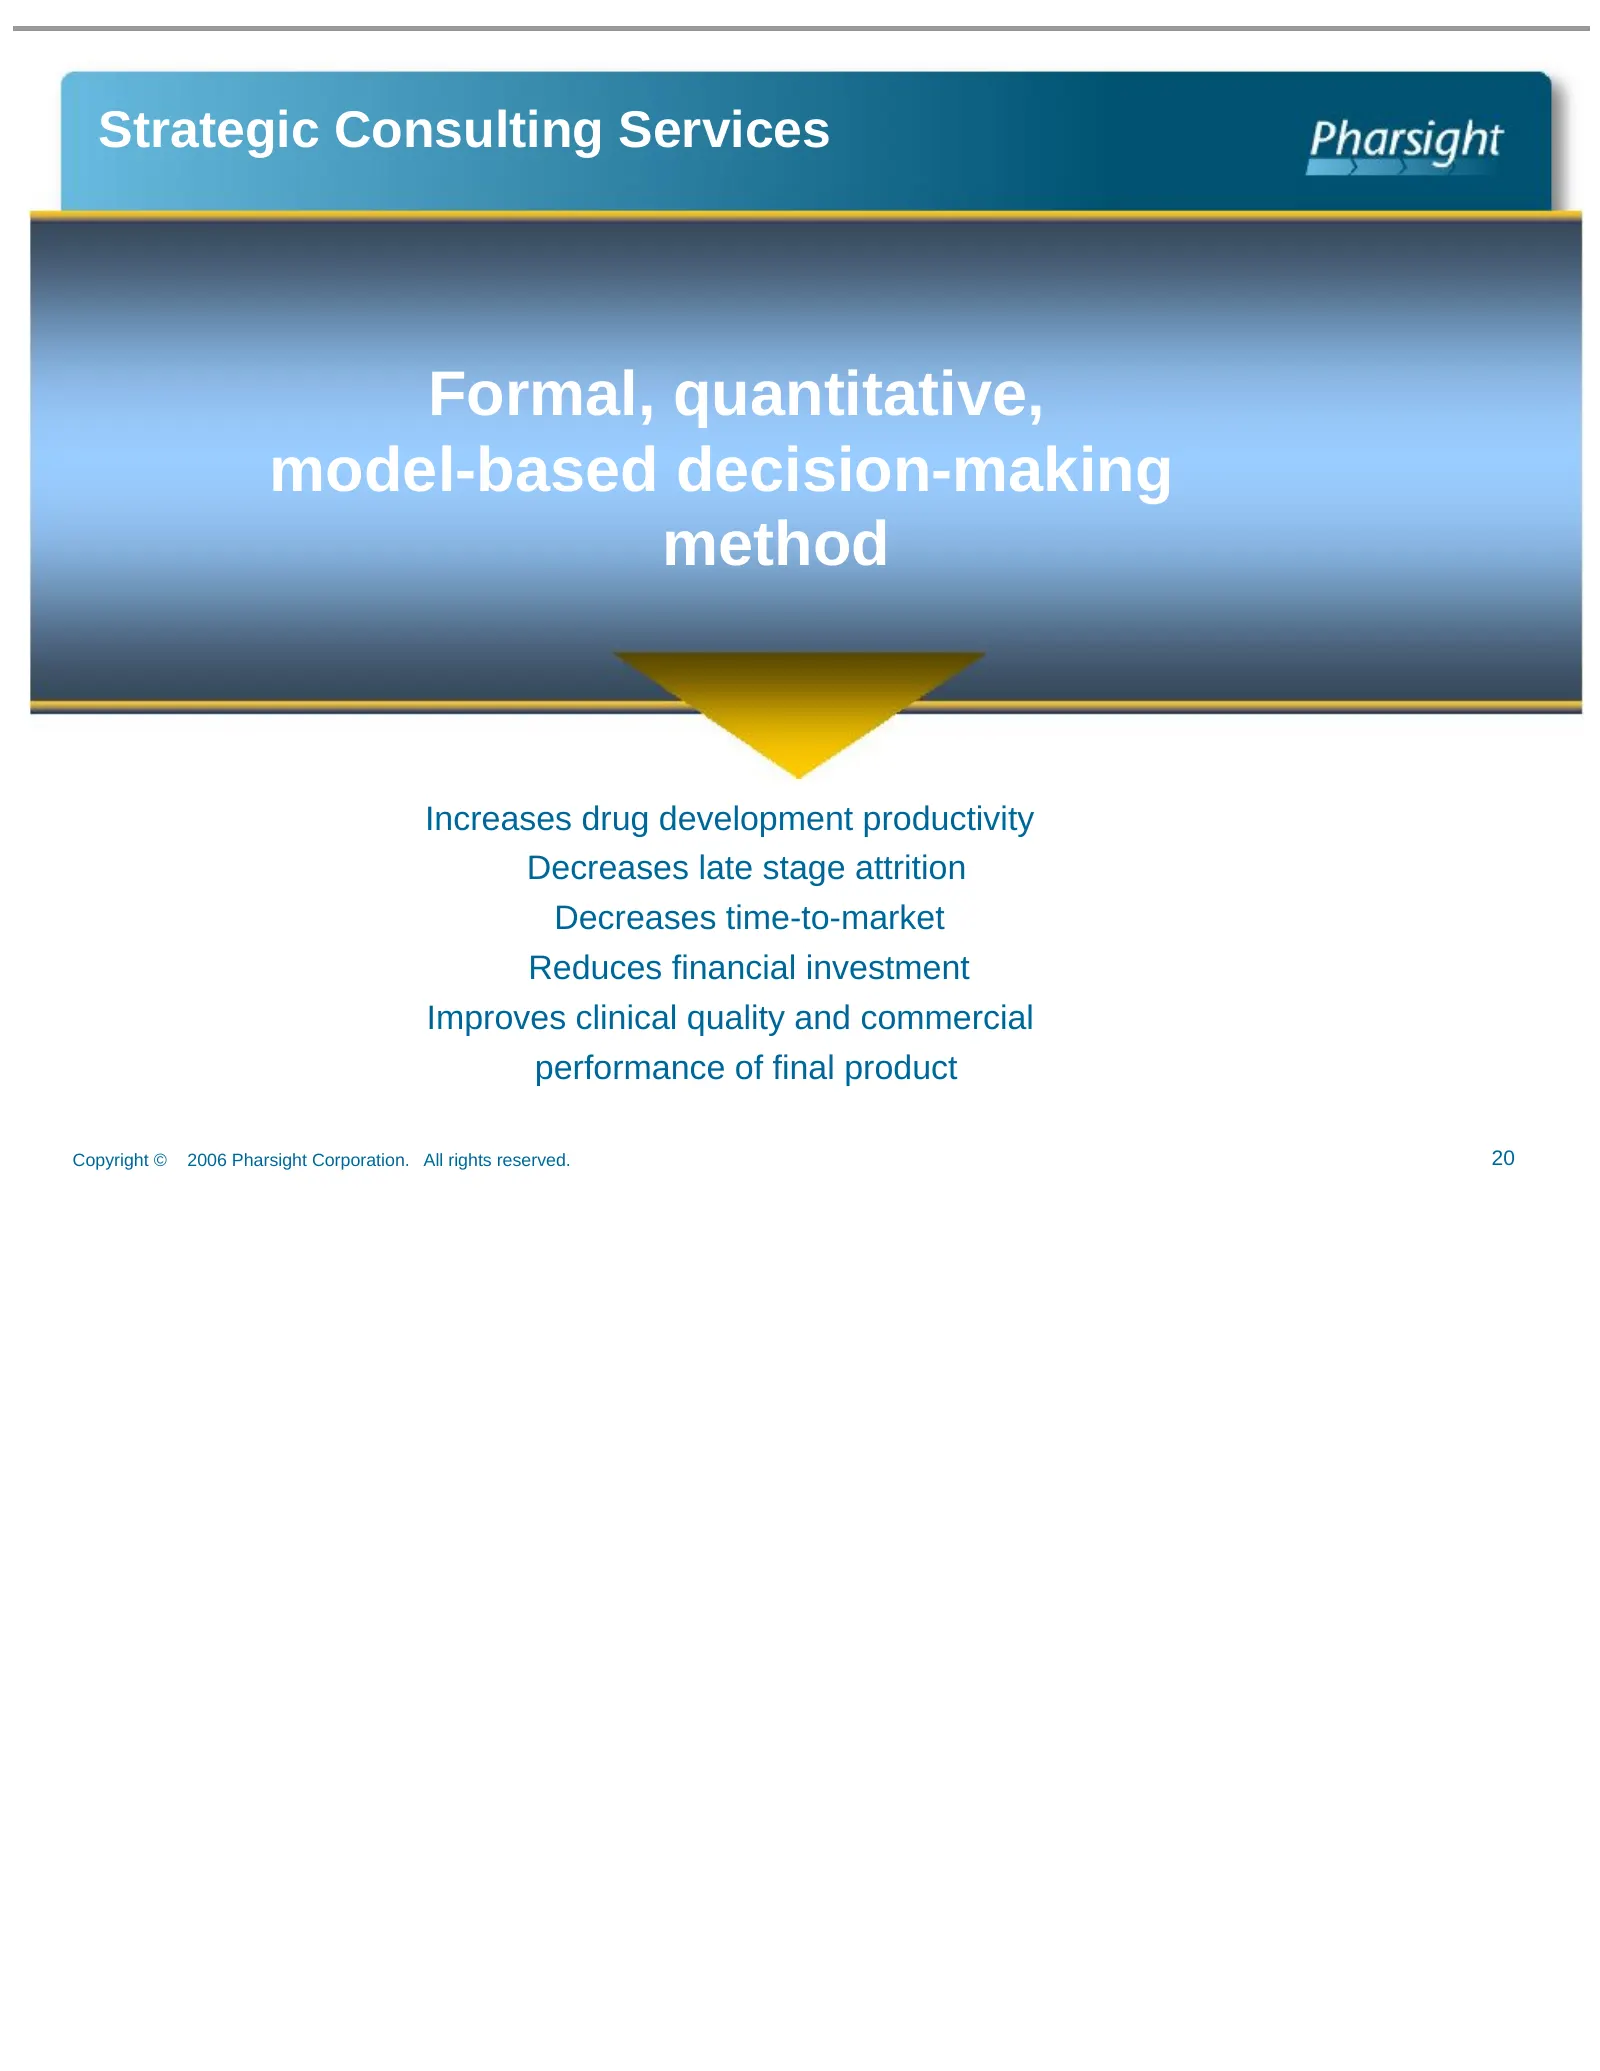
Strategic Consulting Services Formal, quantitative, model-based decision-making method Increases drug development productivity Decreases late stage attrition Decreases time-to-market Reduces financial investment Improves clinical quality and commercial performance of final product Copyright © 2006 P
Slide 21: Quantitative Modeling Supports Both Trial- and Program-Level Decisions
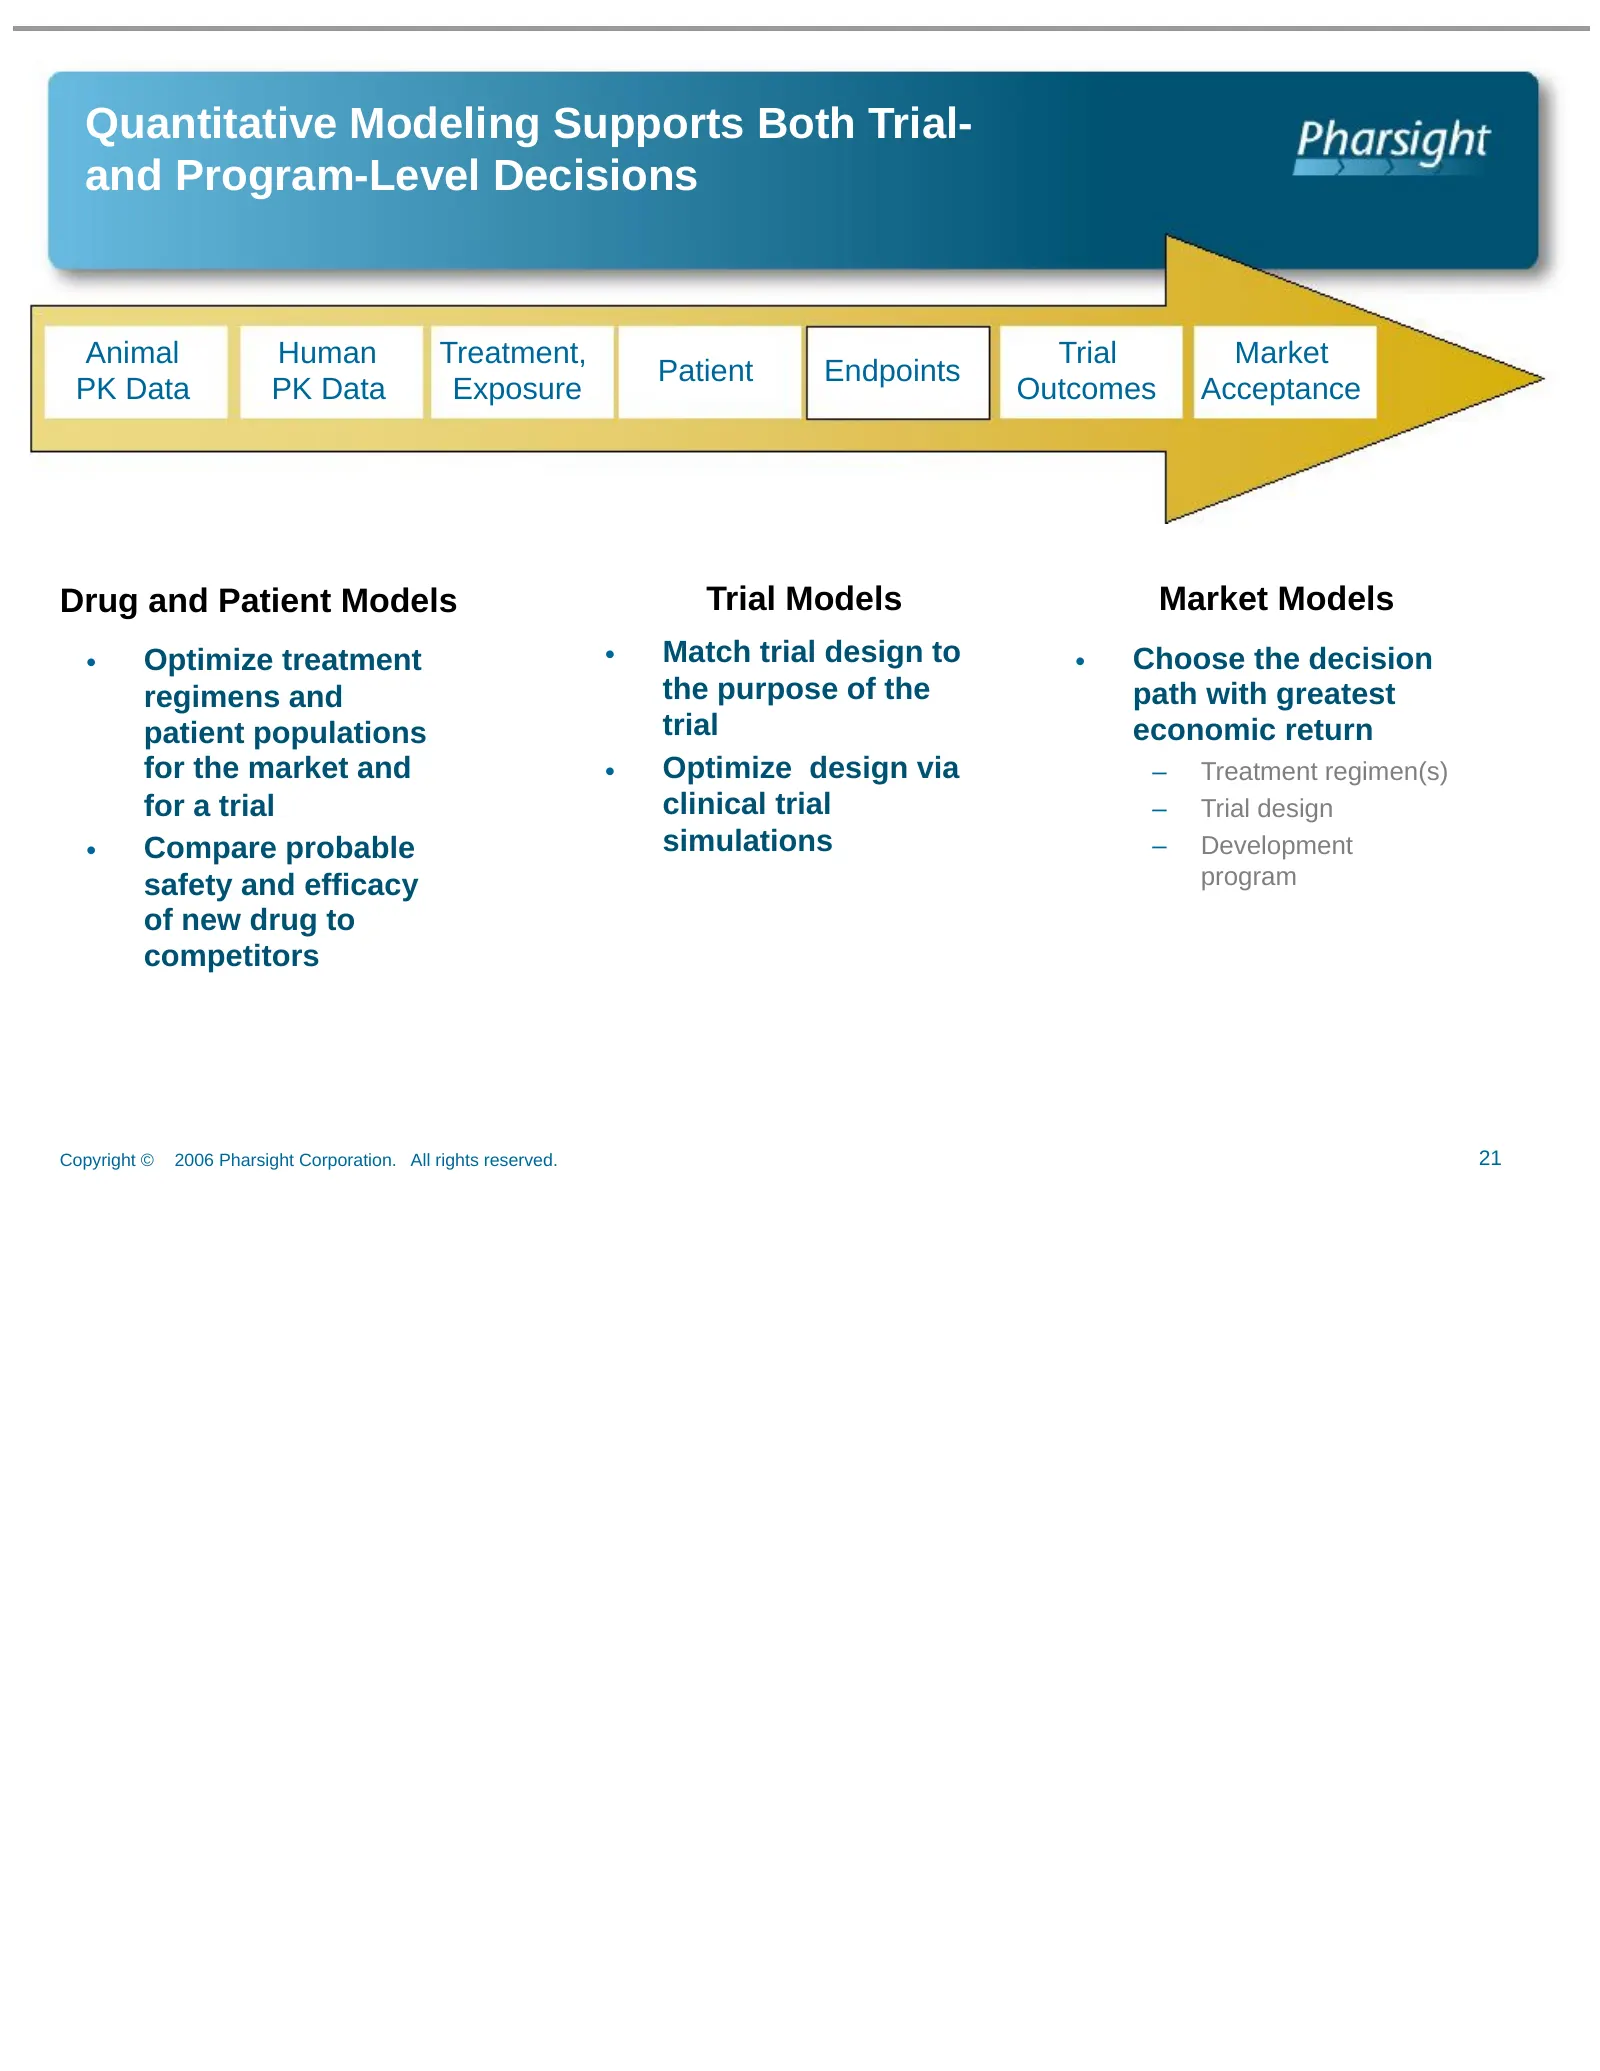
Quantitative Modeling Supports Both Trial- and Program-Level Decisions Animal Human Treatment, Trial Market Patient Endpoints PK Data PK Data Exposure Outcomes Acceptance Drug and Patient Models Trial Models Market Models • Optimize treatment • Match trial design to • Choose the decision regimens an
Slide 22: Strategic Consulting Services Potential Growth Drivers
Strategic Consulting Services Potential Growth Drivers • Industry Factors – Increased acceptance of modeling and simulation to achieve efficient drug development decision making – FDA Critical Path Initiative advocates increased use of modeling and simulation to overcome poor development productivit
Slide 23: Strategic Consulting Services Market Acceptance
Strategic Consulting Services Market Acceptance 1 • Over 35 active consulting clients during Fiscal Year 2006 2 – 22 of the Top 50 Pharma are active consulting clients – 24 new consulting clients • Over 100 projects engaged during Fiscal Year 2006 • Diverse Customer Workplans – Hourly engagements to
Slide 24: Financial Overview
Financial Overview Confidential © Pharsight Corporation
Slide 25: Accomplishments and Guidance
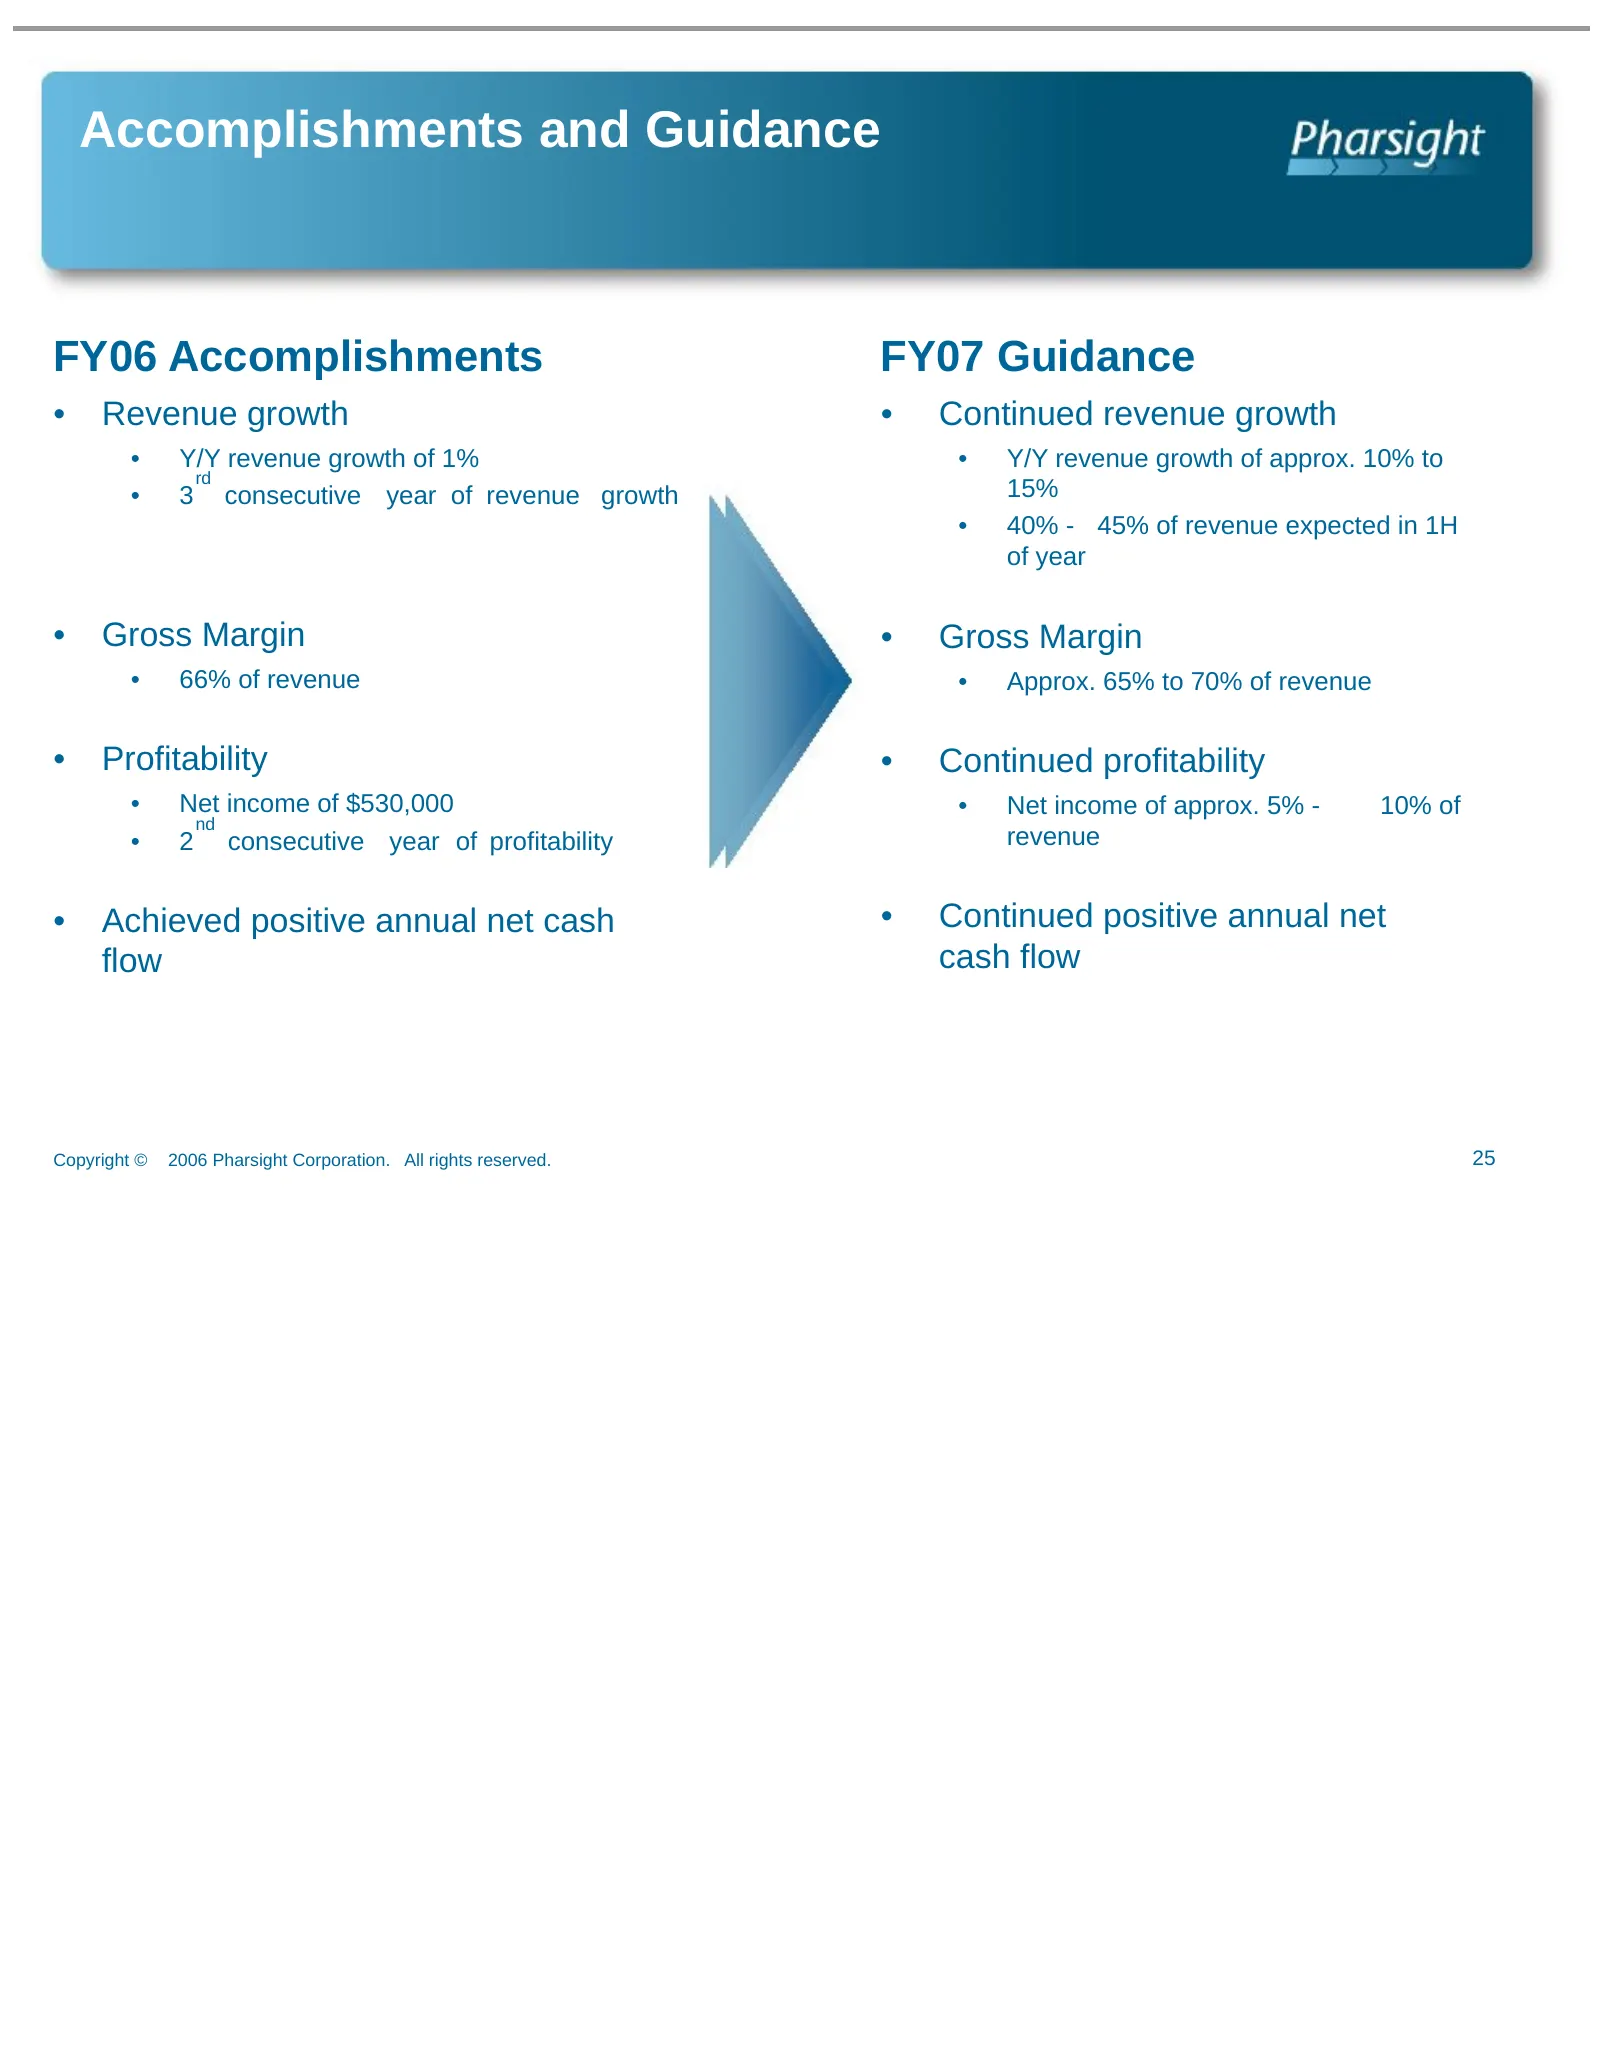
Accomplishments and Guidance FY06 Accomplishments FY07 Guidance • Revenue growth • Continued revenue growth • Y/Y revenue growth of 1% • Y/Y revenue growth of approx. 10% to rd • 3 consecutive year of revenue growth 15% • 40% - 45% of revenue expected in 1H of year • Gross Margin • Gross Margin • 66
Slide 26: Summary Income Statements
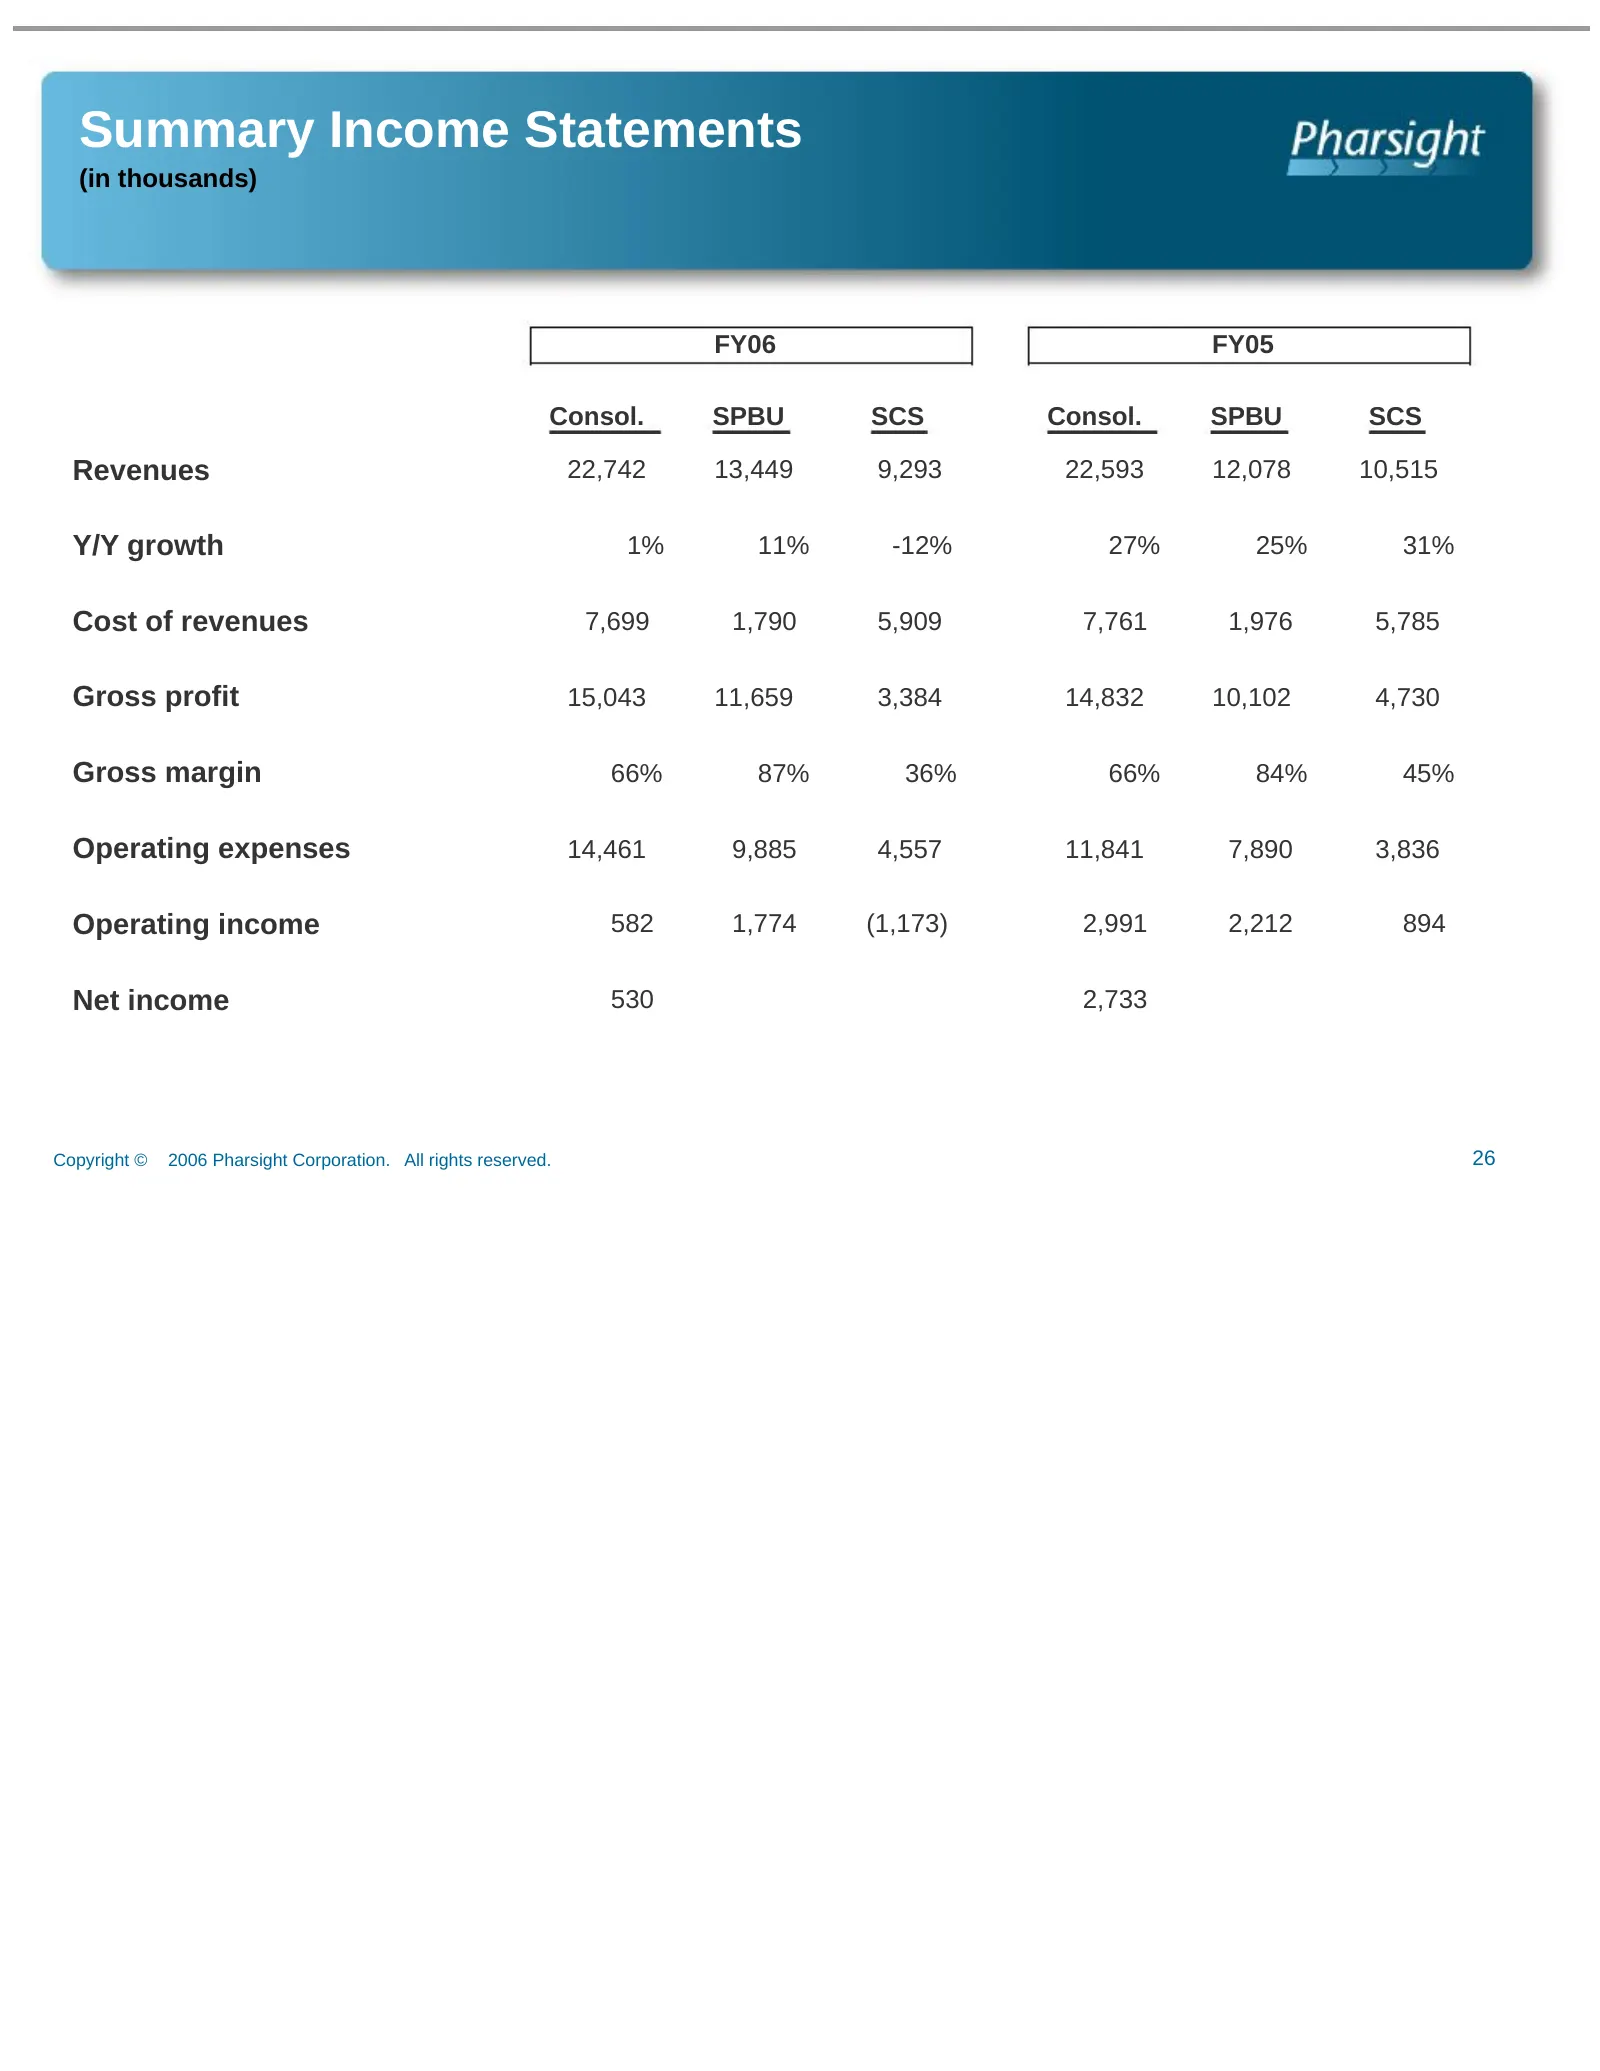
Summary Income Statements (in thousands) FY06 FY05 Consol. SPBU SCS Consol. SPBU SCS Revenues 22,742 13,449 9,293 22,593 12,078 10,515 Y/Y growth 1% 11% -12% 27% 25% 31% Cost of revenues 7,699 1,790 5,909 7,761 1,976 5,785 Gross profit 15,043 11,659 3,384 14,832 10,102 4,730 Gross margin 66% 87% 36%
Slide 27: Annual Revenue by Business Unit
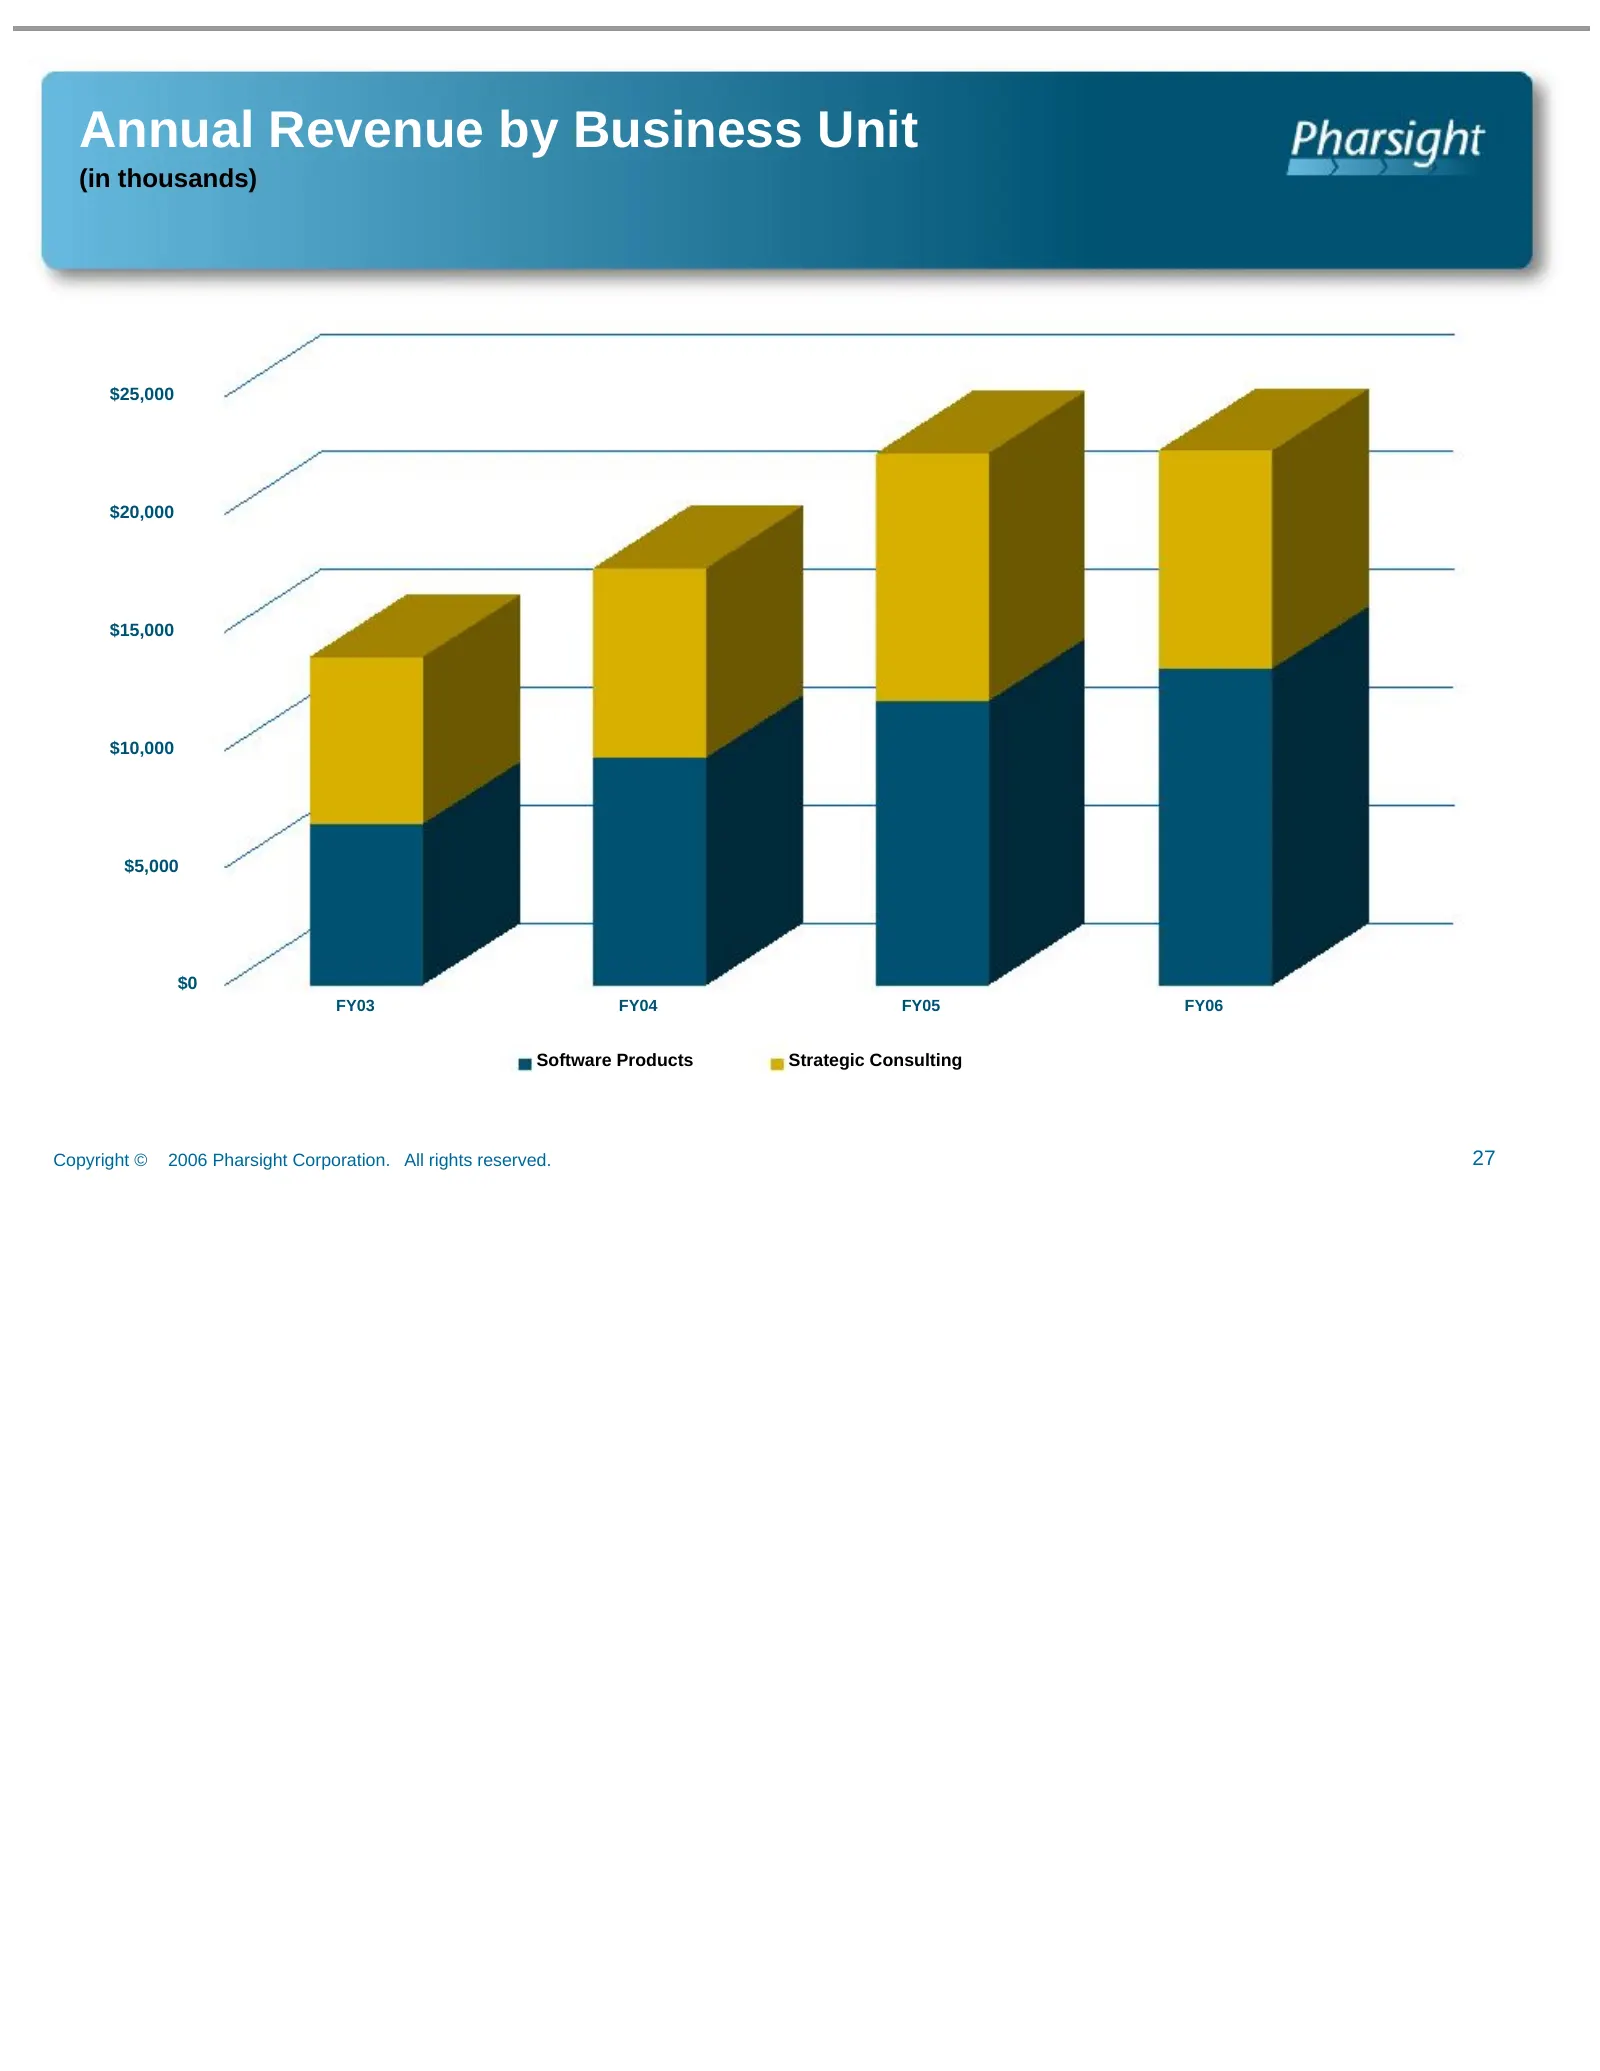
Annual Revenue by Business Unit (in thousands) $25,000 $20,000 $15,000 $10,000 $5,000 $0 FY03 FY04 FY05 FY06 Software Products Strategic Consulting Copyright © 2006 Pharsight Corporation. All rights reserved. 27
Slide 28: LTM Qtrly. Revenue by Business Unit
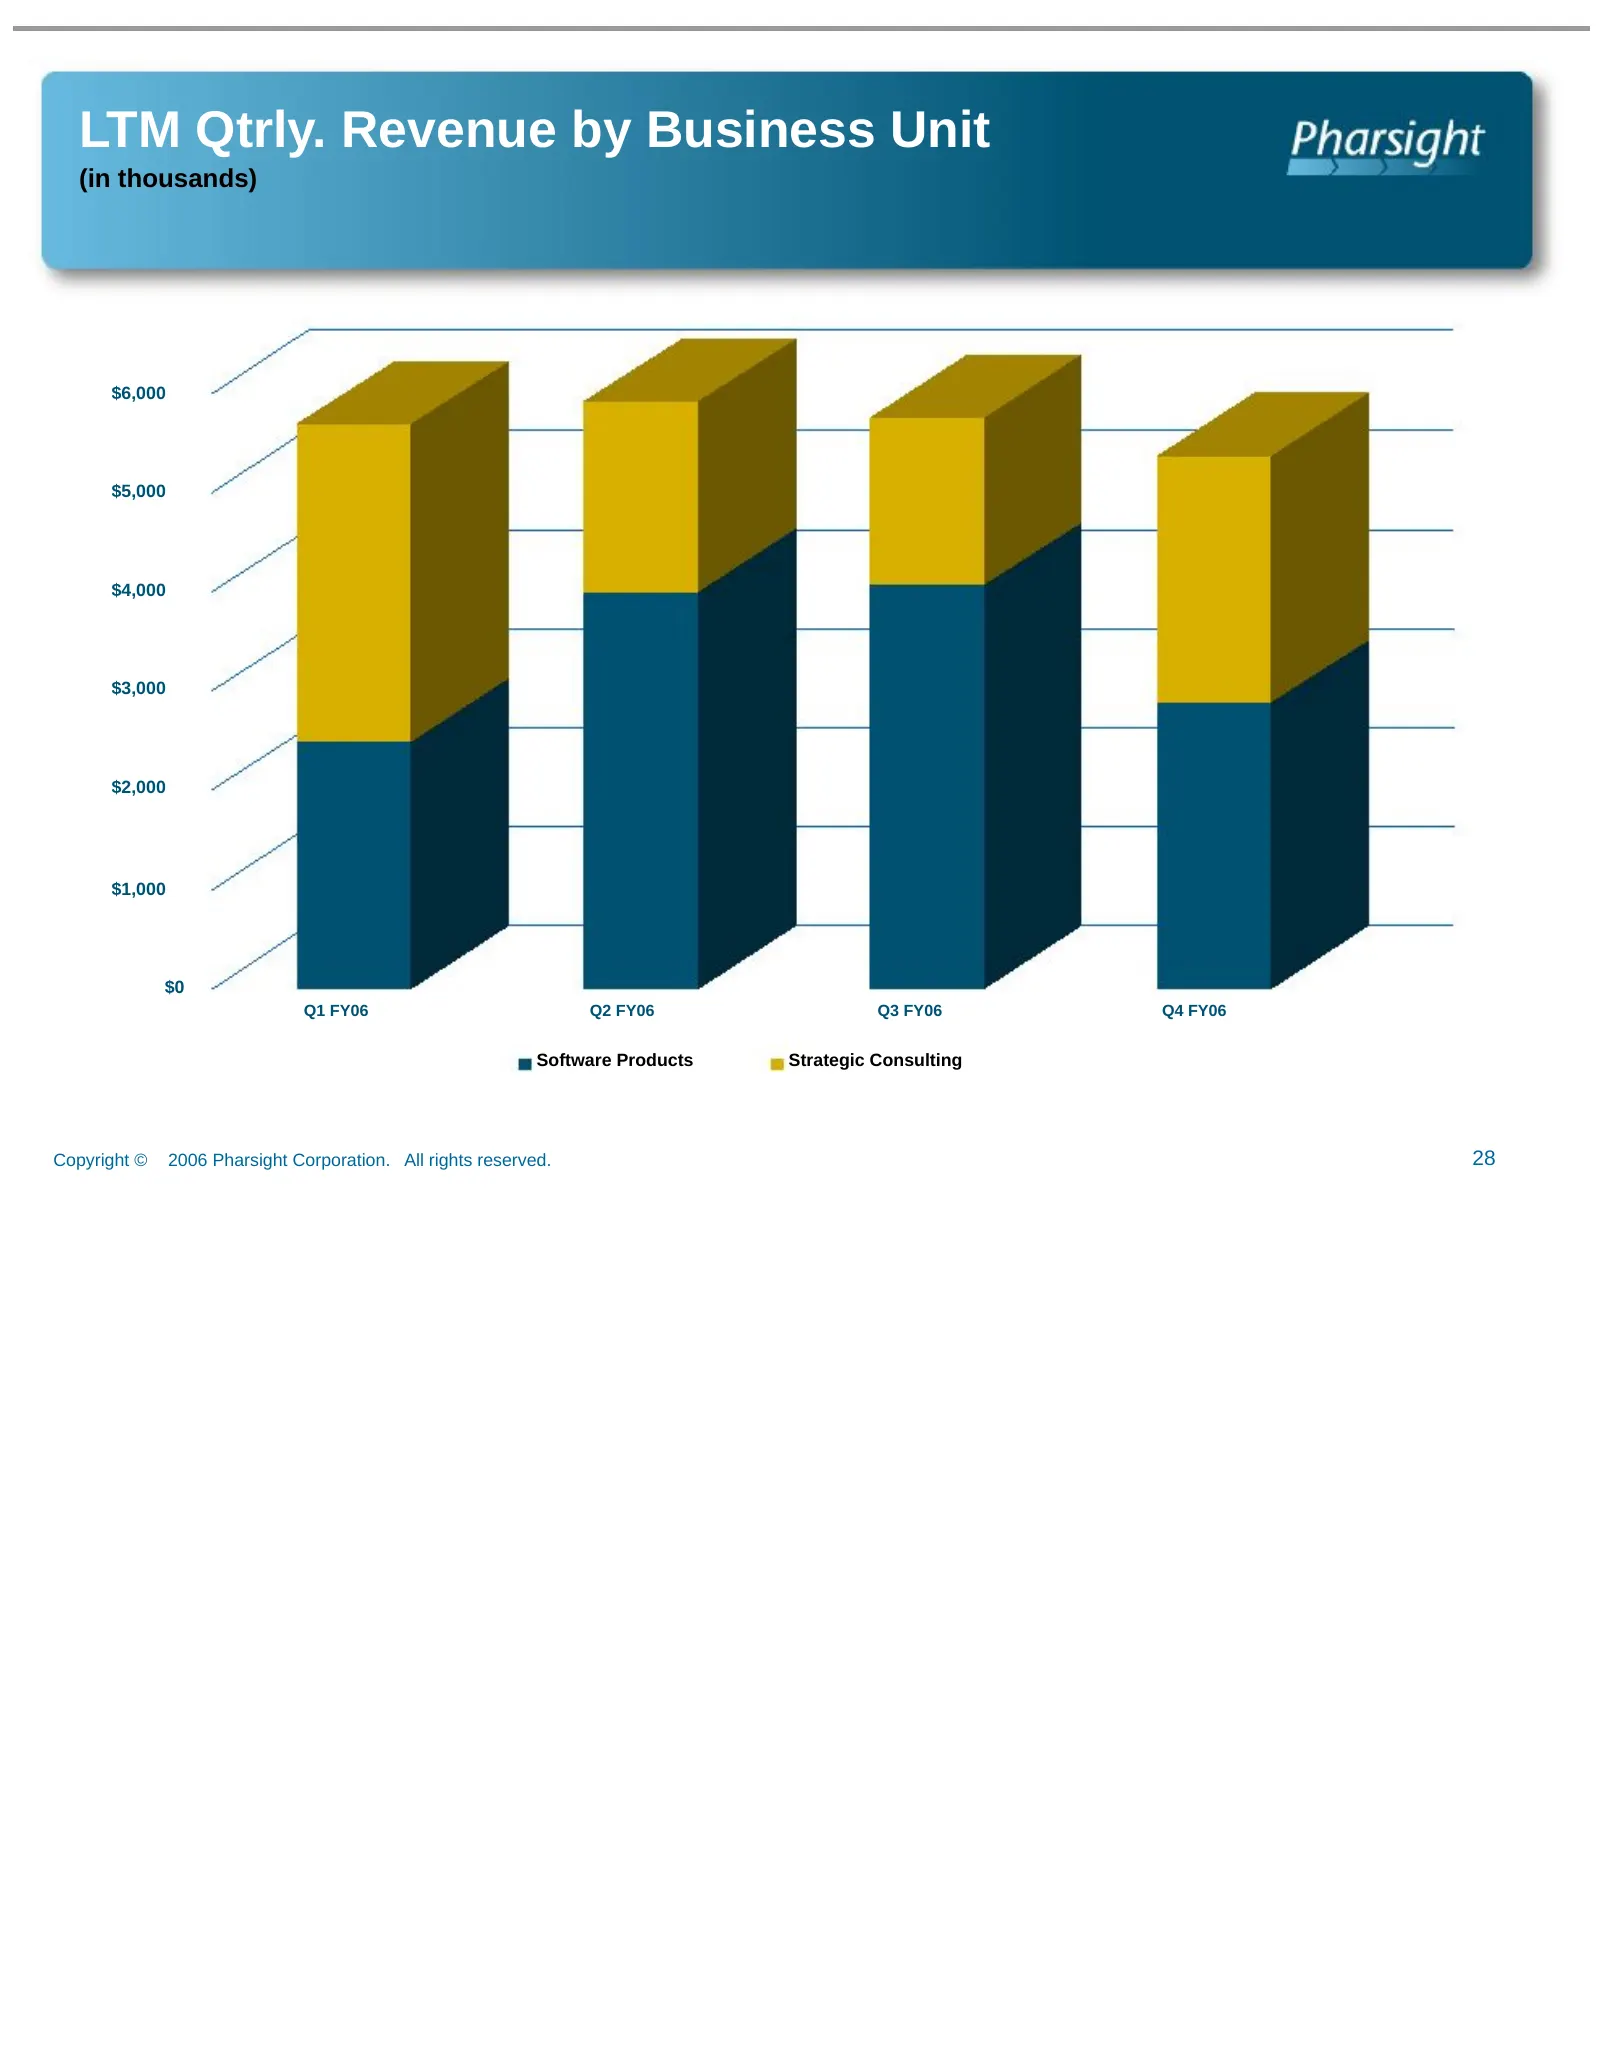
LTM Qtrly. Revenue by Business Unit (in thousands) $6,000 $5,000 $4,000 $3,000 $2,000 $1,000 $0 Q1 FY06 Q2 FY06 Q3 FY06 Q4 FY06 Software Products Strategic Consulting Copyright © 2006 Pharsight Corporation. All rights reserved. 28
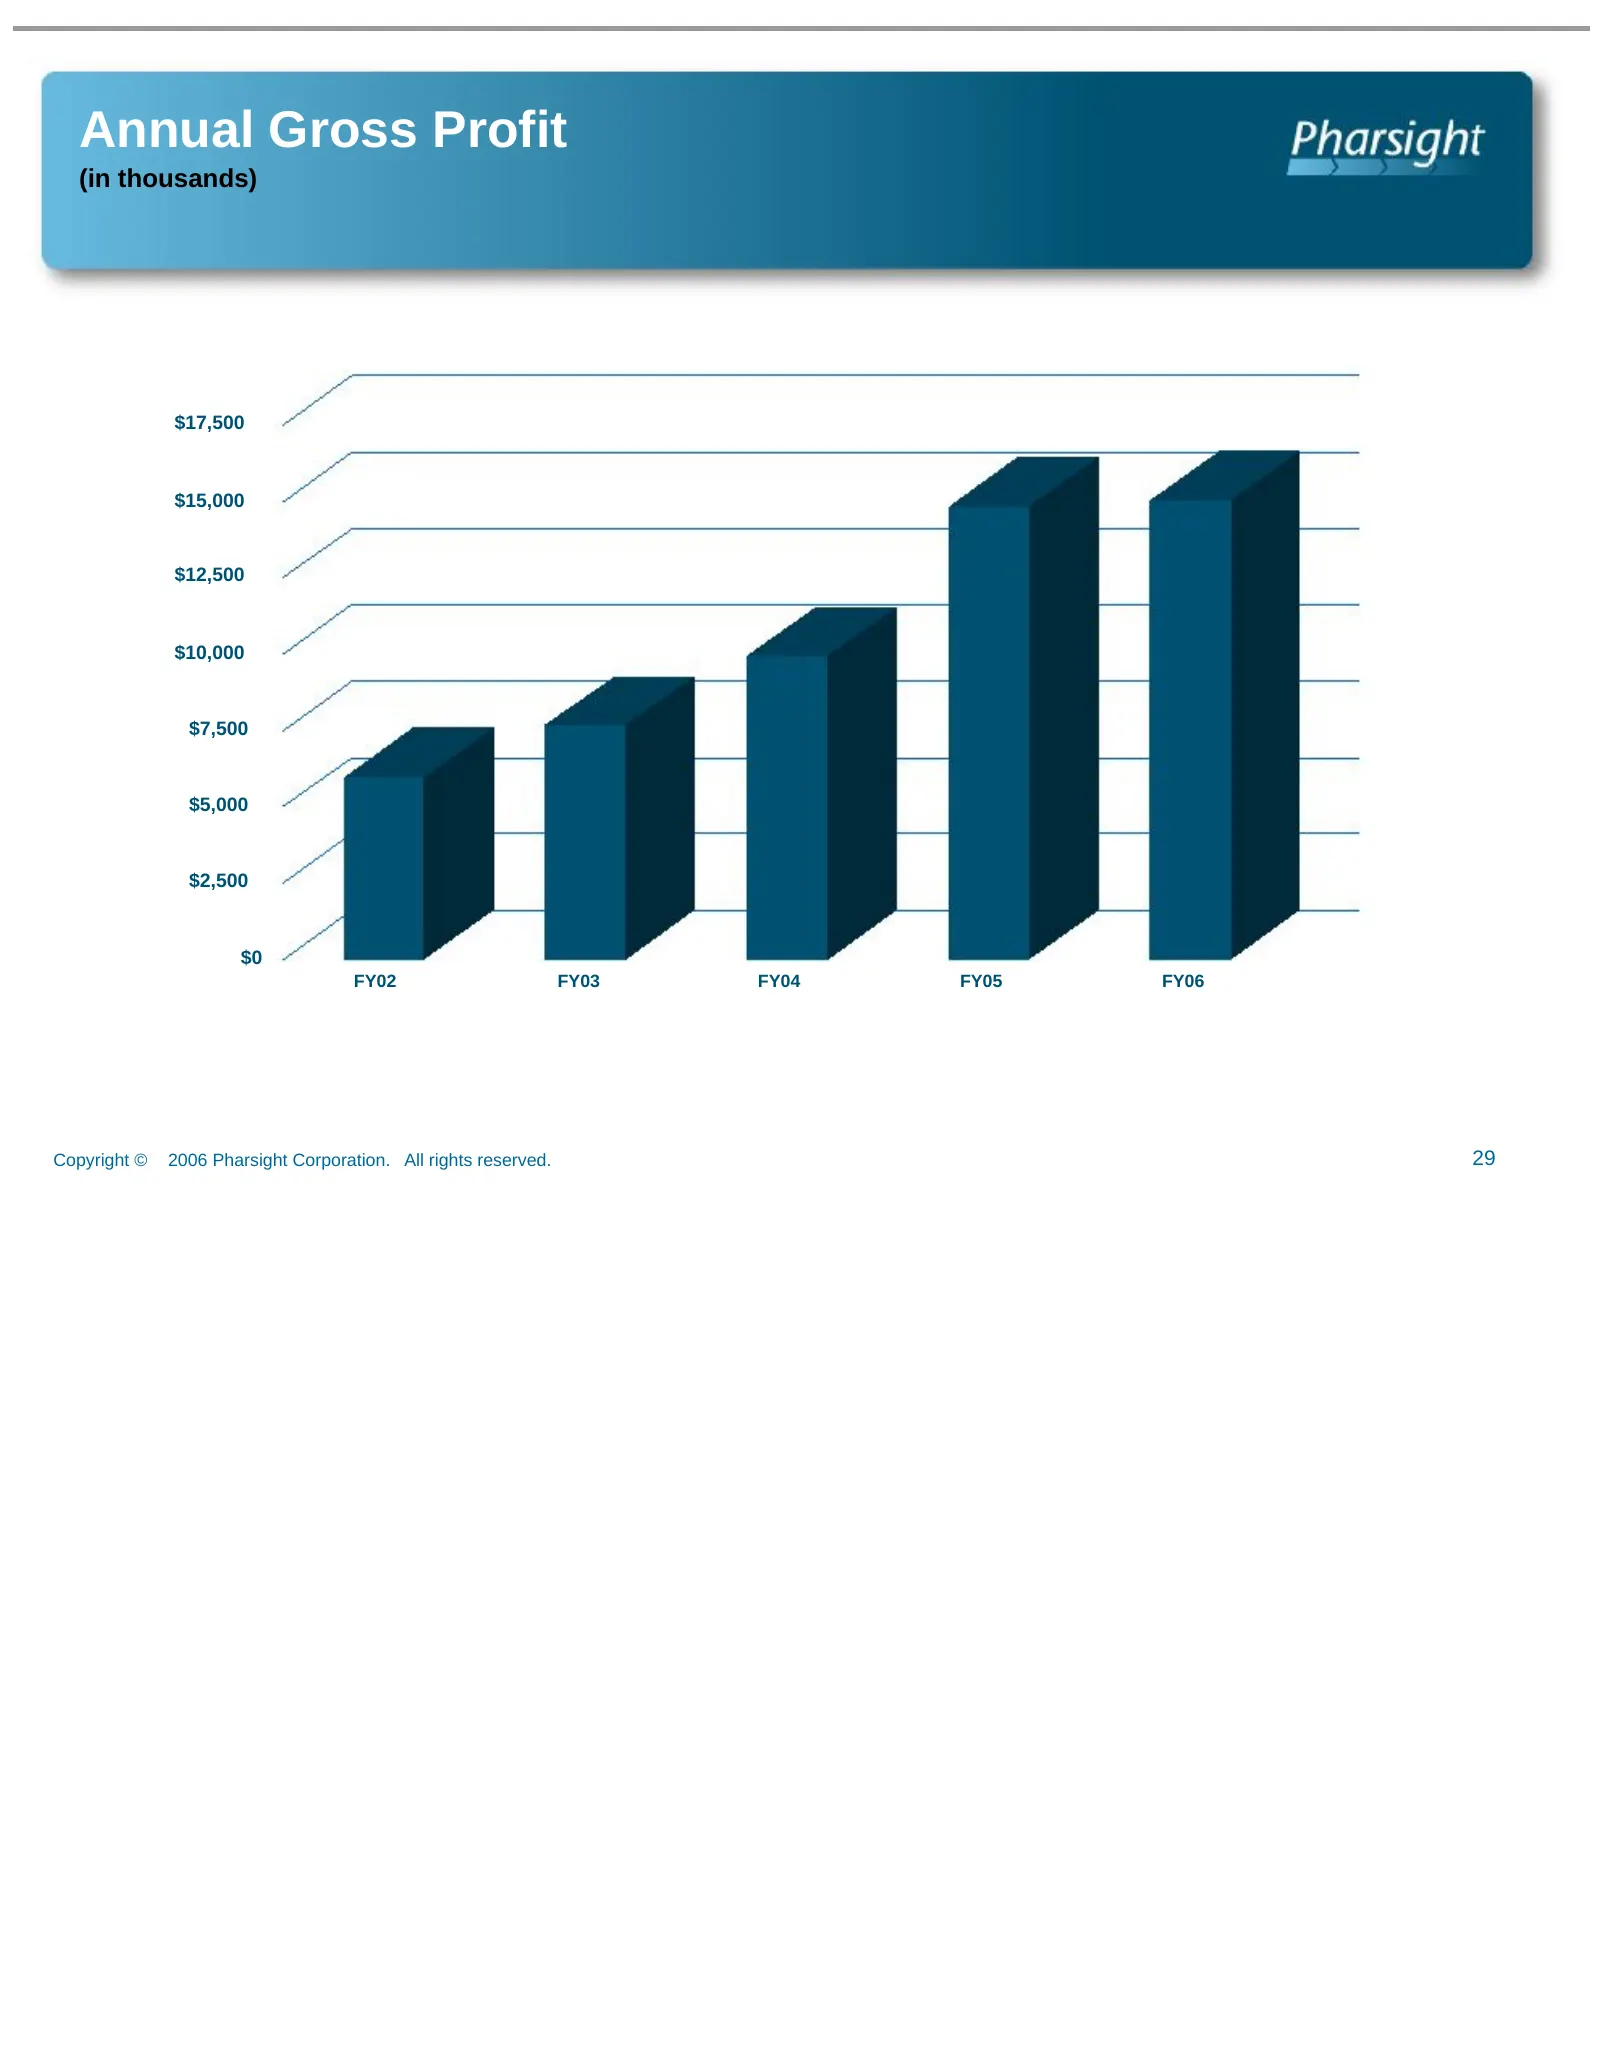
Slide 29: Annual Gross Profit
Annual Gross Profit (in thousands) $17,500 $15,000 $12,500 $10,000 $7,500 $5,000 $2,500 $0 FY02 FY03 FY04 FY05 FY06 Copyright © 2006 Pharsight Corporation. All rights reserved. 29
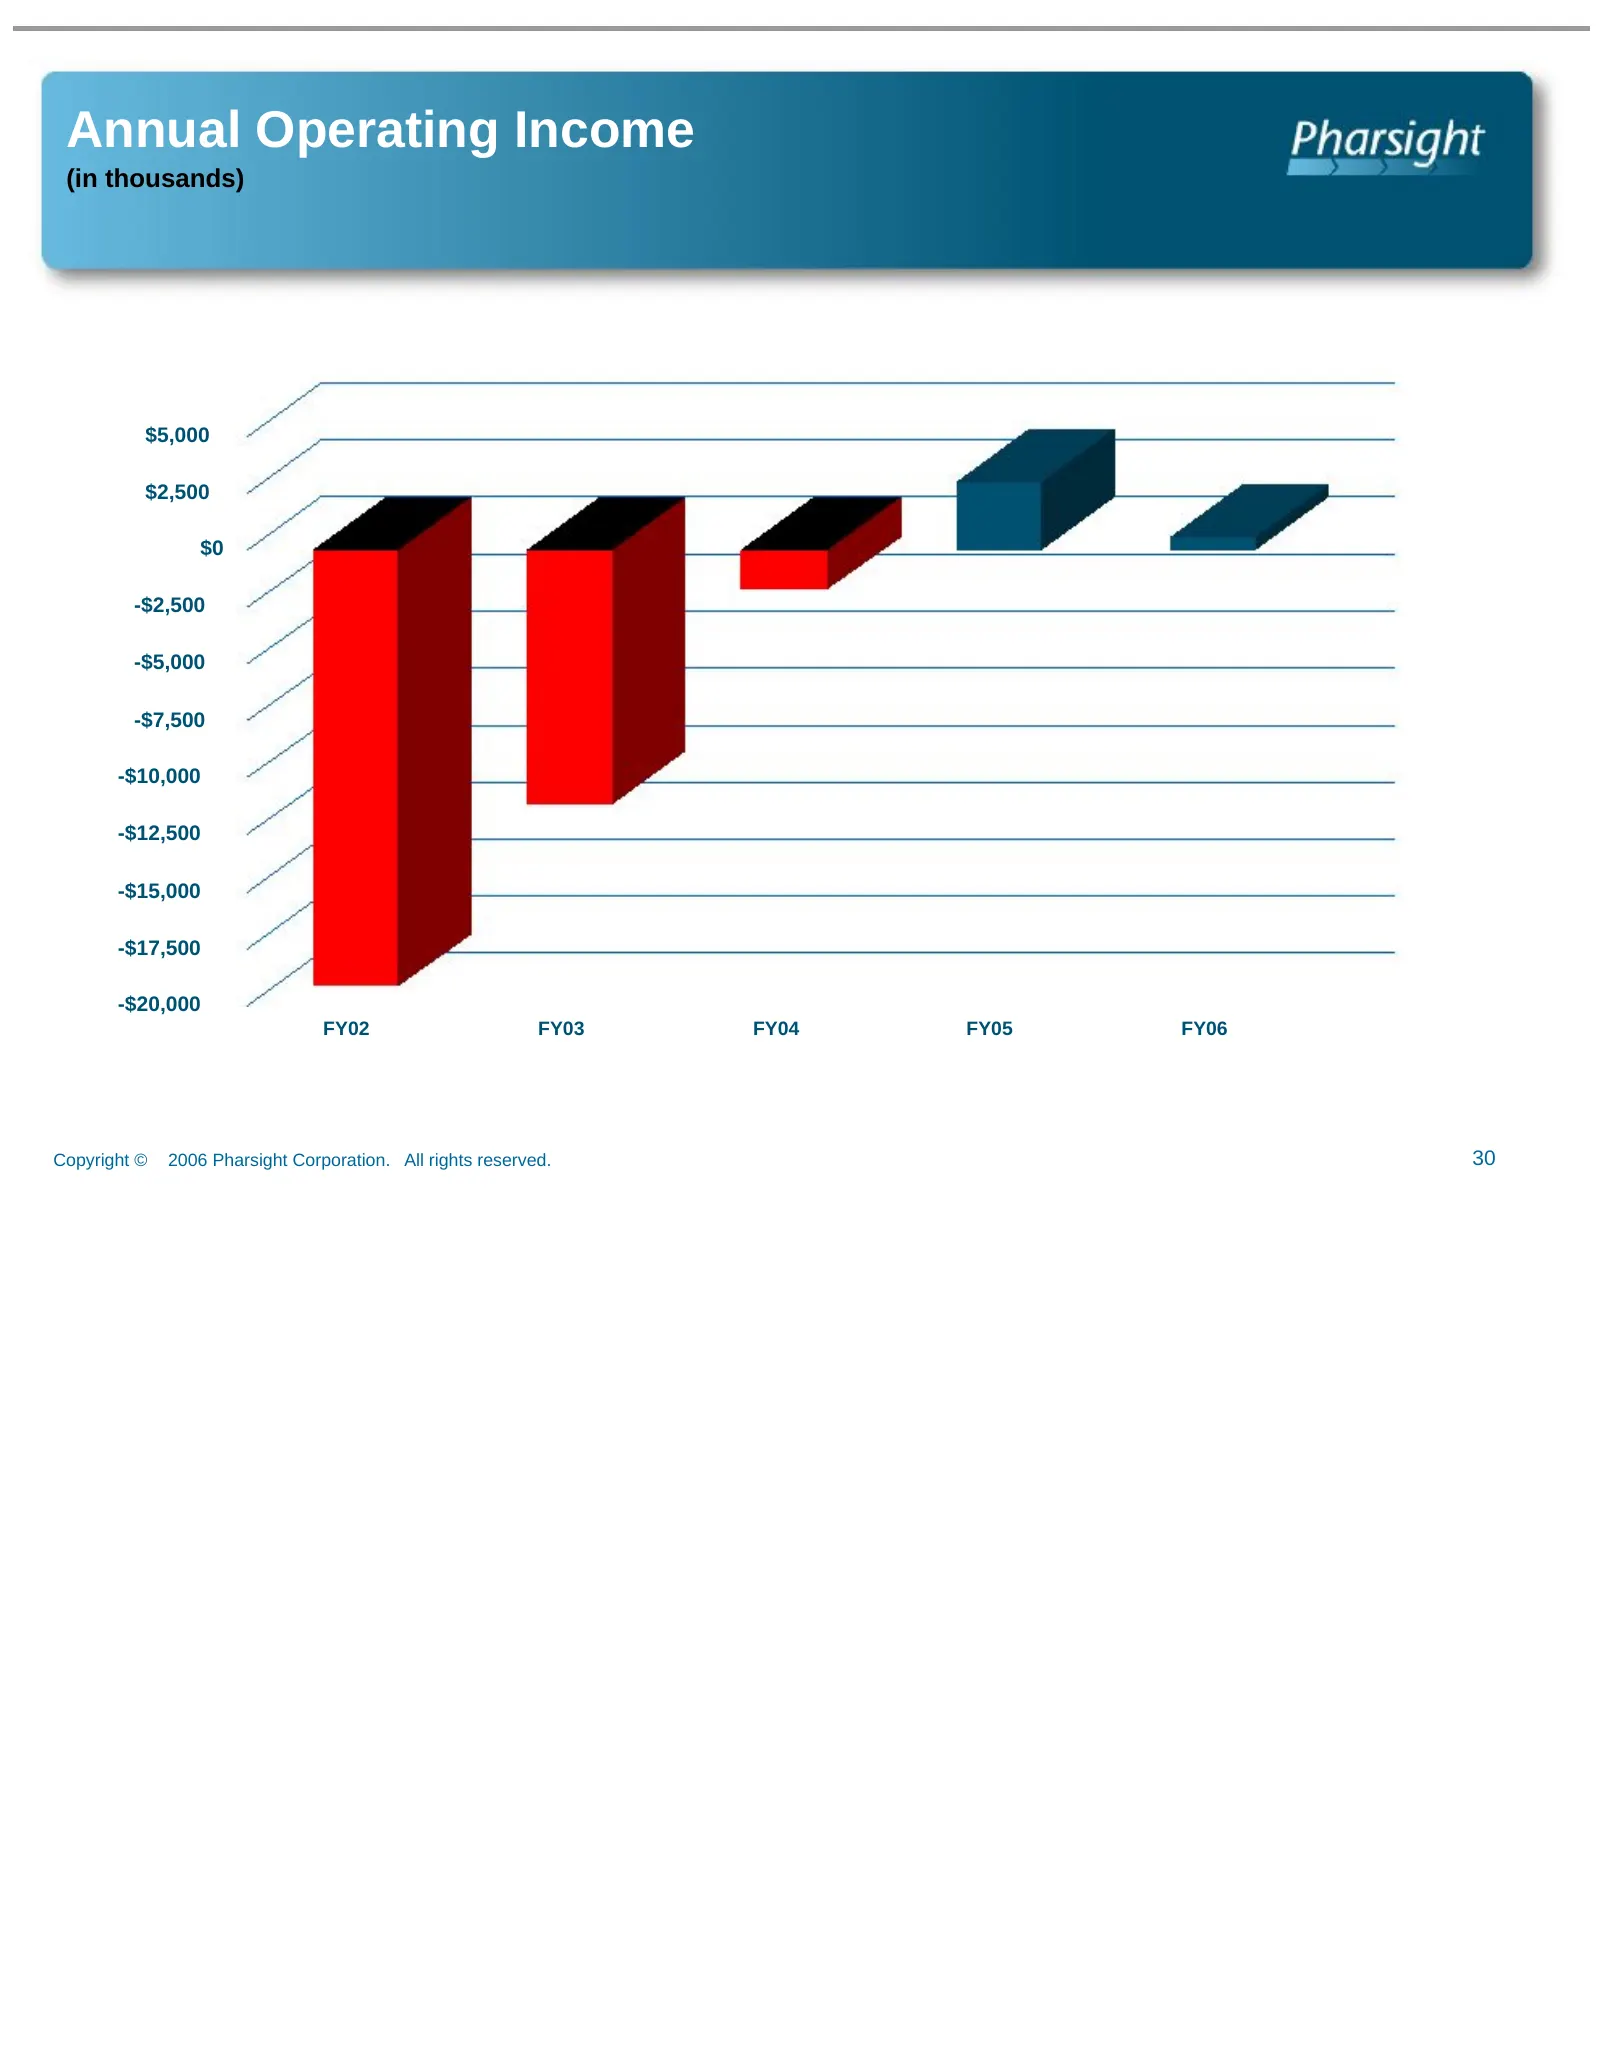
Slide 30: Annual Operating Income
Annual Operating Income (in thousands) $5,000 $2,500 $0 -$2,500 -$5,000 -$7,500 -$10,000 -$12,500 -$15,000 -$17,500 -$20,000 FY02 FY03 FY04 FY05 FY06 Copyright © 2006 Pharsight Corporation. All rights reserved. 30
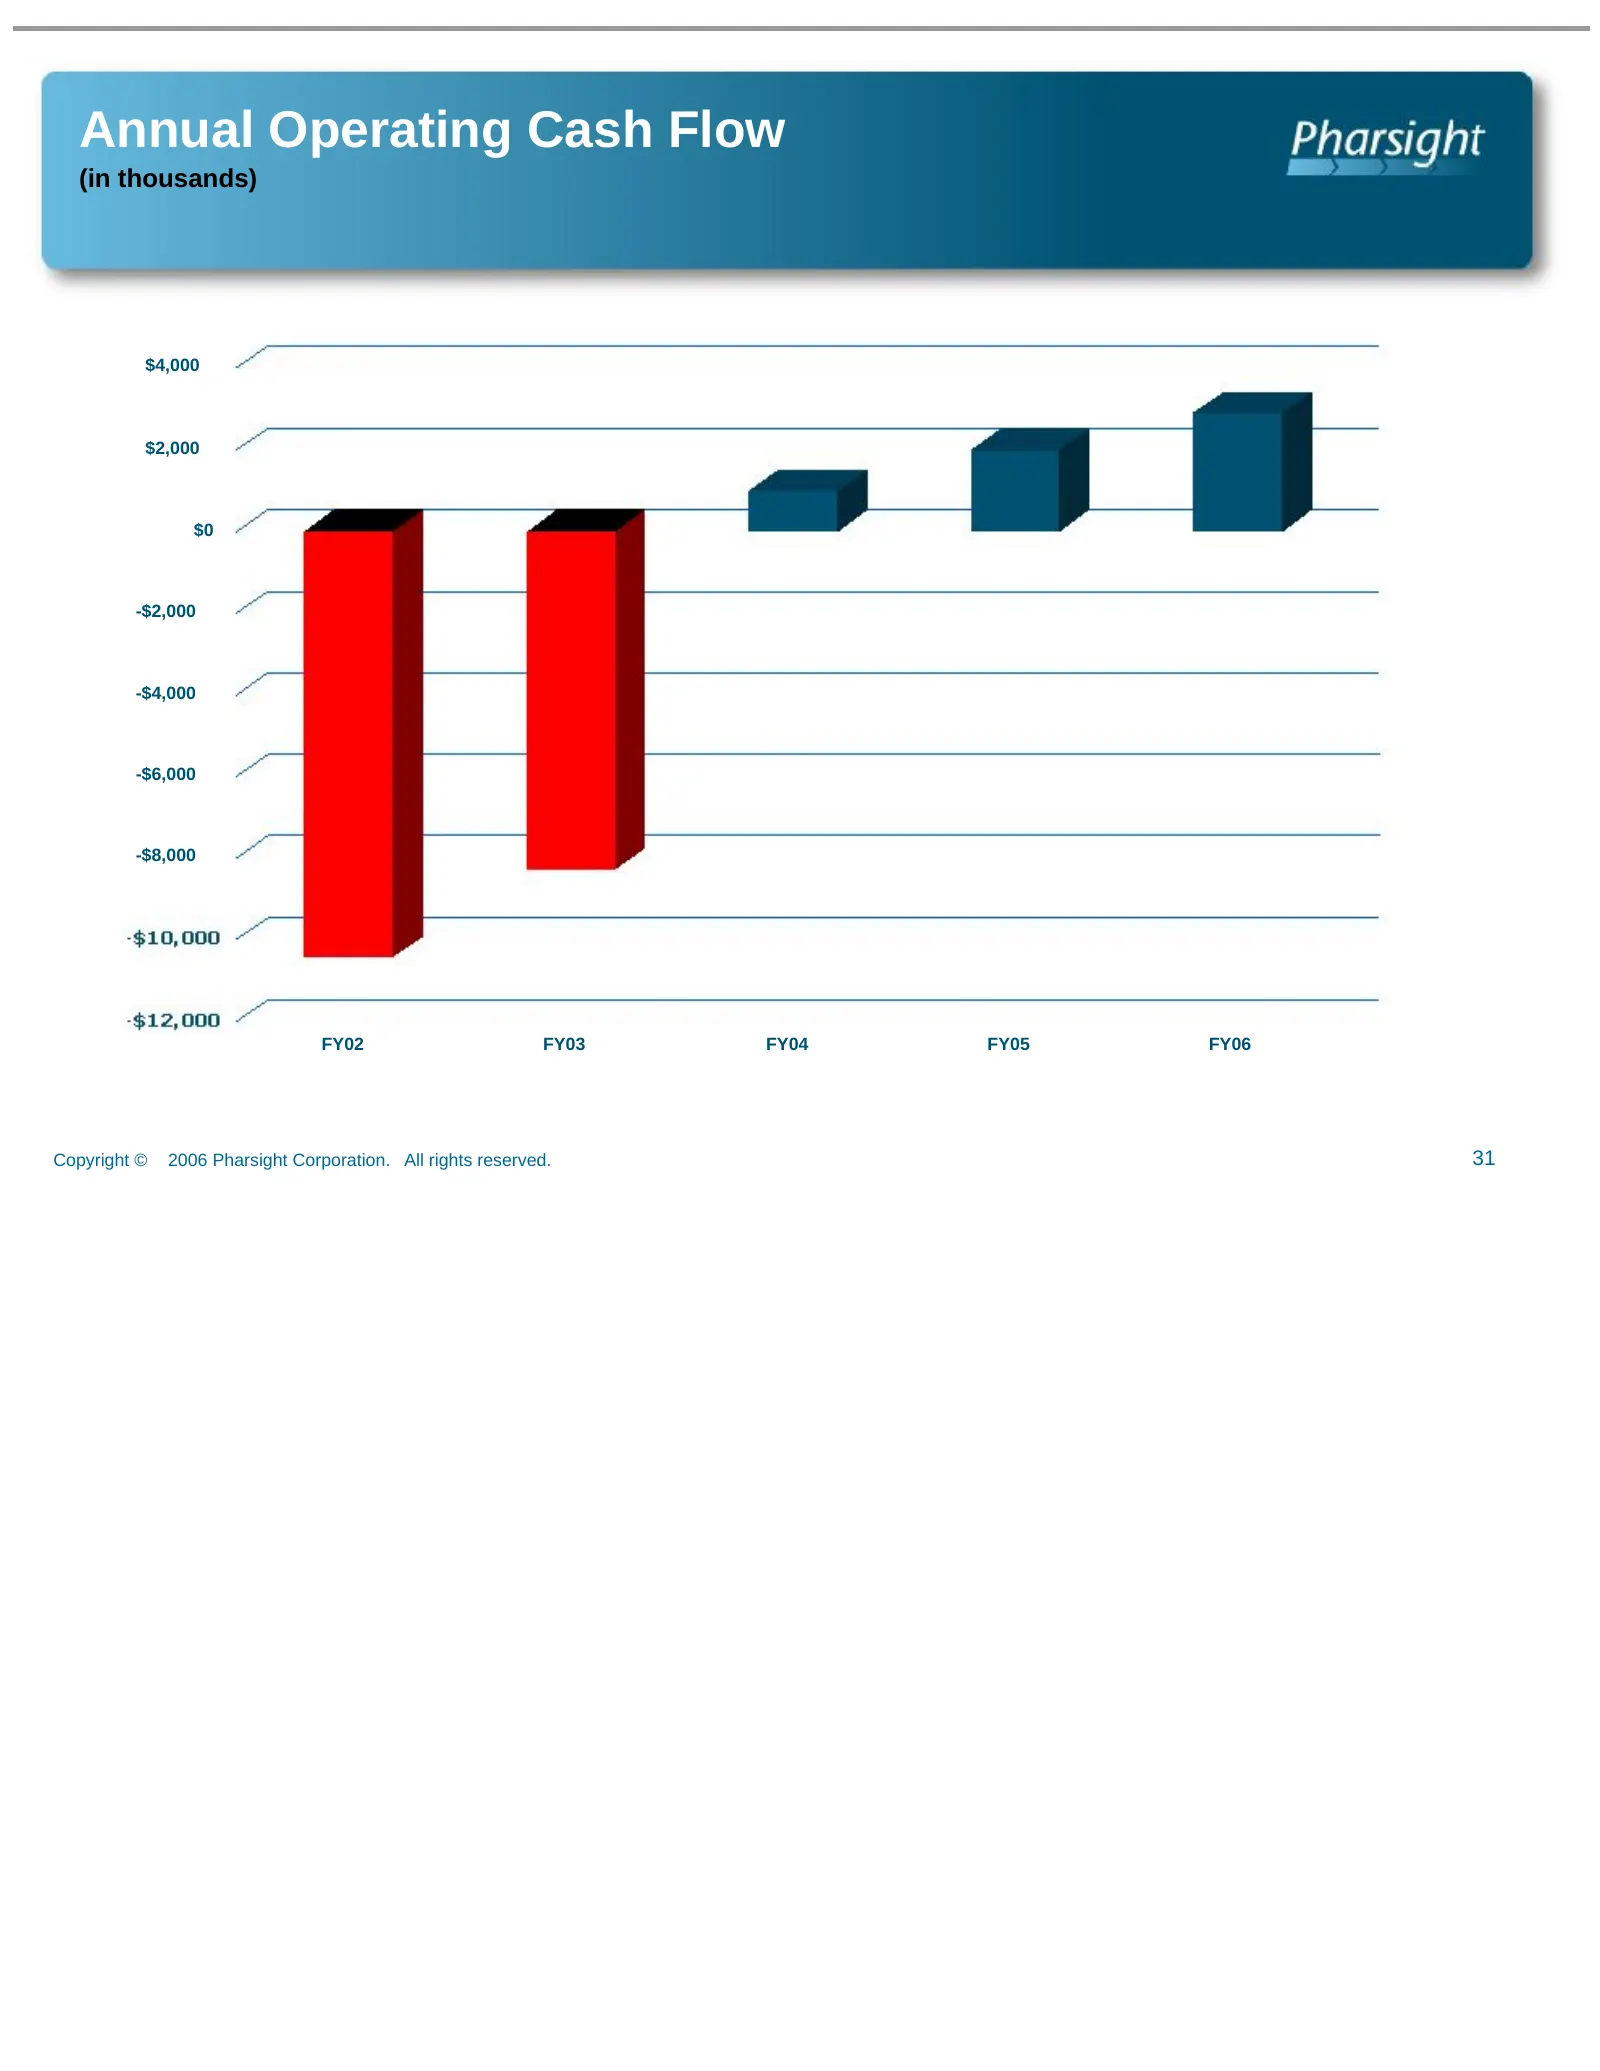
Slide 31: Annual Operating Cash Flow
Annual Operating Cash Flow (in thousands) $4,000 $2,000 $0 -$2,000 -$4,000 -$6,000 -$8,000 FY02 FY03 FY04 FY05 FY06 Copyright © 2006 Pharsight Corporation. All rights reserved. 31
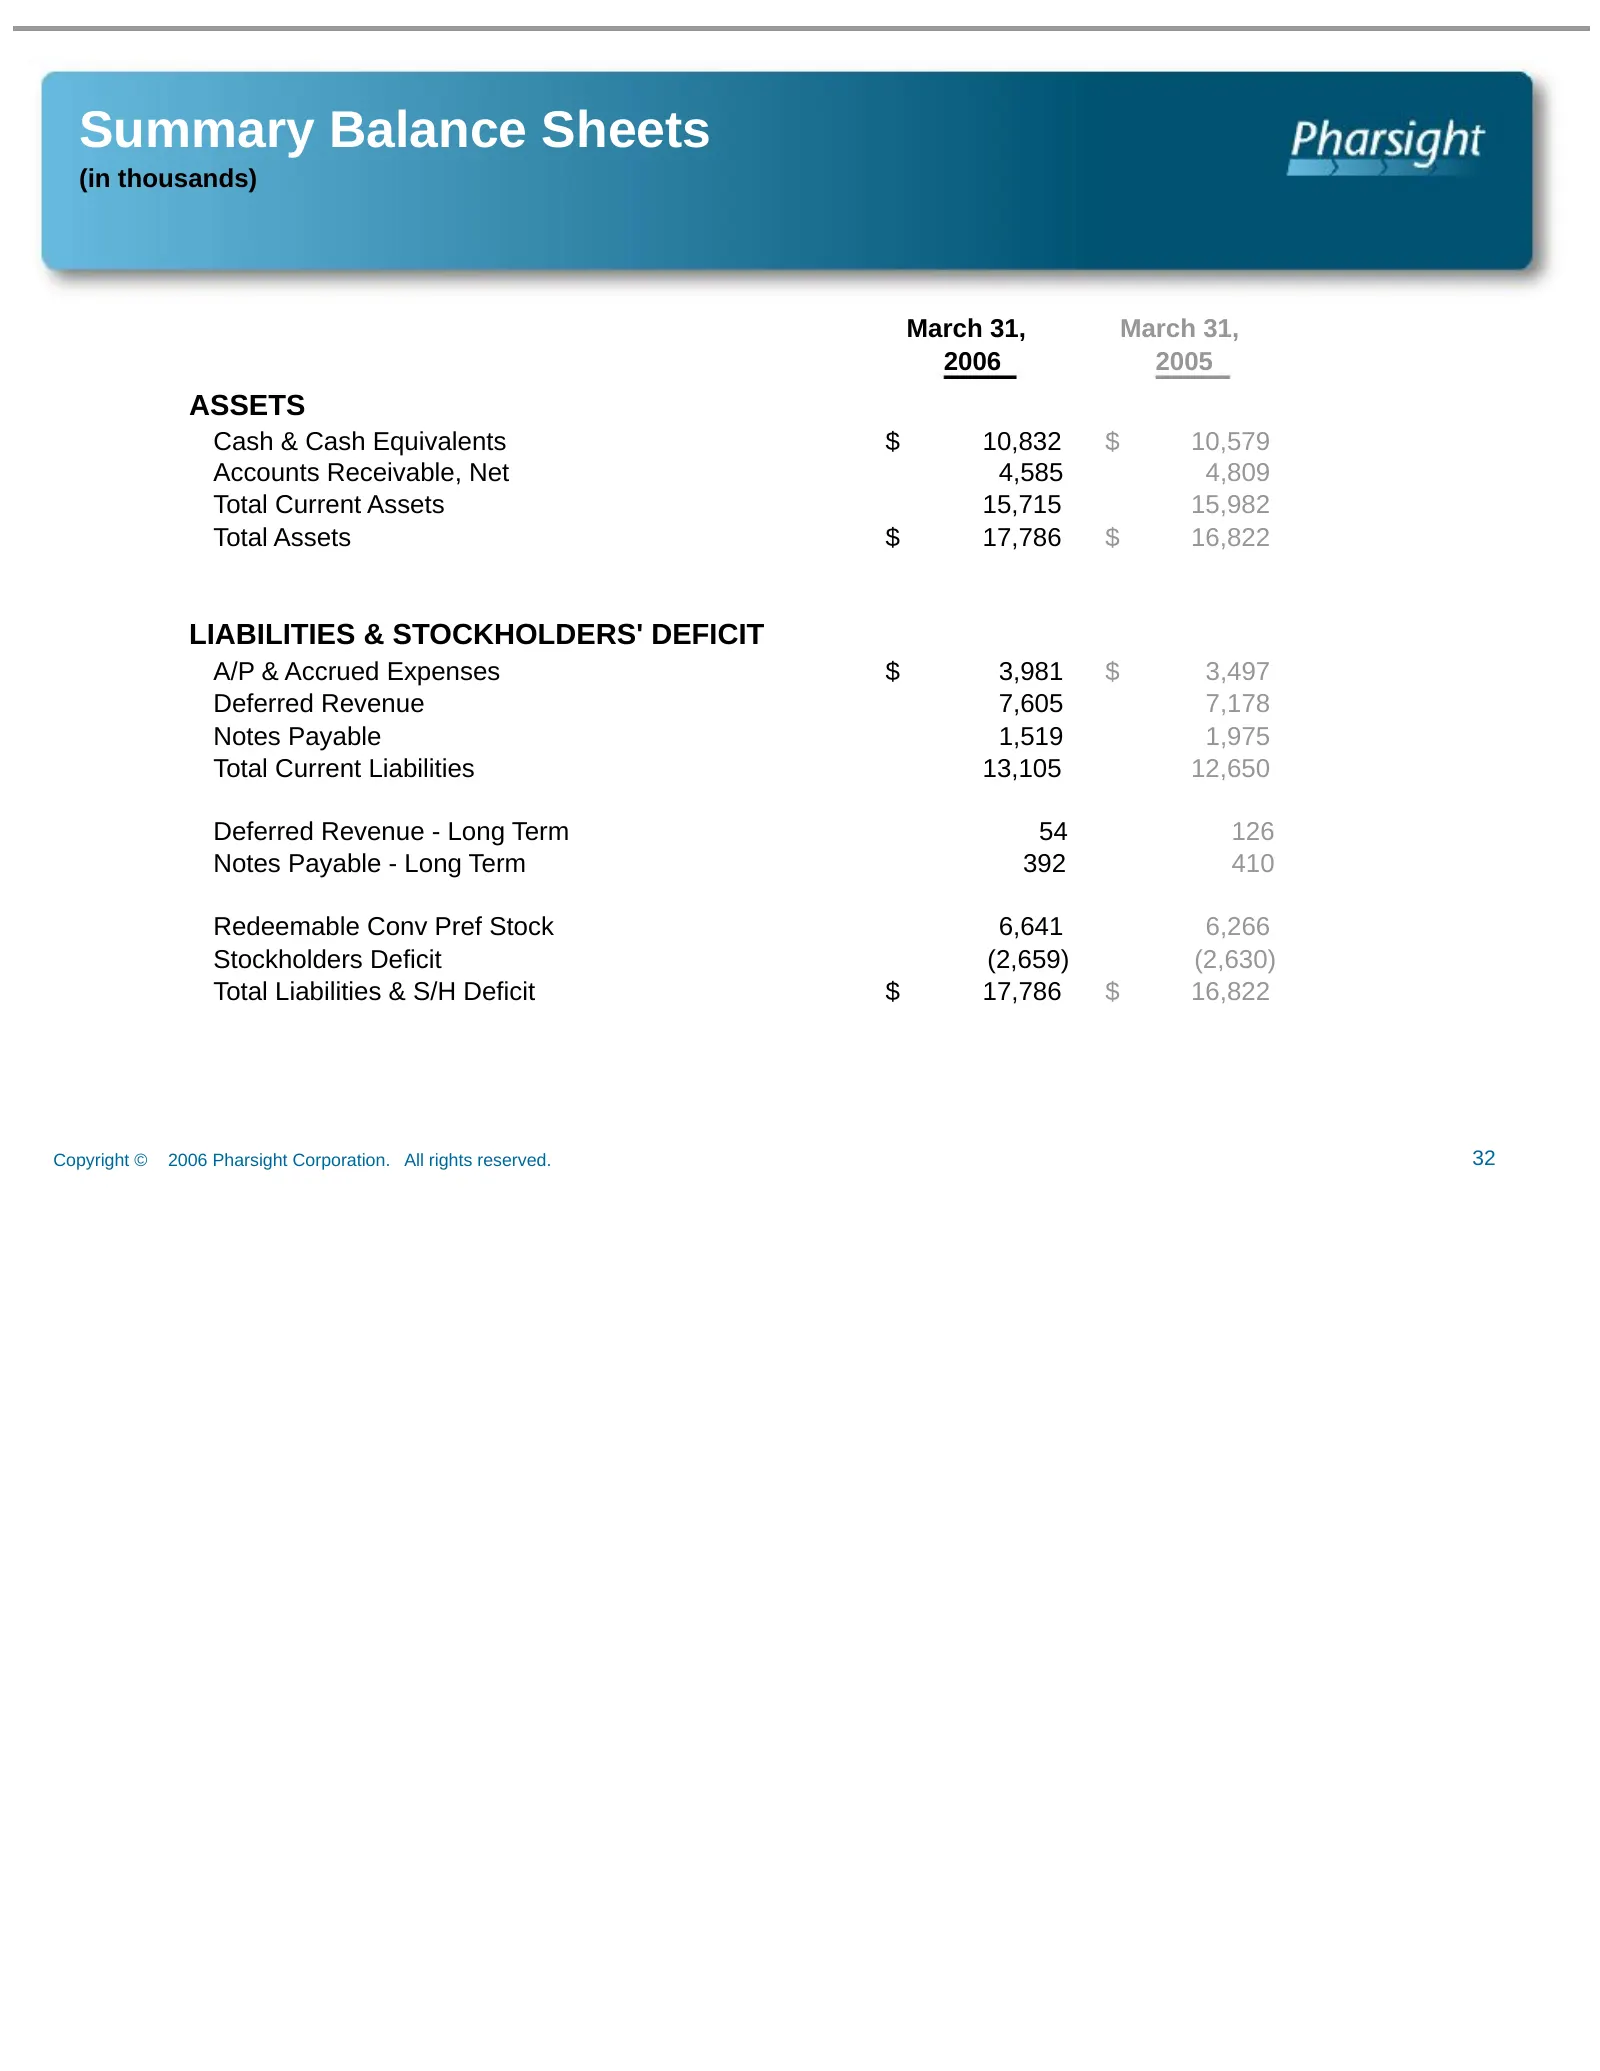
Slide 32: Summary Balance Sheets
Summary Balance Sheets (in thousands) March 31, March 31, 2006 2005 ASSETS Cash & Cash Equivalents $ 10,832 $ 10,579 Accounts Receivable, Net 4,585 4,809 Total Current Assets 15,715 15,982 Total Assets $ 17,786 $ 16,822 LIABILITIES & STOCKHOLDERS' DEFICIT A/P & Accrued Expenses $ 3,981 $ 3,497 Defer
Slide 33: Equity Overview
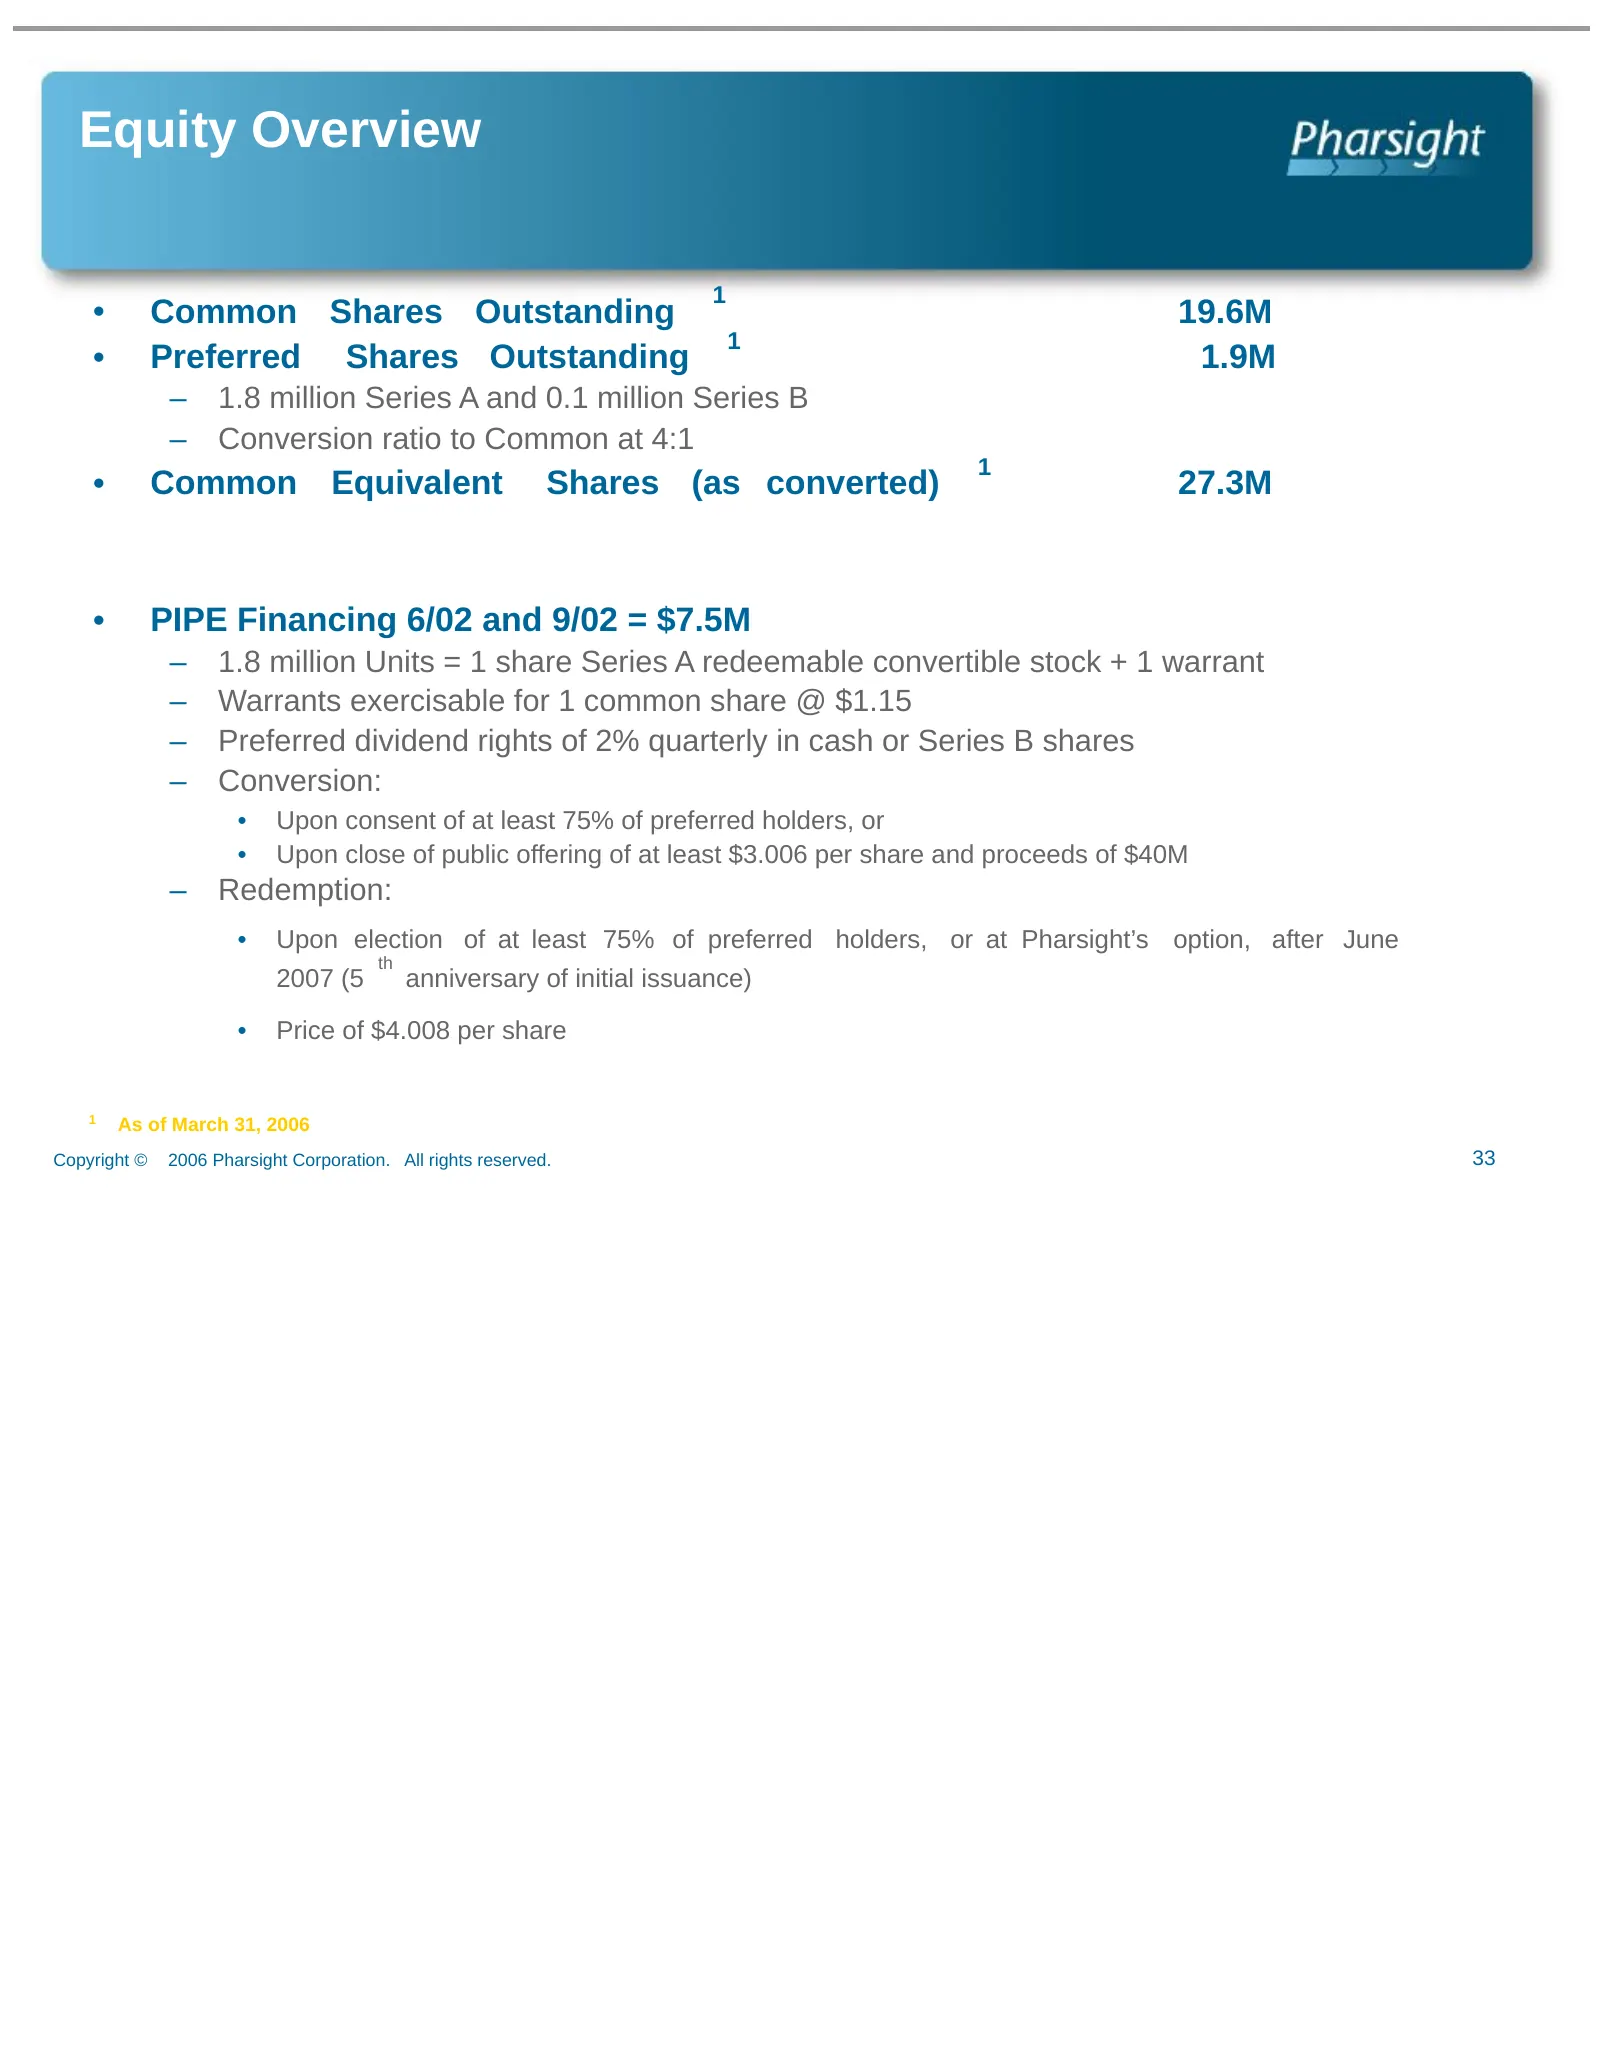
Equity Overview 1 • Common Shares Outstanding 19.6M 1 • Preferred Shares Outstanding 1.9M – 1.8 million Series A and 0.1 million Series B – Conversion ratio to Common at 4:1 1 • Common Equivalent Shares (as converted) 27.3M • PIPE Financing 6/02 and 9/02 = $7.5M – 1.8 million Units = 1 share Series
Slide 34: Summary
Summary • Current Pharma Market Trends Look Favorable… • Increasing Mindshare for Quantitative-Based Modeling & Simulation… • FDA's call for more modeling and simulation in the Critical Path Initiative… • Financially Stable & Healthy Business Model… All Support Our Drive Towards Expanding Pharsight’
Slide 35: Notices
Notices Proprietary Notice All contents Copyright ©2006 Pharsight Corporation. All rights reserved. The copyright for this document is owned by Pharsight Corporation. No part of this document may be reproduced or transmitted in any form or by any means, electronic or mechanical, including photocopyi

Slide 36: Pharsight
Pharsight Pharsight
Source: SEC EDGAR · 8-K filed Jun 6, 2006
More decks from Pharsight Corp
 Q4 2007 Earnings Presentation45 slides · May 14, 2007
 Investor Presentation (January 2007)41 slides · Jan 26, 2007
 Q2 2007 Earnings Presentation33 slides · Nov 30, 2006
 Q1 FY2007 Earnings Presentation37 slides · Aug 3, 2006
 Investor Presentation (February 2006)31 slides · Feb 2, 2006
 Investor Presentation (August 2005)39 slides · Aug 2, 2005