Pharsight — Investor Presentation (February 2006)
31 slides from Pharsight's investor presentation, Feb 2, 2006

Slide 1: Pharsight Corporation Investor Presentation February 2006
Pharsight Corporation Investor Presentation February 2006 Shawn O’Connor President & CEO Exhibit 99.1 Confidential © Pharsight Corporation

Slide 2: Executive Team
Executive Team Shawn O’Connor President & Chief Executive Officer QRS, Diasonics Ultrasound, Peat Marwick TBH Chief Financial Officer James Hayden SVP Global Sales Accelrys, Bio-Rad Laboratories, Raytheon Mark Hovde SVP Marketing Hovde Associates, Fast Track Systems, DataEdge Mona Sowiski SVP Drug D
Slide 3: Pharsight
Pharsight
Slide 4: Our Market Opportunity: Development Expenditure Estimates
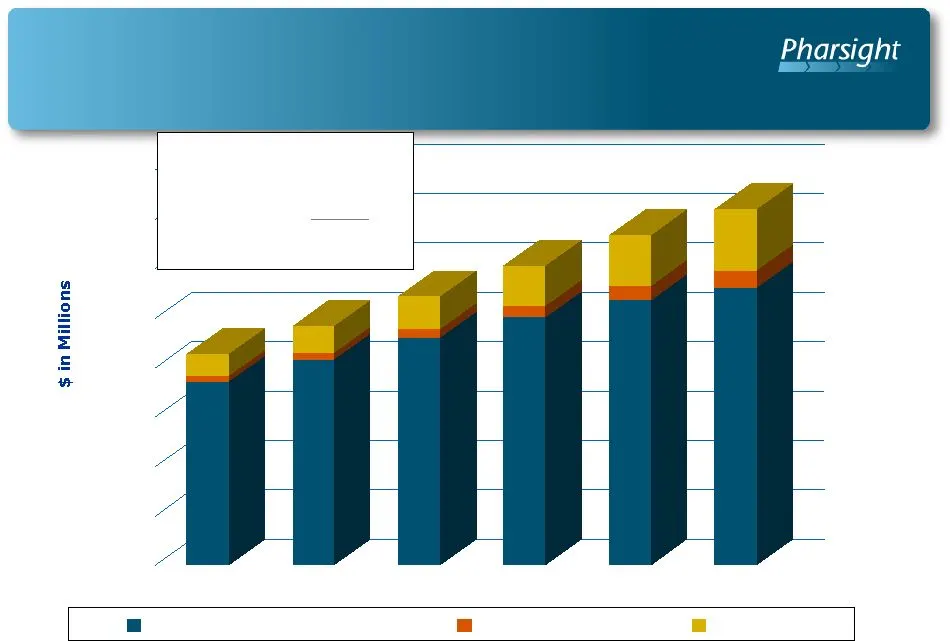
Our Market Opportunity: Development Expenditure Estimates $0 $10,000 $20,000 $30,000 $40,000 $50,000 $60,000 $70,000 $80,000 Branded Pharma Generics Biotech 2003 – 2008 CAGR Branded Pharma 8.6% Generics 22.6% Biotech 2.7% Total Pharma 11.0% Development Expenditure by Segment & Product Development Ph

Slide 5: Return on Investment Example
Return on Investment Example Aventis turned to a computer model from … Pharsight. Using its own animal and human test data, Aventis was able to simulate later-stage clinical trials. Based on that simulation, “we stopped funding development of the compound. The ratio between the therapeutic benefit a

Slide 6: Return on Investment Example
Return on Investment Example “Within 2 years of (implementing Pharsight’s WinNonlin automation and other measures) the two people conducting the routine pharmacokinetic studies had completed 45 studies in 1 year.” (previous staff of 19 for the same work) “The cycle time to issue final reports decrea

Slide 7: Software Products
Software Products Confidential © Pharsight, Inc.
Slide 8: Overview of Key Software Offerings
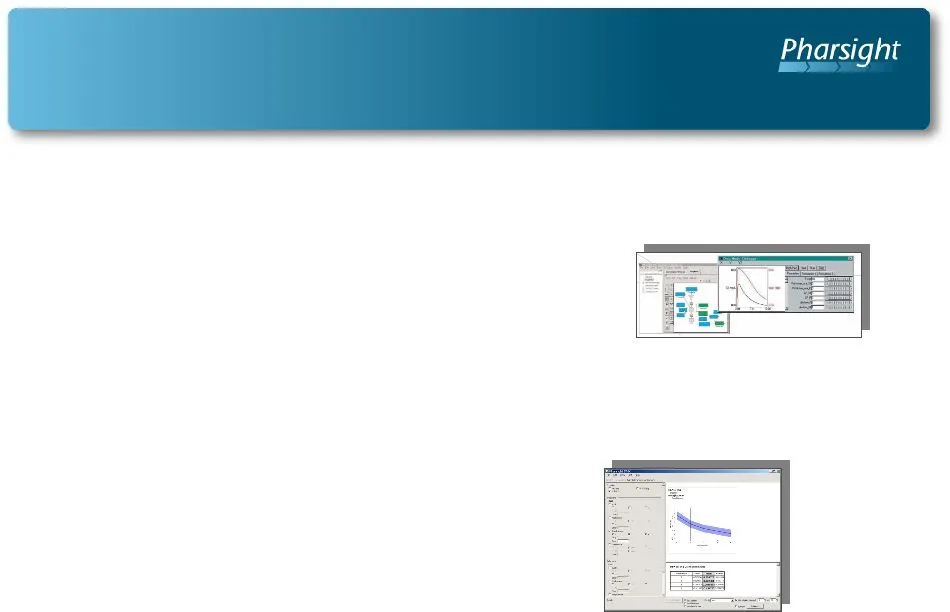
Overview of Key Software Offerings • Desktop Software Products – WinNonlin ® (“WNL™”) • Industry Standard for Pharmacokinetic (“PK”), Pharmacodynamic (“PD” ) Modeling and Non Compartmental Analysis – Trial Simulator™ (“TS2™”) • Computer Assisted Clinical Trial Design & Simulation – WinNonMix ® (“WNM
Slide 9: Key Software Offerings: WinNonlin
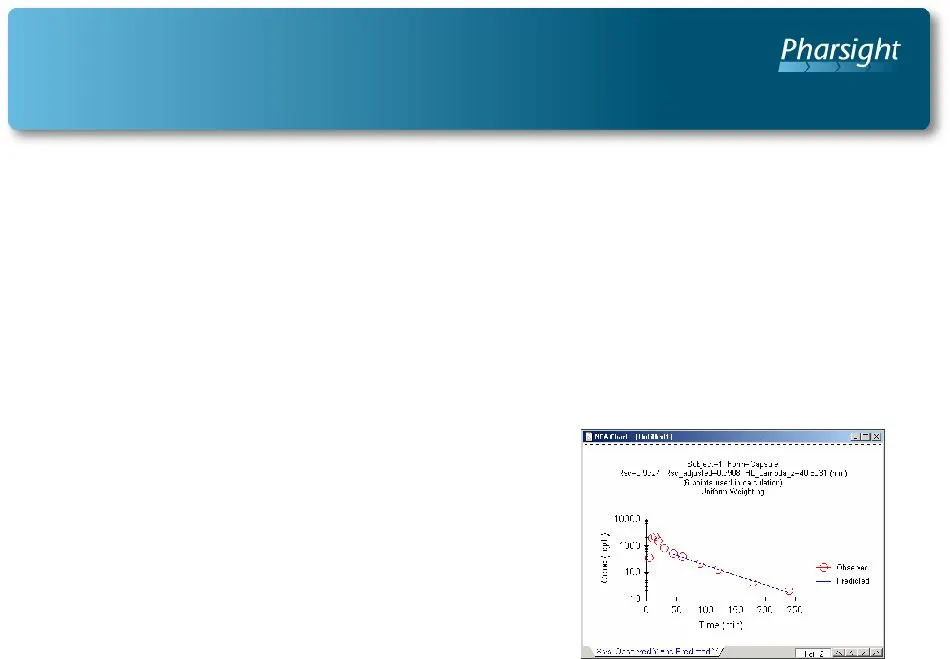
Key Software Offerings WinNonlin ® (“WNL™”) Industry Standard for Pharmacokinetic (“PK”), Pharmacodynamic (“PD ”) Modeling and Non Compartmental Analysis • Key Benefits – Used to simulate effects of different dosing regimens and changes in pharmacokinetic parameters required in regulatory submission
Slide 10: Key Software Offerings: Trial Simulator
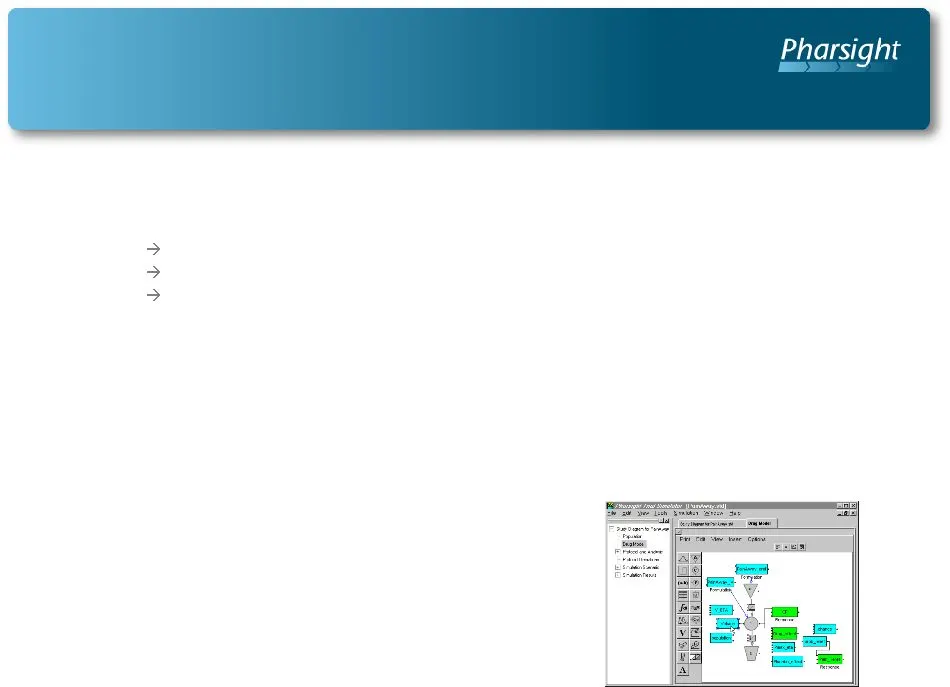
Key Software Offerings State-of-the-Art Clinical Trial Design & Simulation Software • Market Opportunity – Total opportunity estimated by Pharsight at approx $29 million 25% market share = $7 million 50% market share = $15 million 75% market share = $22 million • Key Benefits – Minimize risk of tria
Slide 11: Key Software Offerings: WinNonMix
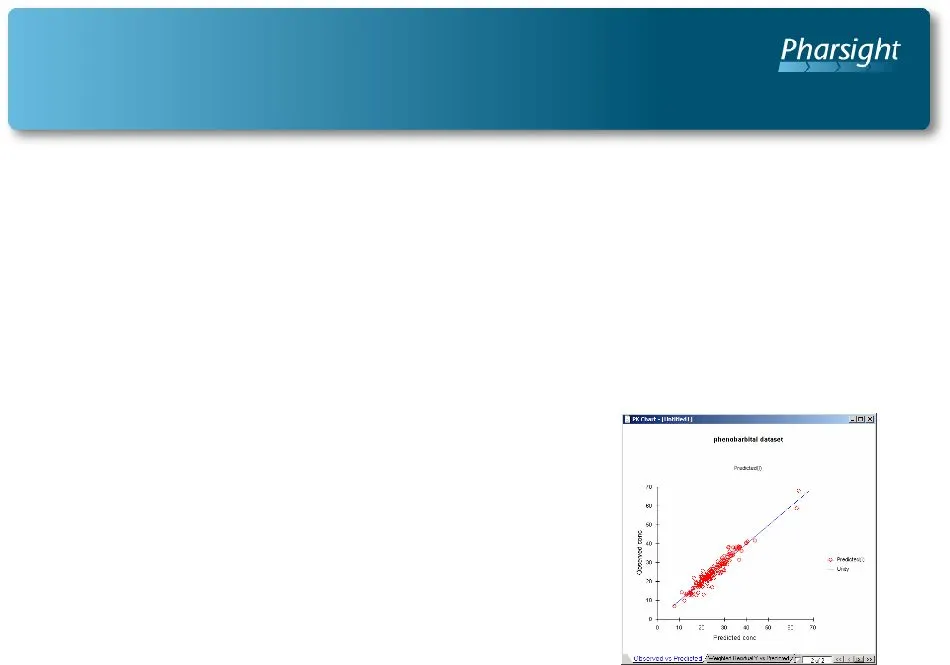
Key Software Offerings WinNonMix ® (“WNM™”) Nonlinear Mixed Effects (Population) Analysis Software Application • Key Benefits – Extensive built-in library of PK, PD and PK-PD models – NONMEM data import wizard – Built-in report-ready graphics capability – Estimation algorithms for sparse and for ric
Slide 12: Key Software Offerings: Pharsight Knowledgebase Server
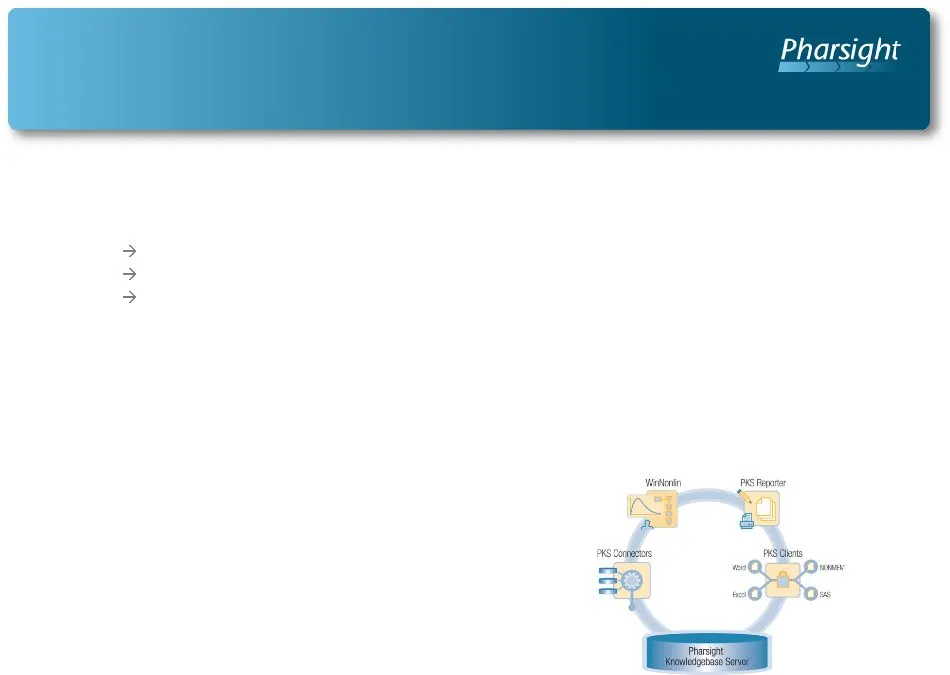
Key Software Offerings Pharsight ® Knowledgebase Server™ (“PKS™”) Enterprise Data Management Systems for Secure Storage and Management of PK/PD Data • Market Opportunity – Total opportunity estimated by Pharsight at approx $187 million 25% market share = $47 million 50% market share = $94 million 75
Slide 13: Key Software Offerings: Drug Model Explorer
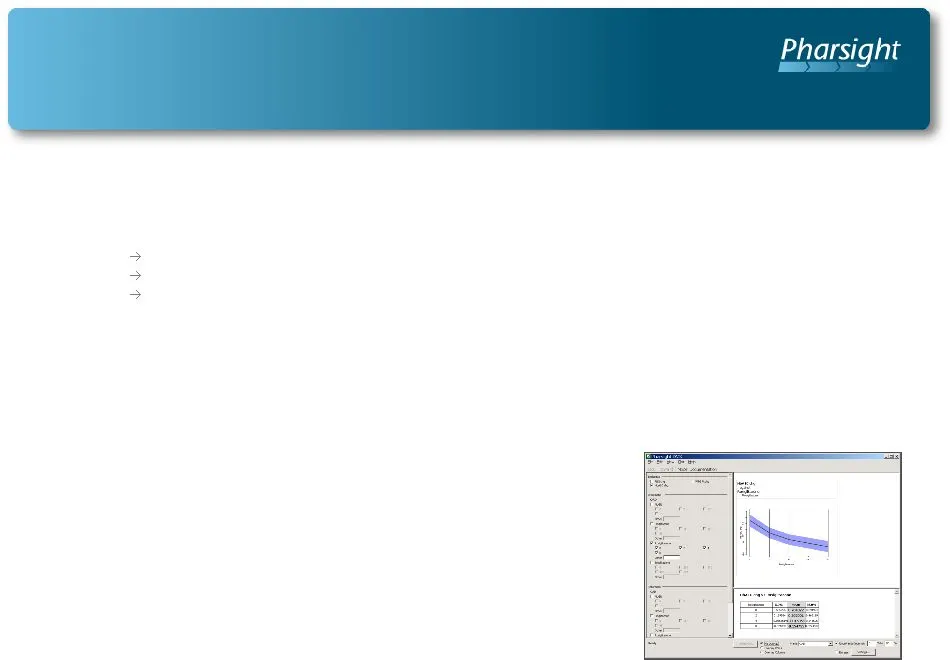
Key Software Offerings Drug Model Explorer™ (“DMX™”) Software-Based Communication Technology, Designed to Facilitate Quantitative Decision-Making in Drug Development • Market Opportunity – Total opportunity estimated by Pharsight at approx $33 million 25% market share = $8 million 50% market share =

Slide 14: Strategic Consulting Services
Strategic Consulting Services Confidential © Pharsight, Corporation

Slide 15: Strategic Consulting Services
Strategic Consulting Services Formal, quantitative, model-based decision-making method Increases drug development productivity Decreases late stage attrition Decreases time-to-market Reduces financial investment Improves clinical quality and commercial performance of final product
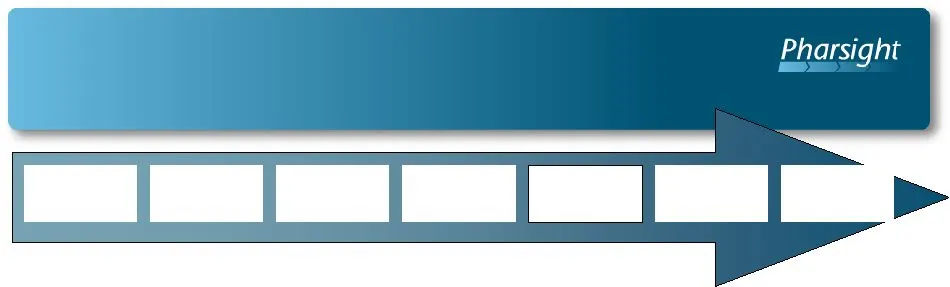
Slide 16: Quantitative Modeling Supports Both Trial- and Program-Level Decisions
Quantitative Modeling Supports Both Trial- and Program-Level Decisions Animal PK Data Human PK Data Treatment, Exposure Patient Endpoints Trial Outcomes Market Acceptance Drug and Patient Models Trial Models Market Models • Optimize treatment regimens and patient populations for the market and for a
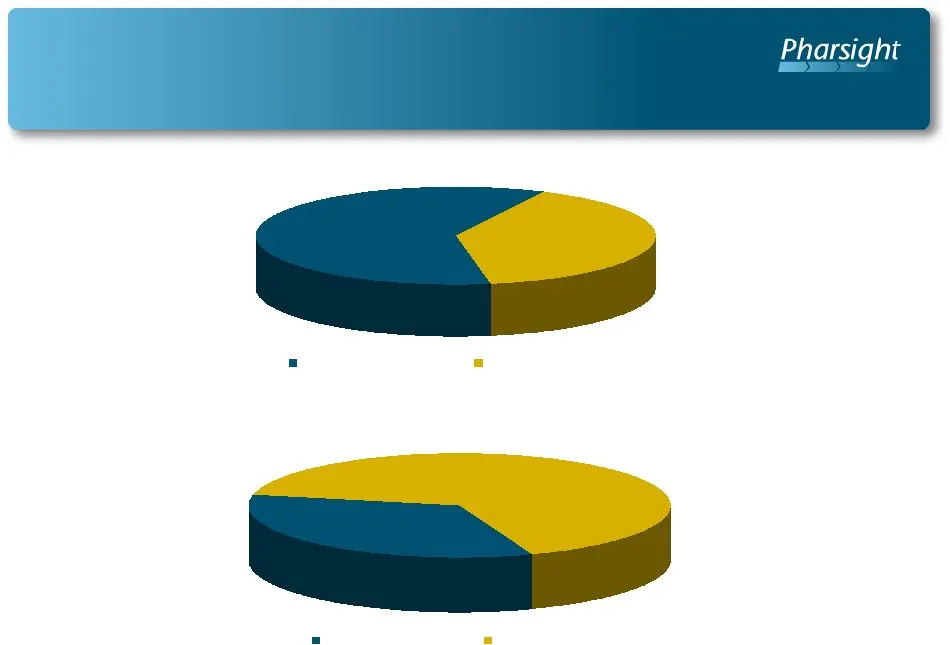
Slide 17: Strategic Consulting Services: Market Penetration – Current Clients
Strategic Consulting Services Market Penetration – Current Clients Current Clients Market Opportunity Current Clients Market Opportunity Top 10 Pharma ² 60% Market Penetration Top 50 Pharma ² 34% Market Penetration December 31, 2005 Pharma Exec 50: Pharmaceutical Executive, May 2004

Slide 18: Financial Overview
Financial Overview Confidential © Pharsight, Inc.
Slide 19: FY05 Accomplishments and FY06 Objectives
FY05 Accomplishments FY06 Objectives Fiscal Year 2005 Results • Continued revenue growth • Y-Y revenue growth of 27% • 2 nd consecutive year of 25%+ growth • Profitability • Net income of $2.7 million, or 12% of revenues • Profitability in both business units • Achieved positive annual net cash flow

Slide 20: Summary Statement of Operations - Y/Y
Summary Statement of Operations - Y/Y Q3 FY06 and YTD FY06 ('000s except per share data) Q3 Q3 YTD YTD FY06 FY05 FY06 FY05 Revenues 5,757 $ 6,462 $ 17,371 $ 16,568 $ Cost of revenues 1,829 1,948 5,770 5,606 Gross profit 3,928 4,514 11,601 10,962 Operating expenses 3,636 3,024 10,741 8,851 Income fro
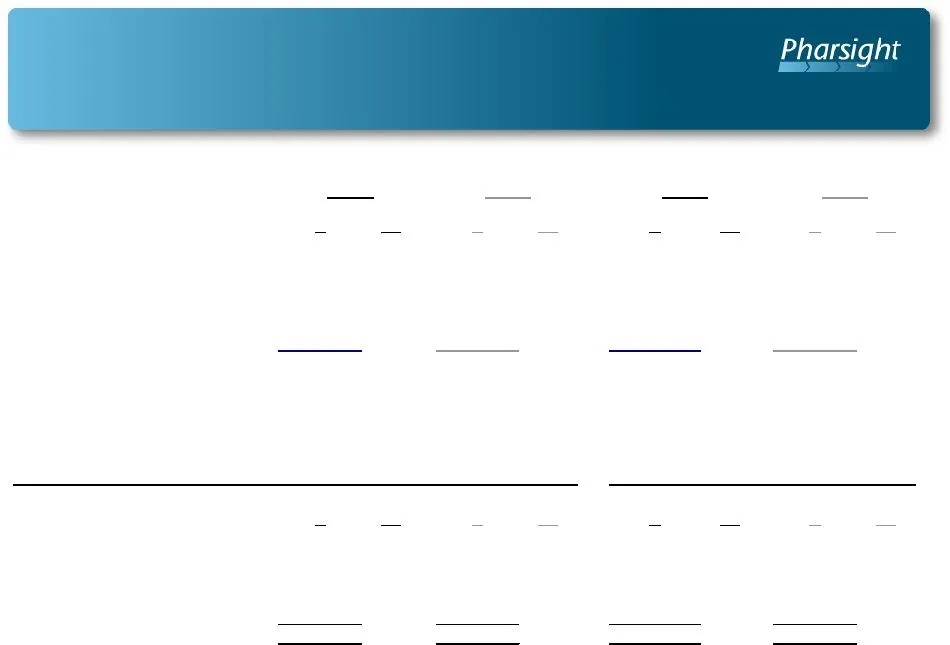
Slide 21: Summary Operating Results – Software Products
Summary Operating Results – Software Products Q3 FY06 and YTD FY 06 ('000s) OPERATING RESULTS $ % $ % $ % $ % Revenues Initial license 1,672 $ 41% 2,391 $ 58% 3,793 $ 35% 4,425 $ 48% Renewal license 1,258 31% 1,127 27% 3,639 34% 3,387 44% Maintenance 7% 1% 7% 1% Services 21% 14% 2,365 22% 1,358 15%

Slide 22: Summary Operating Results – Strategic Consulting
Summary Operating Results – Strategic Consulting Q3 FY06 and YTD FY 06 ('000s) OPERATING RESULTS Revenues 1,687 $ 100% 2,309 $ 100% 6,806 $ 100% 7,259 $ 100% Gross profit 20% 40% 2,572 38% 3,055 42% Income (loss) from operations (599) -36% 8% (755) -11% 4% FY06 FY05 Q3 Q3 YTD YTD FY06 FY05
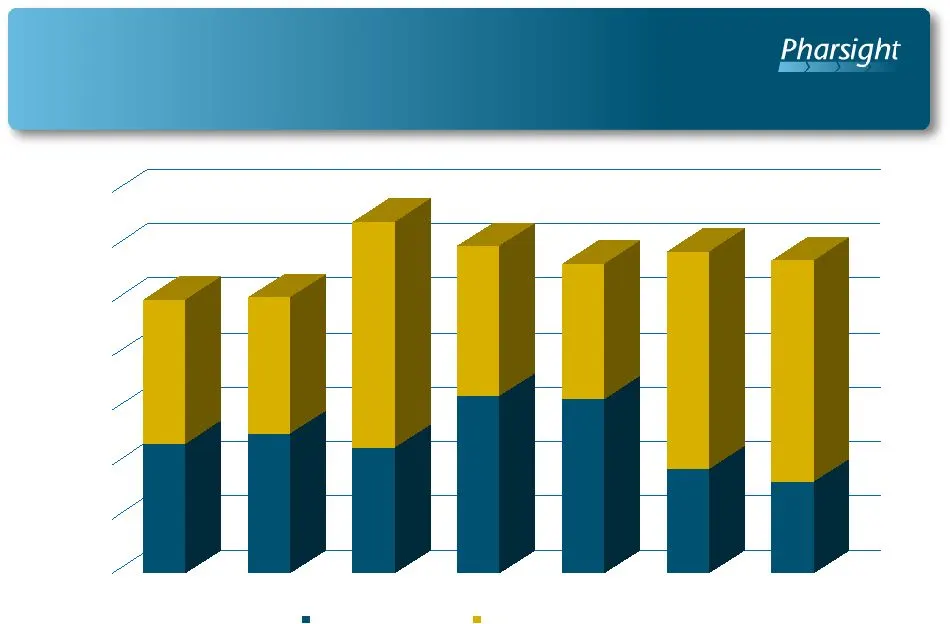
Slide 23: Quarterly Revenues
Quarterly Revenues (‘000s) $0 $1,000 $2,000 $3,000 $4,000 $5,000 $6,000 $7,000 Q1 FY05 Q2 FY05 Q3 FY05 Q4 FY05 Q1 FY06 Q2 FY06 Q3 FY06 Strategic Consulting Software Products
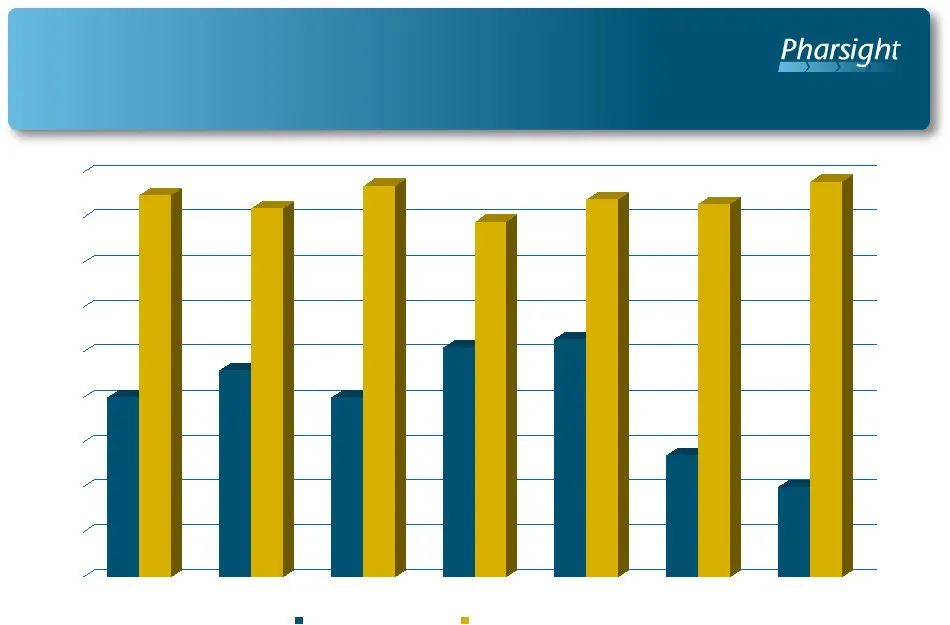
Slide 24: Quarterly Gross Profit
Quarterly Gross Profit (Percentage of Segment Revenues) 0% 10% 20% 30% 40% 50% 60% 70% 80% 90% Q1 FY05 Q2 FY05 Q3 FY05 Q4 FY05 Q1 FY06 Q2 FY06 Q3 FY06 Strategic Consulting Software Products
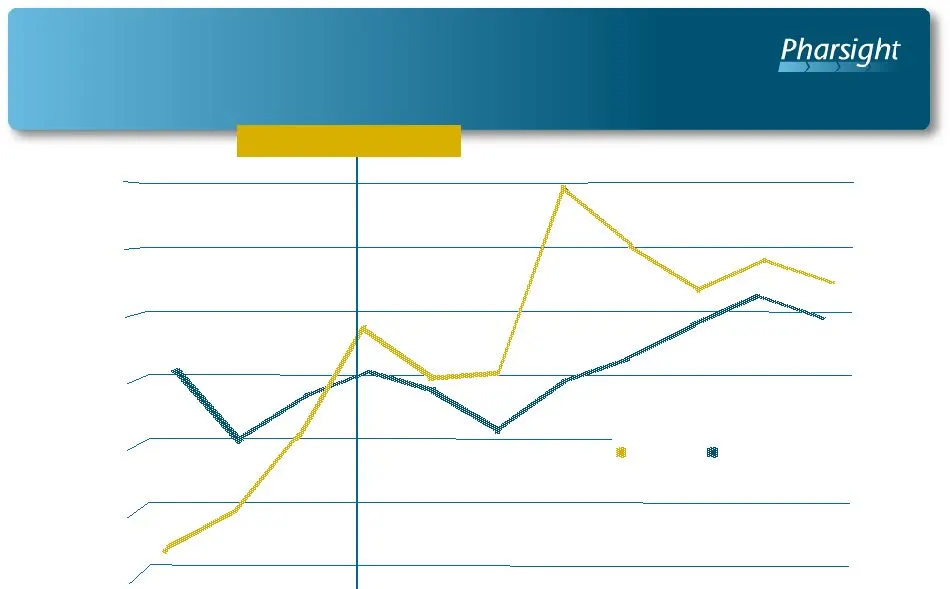
Slide 25: Continued Profitability
Continued Profitability (‘000s) Q1 FY04 Q2 FY04 Q3 FY04 Q4 FY04 Q1 FY05 Q2 FY05 Q3 FY05 Q4 FY05 Q1 FY06 Q2 FY06 Q3 FY06 $3,500 $4,000 $4,500 $5,000 $5,500 $6,000 $6,500 Revenues Costs & Expenses Profitability achieved Q4 FY04
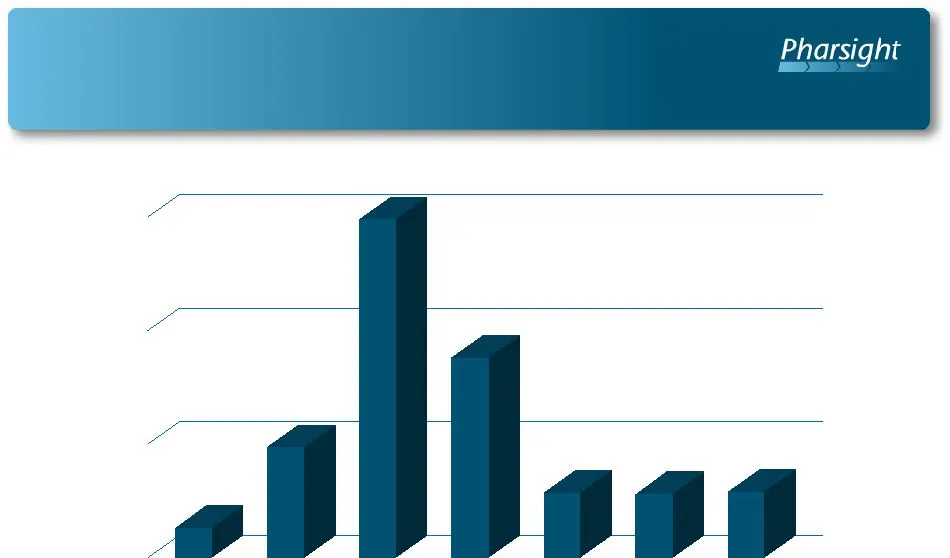
Slide 26: Quarterly Operating Income
Quarterly Operating Income (000s) $0 $500 $1,000 $1,500 Q1 FY05 Q2 FY05 Q3 FY05 Q4 FY05 Q1 FY06 Q2 FY06 Q3 FY06
Slide 27: Quarterly Operating Cash Flow
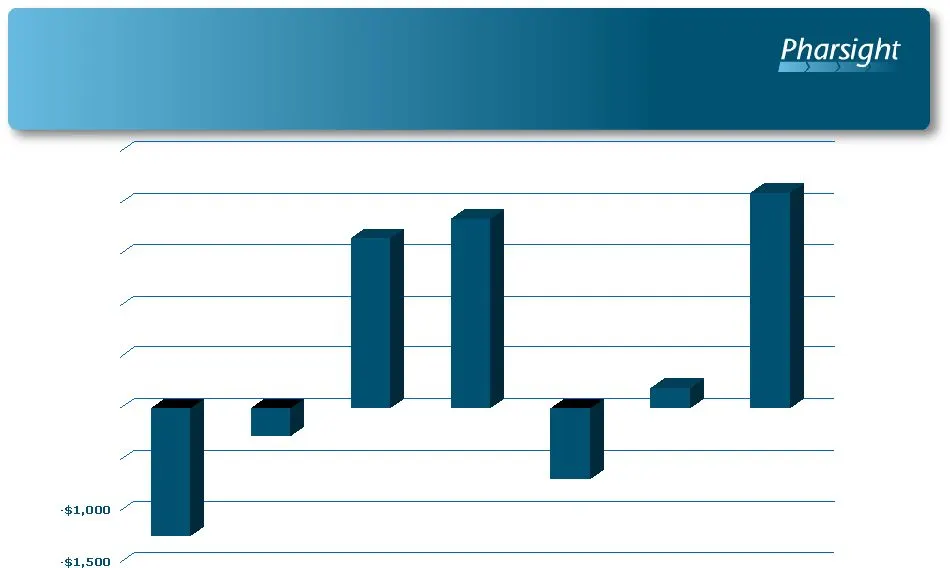
Quarterly Operating Cash Flow (‘000s) -$500 $0 $500 $1,000 $1,500 $2,000 $2,500 Q1 FY05 Q2 FY05 Q3 FY05 Q4 FY05 Q1 FY06 Q2 FY06 Q3 FY06

Slide 28: Summary Balance Sheet
Summary Balance Sheet December 31, 2005 ('000s) December 31, March 31, Cash & Cash Equivalents 9,974 $ 10,579 $ Accounts Receivable, Net 5,130 4,809 Total Current Assets 15,492 15,982 Total Assets 17,649 16,822 LIABILITIES & STOCKHOLDERS' DEFICIT A/P & Accrued Expenses 3,585 $ 3,497 $ Deferred Reven
Slide 29: Pharsight
Pharsight
Slide 30: Notices
Notices Proprietary Notice All contents Copyright ©2006 Pharsight Corporation. All rights reserved. The copyright for this document is owned by Pharsight Corporation. No part of this document may be reproduced or transmitted in any form or by any means, electronic or mechanical, including photocopyi

Slide 31
Source: SEC EDGAR · 8-K filed Feb 2, 2006
More decks from Pharsight Corp
 Q4 2007 Earnings Presentation45 slides · May 14, 2007
 Investor Presentation (January 2007)41 slides · Jan 26, 2007
 Q2 2007 Earnings Presentation33 slides · Nov 30, 2006
 Q1 FY2007 Earnings Presentation37 slides · Aug 3, 2006
 Investor Presentation (June 2006)36 slides · Jun 6, 2006
 Investor Presentation (August 2005)39 slides · Aug 2, 2005