Fibra MTY · BIVA:FMTY/14
Fibra MTY — Q4 2022 Earnings Presentation
20 slides from Fibra MTY's earnings presentation, February 2023
Slide 1: 4Q22 Quarterly Results
Sistema de Entrenamiento 4Q22 en Update Quarterly Results Ciberseguridad Trust F/2157 – FMTY14 February, 2023
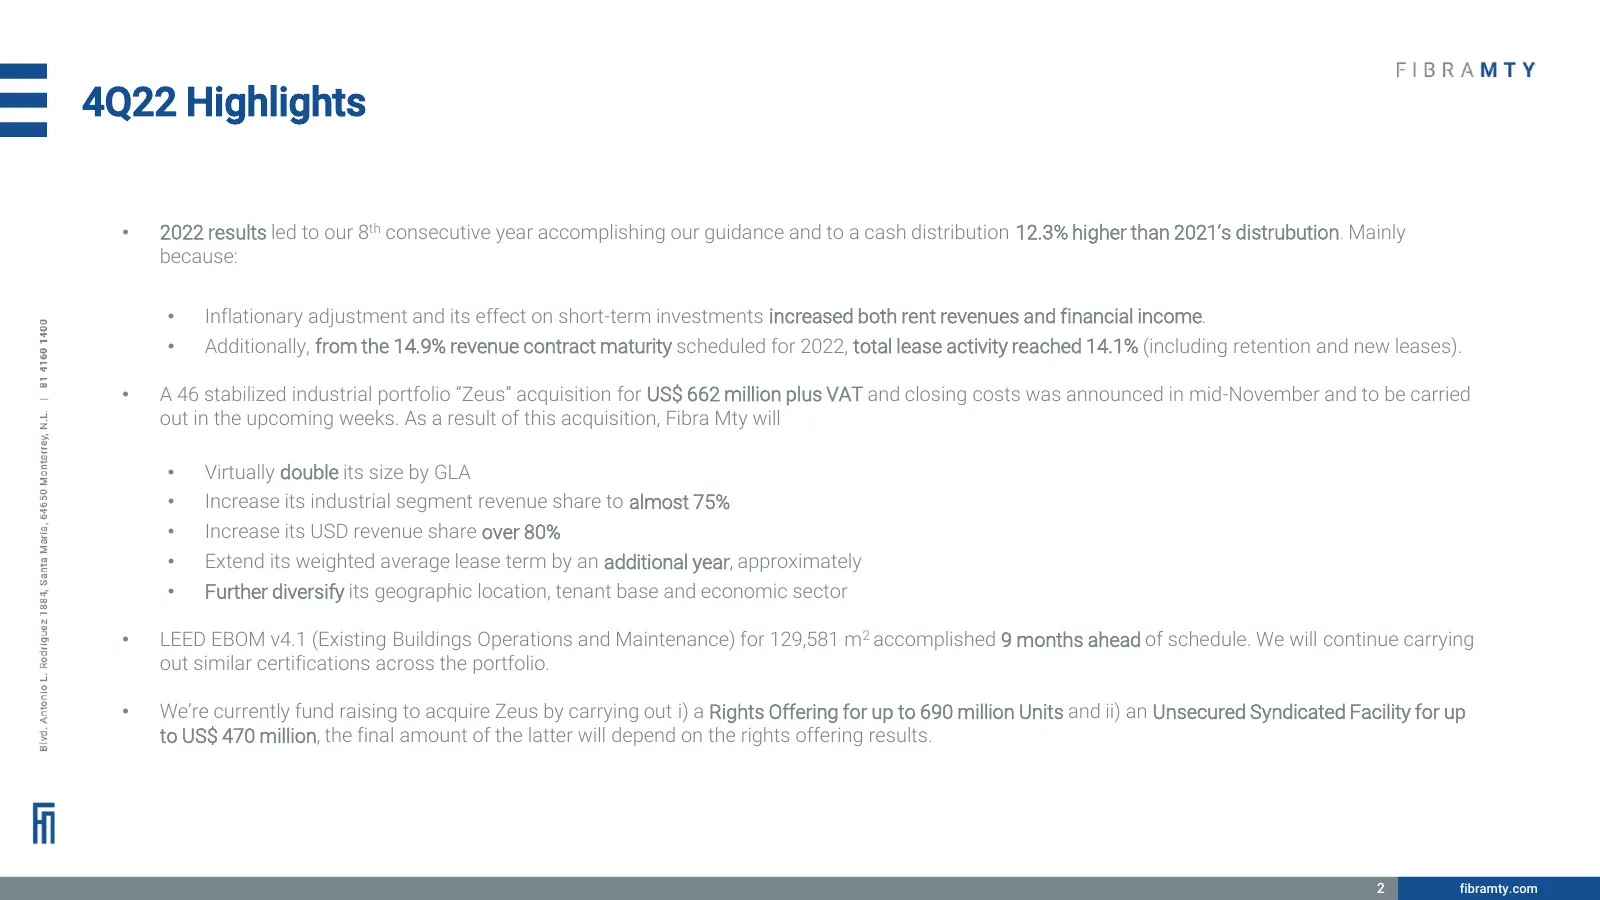
Slide 2: 4Q22 Highlights
4Q22 Highlights • 2022 results led to our 8th consecutive year accomplishing our guidance and to a cash distribution 12.3% higher than 2021’s distrubution. Mainly because: • Inflationary adjustment and its effect on short-term investments increased both rent revenues and financial income. • Addition
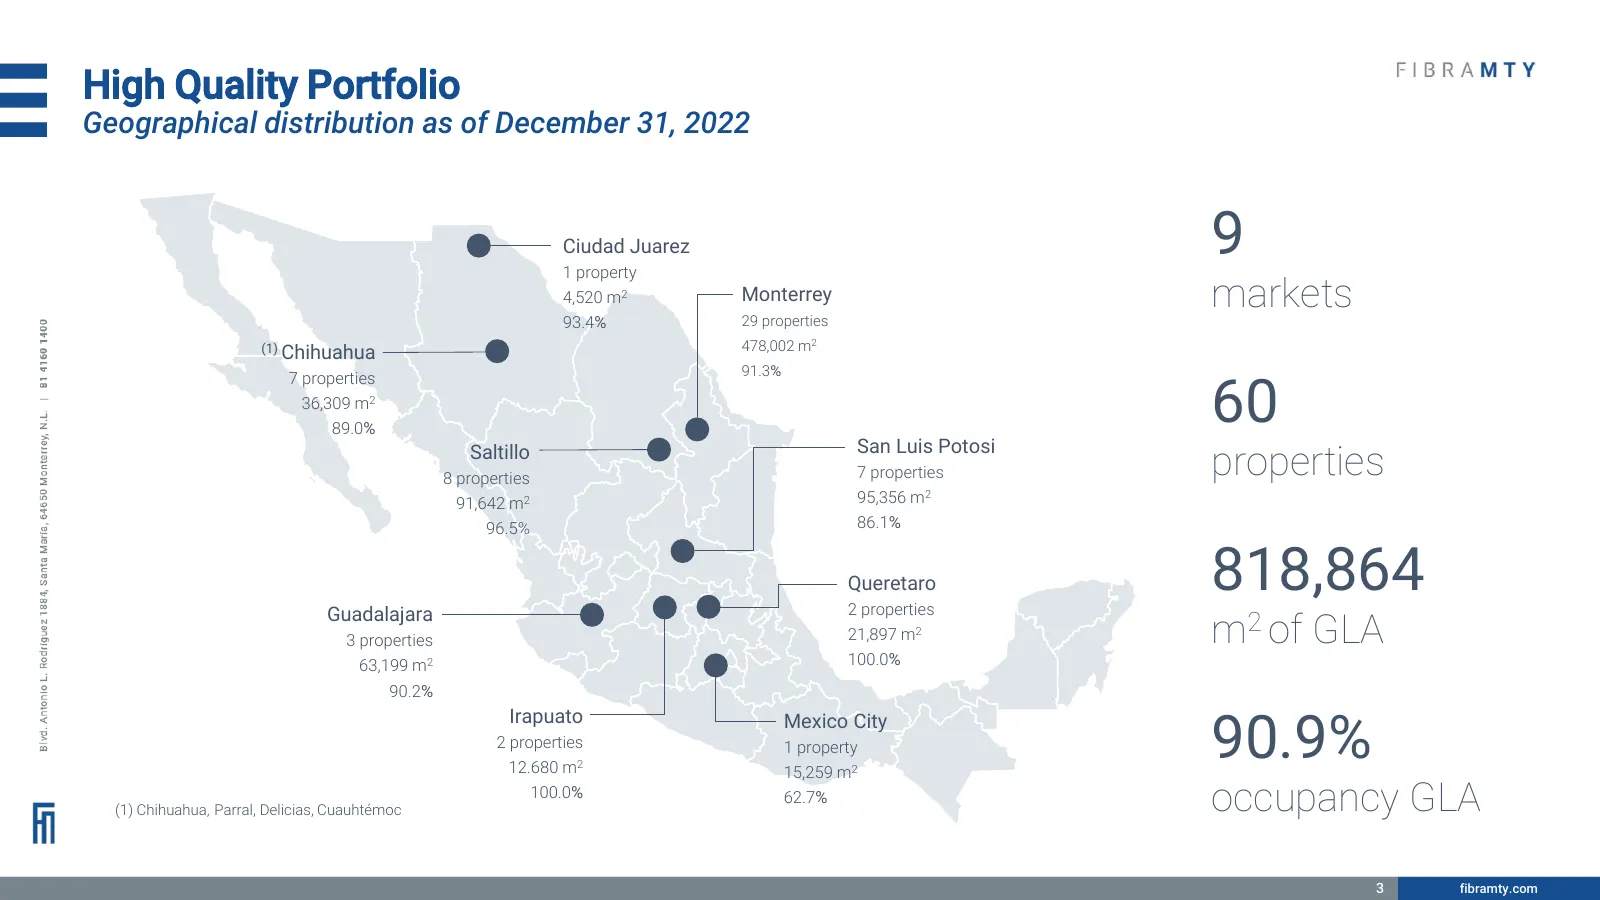
Slide 3: High Quality Portfolio
High Quality Portfolio Geographical distribution as of December 31, 2022 Ciudad Juarez 1 property 9 4,520 m2 Monterrey 29 properties markets 93.4% (1) Chihuahua 478,002 m2 91.3% 60 7 properties 36,309 m2 89.0% San Luis Potosi Saltillo 8 properties 7 properties properties 91,642 m2 95,356 m2 96.5% 86
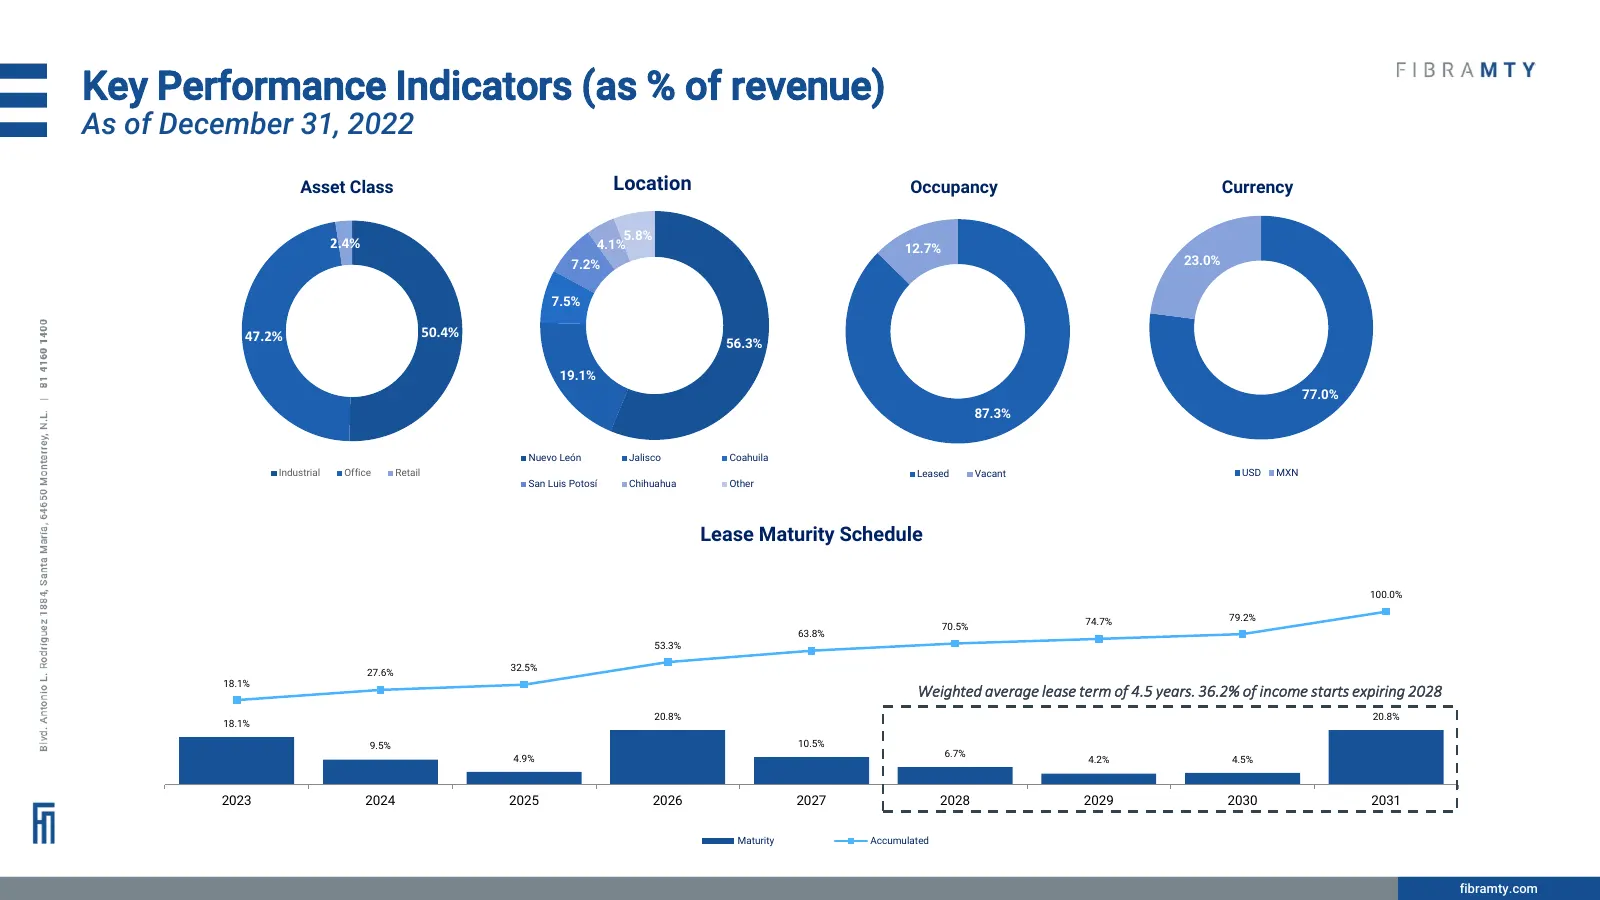
Slide 4: Key Performance Indicators (as % of revenue)
Key Performance Indicators (as % of revenue) As of December 31, 2022 Asset Class Location Occupancy Currency 5.8% 2.4% 4.1% 12.7% 7.2% 23.0% 7.5% 47.2% 50.4% 56.3% 19.1% 77.0% 87.3% Nuevo León Jalisco Coahuila 4 Industrial Office Retail Leased Vacant USD MXN San Luis Potosí Chihuahua Other Lease Mat
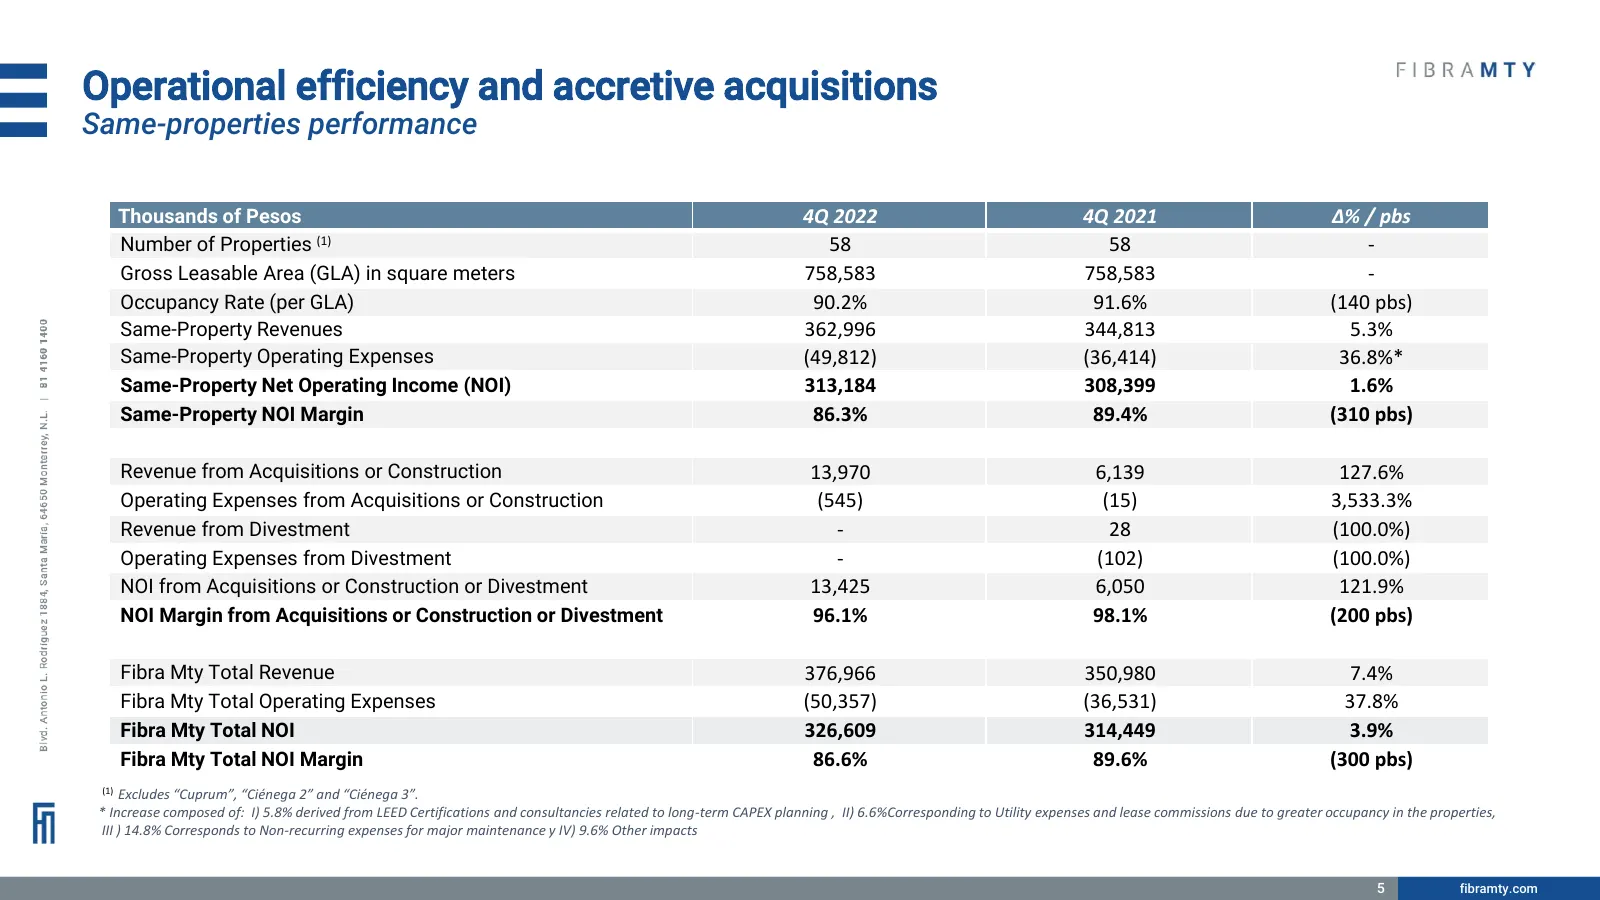
Slide 5: Operational efficiency and accretive acquisitions
Operational efficiency and accretive acquisitions Same-properties performance Thousands of Pesos 4Q 2022 4Q 2021 Δ% / pbs Number of Properties (1) 58 58 - Gross Leasable Area (GLA) in square meters 758,583 758,583 - Occupancy Rate (per GLA) 90.2% 91.6% (140 pbs) Same-Property Revenues 362,996 344,81
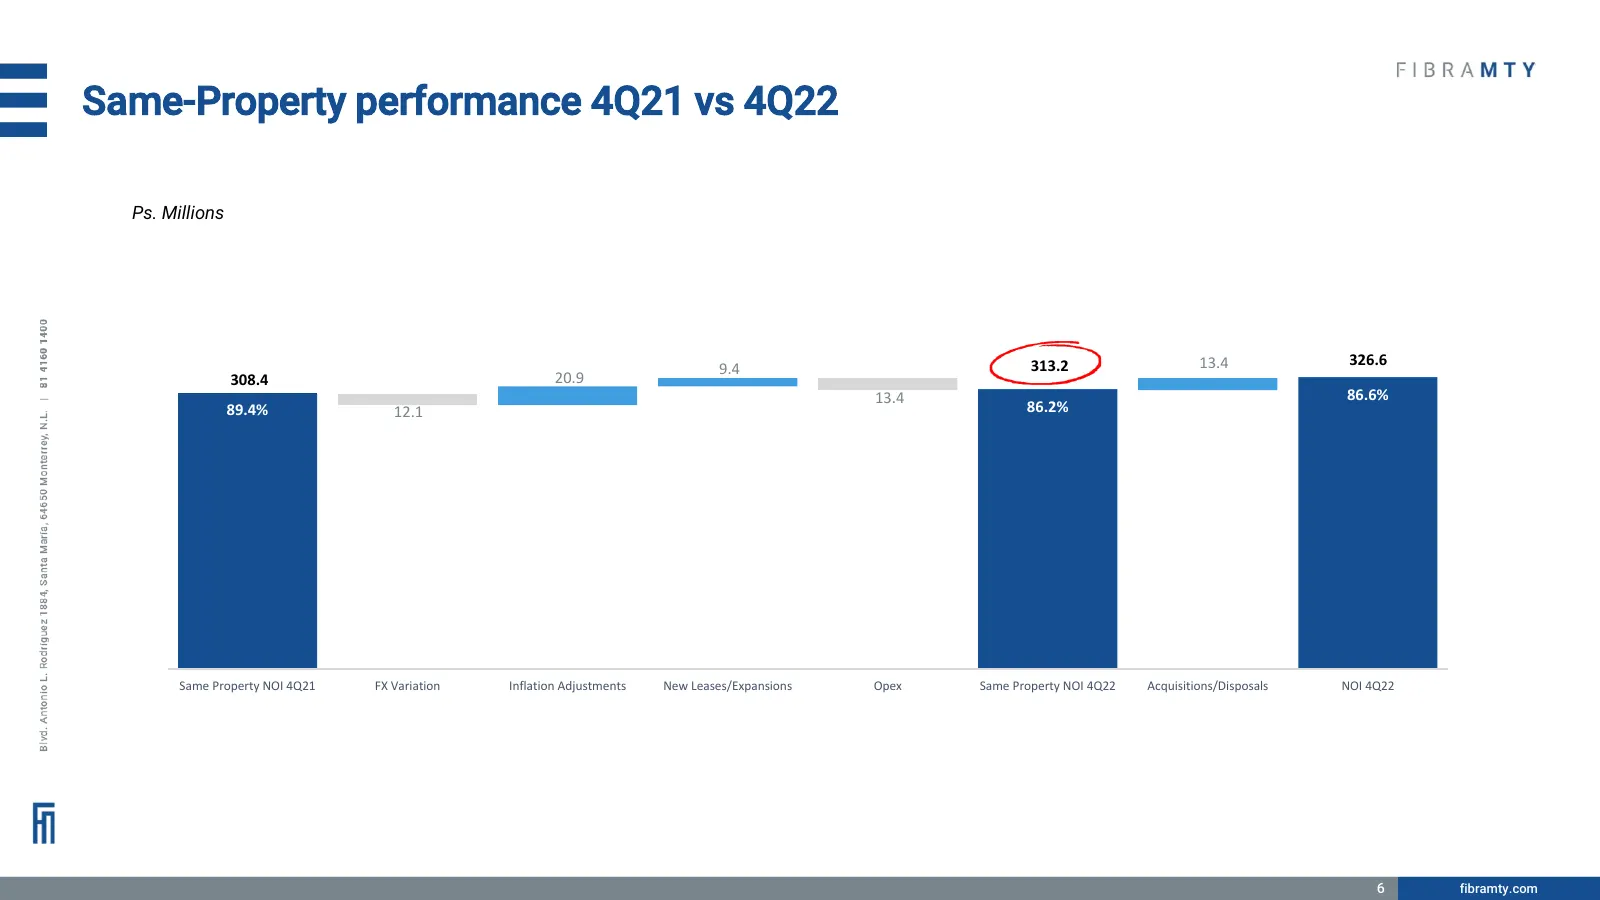
Slide 6: Same-Property performance 4Q21 vs 4Q22
Same-Property performance 4Q21 vs 4Q22 Ps. Millions 313.2 13.4 326.6 9.4 308.4 20.9 13.4 86.6% 89.4% 12.1 86.2% Same Property NOI 4Q21 FX Variation Inflation Adjustments New Leases/Expansions Opex Same Property NOI 4Q22 Acquisitions/Disposals NOI 4Q22 6 fibramty.com
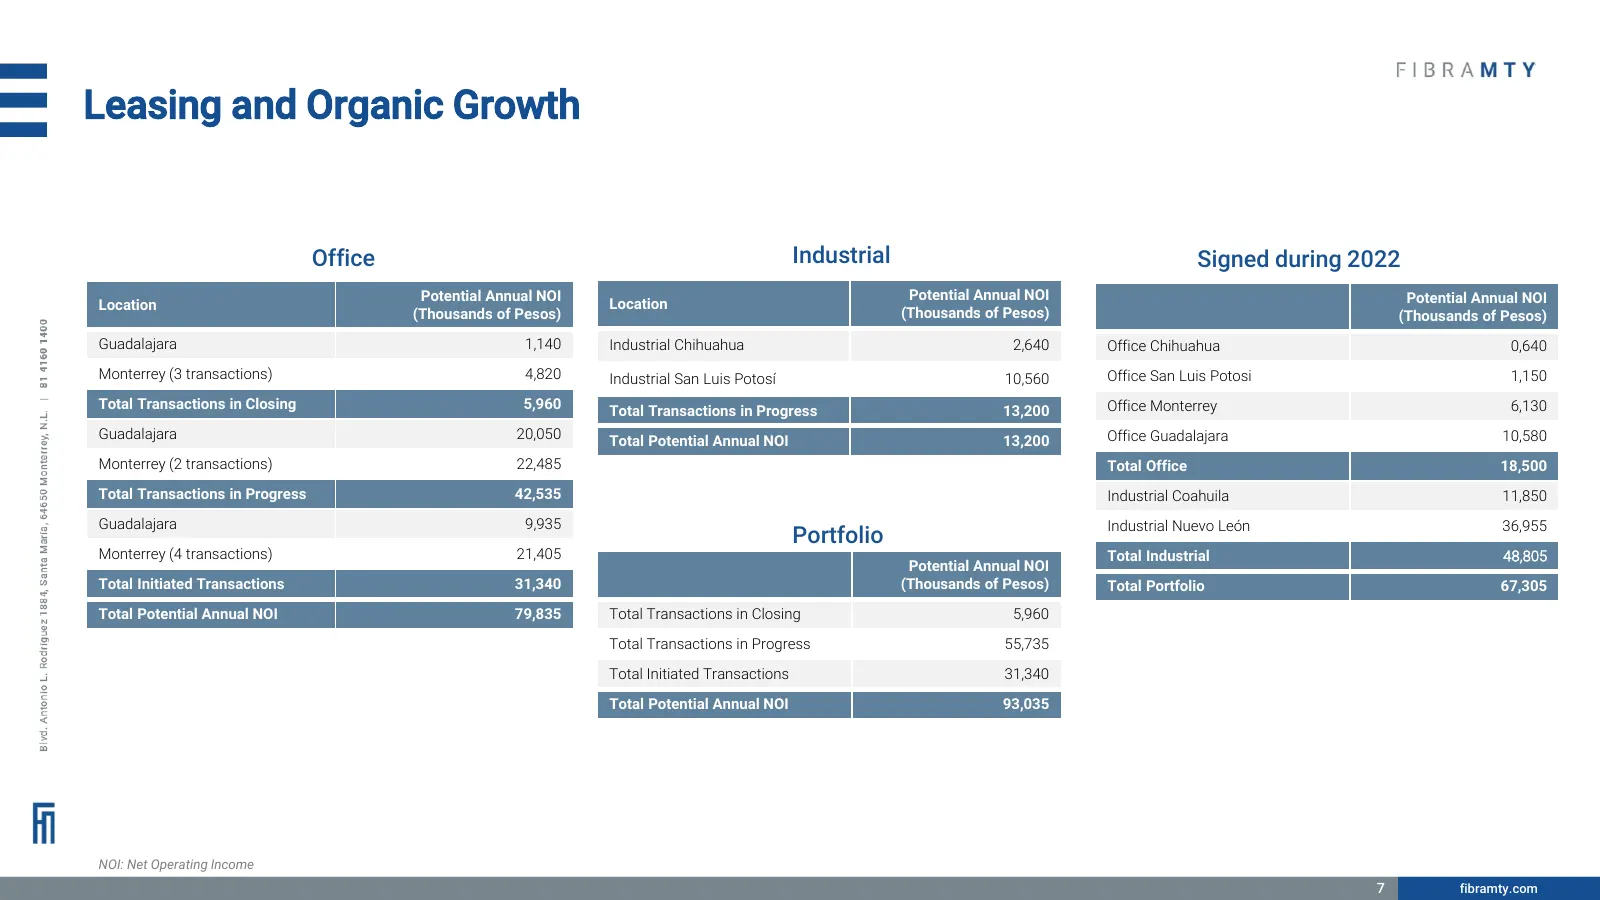
Slide 7: Leasing and Organic Growth
Leasing and Organic Growth Office Industrial Signed during 2022 Potential Annual NOI Potential Annual NOI Potential Annual NOI Location Location (Thousands of Pesos) (Thousands of Pesos) (Thousands of Pesos) Guadalajara 1,140 Industrial Chihuahua 2,640 Office Chihuahua 0,640 Monterrey (3 transaction
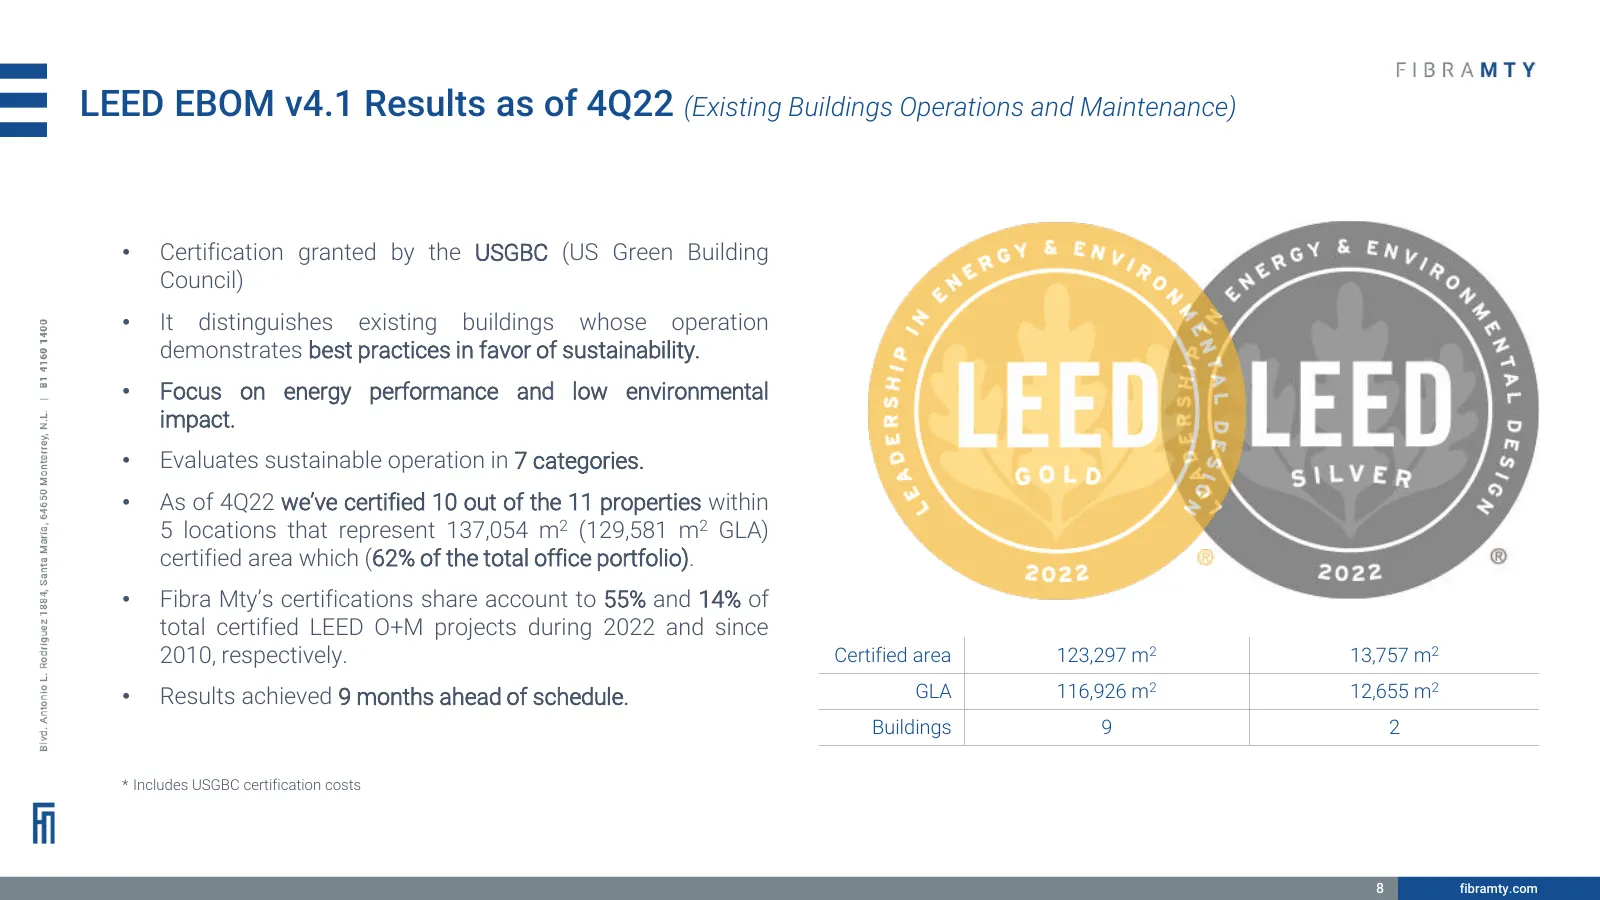
Slide 8: LEED EBOM v4.1 Results as of 4Q22
LEED EBOM v4.1 Results as of 4Q22 (Existing Buildings Operations and Maintenance) • Certification granted by the USGBC (US Green Building Council) • It distinguishes existing buildings whose operation demonstrates best practices in favor of sustainability. • Focus on energy performance and low envir
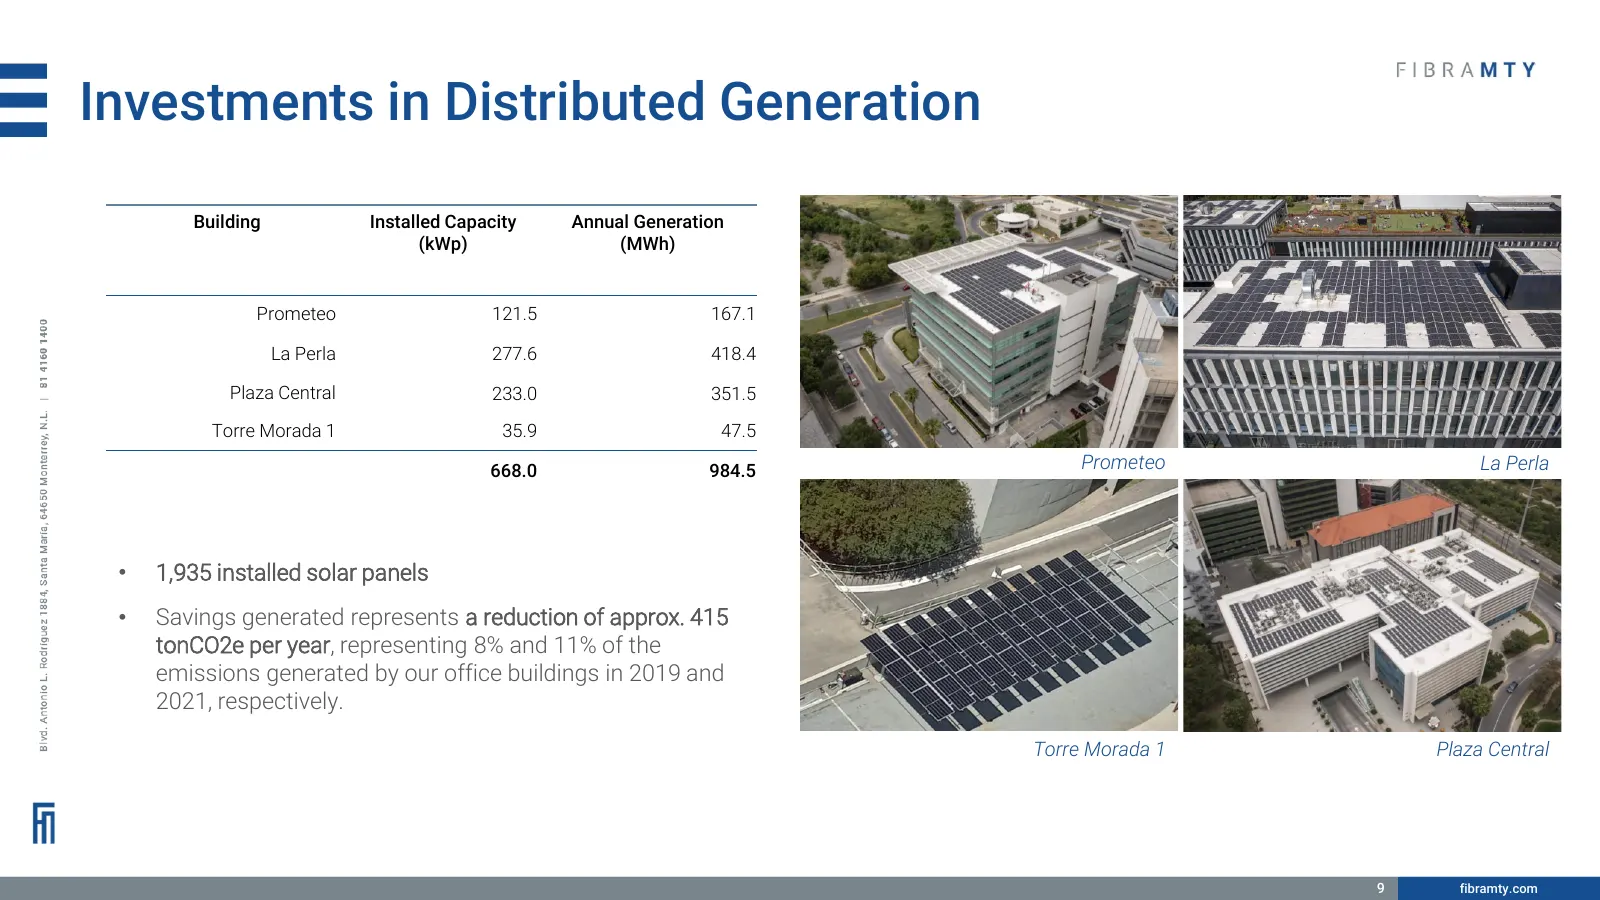
Slide 9: Investments in Distributed Generation
Investments in Distributed Generation Building Installed Capacity Annual Generation (kWp) (MWh) Prometeo 121.5 167.1 La Perla 277.6 418.4 Plaza Central 233.0 351.5 Torre Morada 1 35.9 47.5 668.0 984.5 Prometeo La Perla • 1,935 installed solar panels • Savings generated represents a reduction of appr
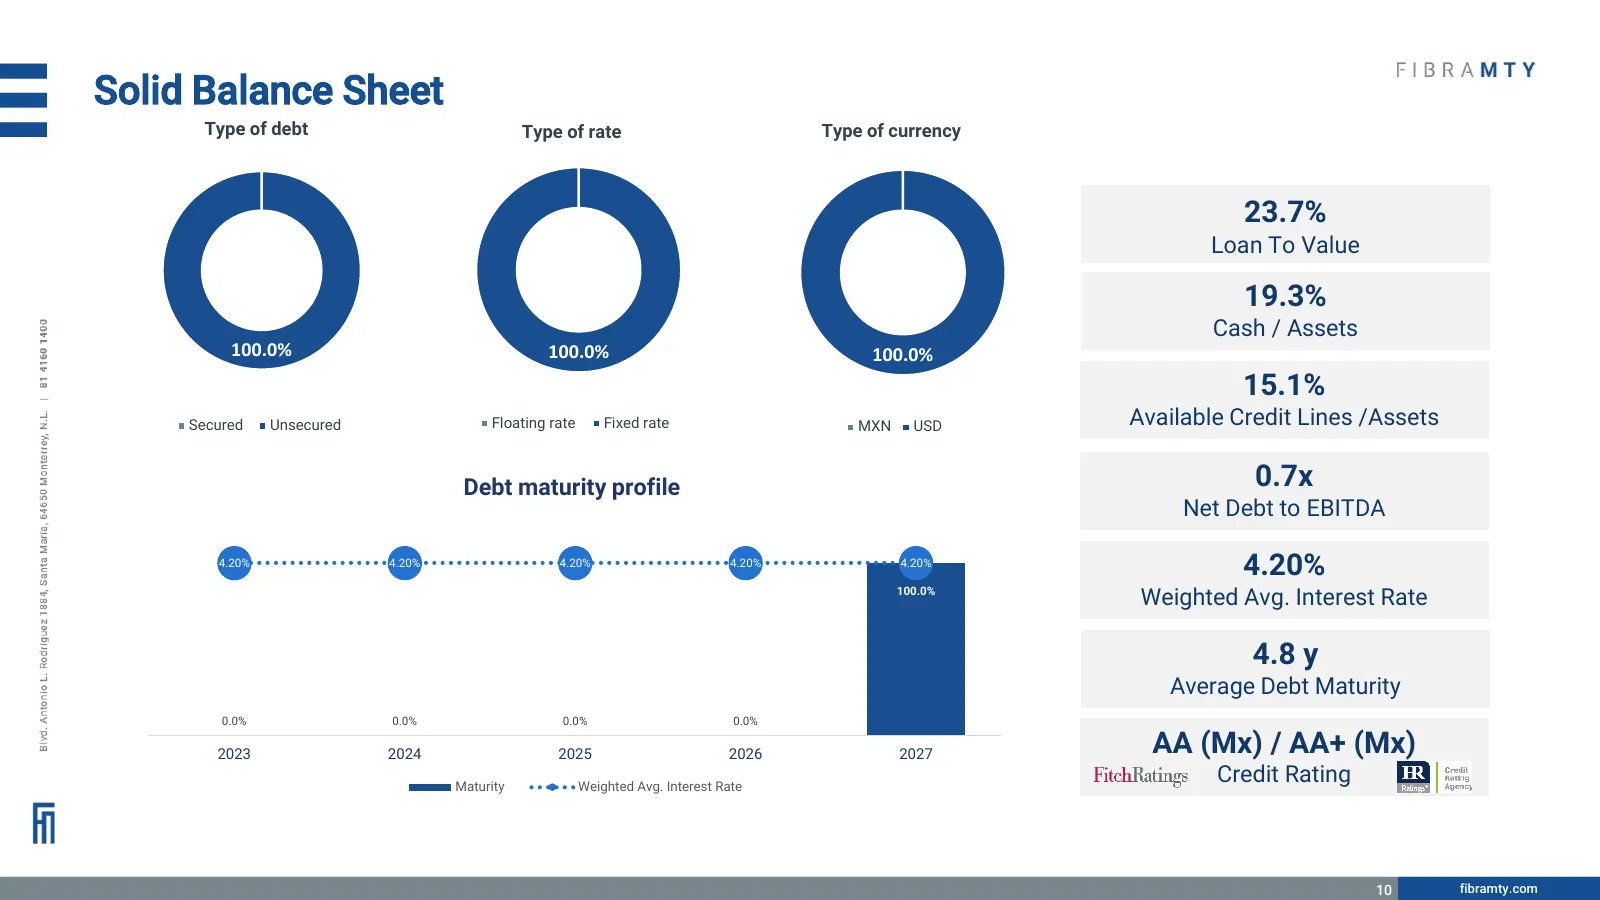
Slide 10: Solid Balance Sheet
Solid Balance Sheet Type of debt Type of rate Type of currency 23.7% Loan To Value 19.3% Cash / Assets 100.0% 100.0% 100.0% 15.1% Secured Unsecured Floating rate Fixed rate MXN USD Available Credit Lines /Assets Debt maturity profile 0.7x Net Debt to EBITDA 4.20% 4.20% 4.20% 4.20% 4.20% 4.20% 100.0%
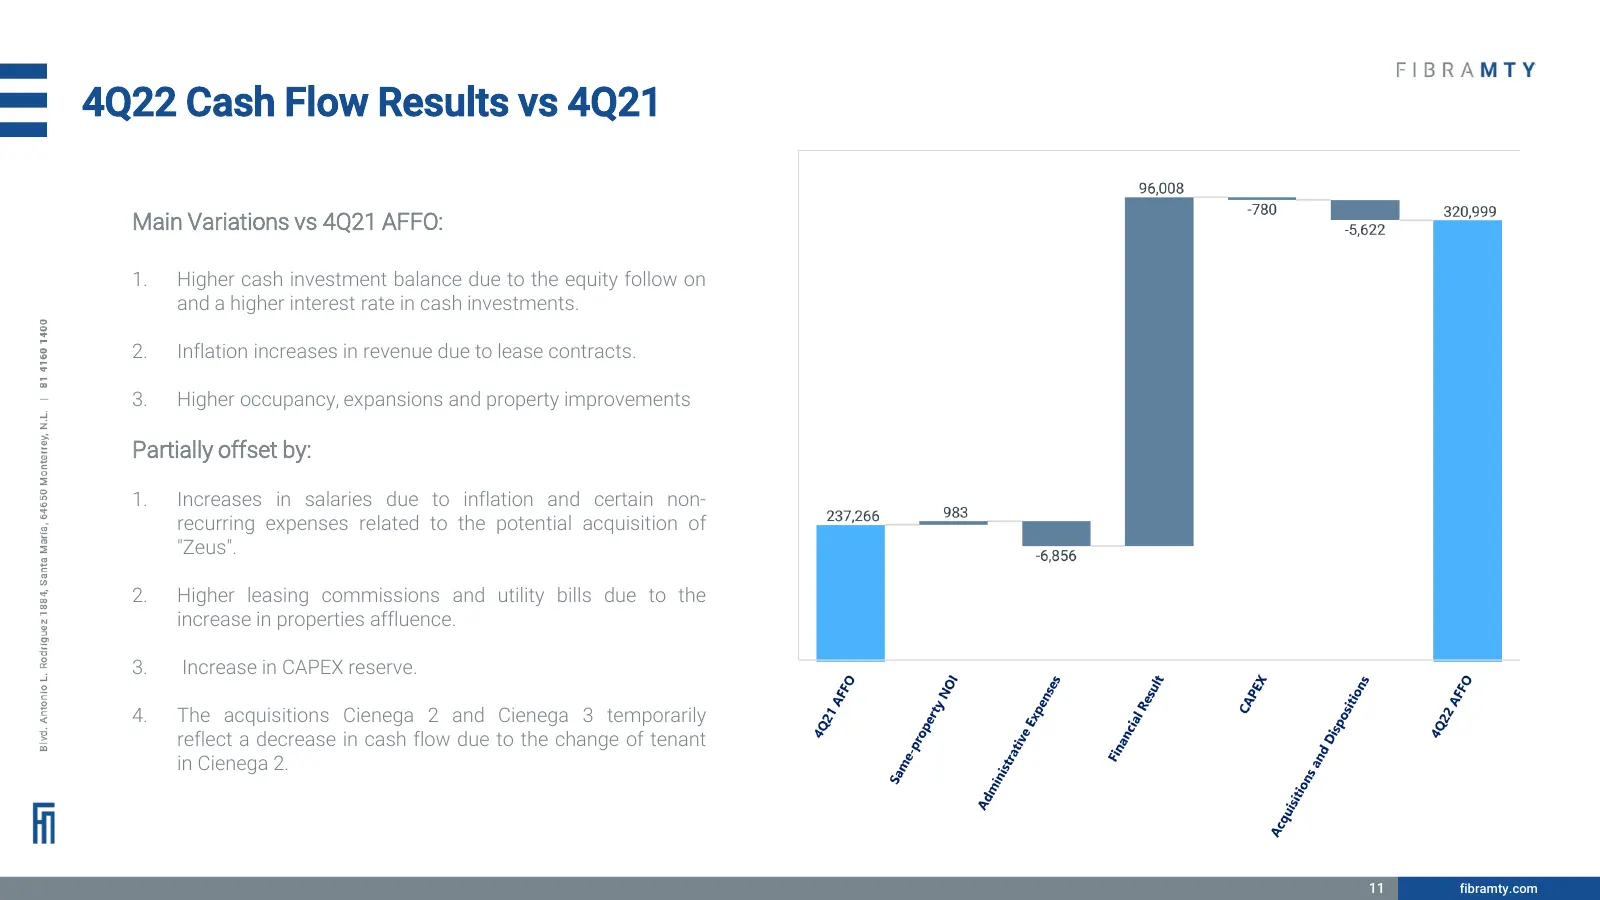
Slide 11: 4Q22 Cash Flow Results vs 4Q21
4Q22 Cash Flow Results vs 4Q21 Main Variations vs 4Q21 AFFO: 1. Higher cash investment balance due to the equity follow on and a higher interest rate in cash investments. 2. Inflation increases in revenue due to lease contracts. 3. Higher occupancy, expansions and property improvements Partially off
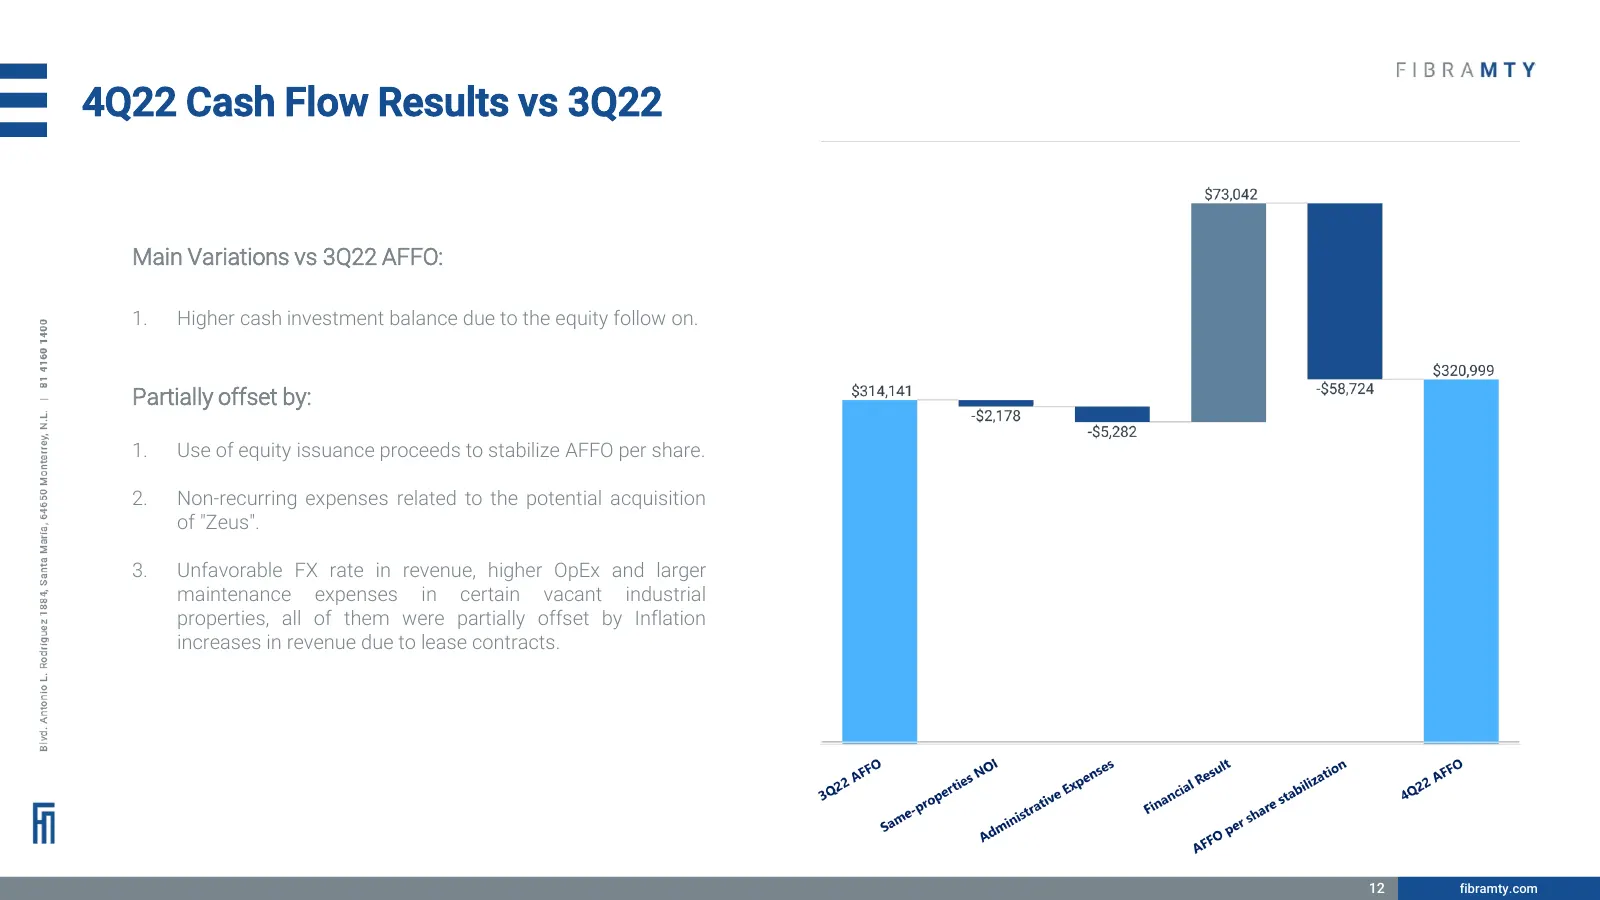
Slide 12: 4Q22 Cash Flow Results vs 3Q22
4Q22 Cash Flow Results vs 3Q22 Main Variations vs 3Q22 AFFO: 1. Higher cash investment balance due to the equity follow on. Partially offset by: 1. Use of equity issuance proceeds to stabilize AFFO per share. 2. Non-recurring expenses related to the potential acquisition of "Zeus". 3. Unfavorable FX
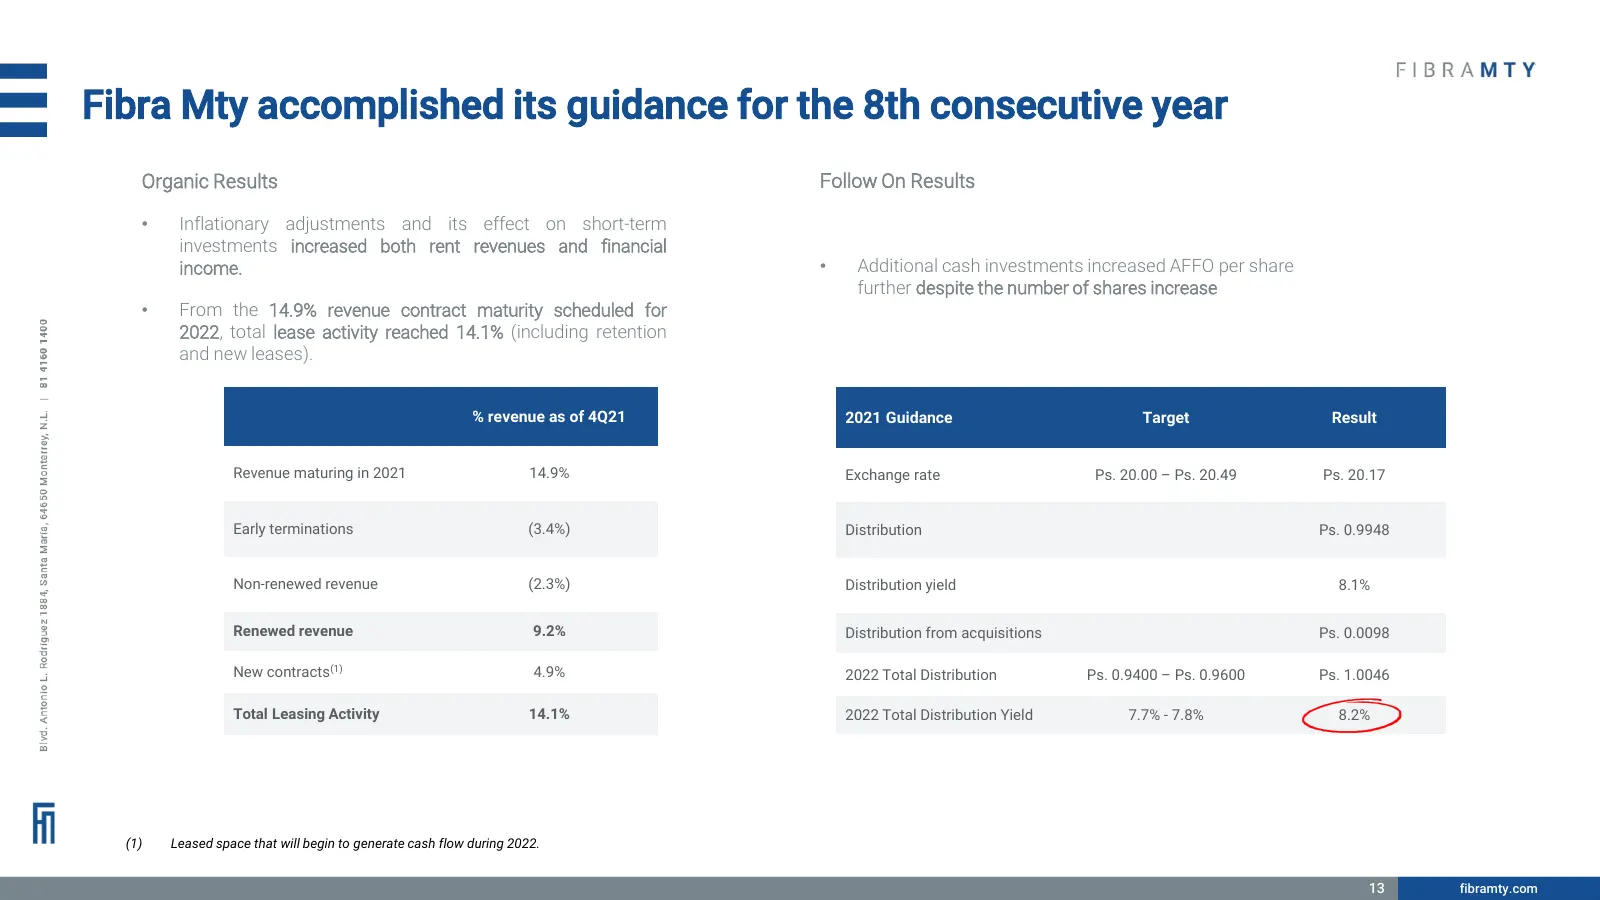
Slide 13: Fibra Mty accomplished its guidance for the 8th consecutive year
Fibra Mty accomplished its guidance for the 8th consecutive year Organic Results Follow On Results • Inflationary adjustments and its effect on short-term investments increased both rent revenues and financial income. • Additional cash investments increased AFFO per share further despite the number
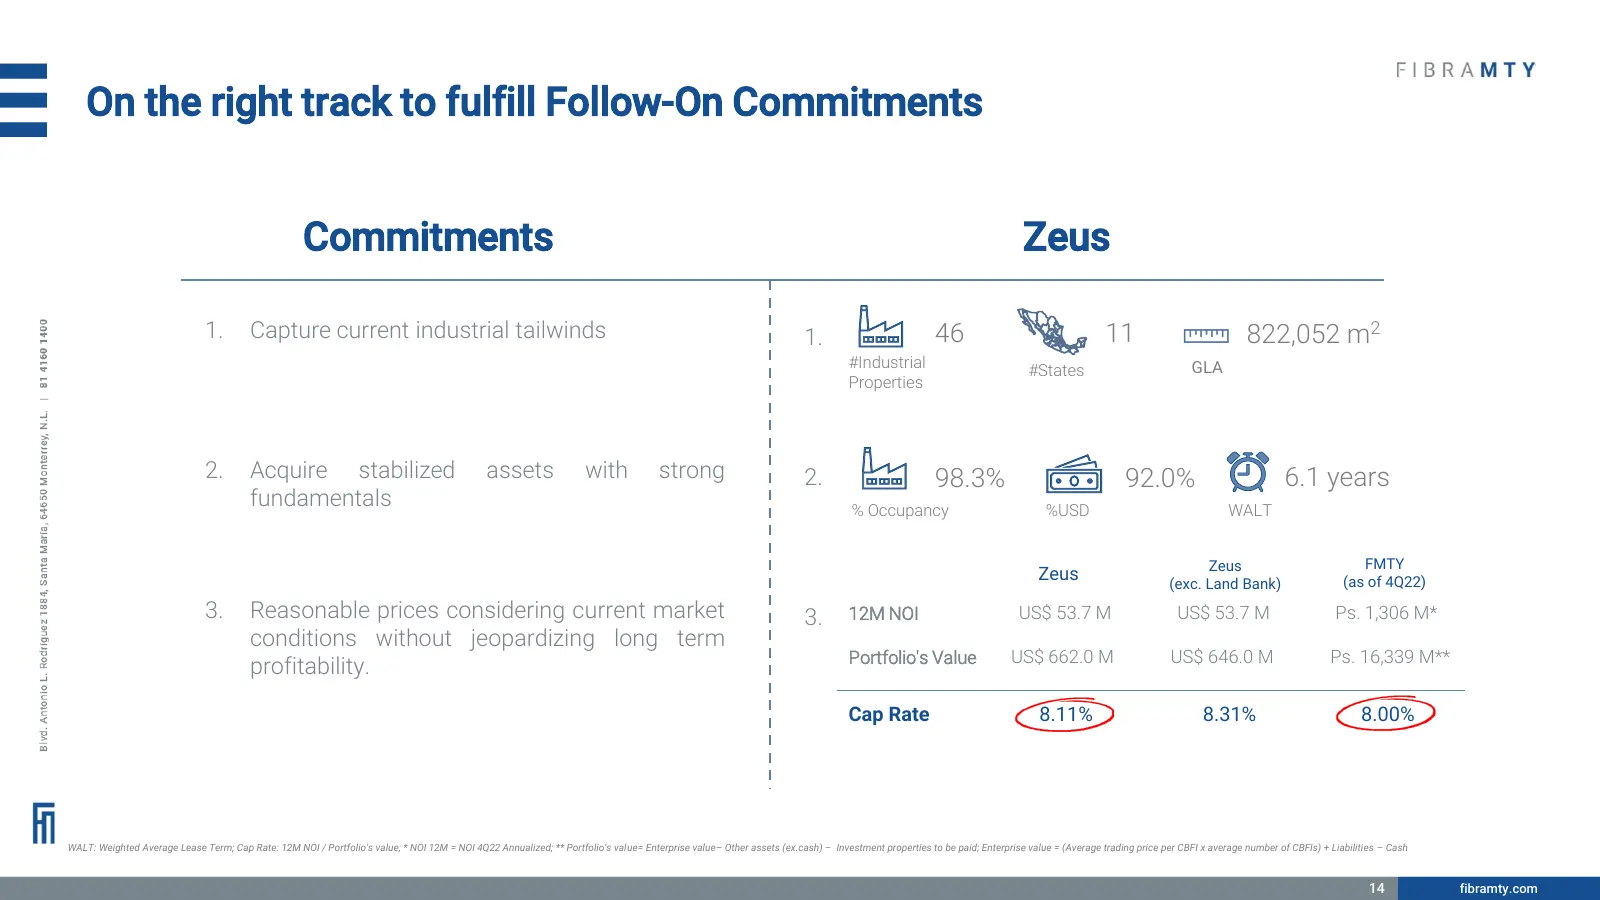
Slide 14: On the right track to fulfill Follow-On Commitments
On the right track to fulfill Follow-On Commitments Commitments Zeus 1. Capture current industrial tailwinds 1. 46 11 822,052 m2 #Industrial GLA #States Properties 2. Acquire stabilized assets with strong 2. 98.3% 92.0% 6.1 years fundamentals % Occupancy %USD WALT Zeus FMTY Zeus (exc. Land Bank) (as
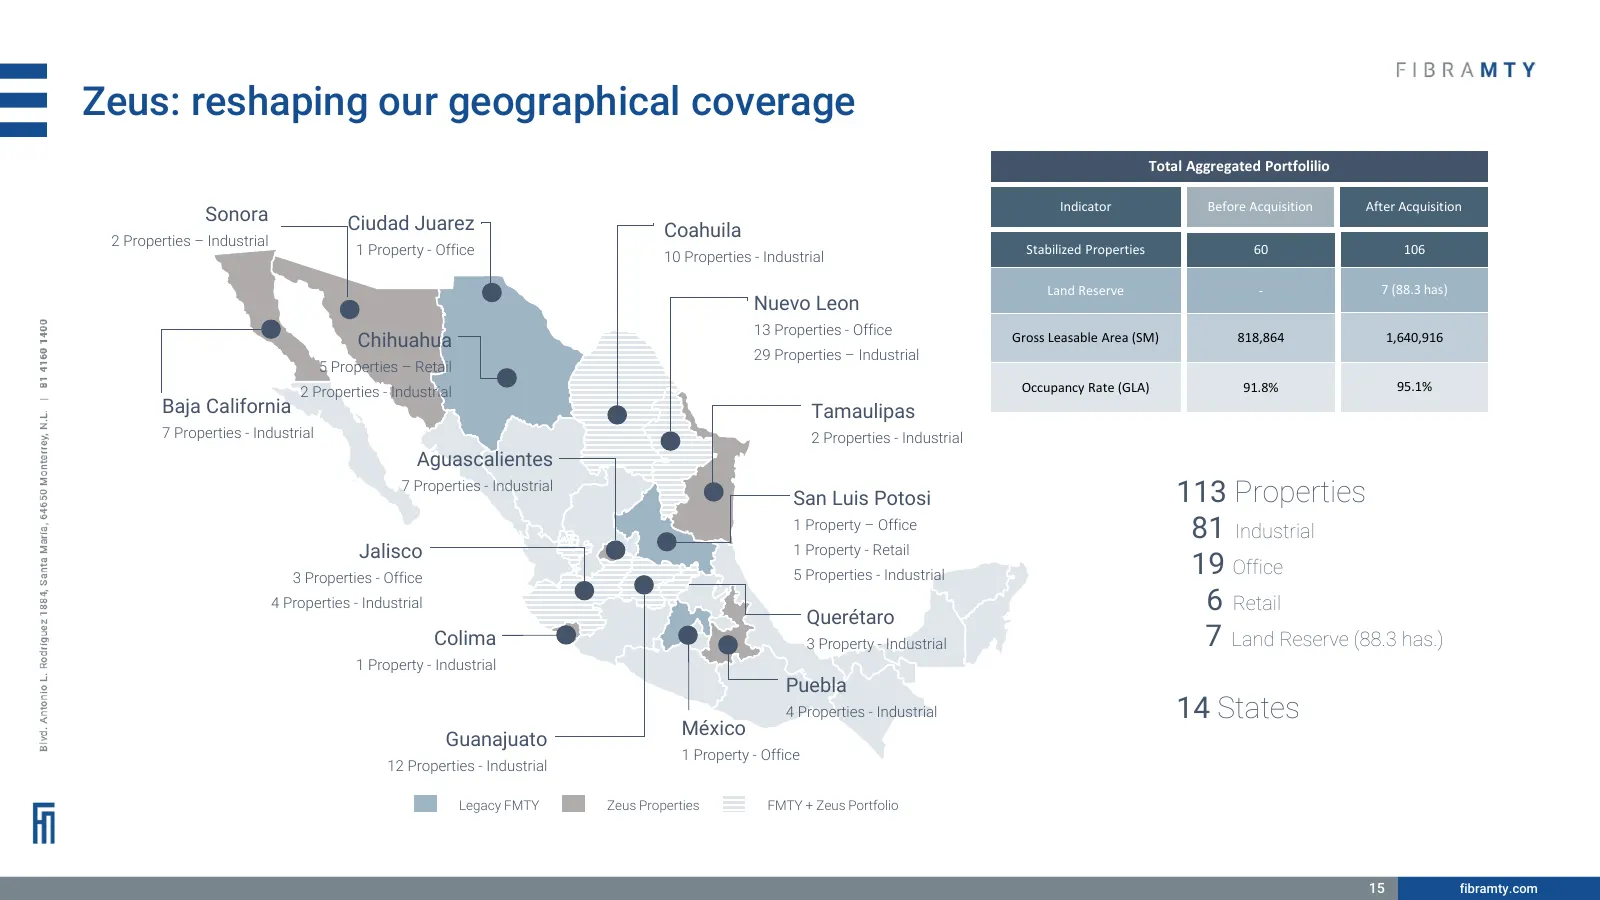
Slide 15: Zeus: reshaping our geographical coverage
Zeus: reshaping our geographical coverage Total Aggregated Portfolilio Indicator Before Acquisition After Acquisition Sonora Ciudad Juarez 2 Properties – Industrial Coahuila 1 Property - Office 10 Properties - Industrial Stabilized Properties 60 106 Land Reserve - 7 (88.3 has) Nuevo Leon 13 Properti
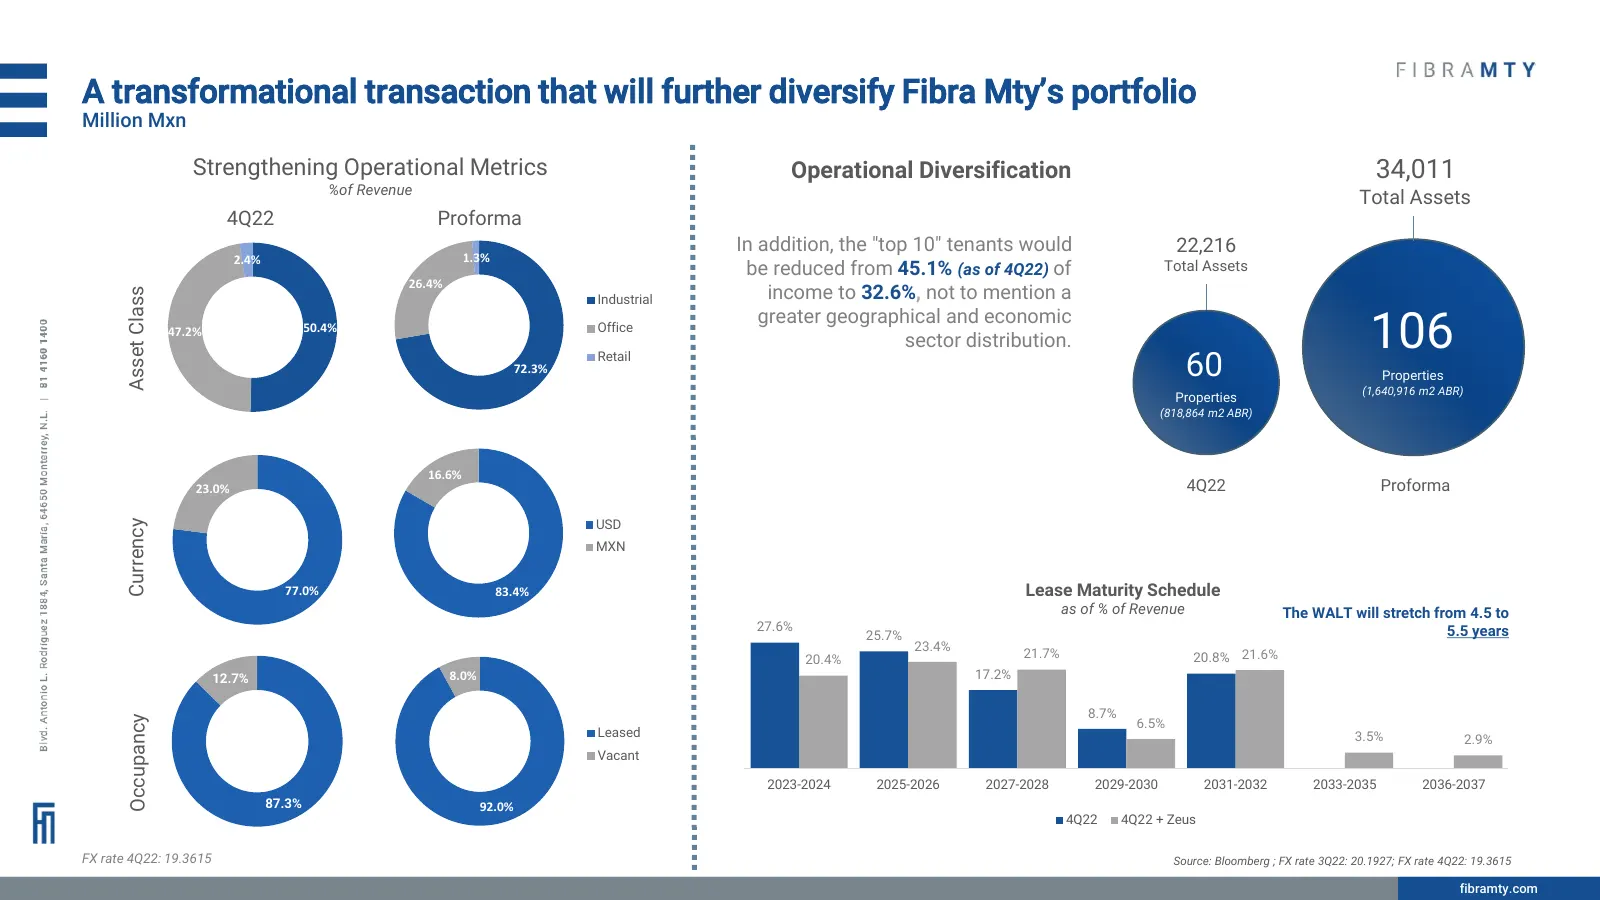
Slide 16: A transformational transaction that will further diversify the portfolio
A transformational transaction that will further diversify Fibra Mty’s portfolio Million Mxn Strengthening Operational Metrics Operational Diversification 34,011 %of Revenue Total Assets 4Q22 Proforma In addition, the "top 10" tenants would 22,216 2.4% 1.3% be reduced from 45.1% (as of 4Q22) of Tota
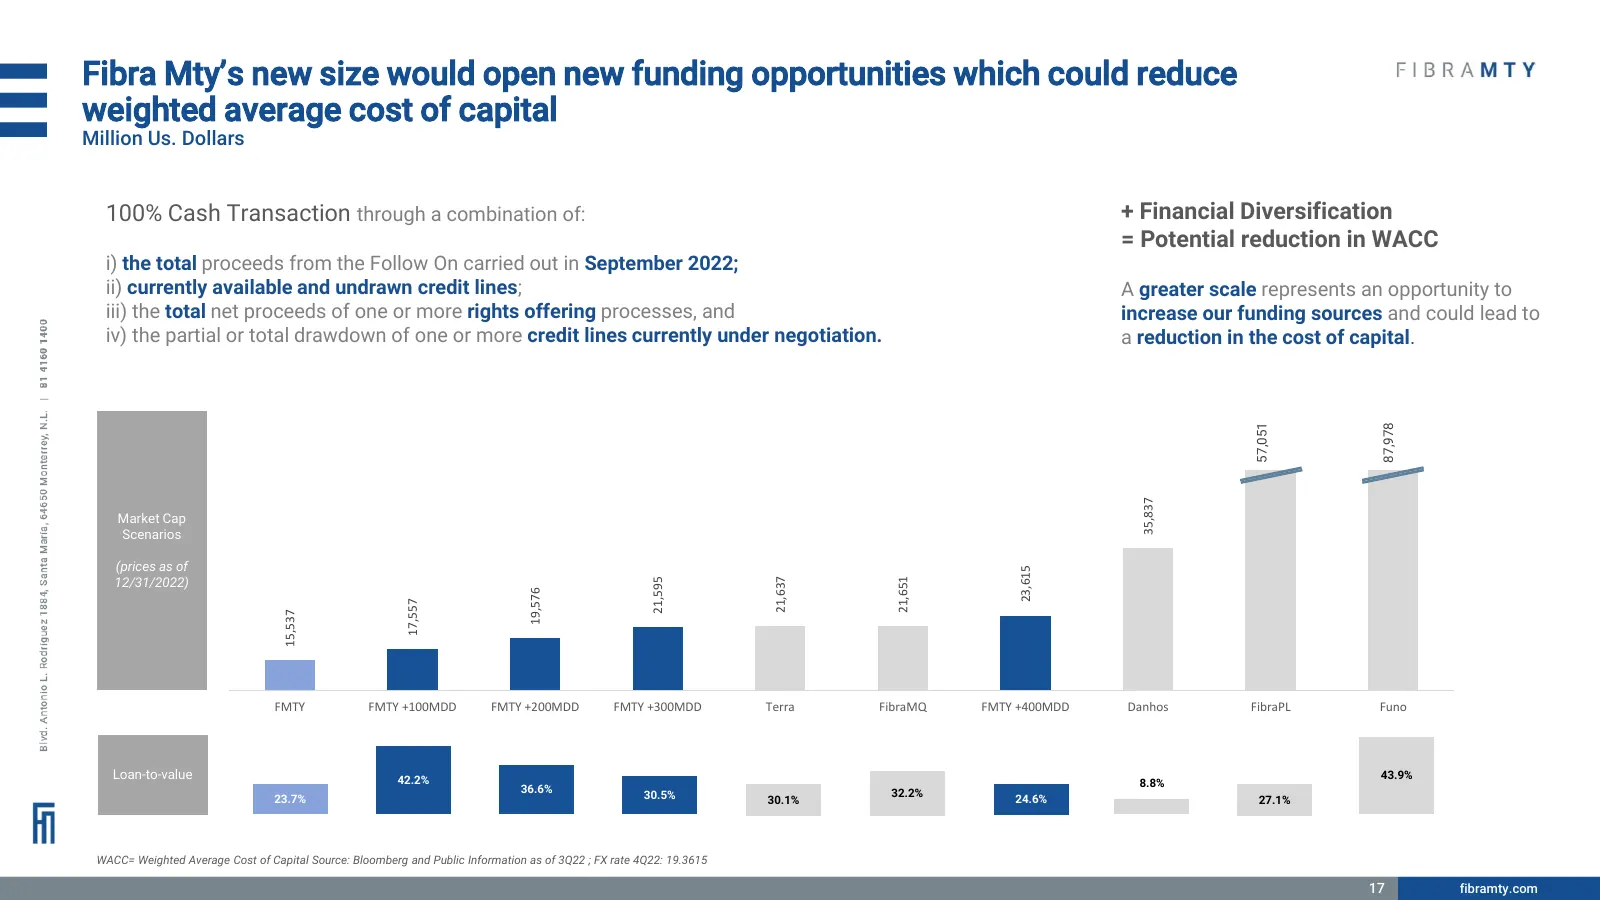
Slide 17: New size would open new funding opportunities and reduce cost of capital
Fibra Mty’s new size would open new funding opportunities which could reduce weighted average cost of capital Million Us. Dollars 100% Cash Transaction through a combination of: + Financial Diversification = Potential reduction in WACC i) the total proceeds from the Follow On carried out in Septembe
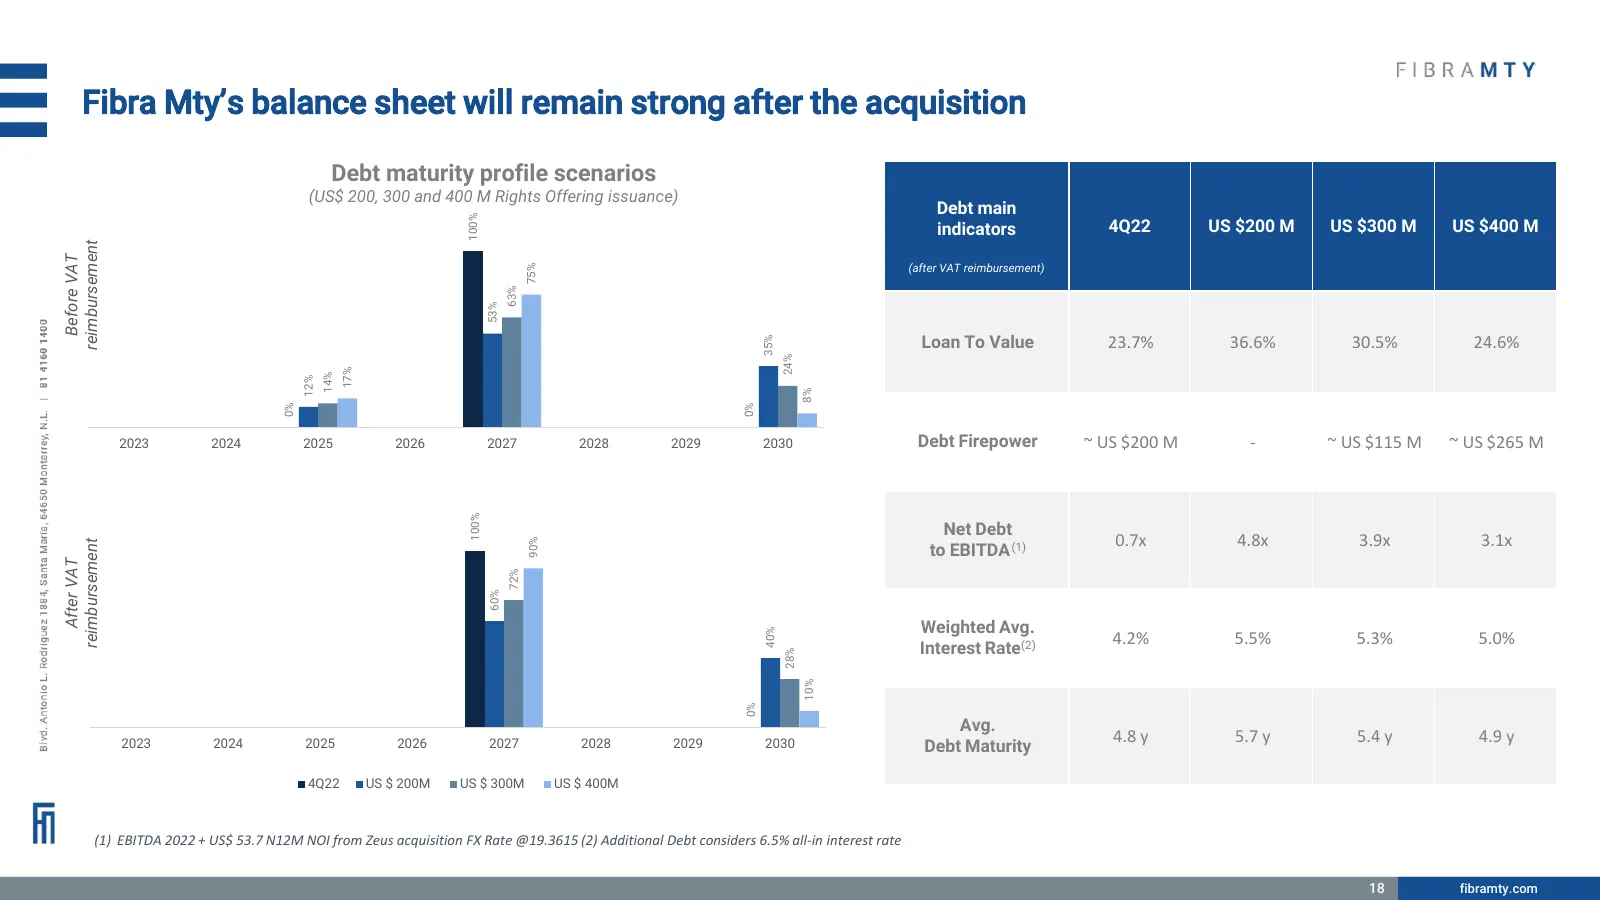
Slide 18: Balance sheet will remain strong after the acquisition
Fibra Mty’s balance sheet will remain strong after the acquisition Debt maturity profile scenarios (US$ 200, 300 and 400 M Rights Offering issuance) Debt main 100% indicators 4Q22 US $200 M US $300 M US $400 M reimbursement Before VAT (after VAT reimbursement) 75% 63% 53% Loan To Value 23.7% 36.6% 3
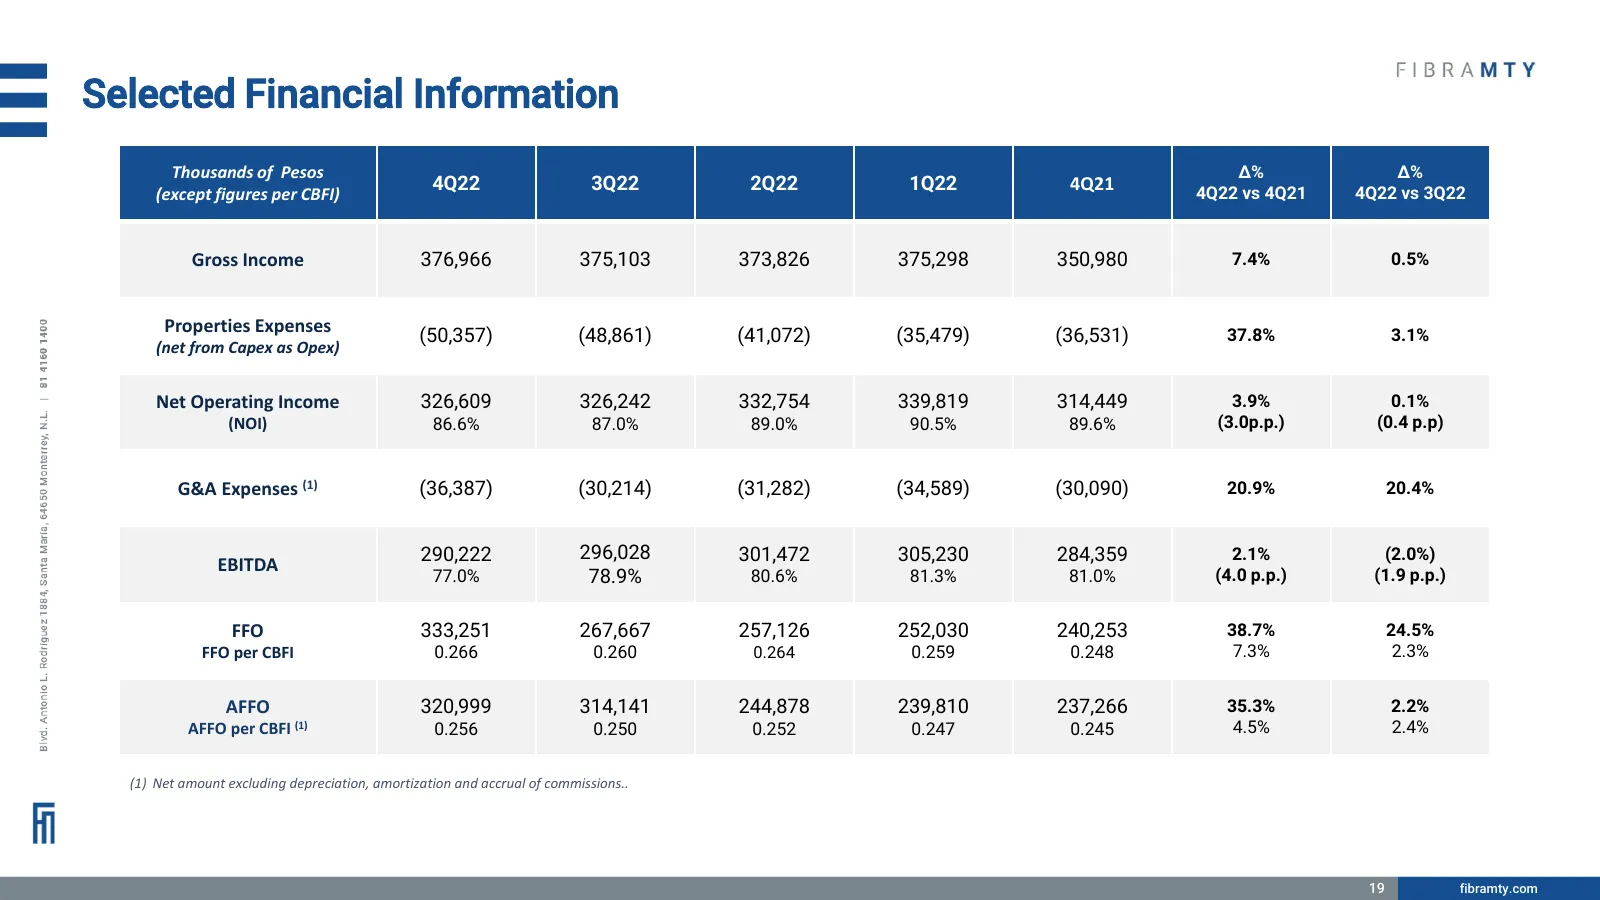
Slide 19: Selected Financial Information
Selected Financial Information Thousands of Pesos Δ% Δ% 4Q22 3Q22 2Q22 1Q22 4Q21 4Q22 vs 4Q21 4Q22 vs 3Q22 (except figures per CBFI) Gross Income 376,966 375,103 373,826 375,298 350,980 7.4% 0.5% Properties Expenses (50,357) (48,861) (41,072) (35,479) (36,531) 37.8% 3.1% (net from Capex as Opex) Net

Slide 20: Contact
Sistema de Entrenamiento en Ciberseguridad Contact: Cesar Rubalcava, CFA, CAIA Investor Relations crubalcava@fibramty.com
Source: Internet Archive copy of investorcloud.s3.amazonaws.com
More decks from Fibra MTY
 Q3 2024 Earnings Presentation24 slides · October 2024
 Q1 2024 Earnings Presentation18 slides · April 2024
 Q4 2023 Earnings Presentation16 slides · February 2024
 Q3 2023 Earnings Presentation16 slides · October 2023
 Q2 2023 Earnings Presentation17 slides · July 2023
 Q1 2023 Earnings Presentation16 slides · April 2023