Sysmex Corporation · TSE:6869
Sysmex — FY2008 Earnings Presentation
31 slides from Sysmex's earnings presentation, May 12, 2009
Slide 1: FY2008 Business Results
FY2008 Business Results Financial Highlights and the Mid-term Management Plan Hisashi Ietsugu, President and CEO May 12, 2009
Slide 2: Contents
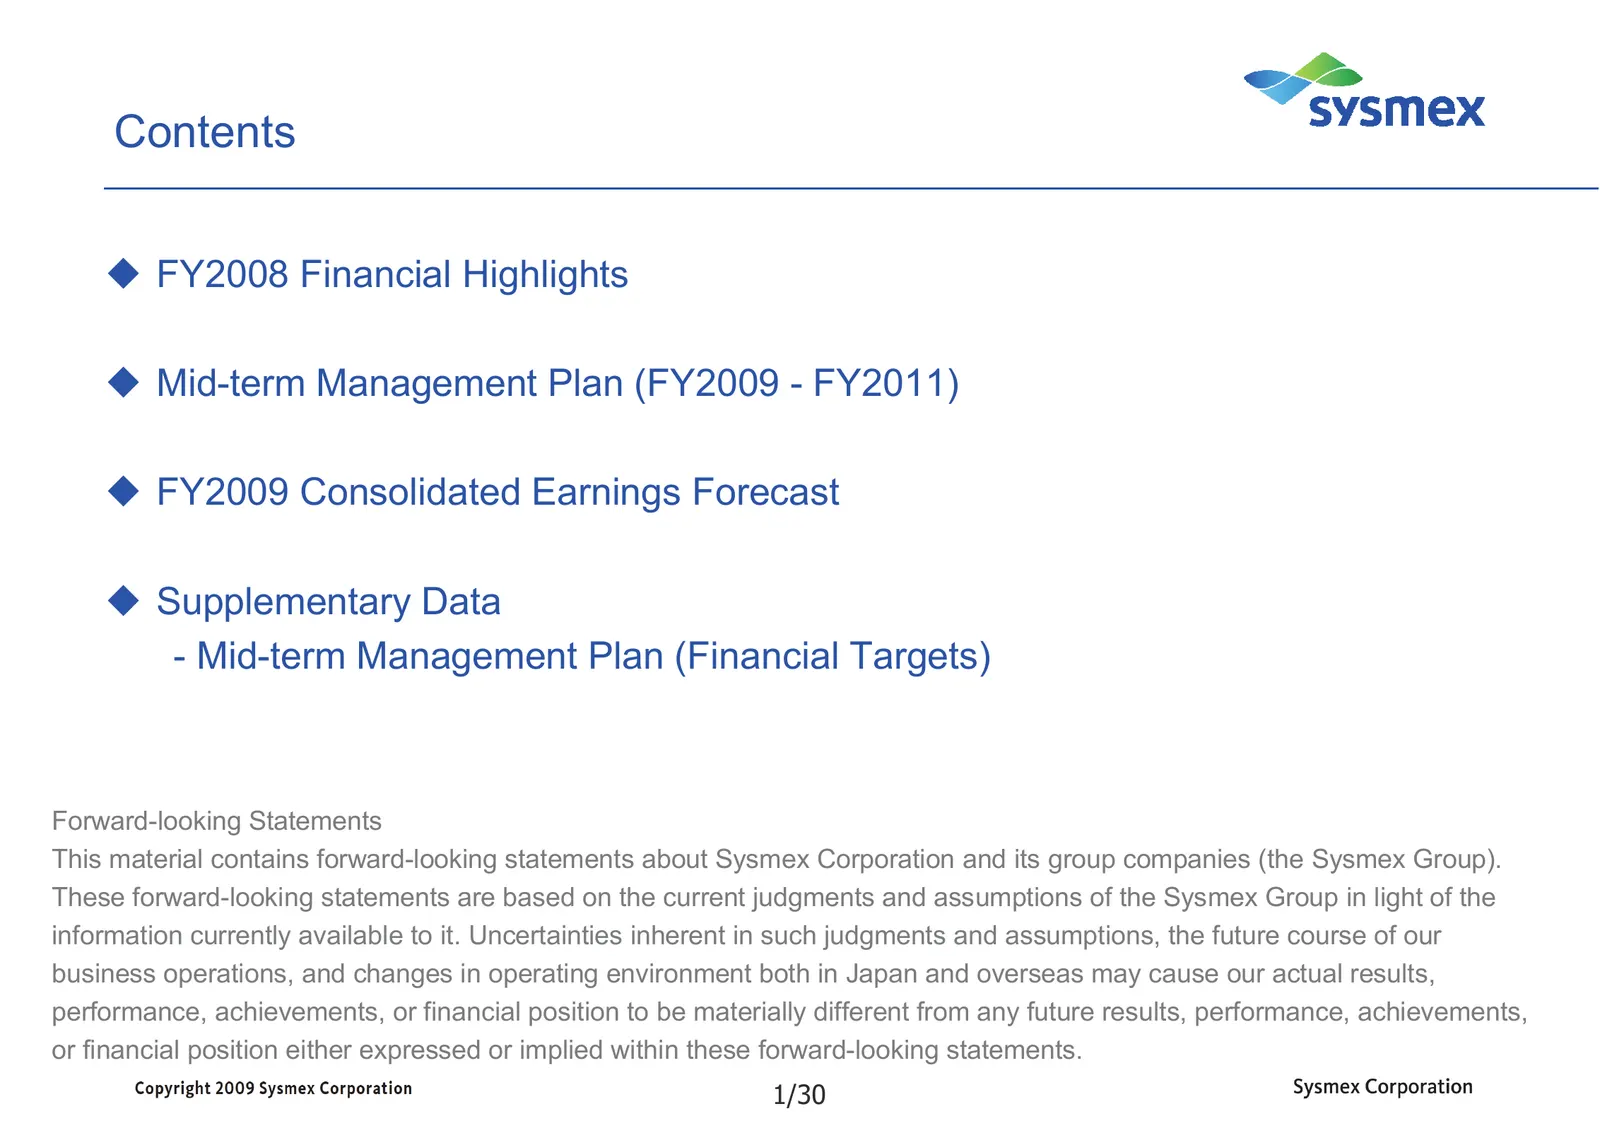
Contents FY2008 Financial Highlights Mid-term Management Plan (FY2009 - FY2011) FY2009 Consolidated Earnings Forecast Supplementary Data - Mid-term Management Plan (Financial Targets) Forward-looking Statements This material contains forward-looking statements about Sysmex Corporation and it
Slide 3: FY2008 Financial Highlights
FY2008 Financial Highlights 2/30
Slide 4: Financial Highlights
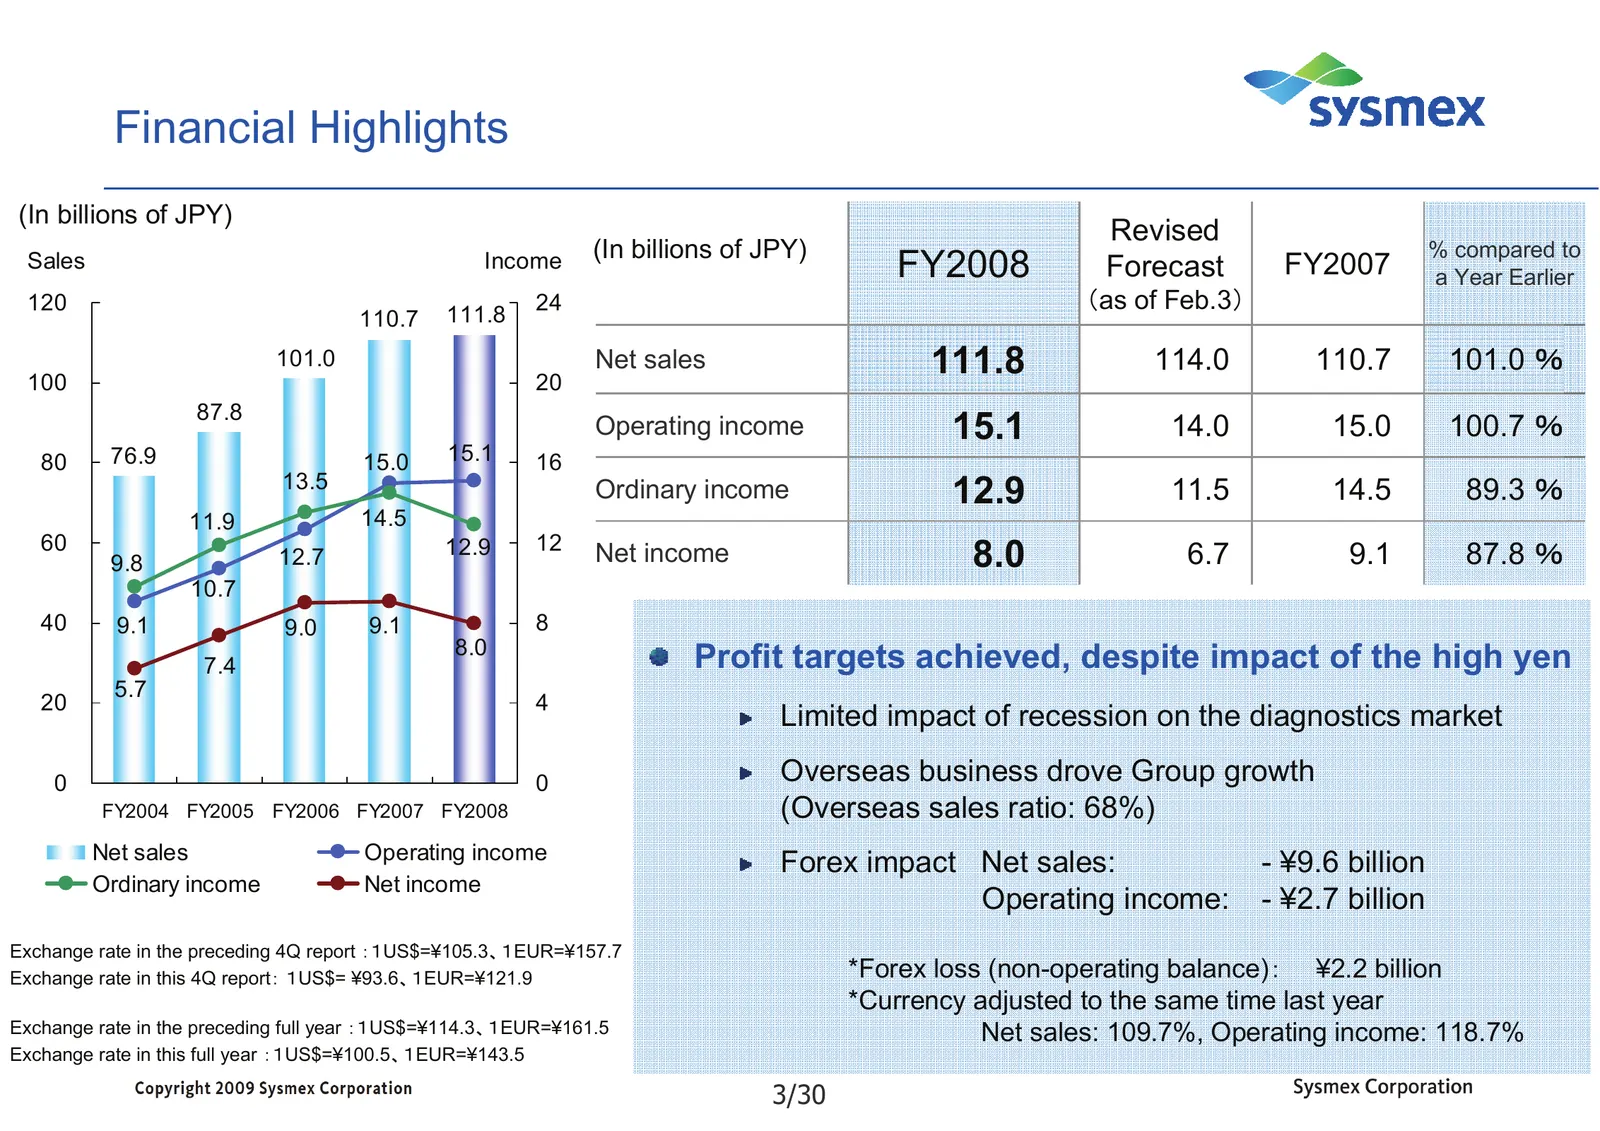
Financial Highlights (In billions of JPY) Revised (In billions of JPY) % compared to Sales Income FY2008 Forecast FY2007 a Year Earlier 120 111.8 24 (as of Feb.3) 110.7 100 101.0 20 Net sales 111.8 114.0 110.7 101.0 % 87.8 Operating income 15.1 14.0 15.0 100.7 % 80 76.9 15.0 15.1 16 13.5 Ordinary in
Slide 5: Breakdown of Net Sales and Operating Income
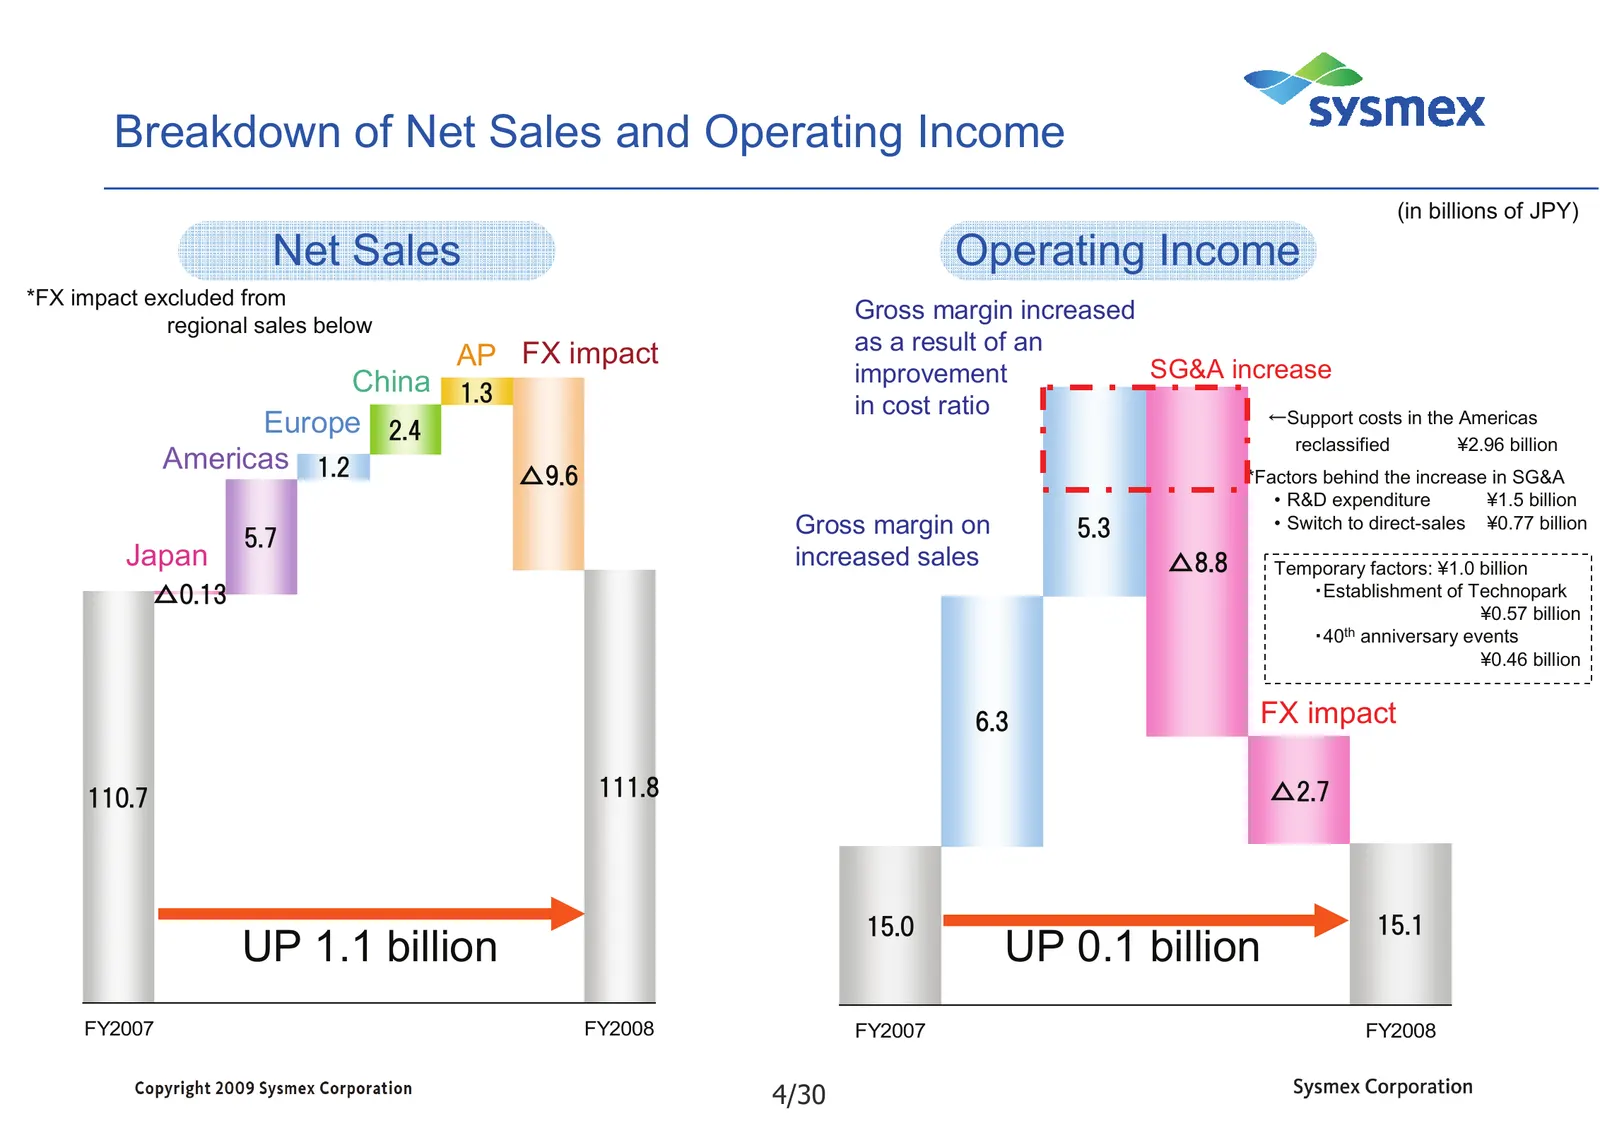
Breakdown of Net Sales and Operating Income (in billions of JPY) Net Sales Operating Income *FX impact excluded from Gross margin increased regional sales below as a result of an AP FX impact SG&A increase China 1.3 improvement in cost ratio Europe 2.4 ←Support costs in the Americas reclassified ¥2.
Slide 6: Breakdown of Balance Sheet
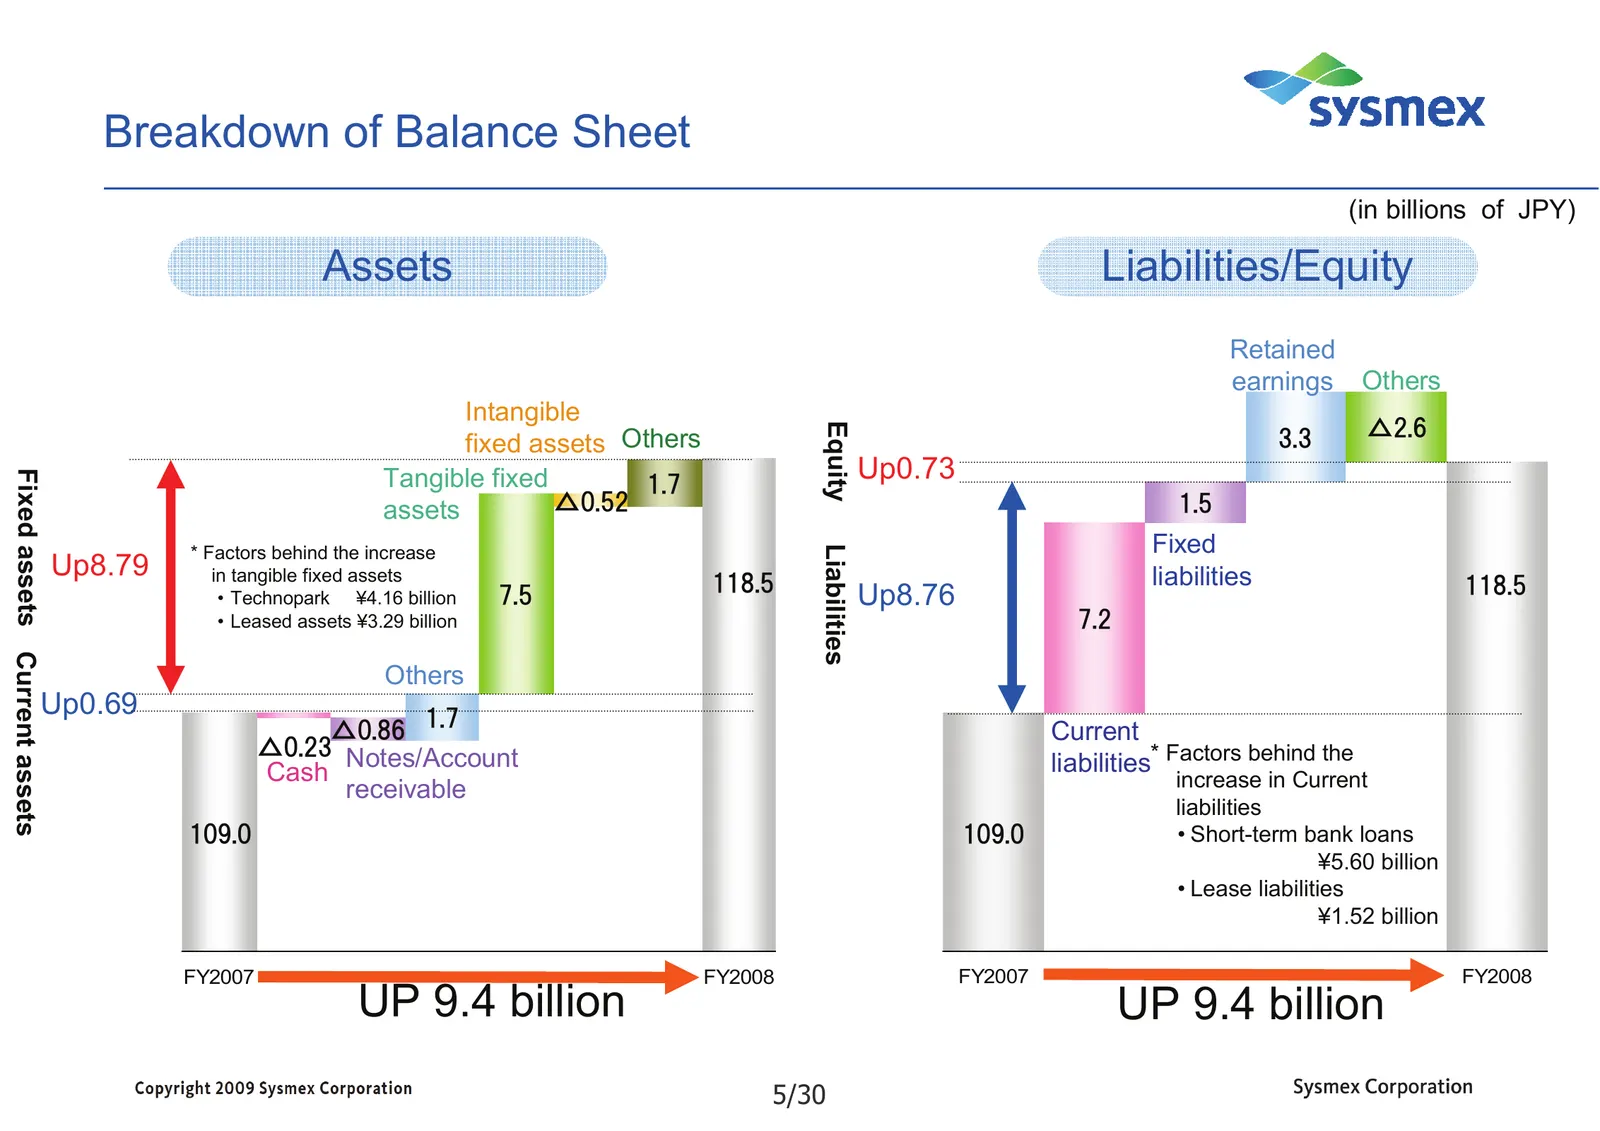
Breakdown of Balance Sheet (in billions of JPY) Assets Liabilities/Equity Retained earnings Others Intangible △2.6 Equity fixed assets Others 3.3 Tangible fixed Up0.73 Fixed assets Current assets 1.7 assets △0.52 1.5 * Factors behind the increase Fixed Liabilities Up8.79 in tangible fixed assets lia
Slide 7: Consolidated Cash Flow
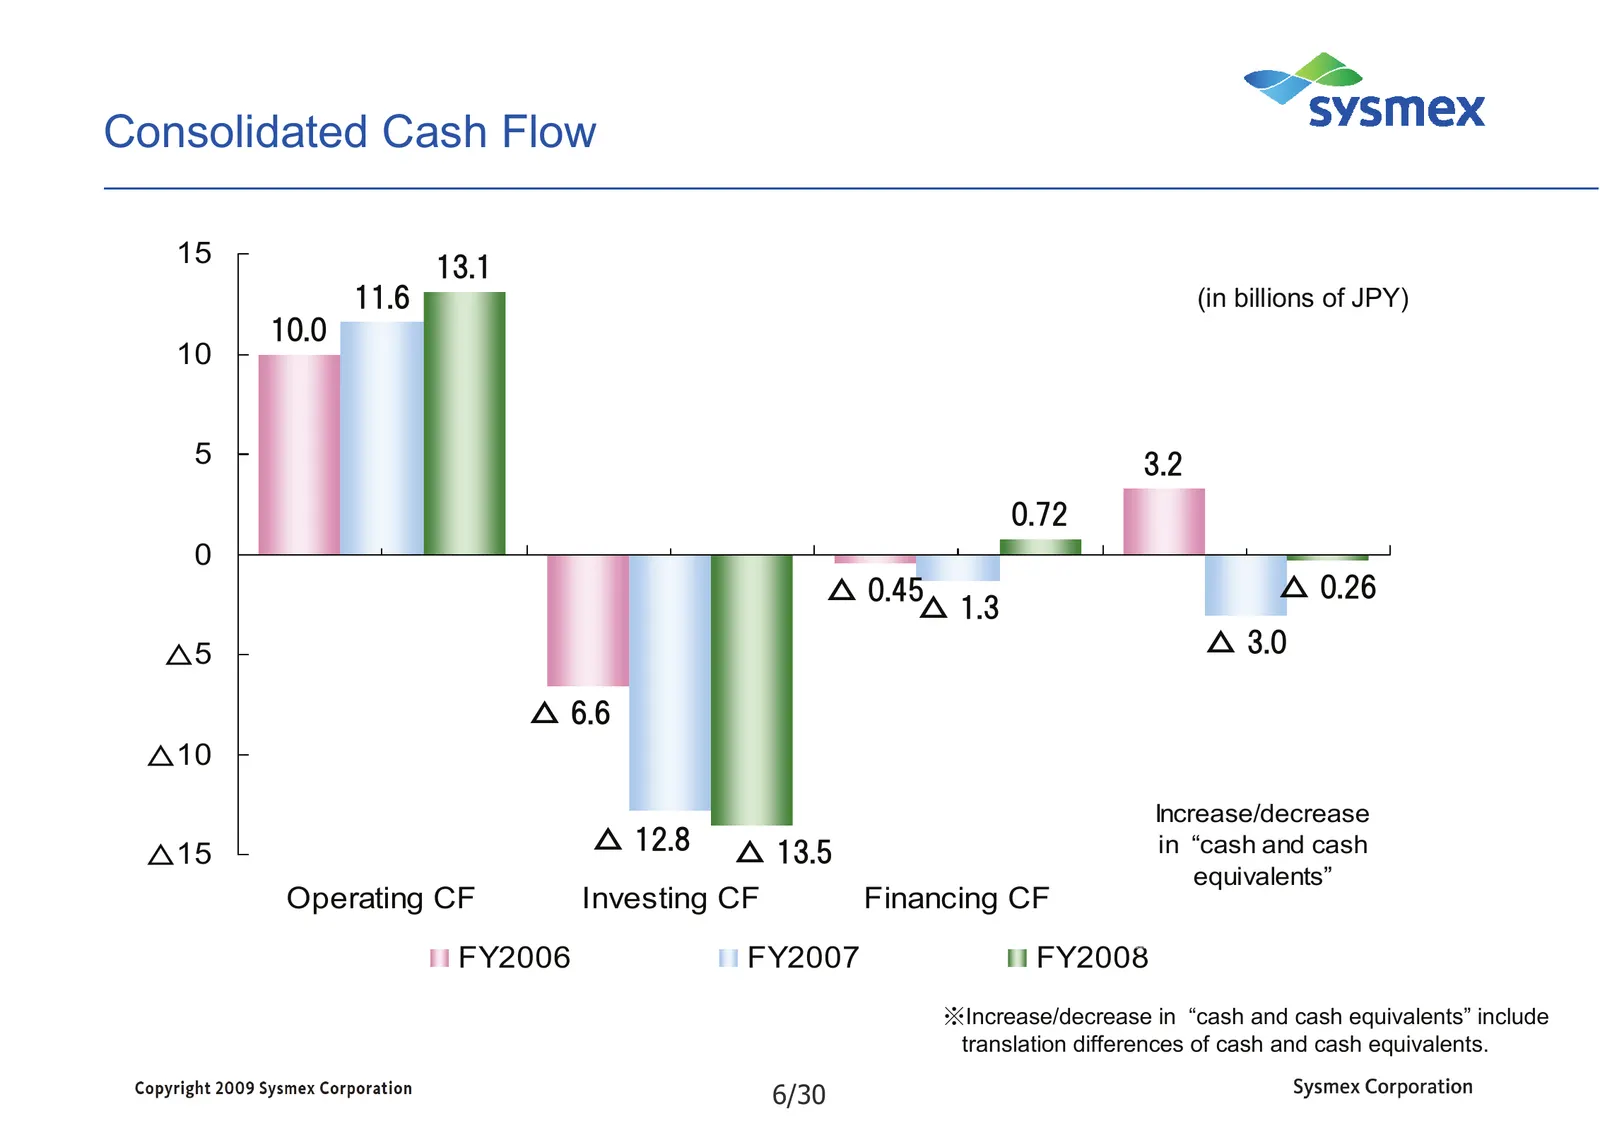
Consolidated Cash Flow 15 13.1 11.6 (in billions of JPY) 10.0 10 5 3.2 0.72 0 △ 0.45 △ 0.26 △ 1.3 △5 △ 3.0 △ 6.6 △10 Increase/decrease △ 12.8 in “cash and cash △15 △ 13.5 equivalents” Operating CF Investing CF Financing CF FY2006 FY2007 FY2008 ※Increase/decrease in “cash and cash equivalents” includ
Slide 8: Projected Dividend
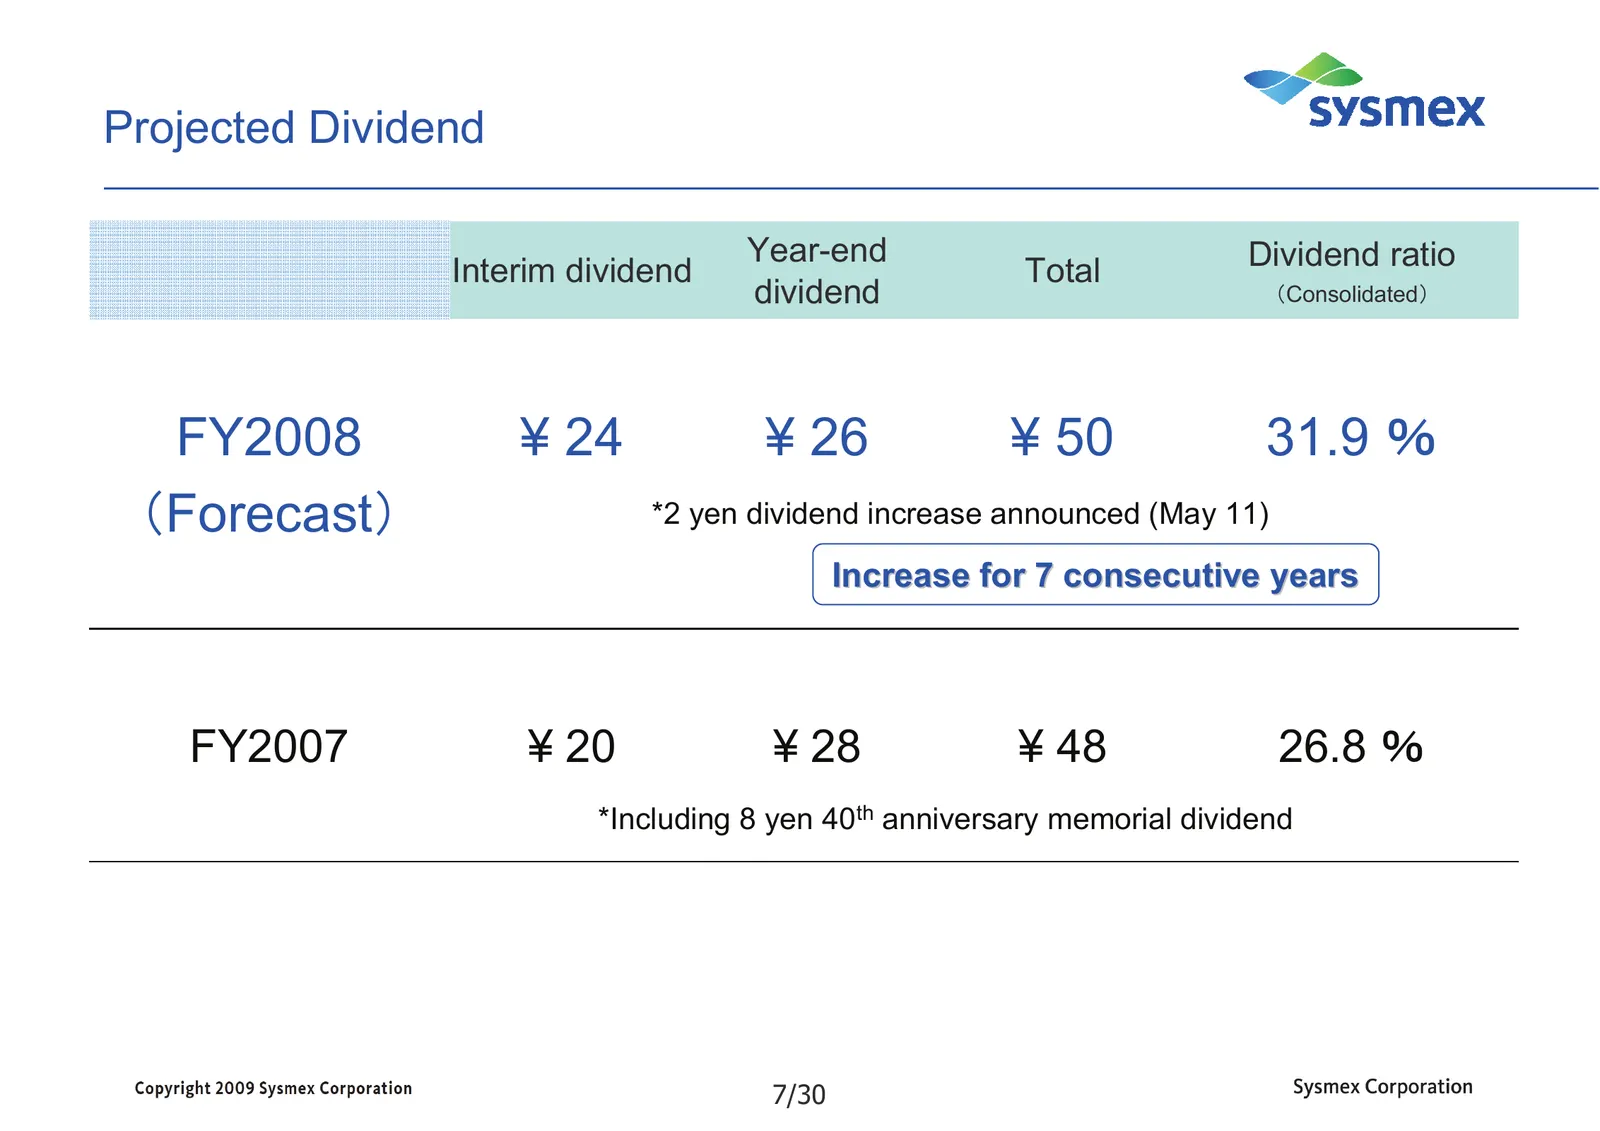
Projected Dividend Year-end Dividend ratio Interim dividend Total dividend (Consolidated) FY2008 ¥ 24 ¥ 26 ¥ 50 31.9 % (Forecast) *2 yen dividend increase announced (May 11) Increase for 7 consecutive years FY2007 ¥ 20 ¥ 28 ¥ 48 26.8 % *Including 8 yen 40th anniversary memorial dividend 7/30
Slide 9: Changes in Accounting Standards
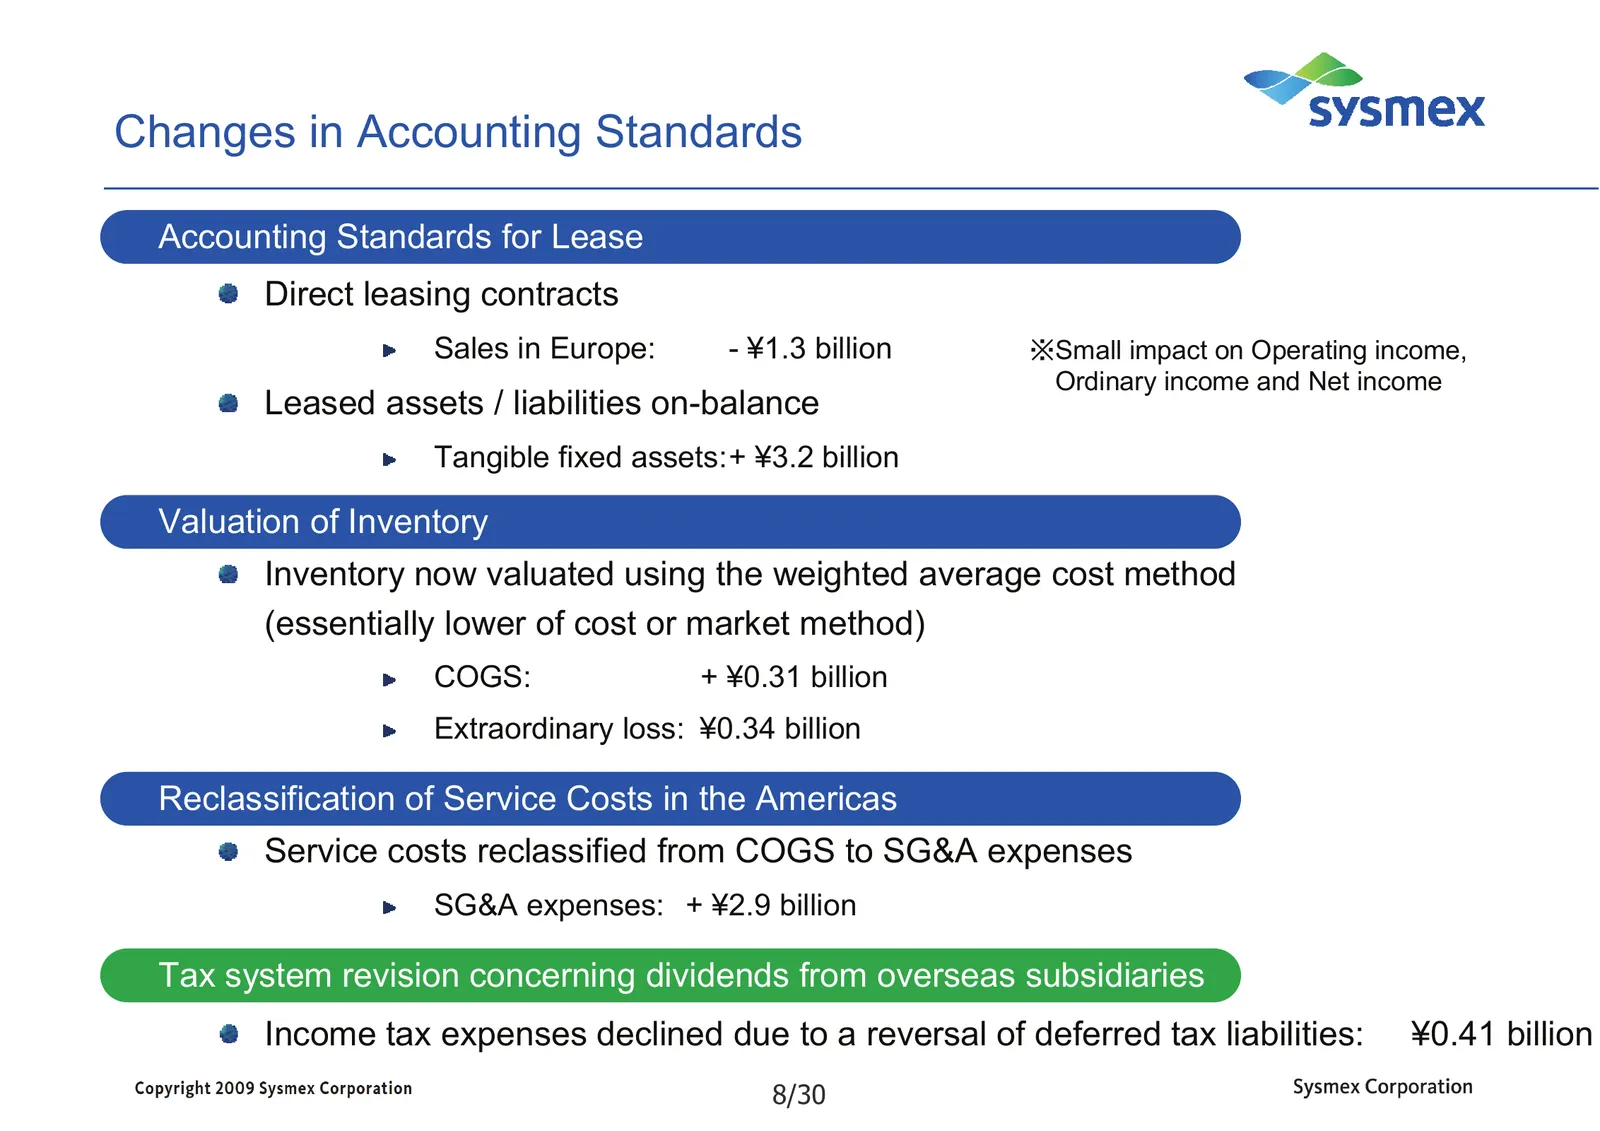
Changes in Accounting Standards Accounting Standards for Lease Direct leasing contracts Sales in Europe: - ¥1.3 billion ※Small impact on Operating income, Ordinary income and Net income Leased assets / liabilities on-balance Tangible fixed assets:+ ¥3.2 billion Valuation of Inventory Inventory now v
Slide 10: Topics
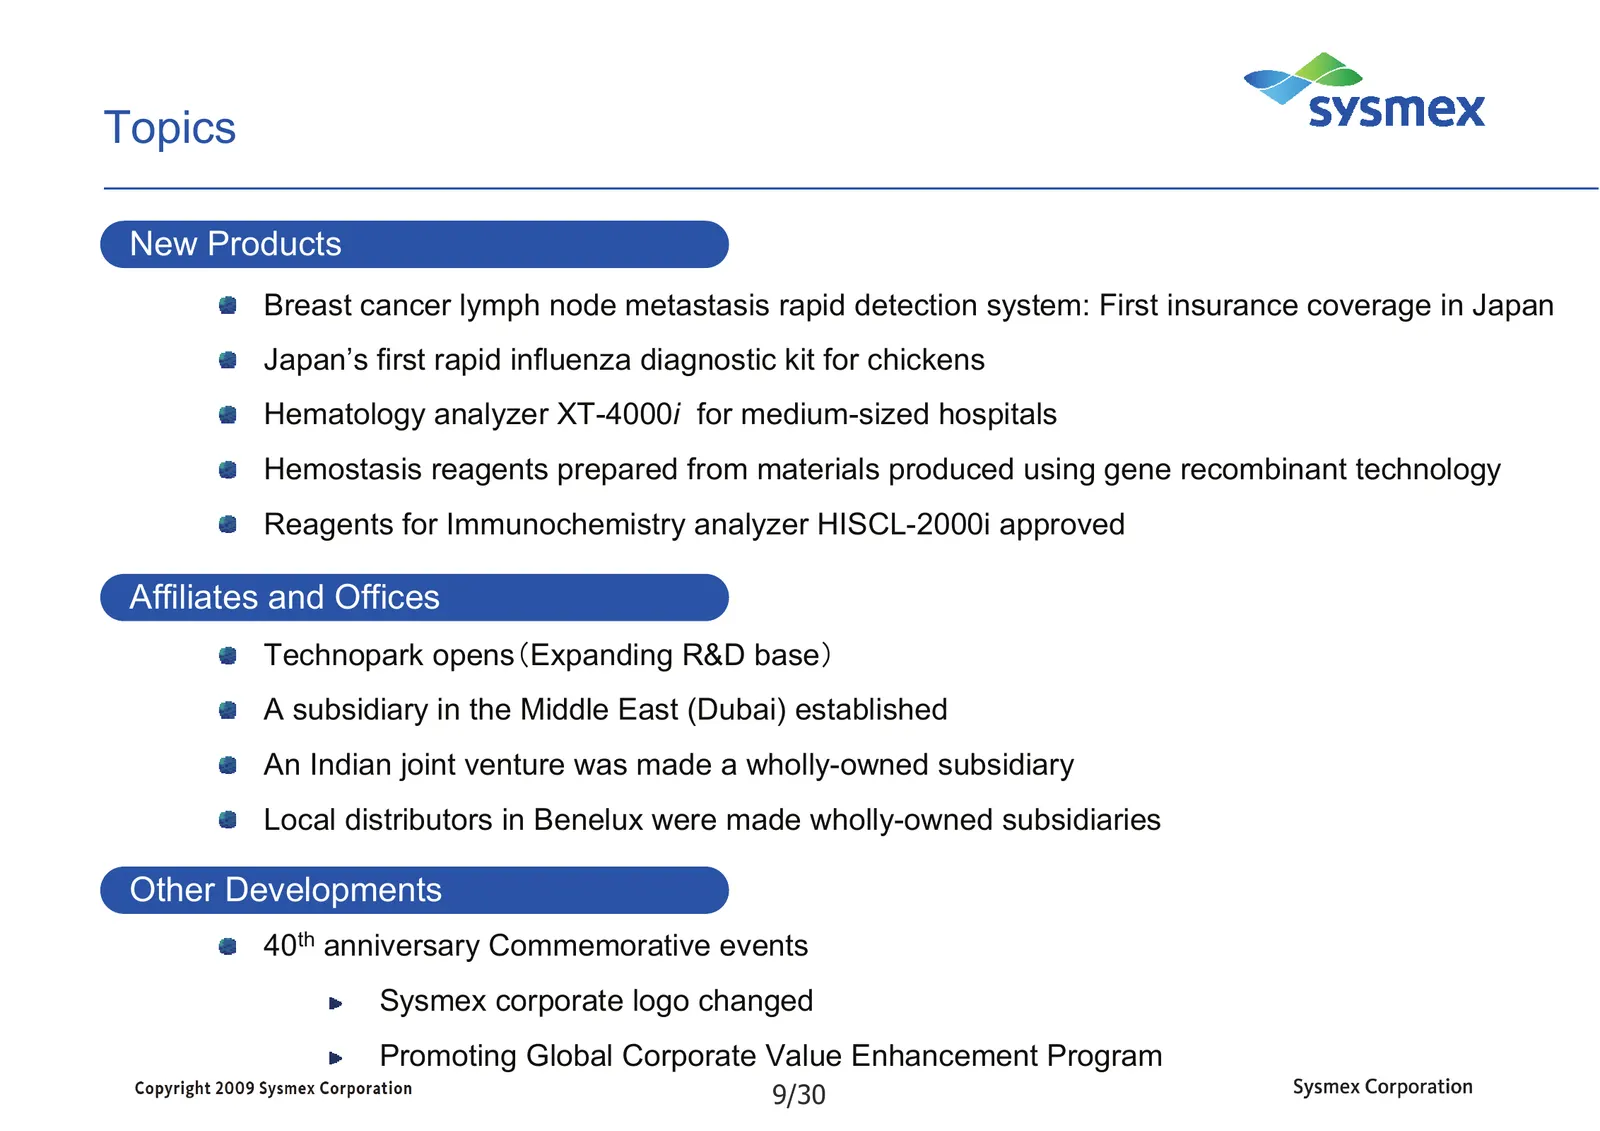
Topics New Products Breast cancer lymph node metastasis rapid detection system: First insurance coverage in Japan Japan’s first rapid influenza diagnostic kit for chickens Hematology analyzer XT-4000i for medium-sized hospitals Hemostasis reagents prepared from materials produced using gene recombin
Slide 11: Geographic Segment Information – The Americas
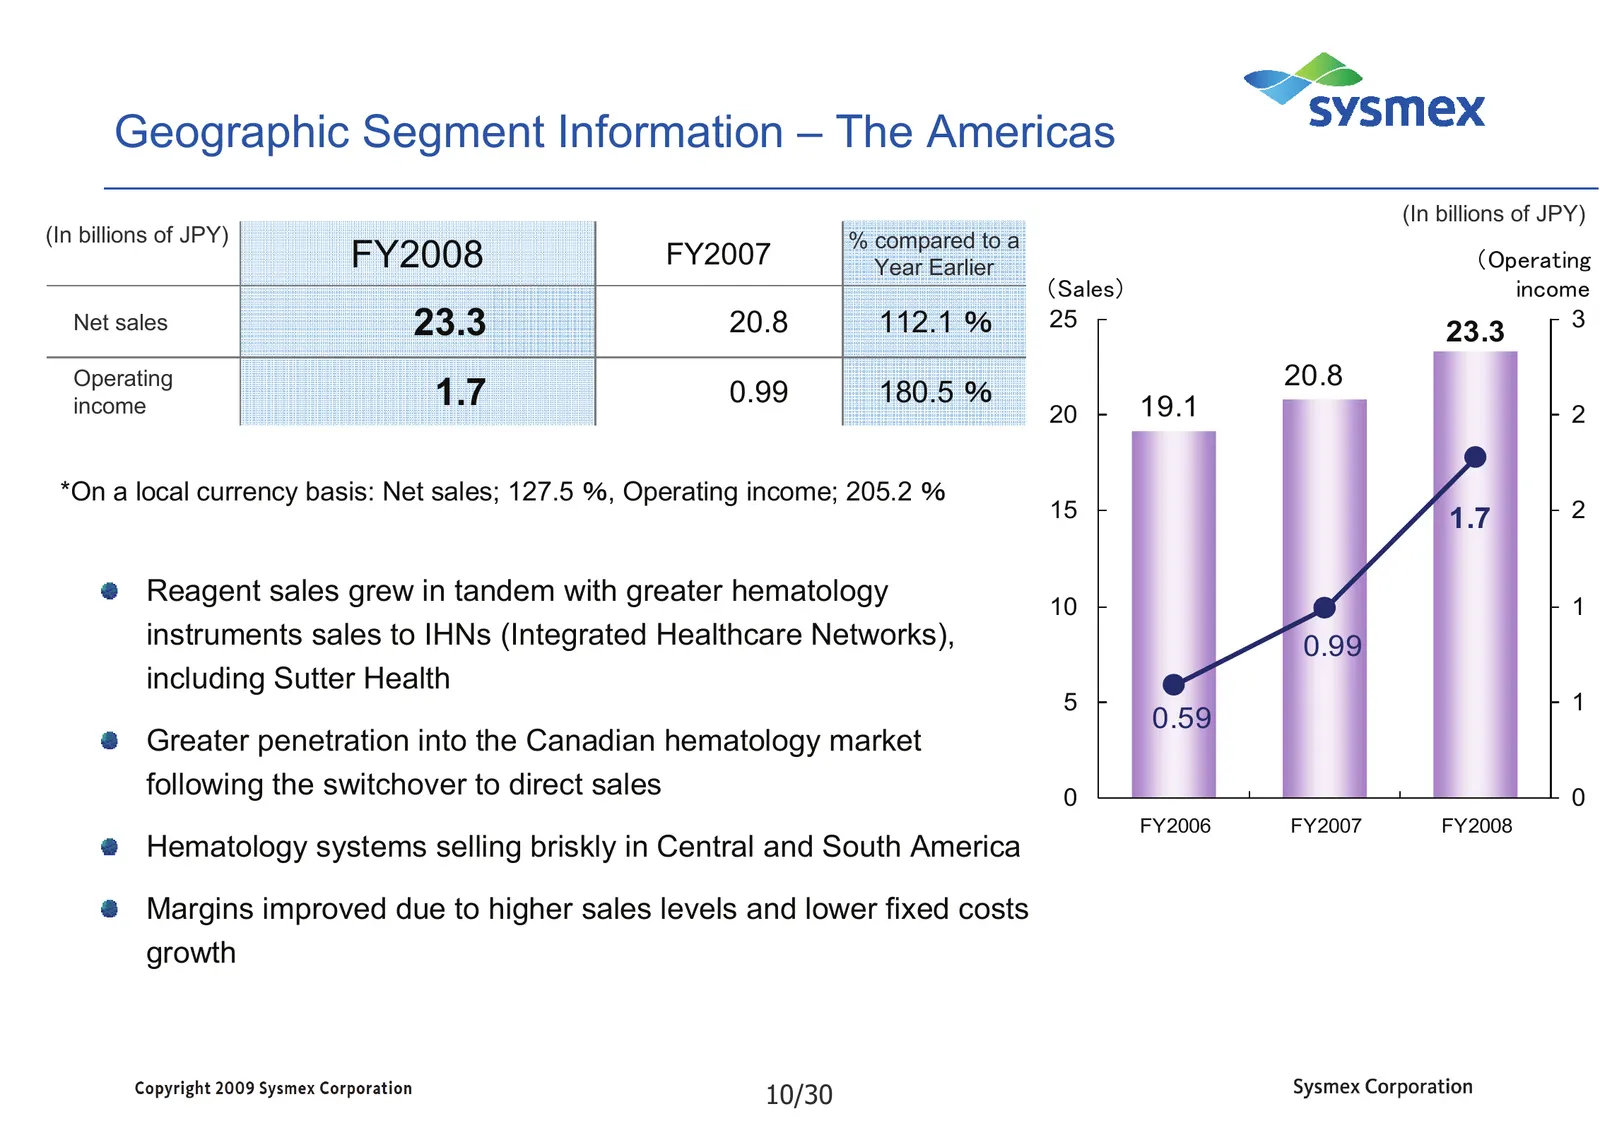
Geographic Segment Information – The Americas (In billions of JPY) (In billions of JPY) % compared to a FY2008 FY2007 Year Earlier (Operating (Sales) income Net sales 23.3 20.8 112.1 % 25 23.3 3 Operating 20.8 income 1.7 0.99 180.5 % 20 19.1 2 *On a local currency basis: Net sales; 127.5 %, Operatin
Slide 12: Geographic Segment Information - Europe
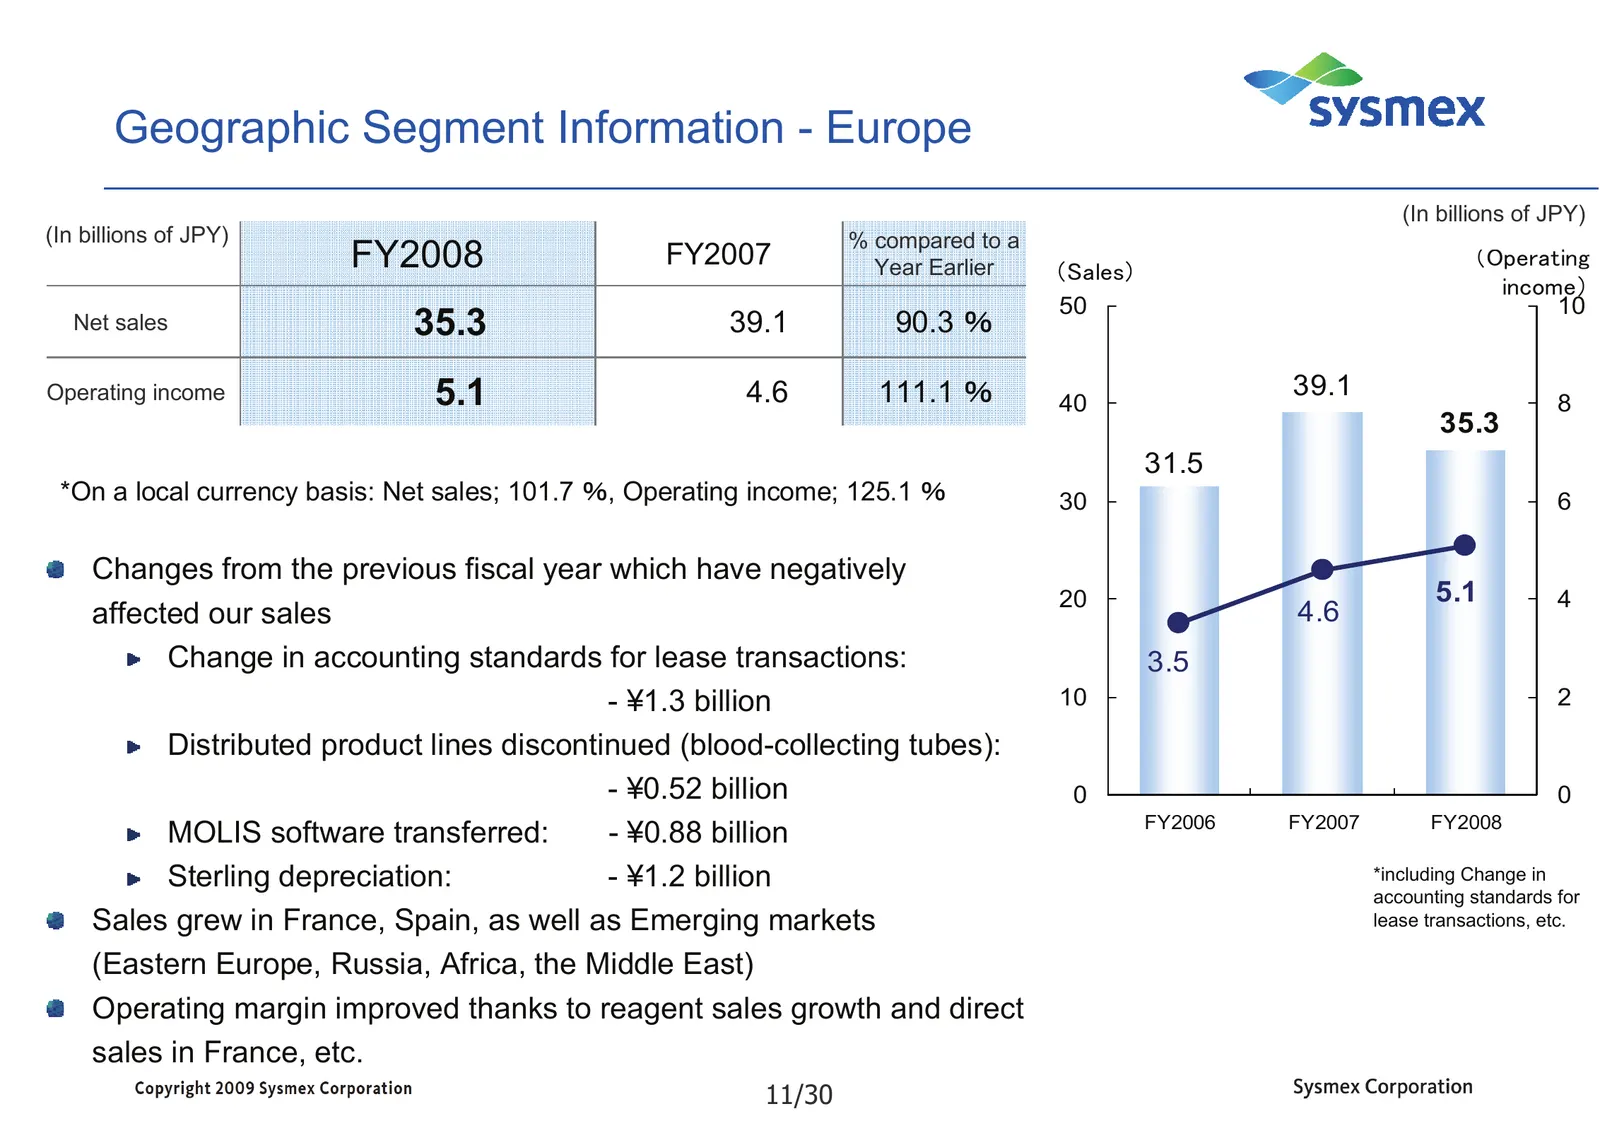
Geographic Segment Information - Europe (In billions of JPY) (In billions of JPY) % compared to a FY2008 FY2007 Year Earlier (Sales) (Operating income) 50 10 Net sales 35.3 39.1 90.3 % Operating income 5.1 4.6 111.1 % 39.1 40 8 35.3 31.5 *On a local currency basis: Net sales; 101.7 %, Operating inco
Slide 13: Geographic Segment Information - China
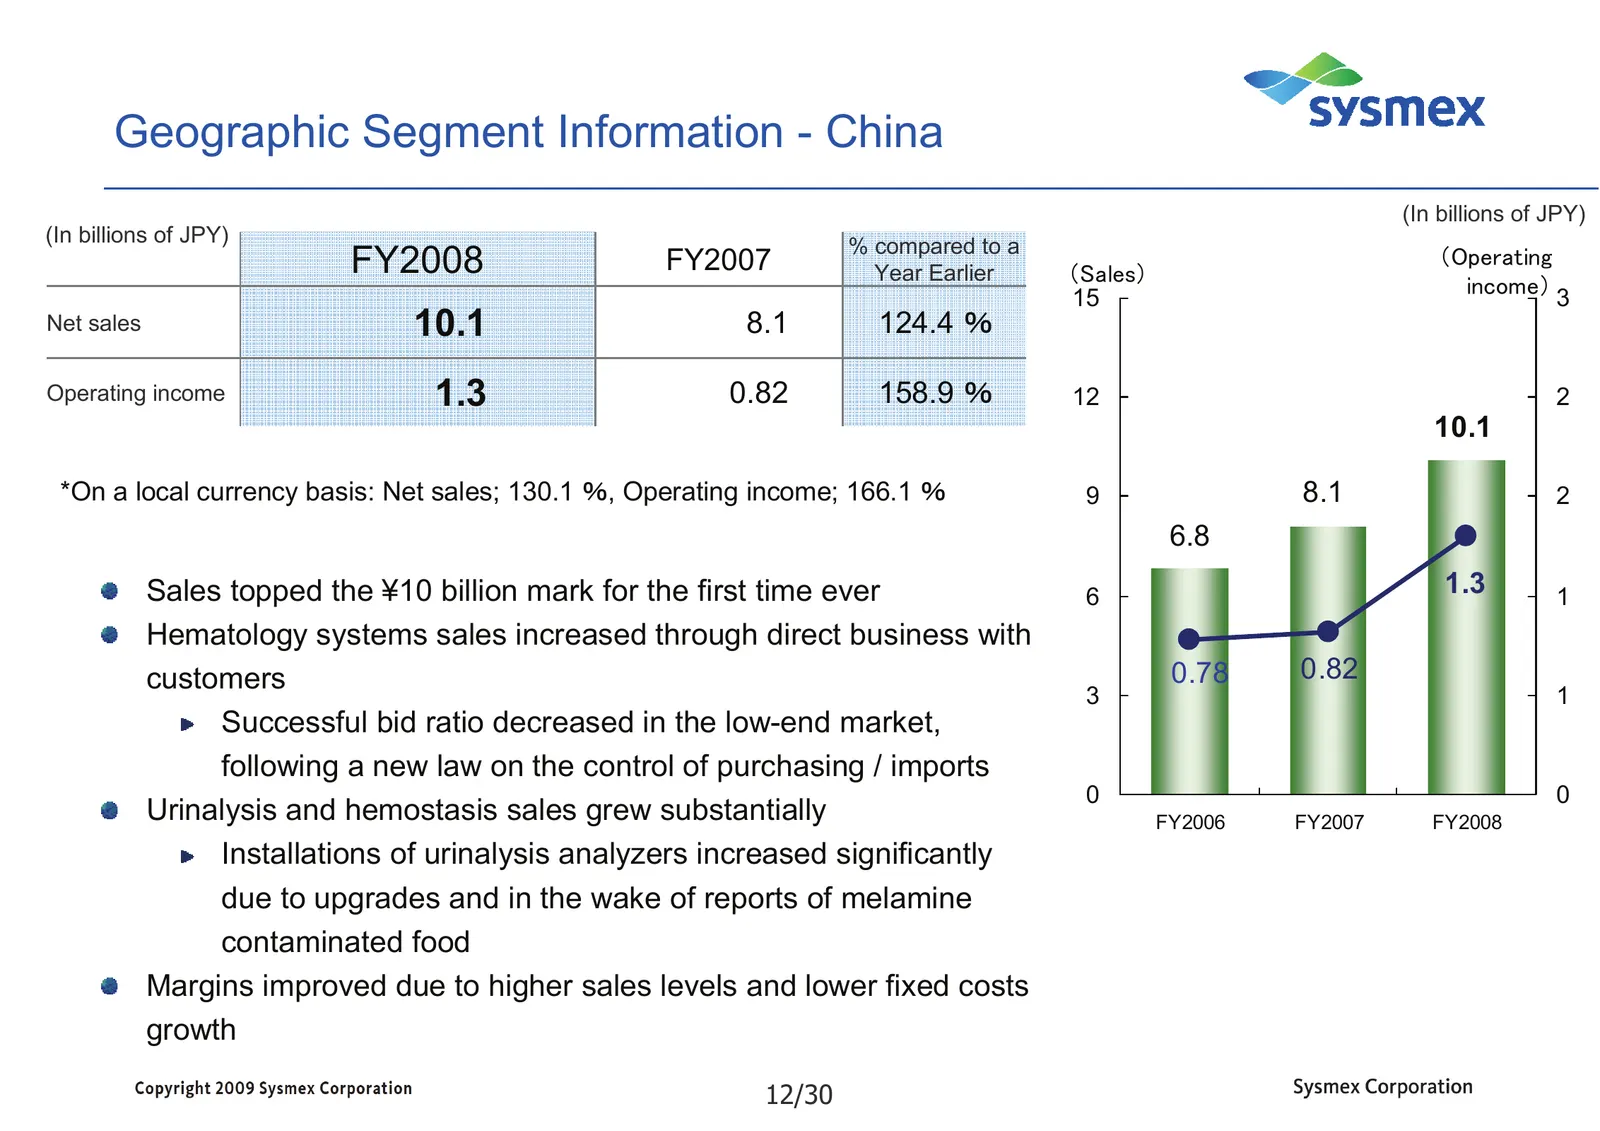
Geographic Segment Information - China (In billions of JPY) (In billions of JPY) % compared to a FY2008 FY2007 Year Earlier (Sales) (Operating 15 income) 3 Net sales 10.1 8.1 124.4 % Operating income 1.3 0.82 158.9 % 12 2 10.1 *On a local currency basis: Net sales; 130.1 %, Operating income; 166.1 %
Slide 14: Geographic Segment Information - AP
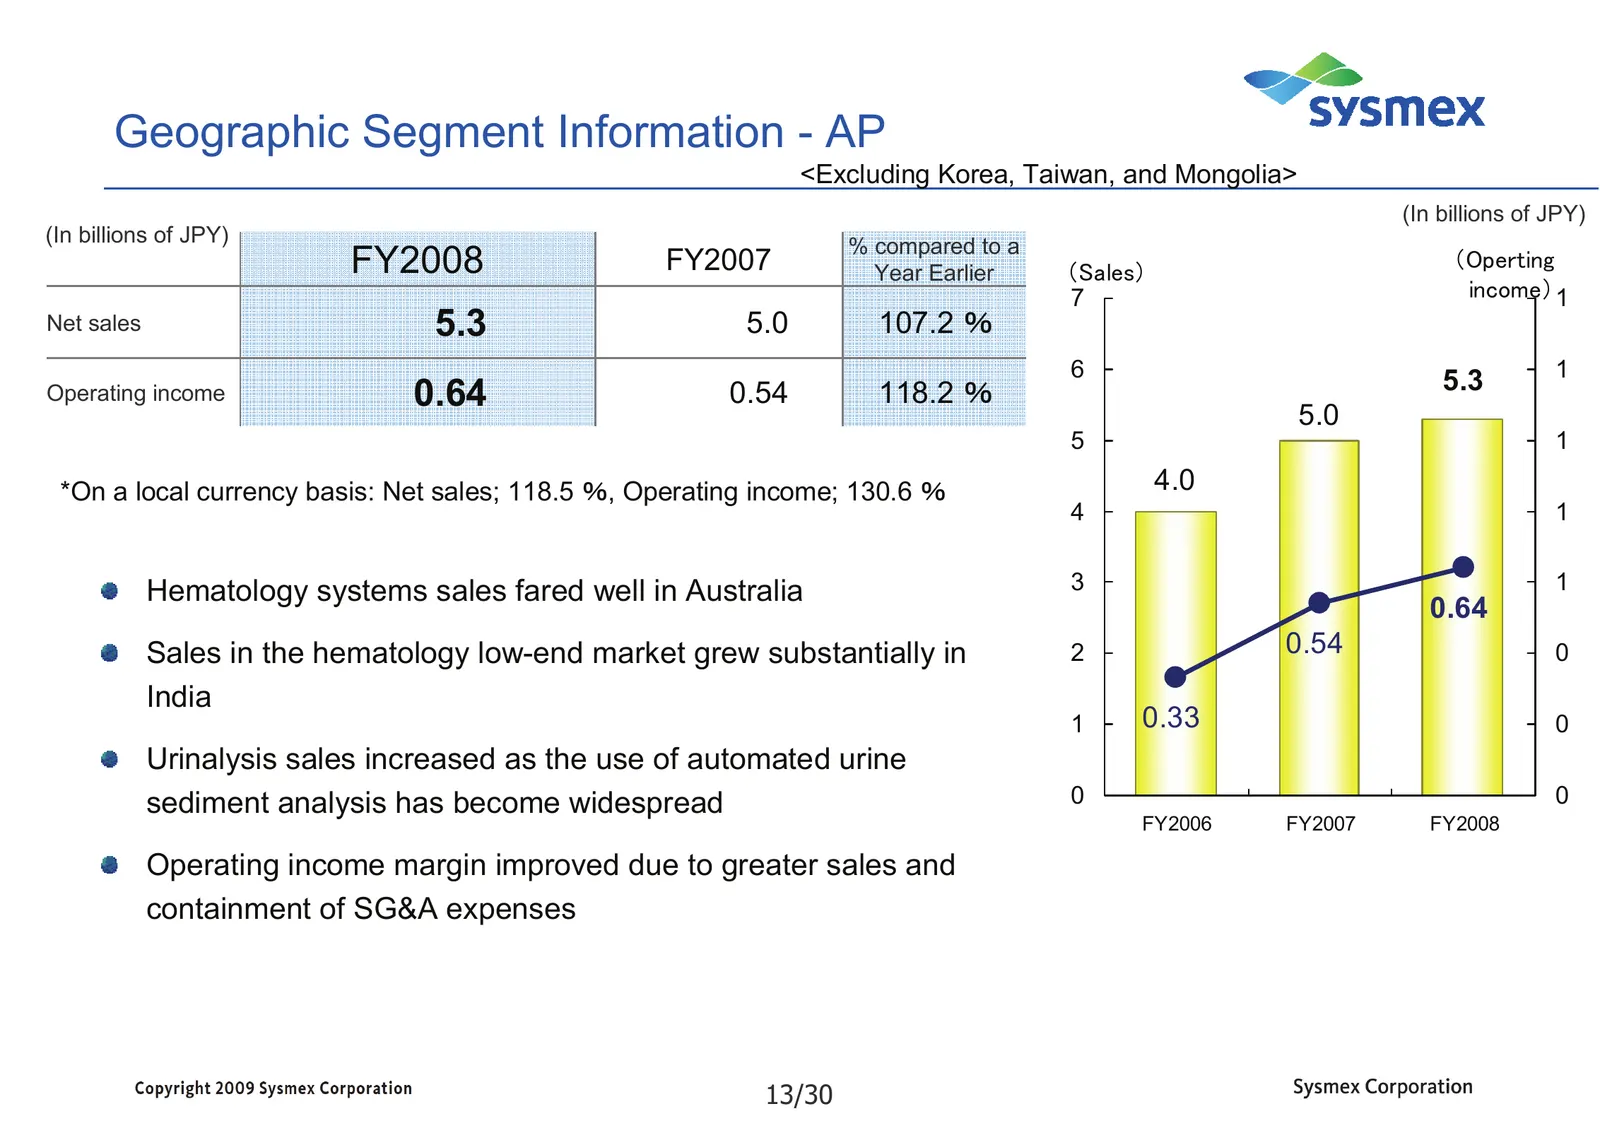
Geographic Segment Information - AP <Excluding Korea, Taiwan, and Mongolia> (In billions of JPY) (In billions of JPY) % compared to a FY2008 FY2007 Year Earlier (Sales) (Operting 7 income) 1 Net sales 5.3 5.0 107.2 % 6 1 5.3 Operating income 0.64 0.54 118.2 % 5.0 5 1 *On a local currency basis: Net
Slide 15: Geographic Segment Information - Japan
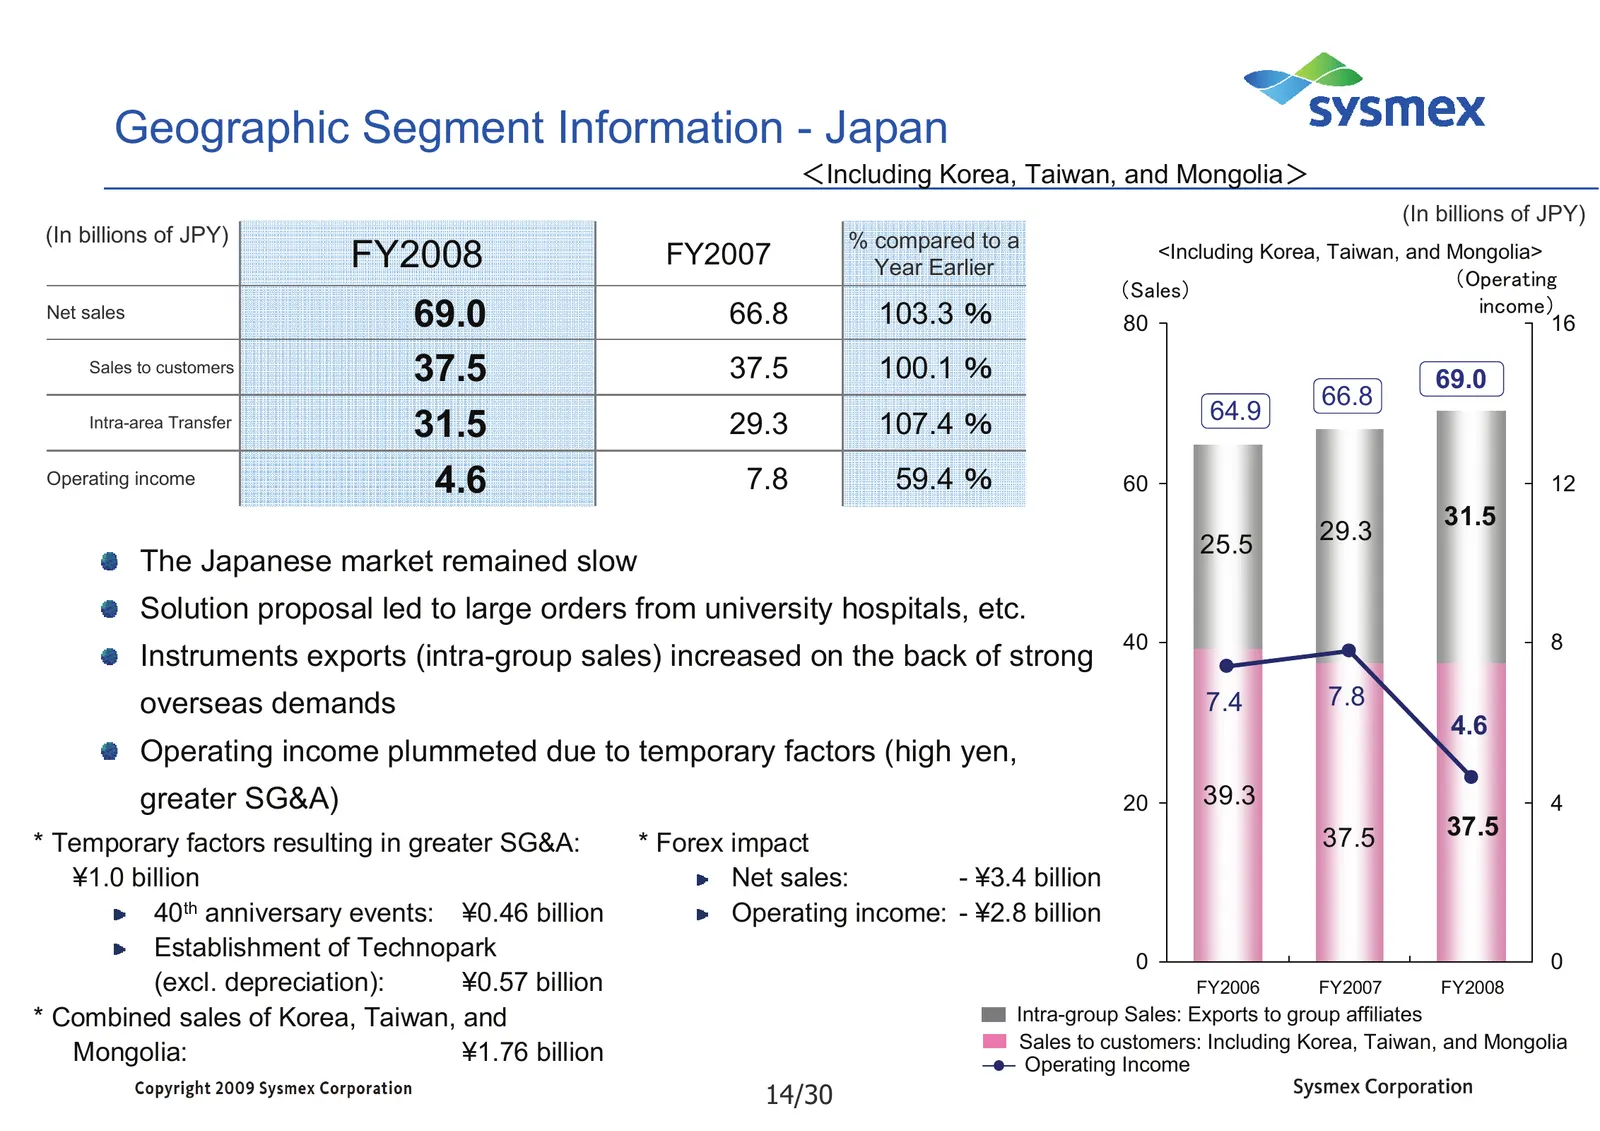
Geographic Segment Information - Japan <Including Korea, Taiwan, and Mongolia> (In billions of JPY) (In billions of JPY) % compared to a FY2008 FY2007 Year Earlier <Including Korea, Taiwan, and Mongolia> (Sales) (Operating Net sales 69.0 66.8 103.3 % 80 income) 16 Sales to customers 37.5 37.5 100.1
Slide 16: Mid-term Management Plan (FY2009 - FY2011)
Mid-term Management Plan (FY2009 - FY2011) 15/30
Slide 17: External Environment
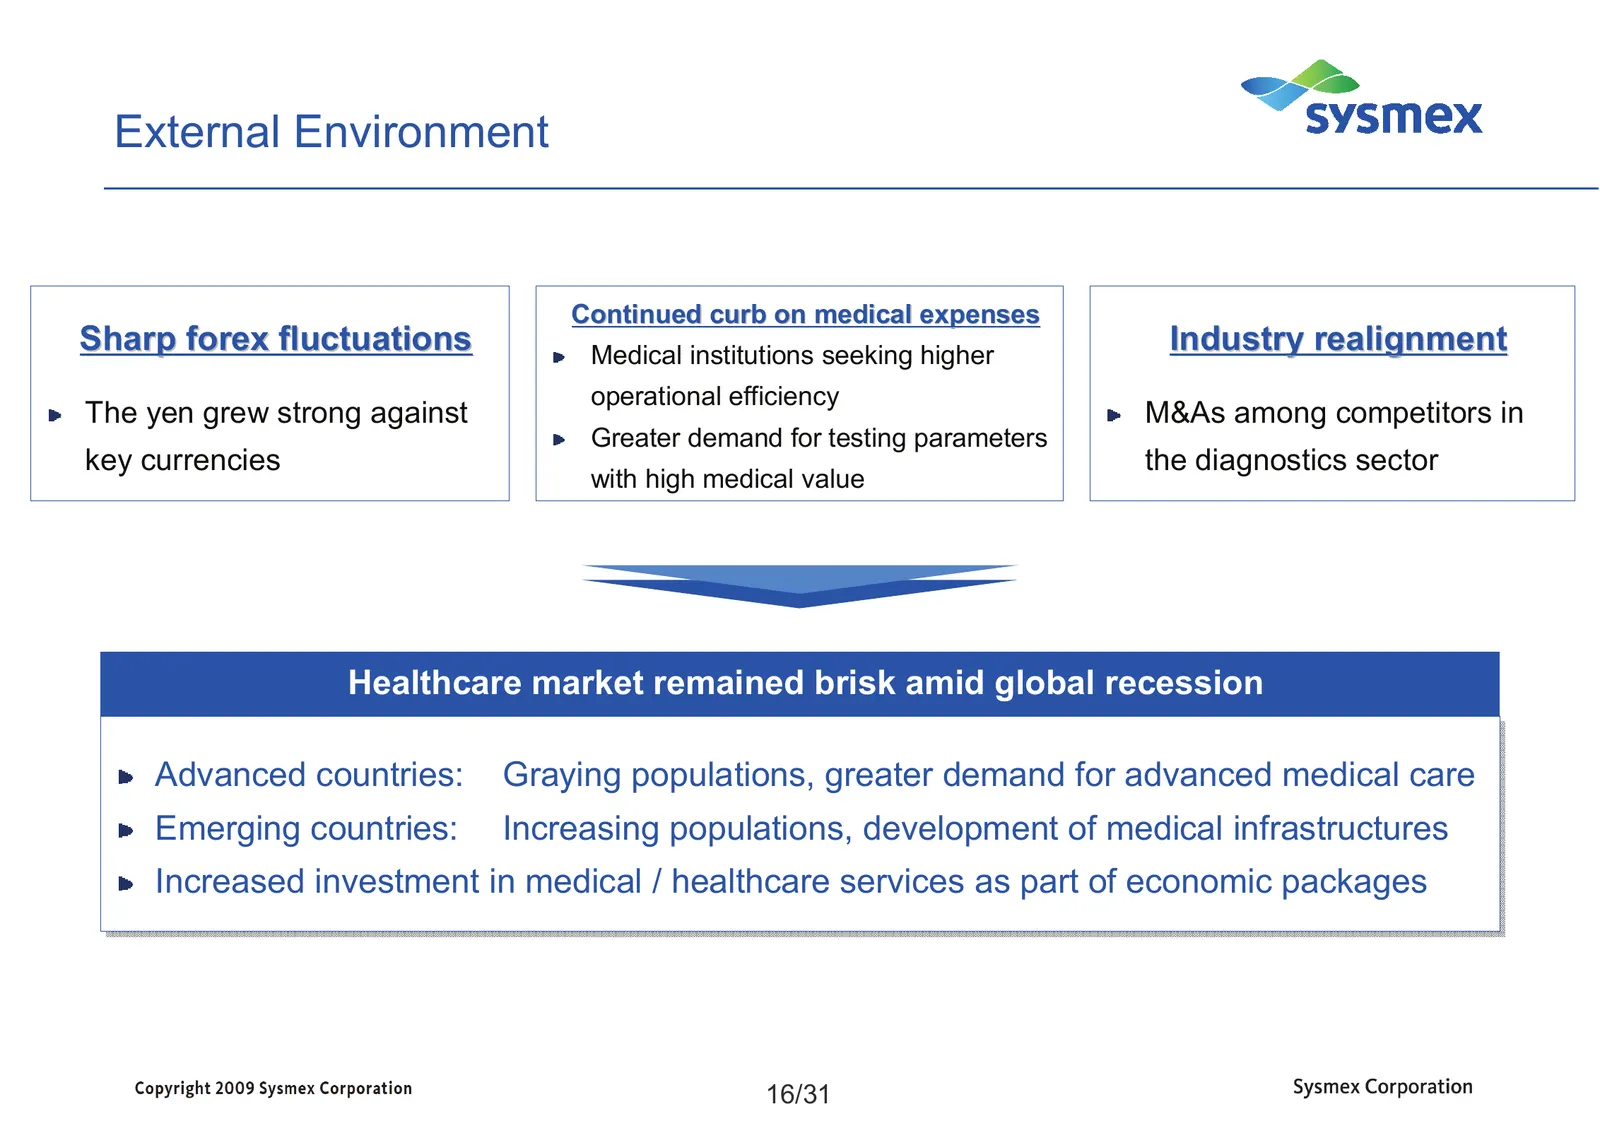
External Environment Continued curb on medical expenses Sharp forex fluctuations Medical institutions seeking higher Industry realignment operational efficiency The yen grew strong against M&As among competitors in Greater demand for testing parameters key currencies the diagnostics sector with high
Slide 18: Internal Environment (FY2007 - FY2008)
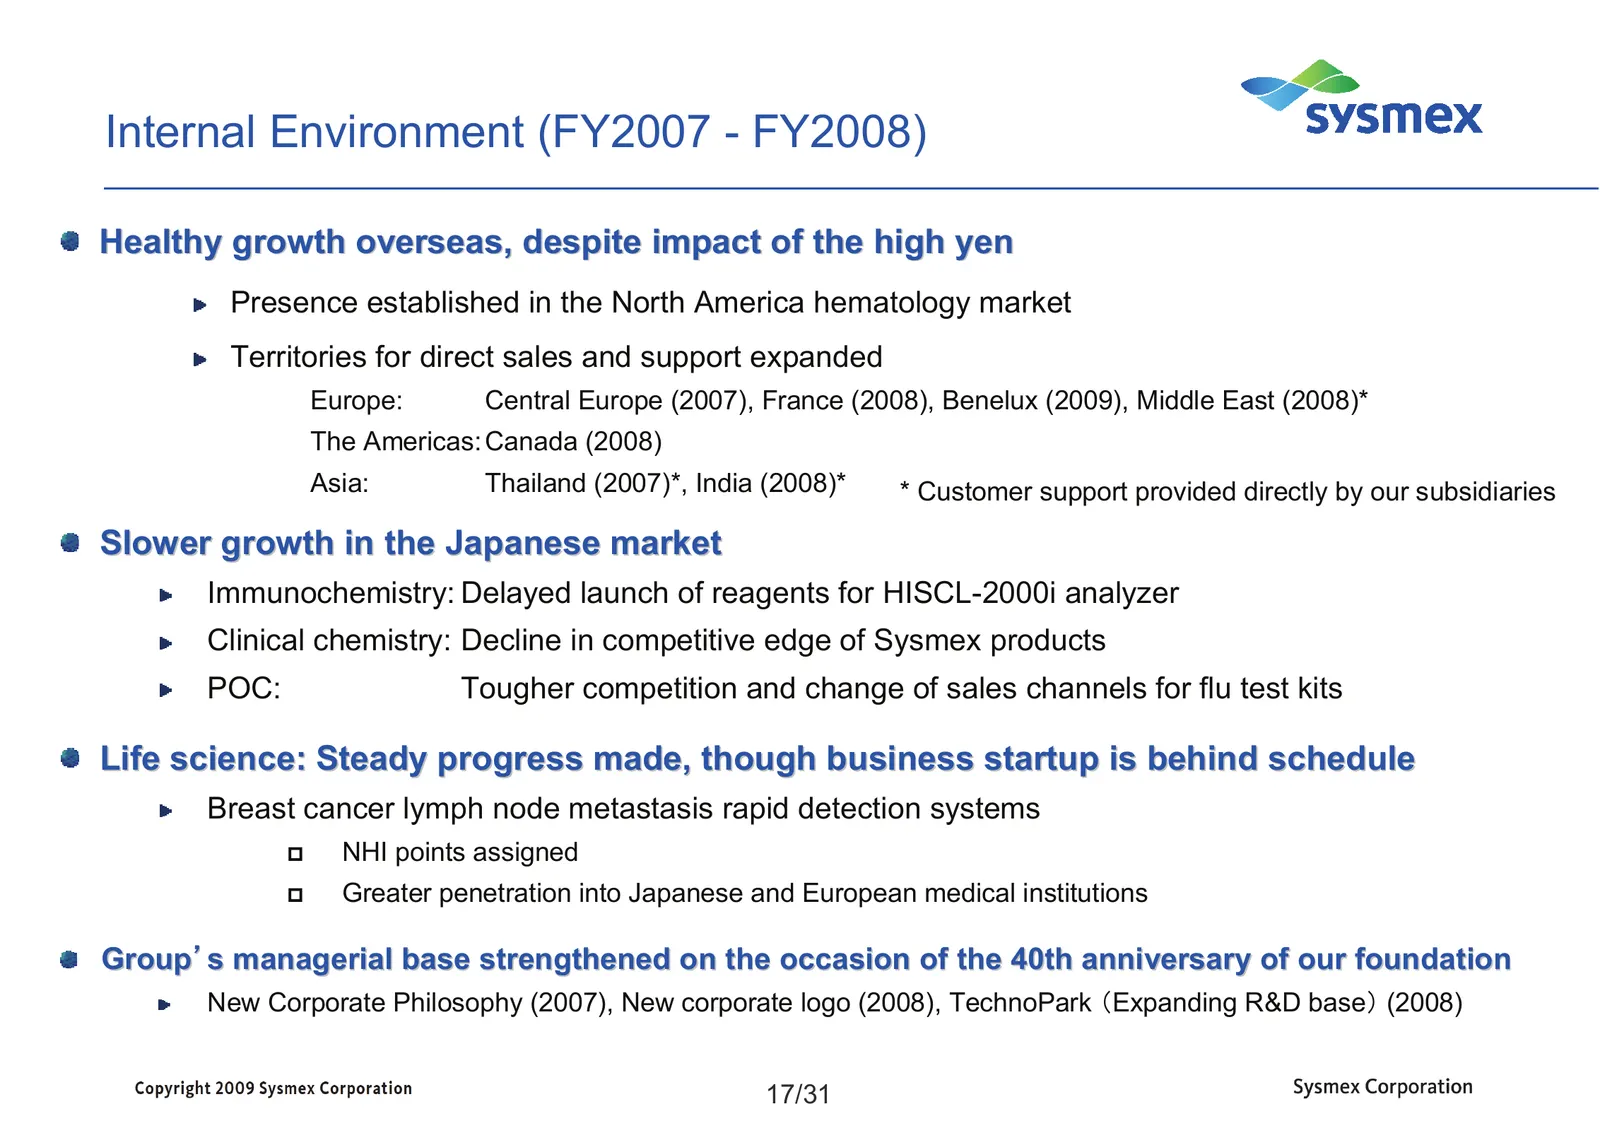
Internal Environment (FY2007 - FY2008) Healthy growth overseas, despite impact of the high yen Presence established in the North America hematology market Territories for direct sales and support expanded Europe: Central Europe (2007), France (2008), Benelux (2009), Middle East (2008)* The Americas:
Slide 19: Summary of Mid-term Management Plan
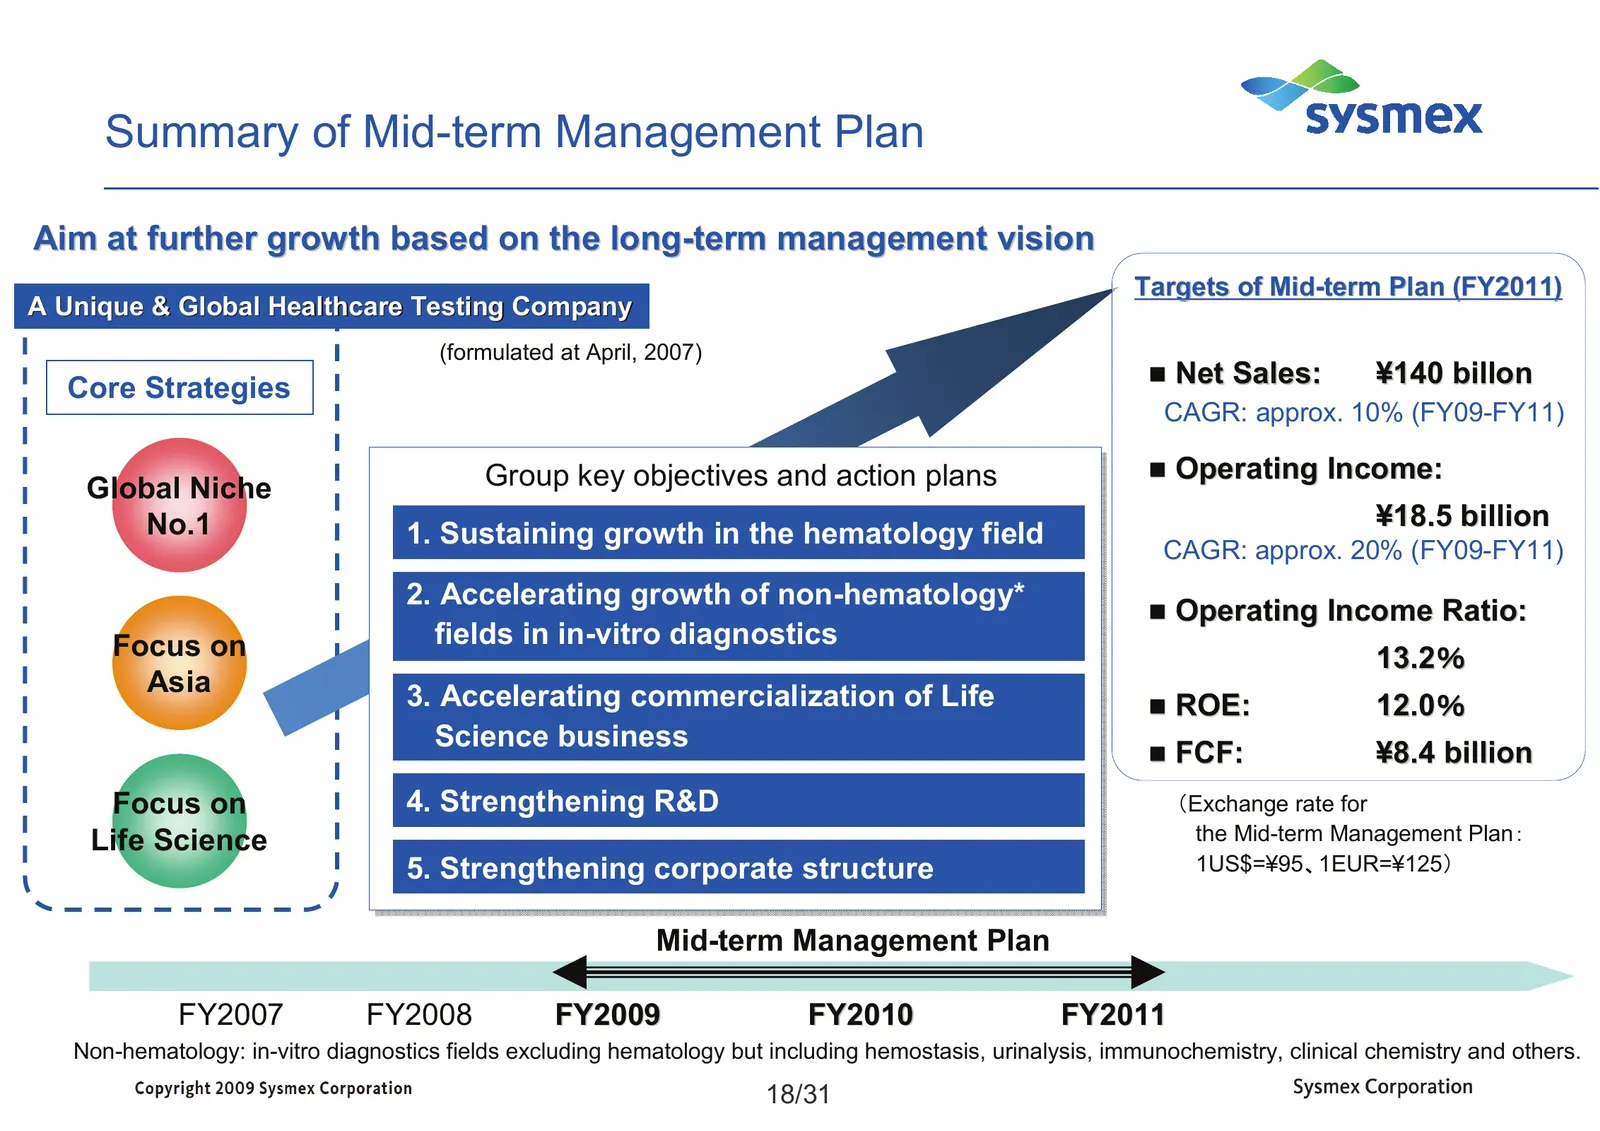
Summary of Mid-term Management Plan Aim at further growth based on the long-term management vision Targets of Mid- Mid-term Plan (FY2011) A Unique & Global Healthcare Testing Company (formulated at April, 2007) Net Sales: ¥140 billon Core Strategies CAGR: approx. 10% (FY09-FY11) Group Operating
Slide 20: Key objectives and action plans (1)
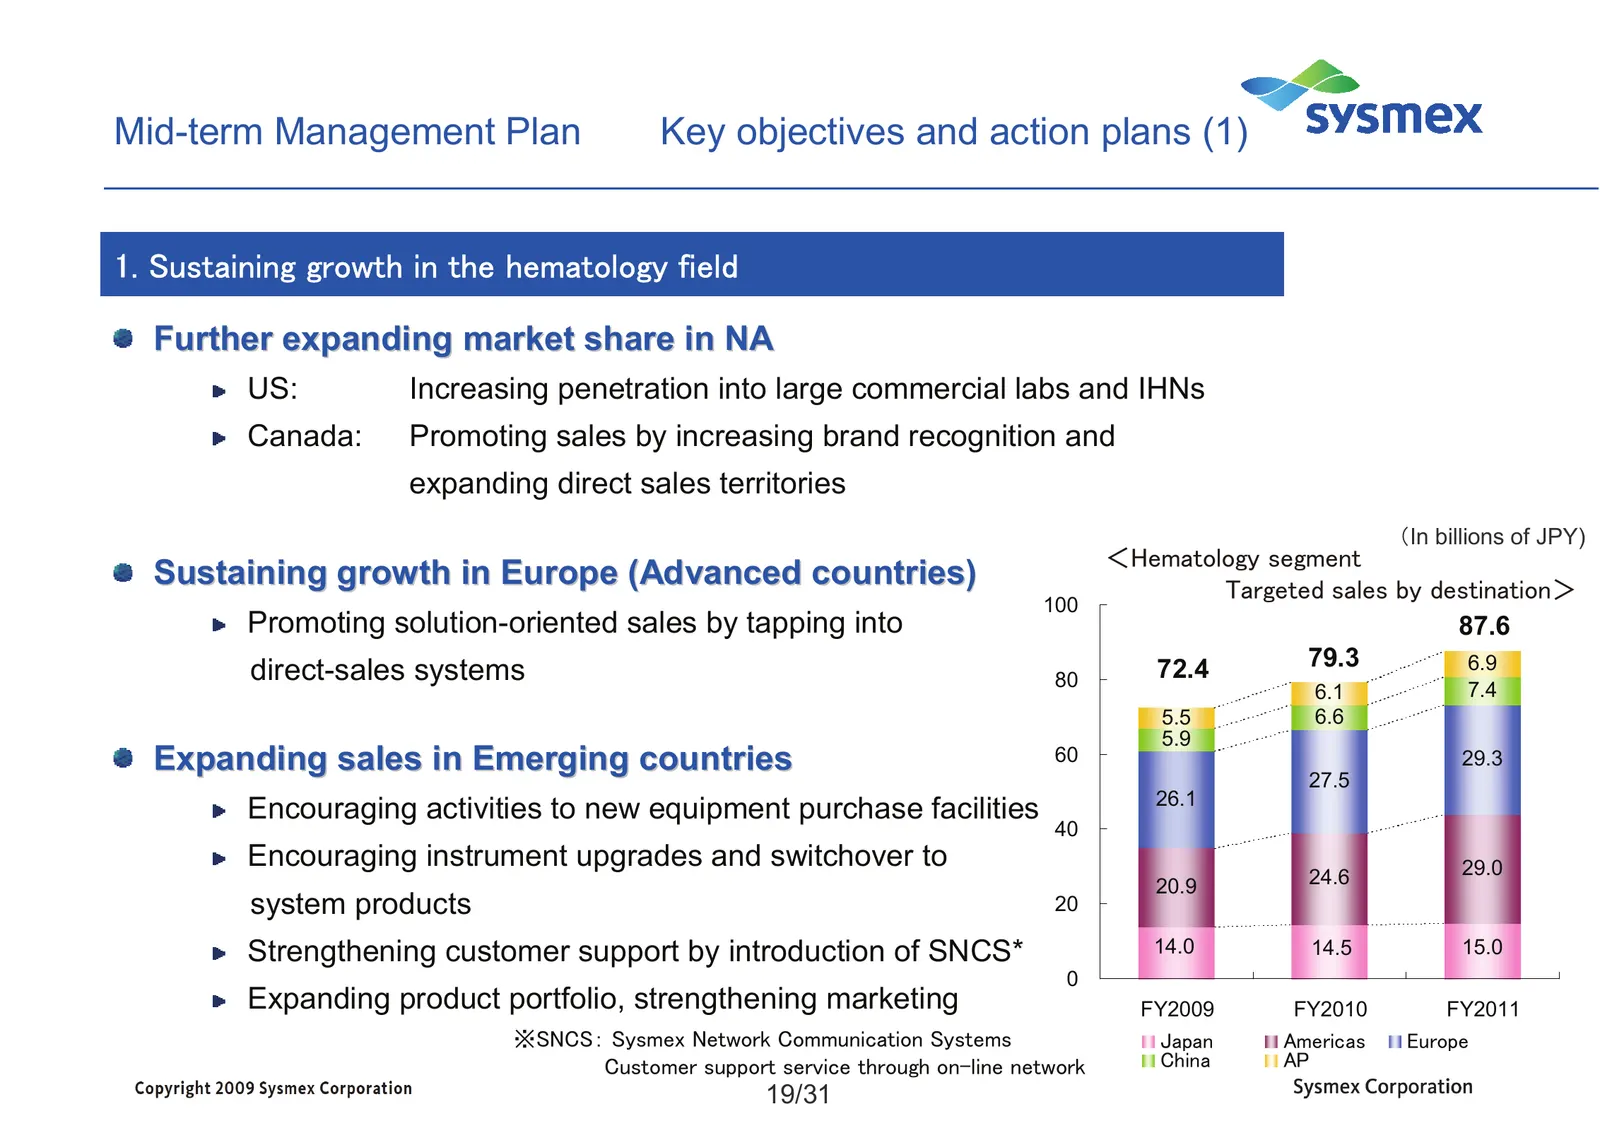
Mid-term Management Plan Key objectives and action plans (1) 1. Sustaining growth in the hematology field Further expanding market share in NA US: Increasing penetration into large commercial labs and IHNs Canada: Promoting sales by increasing brand recognition and expanding direct sales territories
Slide 21: Key objectives and action plans (2)
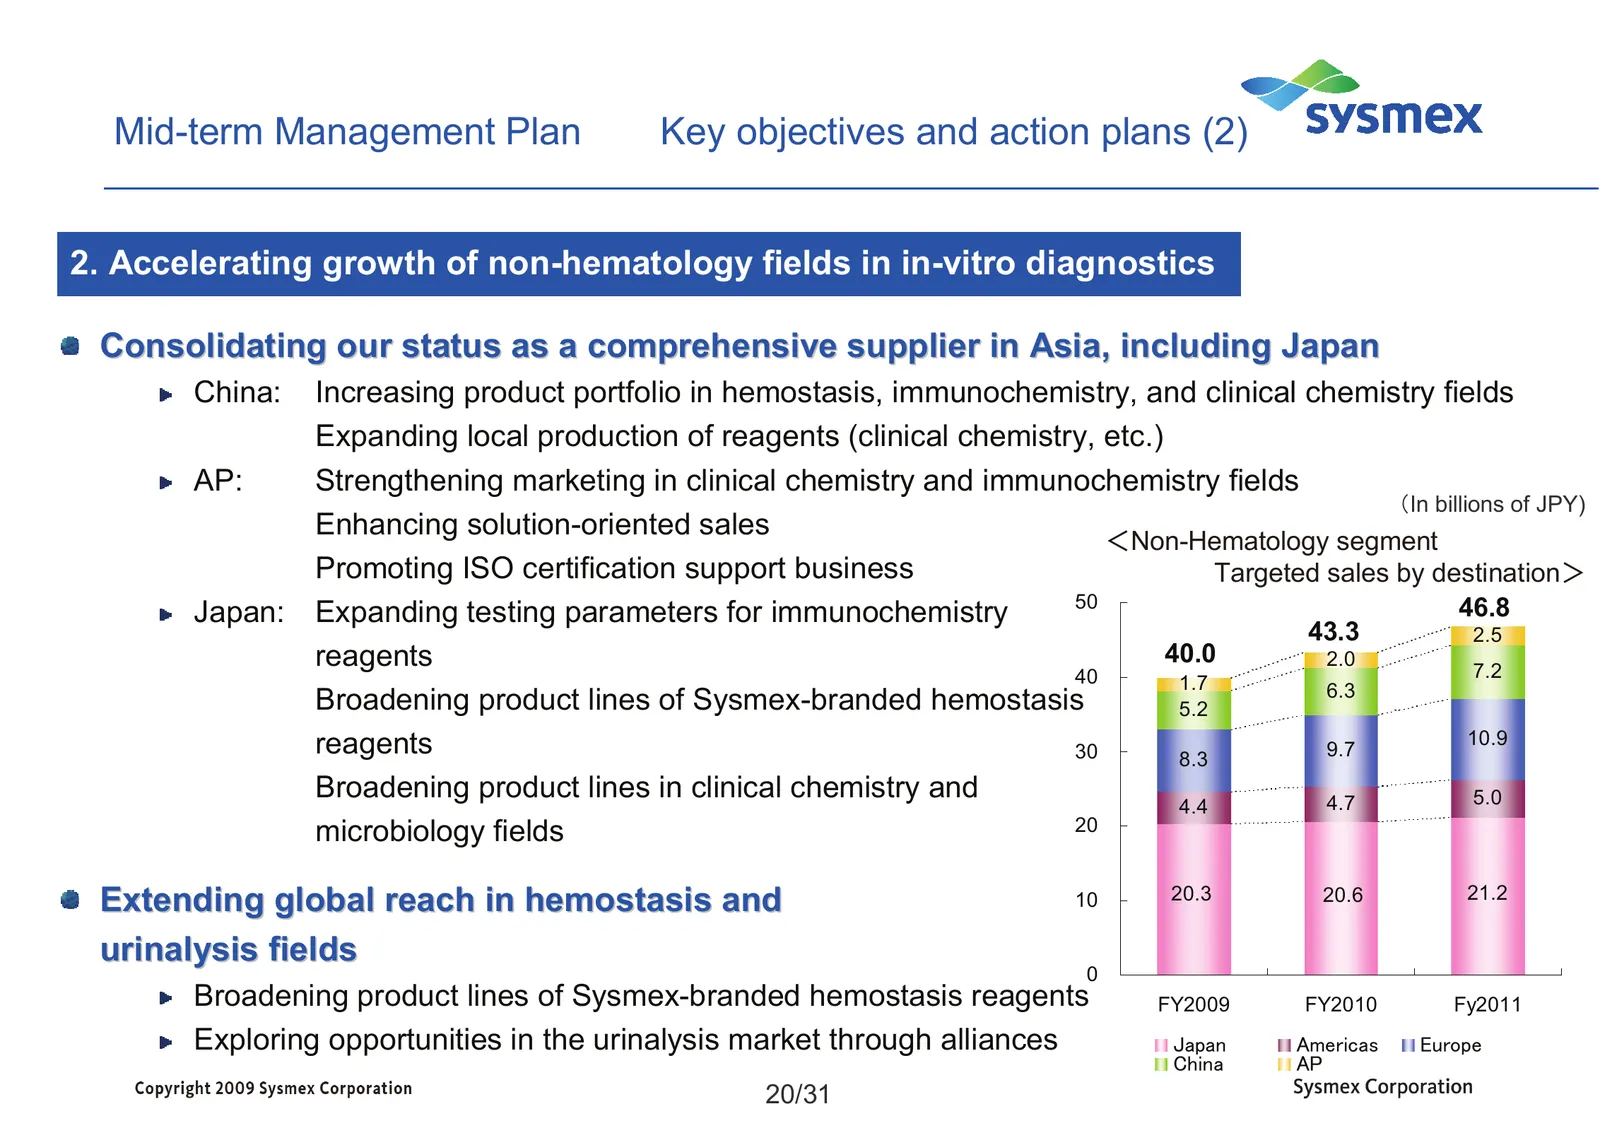
Mid-term Management Plan Key objectives and action plans (2) 2. Accelerating growth of non-hematology fields in in-vitro diagnostics Consolidating our status as a comprehensive supplier in Asia, including Japan China: Increasing product portfolio in hemostasis, immunochemistry, and clinical chemistr
Slide 22: Key objectives and action plans (3)
Mid-term Management Plan Key objectives and action plans (3) 3. Accelerating commercialization of Life Science business Facilitating launch of rapid lymph node metastasis detection systems Breast cancer Europe, Japan: Introduced to a greater number of institutions US, AP: Commencing market intro
Slide 23: Key objectives and action plans (4)
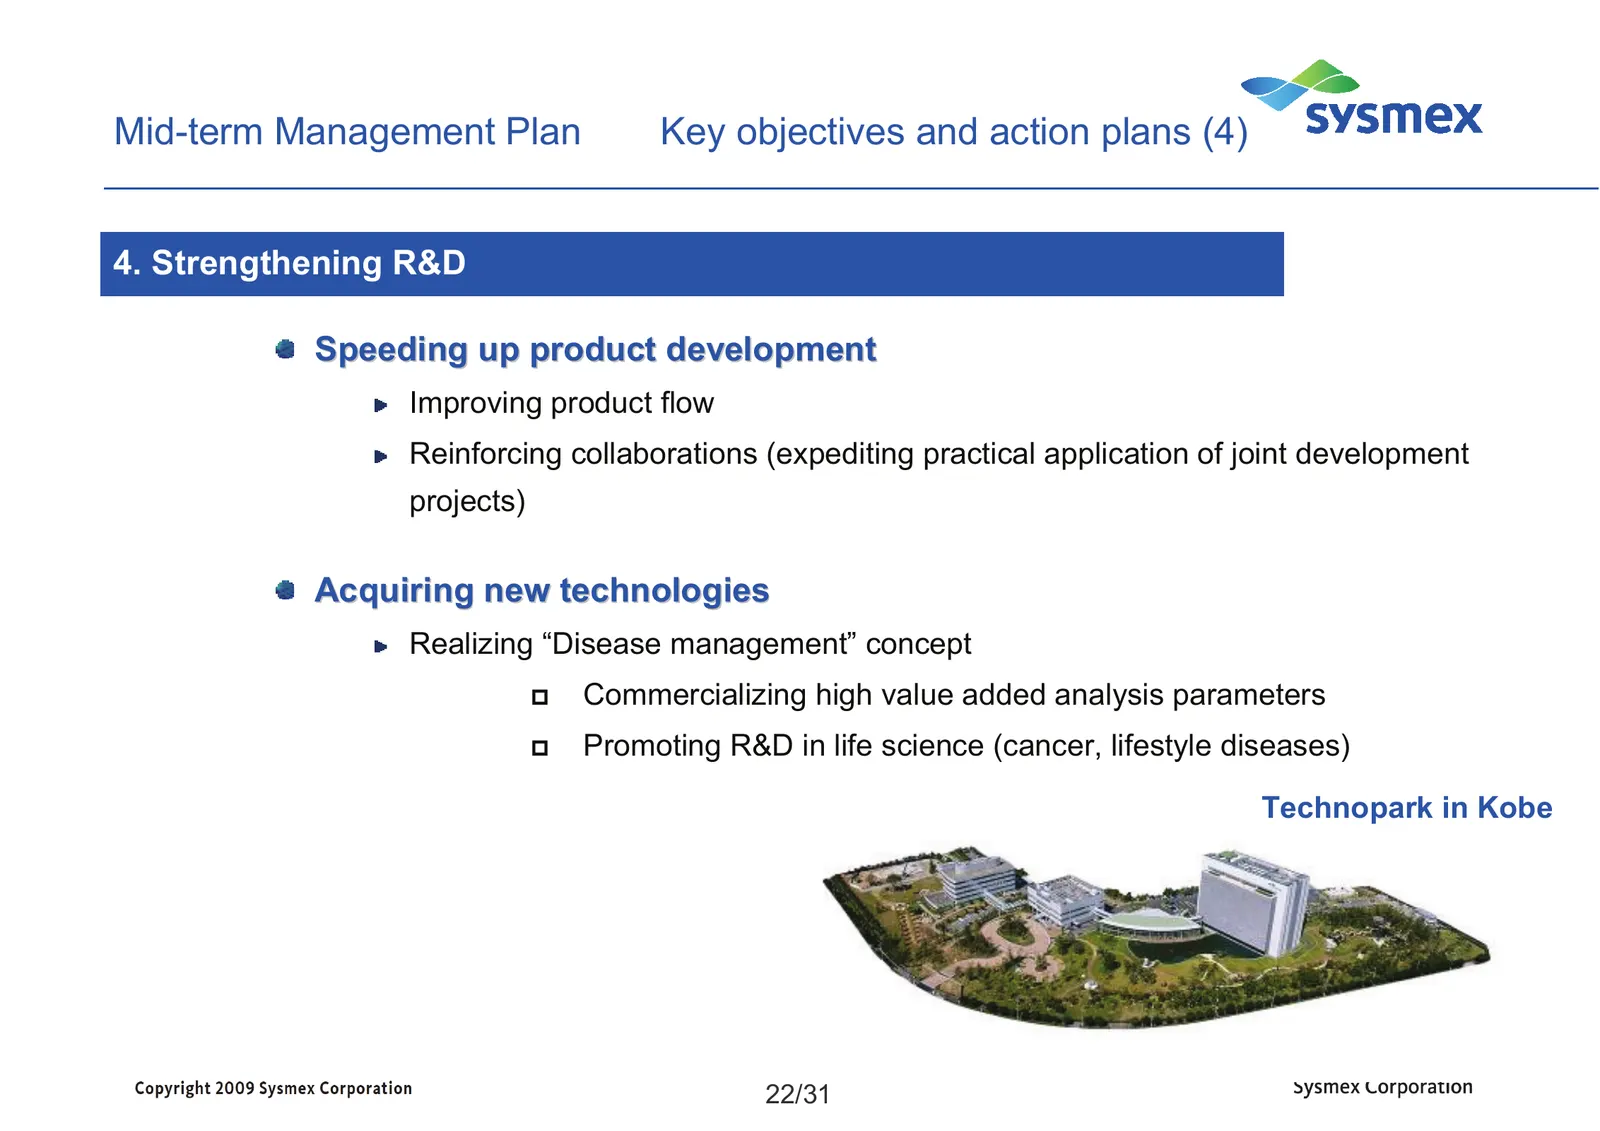
Mid-term Management Plan Key objectives and action plans (4) 4. Strengthening R&D Speeding up product development Improving product flow Reinforcing collaborations (expediting practical application of joint development projects) Acquiring new technologies Realizing “Disease management” concept Com
Slide 24: Key objectives and action plans (5)
Mid-term Management Plan Key objectives and action plans (5) 5. Strengthening corporate structure Group-wide campaigns for environmental conservation Offering eco-friendly products Resource conservation, lighter / smaller products Reducing animal-derived materials Reducing production / logistics cos
Slide 25: FY2009 Consolidated Earnings Forecast
FY2009 Consolidated Earnings Forecast 24/30
Slide 26: FY2009 Consolidated Earnings Forecast
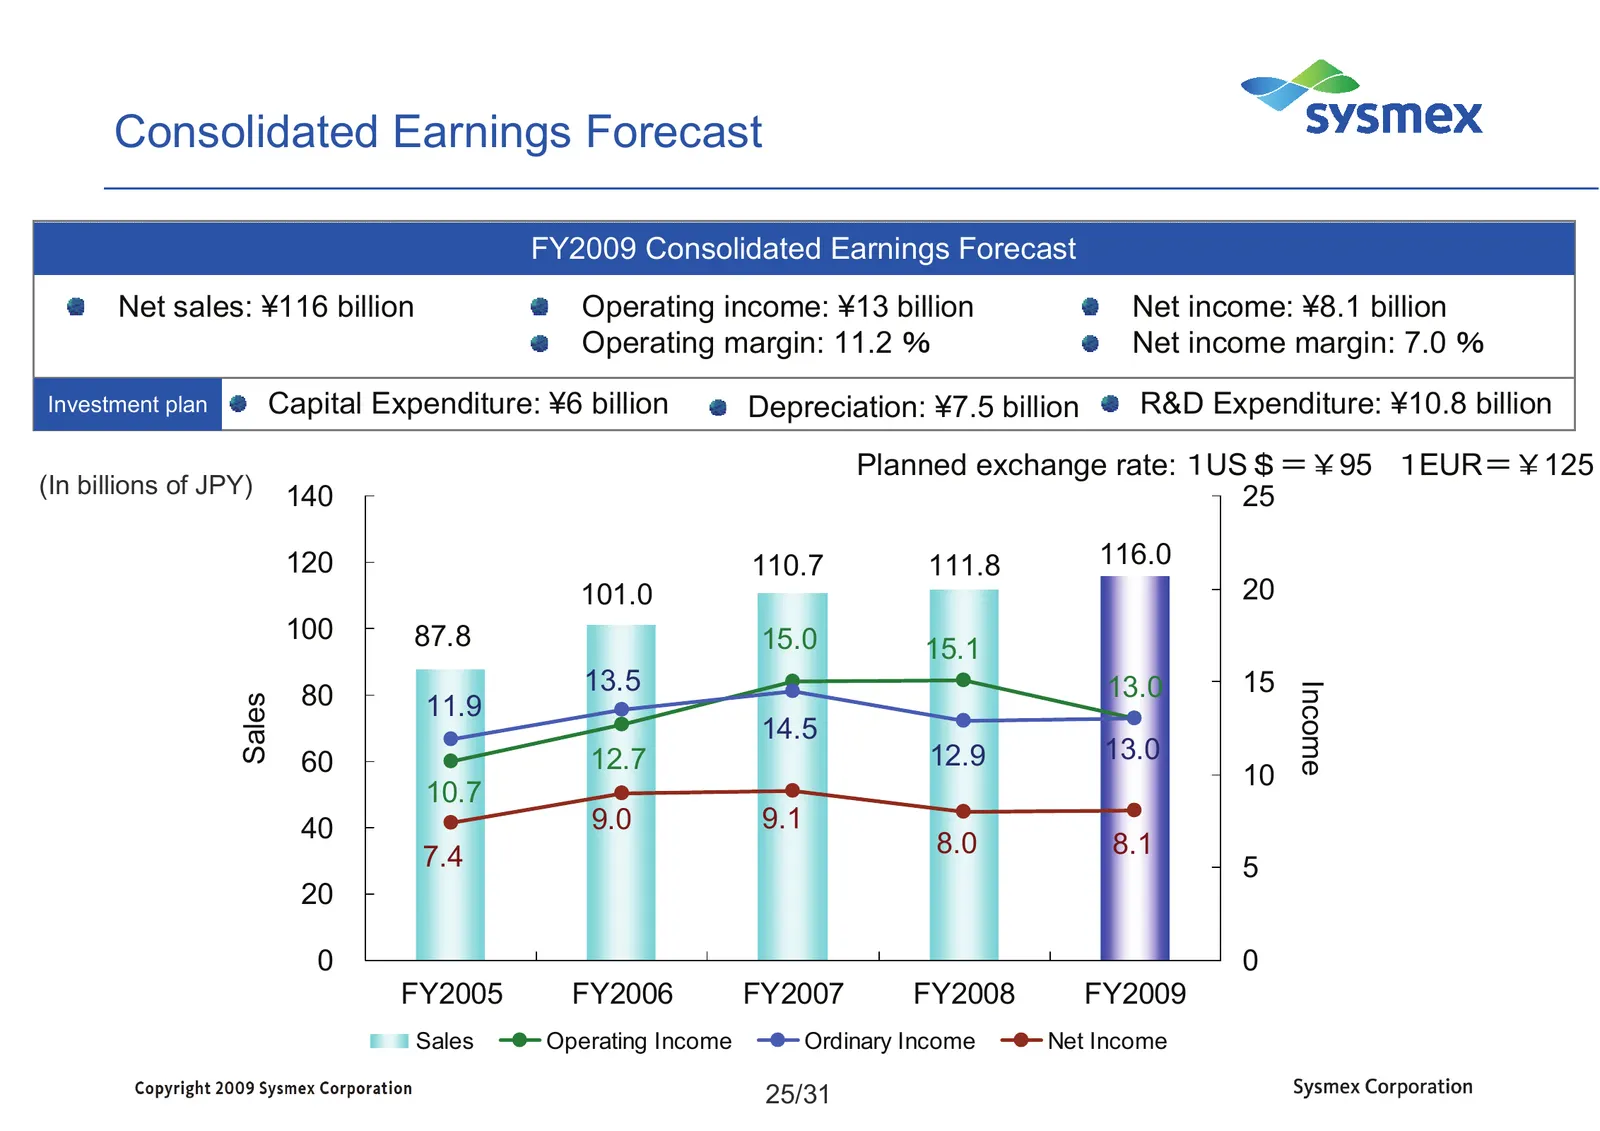
Consolidated Earnings Forecast FY2009 Consolidated Earnings Forecast Net sales: ¥116 billion Operating income: ¥13 billion Net income: ¥8.1 billion Operating margin: 11.2 % Net income margin: 7.0 % Investment plan Capital Expenditure: ¥6 billion Depreciation: ¥7.5 billion R&D Expenditure: ¥10.8 bill
Slide 27: Projected Dividend
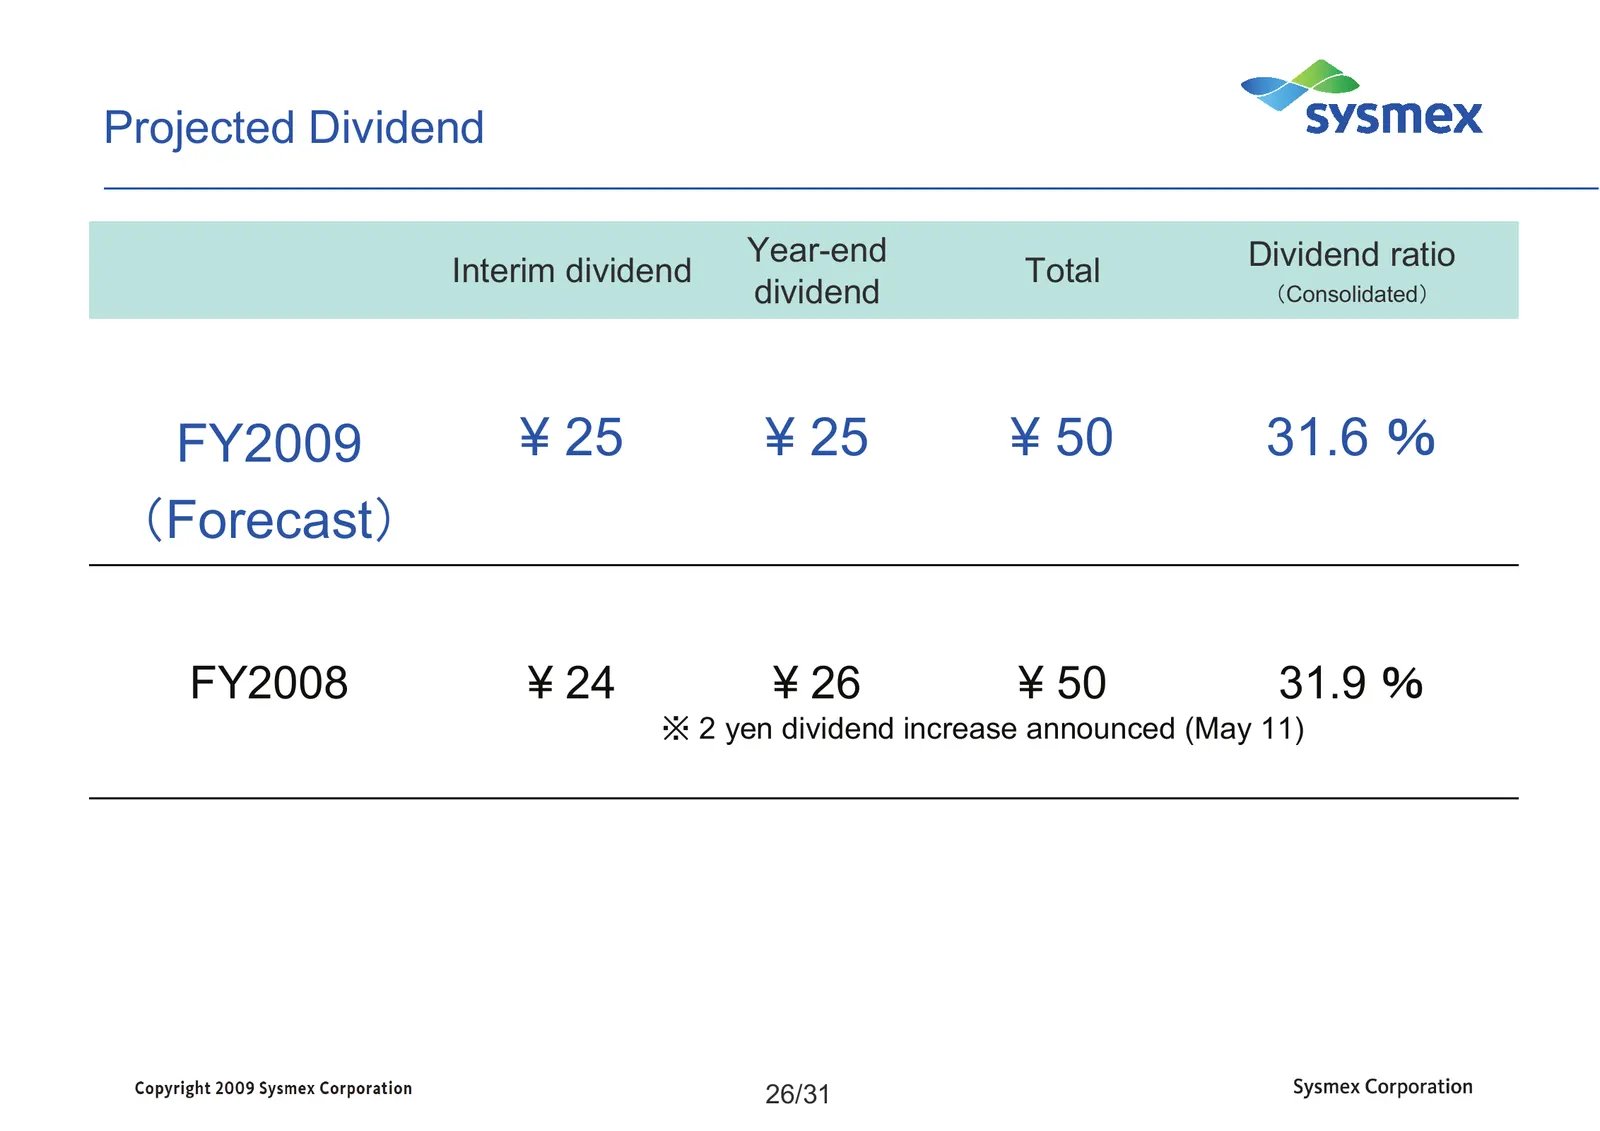
Projected Dividend Year-end Dividend ratio Interim dividend Total dividend (Consolidated) FY2009 ¥ 25 ¥ 25 ¥ 50 31.6 % (Forecast) FY2008 ¥ 24 ¥ 26 ¥ 50 31.9 % ※ 2 yen dividend increase announced (May 11) 26/31
Slide 28: Supplementary Data
=f *sysmex Supplementary Data Copyright 2009 Sysmex Corporation 27/30 Sysmex Corporation
Slide 29: Mid-term Management Plan (Financial Targets)
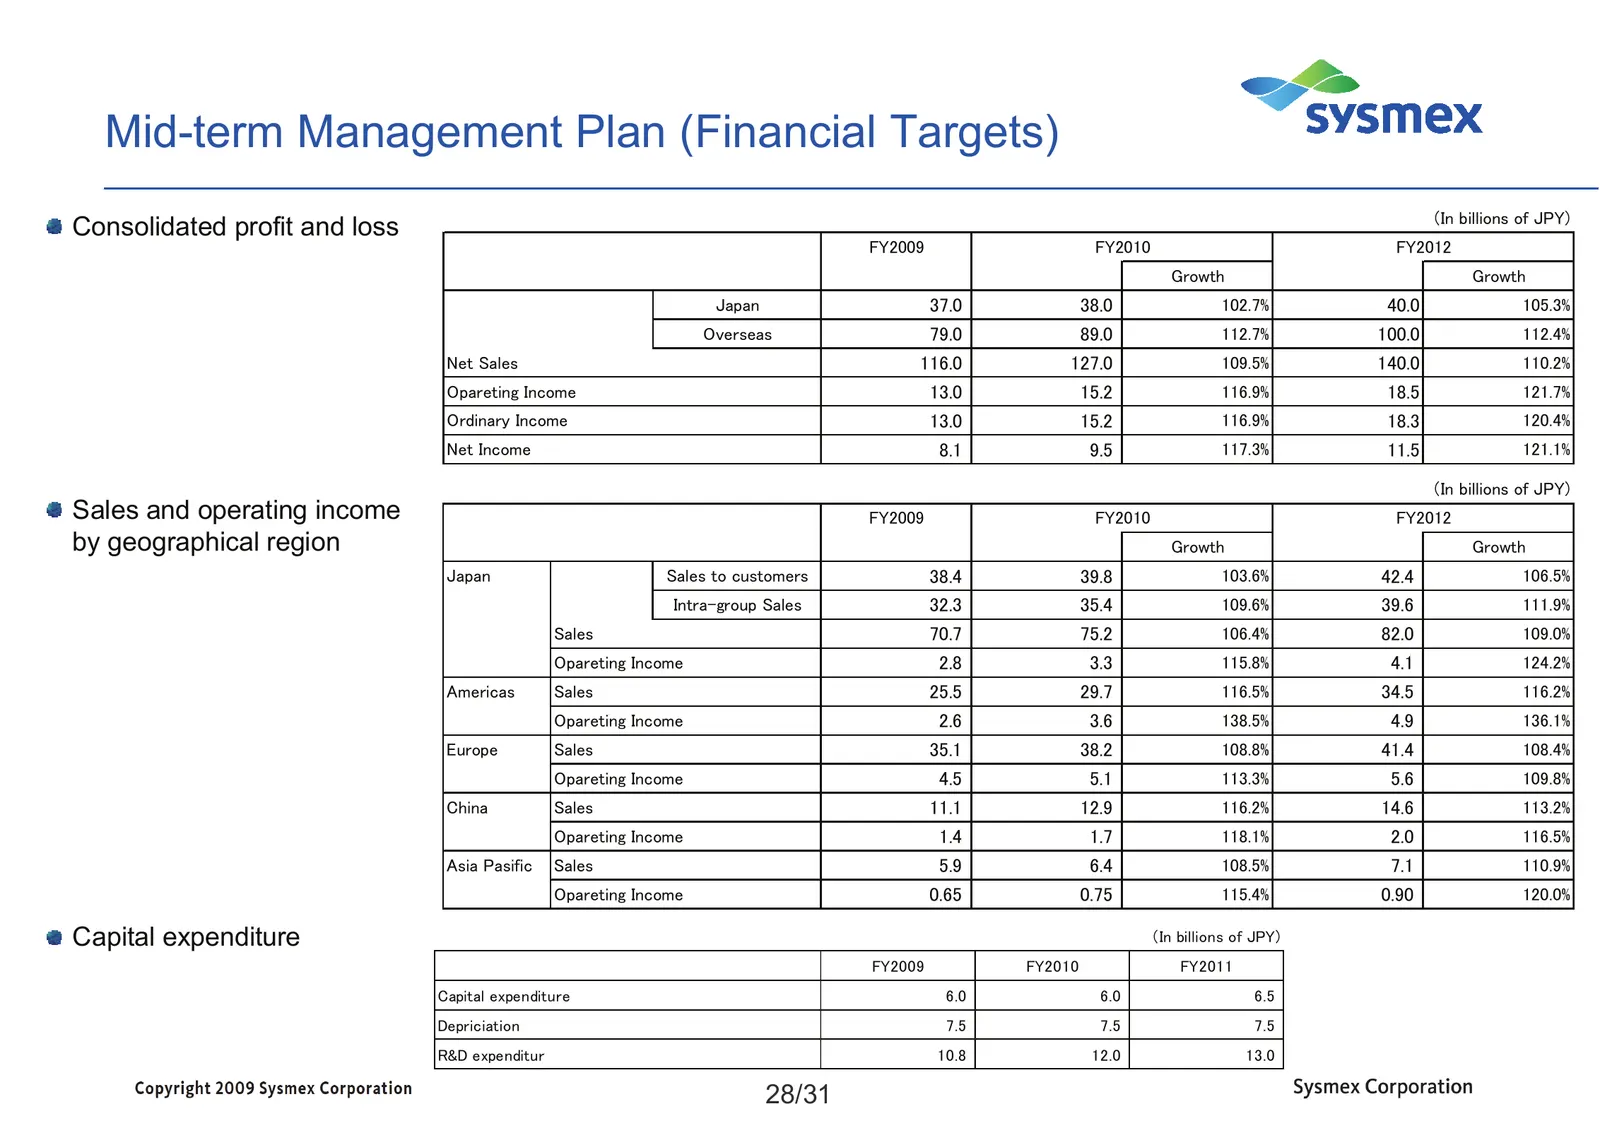
補足資料 Mid-term Management Plan (Financial Targets) (In billions of JPY) Consolidated profit and loss FY2009 FY2010 FY2012 Growth Growth Japan 37.0 38.0 102.7% 40.0 105.3% Overseas 79.0 89.0 112.7% 100.0 112.4% Net Sales 116.0 127.0 109.5% 140.0 110.2% Opareting Income 13.0 15.2 116.9% 18.5 121.7% Ord
Slide 30: Financial Targets - Sales and operating income by geographical region
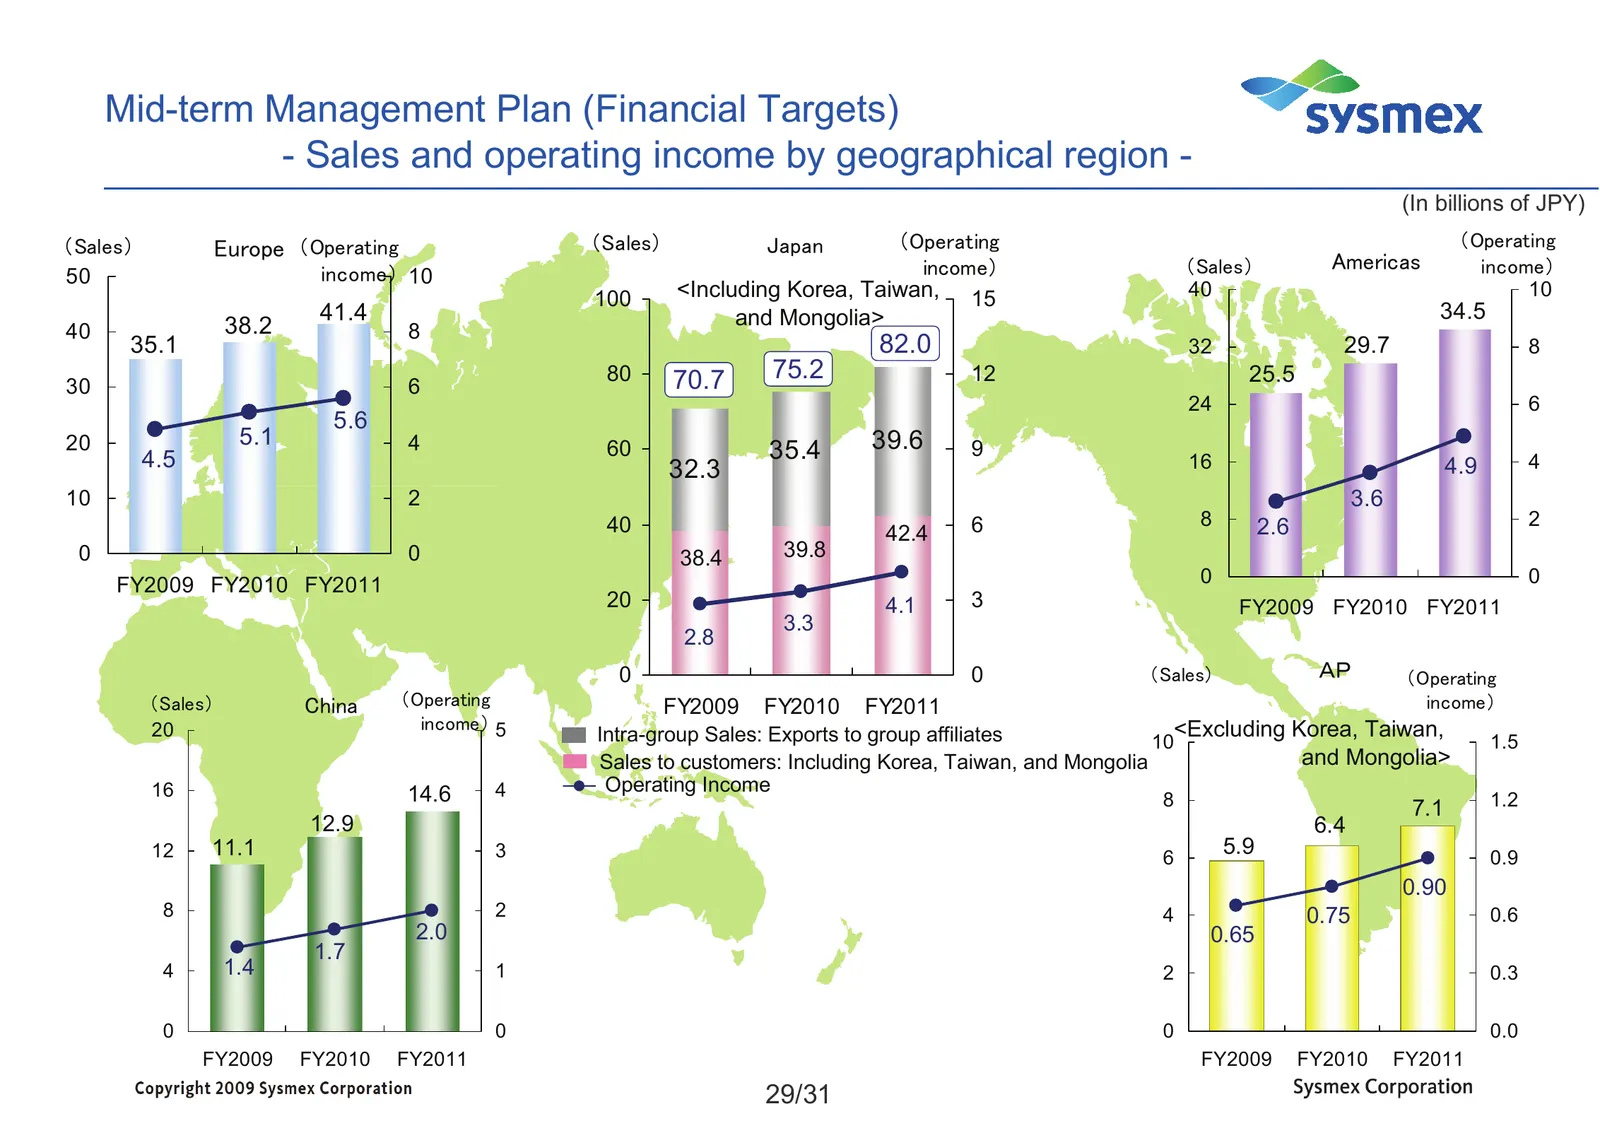
Mid-term Management Plan (Financial Targets) - Sales and operating income by geographical region - (In billions of JPY) (Sales) Europe (Operating (Sales) Japan (Operating (Operating income) (Sales) Americas income) 50 income) 10 100 <Including Korea, Taiwan, 15 40 10 41.4 and Mongolia> 34.5 40 38.2
Slide 31: Contact
<Contact> IR & Corporate Communication Div. Phone: +81-78-265-0500 Email: info@sysmex.co.jp URL: 30/30 PAC_J_0903_FY_01
Source: Internet Archive copy of sysmex.co.jp
More decks from Sysmex Corporation
 Investor Presentation (November 2026)43 slides · Nov 10, 2026
 Q1 FY2027 Earnings Presentation33 slides · Aug 7, 2026
 Investor Presentation (2025)43 slides · 2025
 FY2011 Earnings Presentation23 slides · May 10, 2012
 FY2012 Earnings Presentation23 slides · May 10, 2012
 9M FY2012 Earnings Presentation12 slides · Feb 3, 2012