Franklin Financial Network Inc
Franklin Financial Network — Shareholder Meeting (May 2018)
30 slides from Franklin Financial Network's shareholder meeting presentation, May 24, 2018
Slide 1: Franklin Financial Network Annual Meeting
MAY 24, 2018 FRANKLIN FINANCIAL NETWORK ANNUAL MEETING
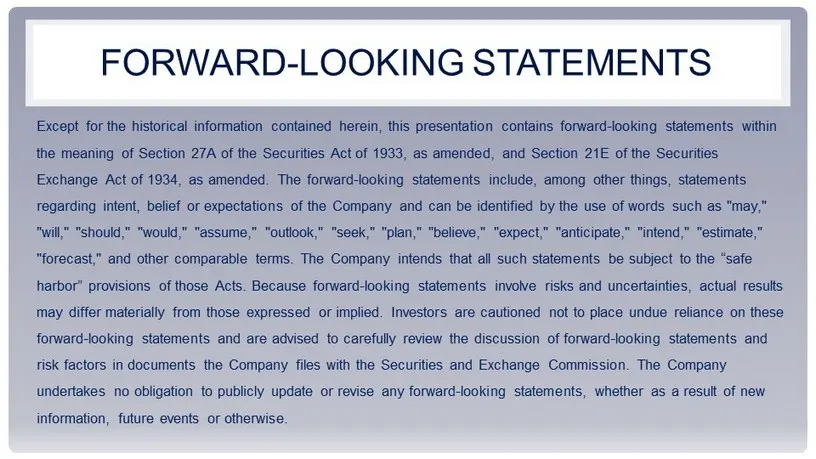
Slide 2: Forward-Looking Statements
FORWARD - LOOKING STATEMENTS Except for the historical information contained herein, this presentation contains forward - looking statements within the meaning of Section 27A of the Securities Act of 1933, as amended, and Section 21E of the Securities Exchange Act of 1934, as amended. The forward -
Slide 3: Agenda
AGENDA • Official Business • Franklin Synergy Bank Progress Report • Questions
Slide 4: Agenda: Official Business
AGENDA • Mandy Garland Appointed Judge of the Election • Quorum Is Present, Either in Person or by Proxy • Anyone Who Would Like to Vote in Person or Who Would Like to Change Their Proxy? • Results of Ballot
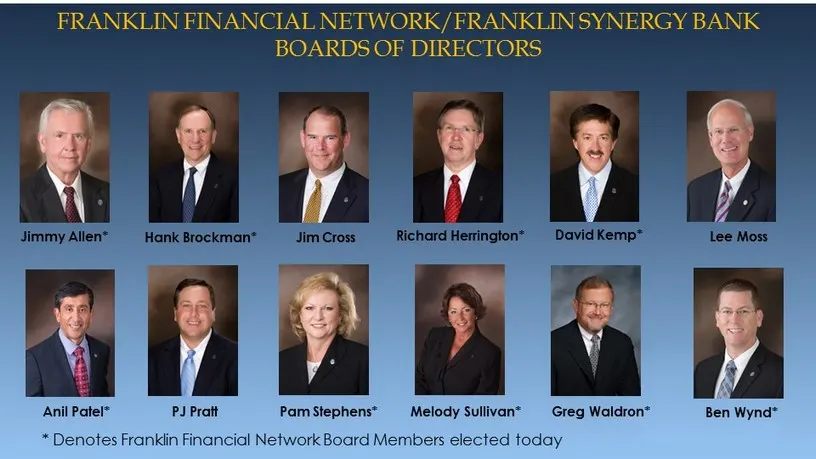
Slide 5: Franklin Financial Network/Franklin Synergy Bank Boards of Directors
FRANKLIN FINANCIAL NETWORK/FRANKLIN SYNERGY BANK BOARDS OF DIRECTORS Jimmy Allen* Hank Brockman* PJ Pratt Pam Stephens* Lee Moss David Kemp* Richard Herrington* Jim Cross Greg Waldron* Melody Sullivan* Ben Wynd* Anil Patel* * Denotes Franklin Financial Network Board Members elected today

Slide 6: The Success of Franklin Financial Network
THE SUCCESS OF FRANKLIN FINANCIAL NETWORK
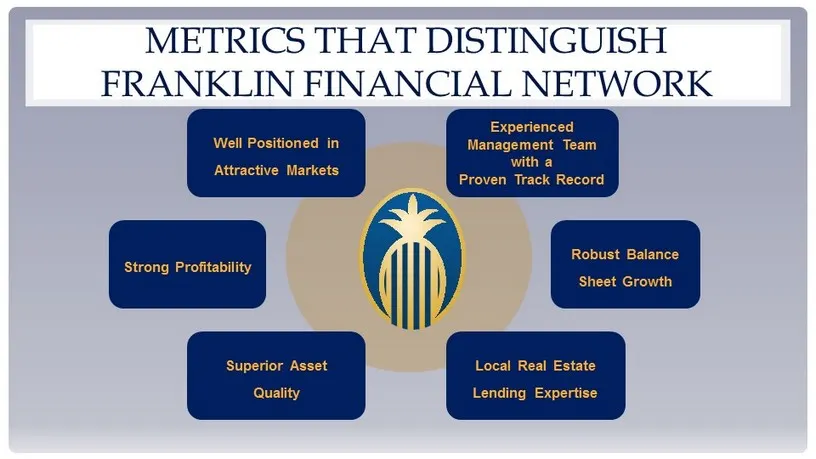
Slide 7: Metrics That Distinguish Franklin Financial Network
Experienced Management Team with a Proven Track Record Robust Balance Sheet Growth Local Real Estate Lending Expertise Well Positioned in Attractive Markets Superior Asset Quality Strong Profitability METRICS THAT DISTINGUISH FRANKLIN FINANCIAL NETWORK
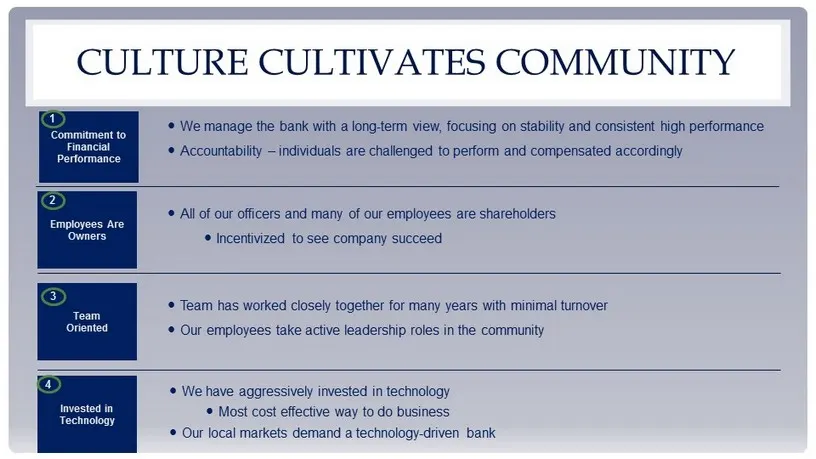
Slide 8: Culture Cultivates Community
CULTURE CULTIVATES COMMUNITY Commitment to Financial Performance Employees Are Owners Team Oriented 1 2 3 Invested in Technology 4 We manage the bank with a long - term view, focusing on stability and consistent high performance Accountability – individuals are challenged to perform and compensa
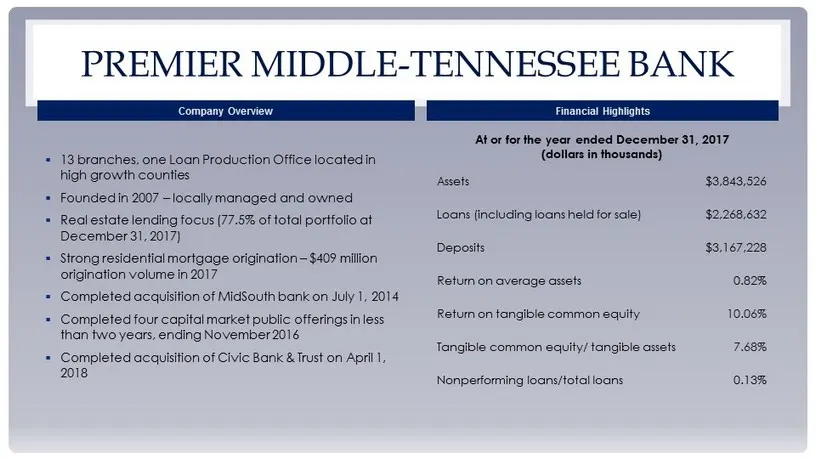
Slide 9: Premier Middle-Tennessee Bank: Company Overview
▪ 13 branches, one L oan Production O ffice located in high growth counties ▪ Founded in 2007 – locally managed and owned ▪ Real estate lending focus (77.5% of total portfolio at December 31, 2017) ▪ Strong residential mortgage origination – $409 million origination volume in 2017 ▪ Completed acquis
Slide 10: Our Mission Statement
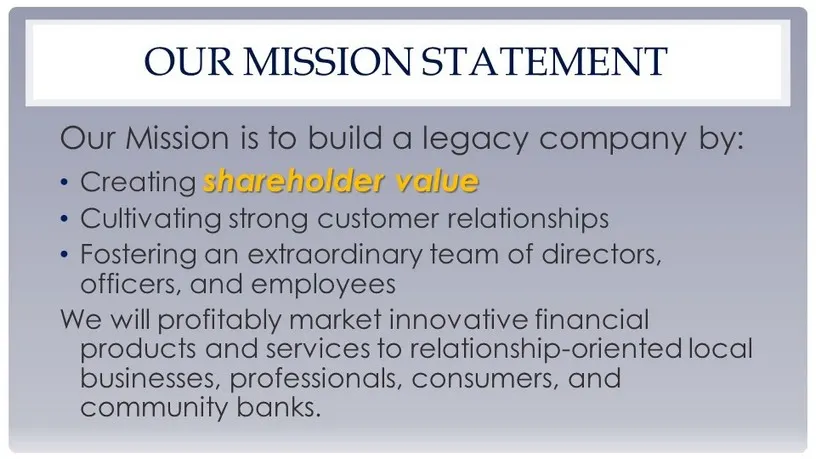
OUR MISSION STATEMENT Our Mission is to build a legacy company by: • Creating shareholder value • Cultivating strong customer relationships • Fostering an extraordinary team of directors, officers, and employees We will profitably market innovative financial products and services to relationship - o
Slide 11: Managing Banking Success
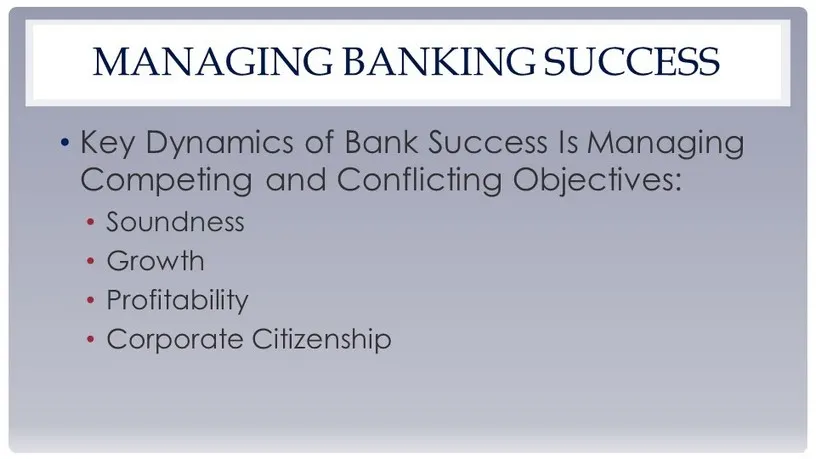
MANAGING BANKING SUCCESS • Key Dynamics of Bank Success Is Managing Competing and Conflicting Objectives: • Soundness • Growth • Profitability • Corporate Citizenship

Slide 12: Soundness
SOUNDNESS
Slide 13: Asset Quality
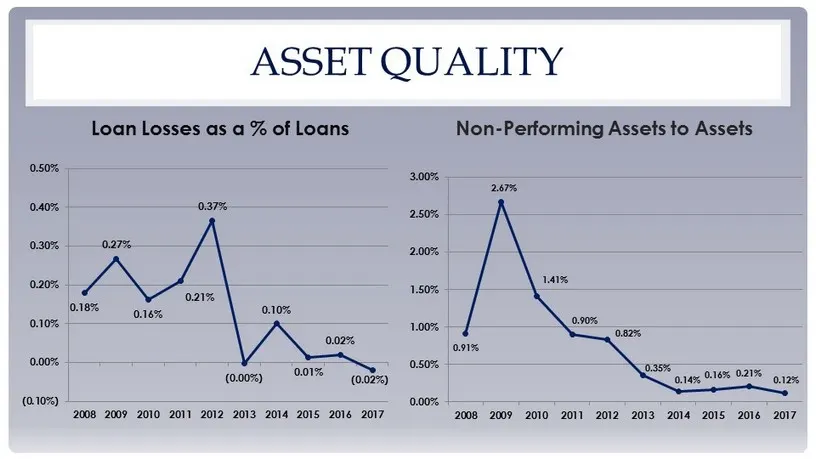
ASSET QUALITY 0.18% 0.27% 0.16% 0.21% 0.37% (0.00%) 0.10% 0.01% 0.02% (0.02%) (0.10%) 0.00% 0.10% 0.20% 0.30% 0.40% 0.50% 2008 2009 2010 2011 2012 2013 2014 2015 2016 2017 Loan Losses as a % of Loans 0.91% 2.67% 1.41% 0.90% 0.82% 0.35% 0.14% 0.16% 0.21% 0.12% 0.00% 0.50% 1.00% 1.50% 2.00% 2.50% 3.00
Slide 14: Asset Quality: Texas Ratio vs. Peer
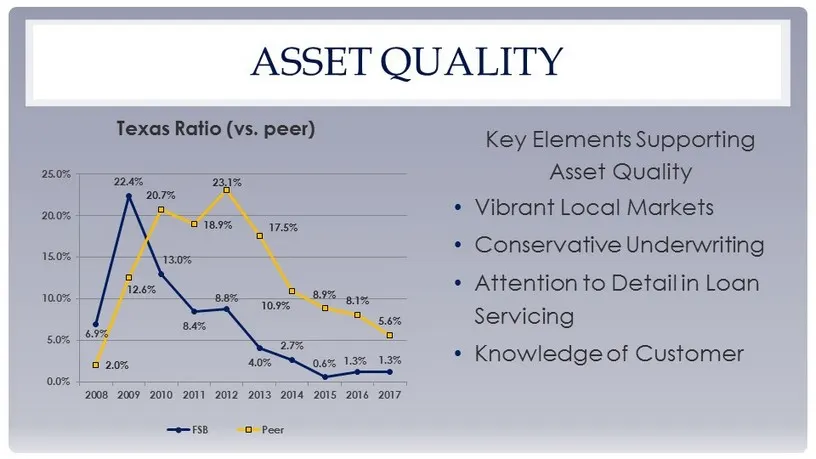
ASSET QUALITY 6.9% 22.4% 13.0% 8.4% 8.8% 4.0% 2.7% 0.6% 1.3% 1.3% 2.0% 12.6% 20.7% 18.9% 23.1% 17.5% 10.9% 8.9% 8.1% 5.6% 0.0% 5.0% 10.0% 15.0% 20.0% 25.0% 2008 2009 2010 2011 2012 2013 2014 2015 2016 2017 Texas Ratio (vs. peer) FSB Peer Key Elements Supporting Asset Quality • Vibrant Local Markets

Slide 15: Growth
GROWTH
Slide 16: Asset Growth
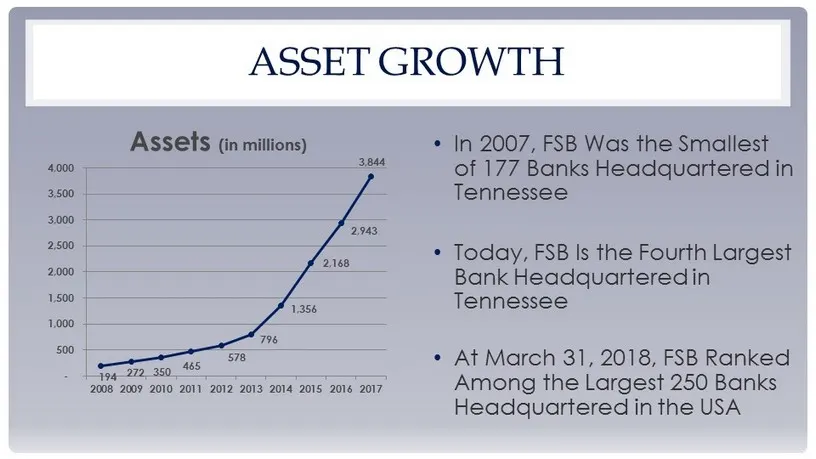
ASSET GROWTH 194 272 350 465 578 796 1,356 2,168 2,943 3,844 - 500 1,000 1,500 2,000 2,500 3,000 3,500 4,000 2008 2009 2010 2011 2012 2013 2014 2015 2016 2017 Assets (in millions) • In 2007, FSB W as the Smallest of 177 Banks H eadquartered in Tennessee • Today, FSB Is the Fourth L argest Bank H ead
Slide 17: Deposit Growth
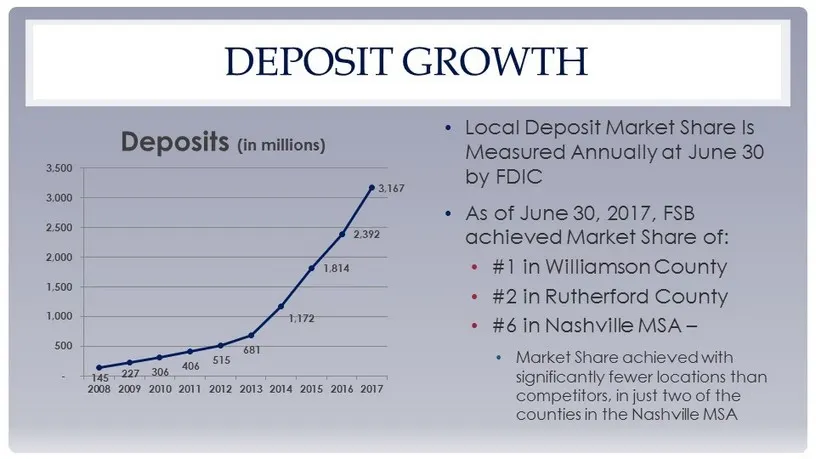
DEPOSIT GROWTH 145 227 306 406 515 681 1,172 1,814 2,392 3,167 - 500 1,000 1,500 2,000 2,500 3,000 3,500 2008 2009 2010 2011 2012 2013 2014 2015 2016 2017 Deposits (in millions) • Local Deposit Market Share Is Measured Annually at June 30 by FDIC • As of June 30, 2017, FSB achieved Market Share of:
Slide 18: Loan Growth
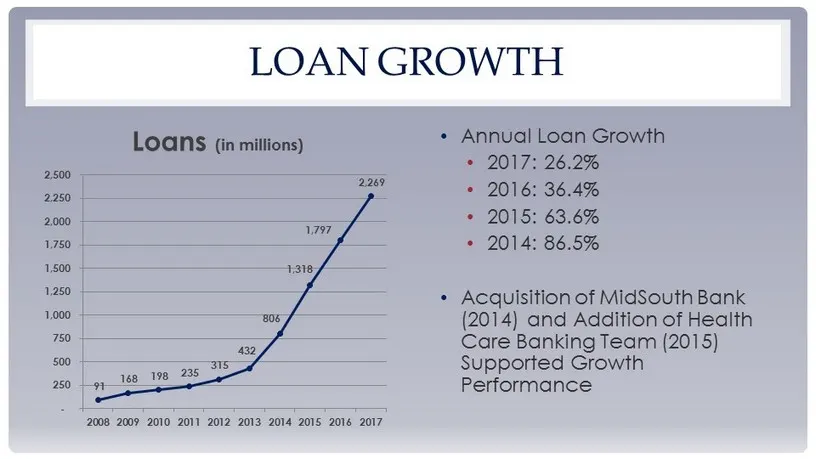
LOAN GROWTH 91 168 198 235 315 432 806 1,318 1,797 2,269 - 250 500 750 1,000 1,250 1,500 1,750 2,000 2,250 2,500 2008 2009 2010 2011 2012 2013 2014 2015 2016 2017 Loans (in millions) • Annual Loan Growth • 2017: 26.2% • 2016: 36.4% • 2015: 63.6% • 2014: 86.5% • Acquisition of MidSouth Bank (2014) an

Slide 19: Profitability
PROFITABILITY
Slide 20: Net Income and EPS
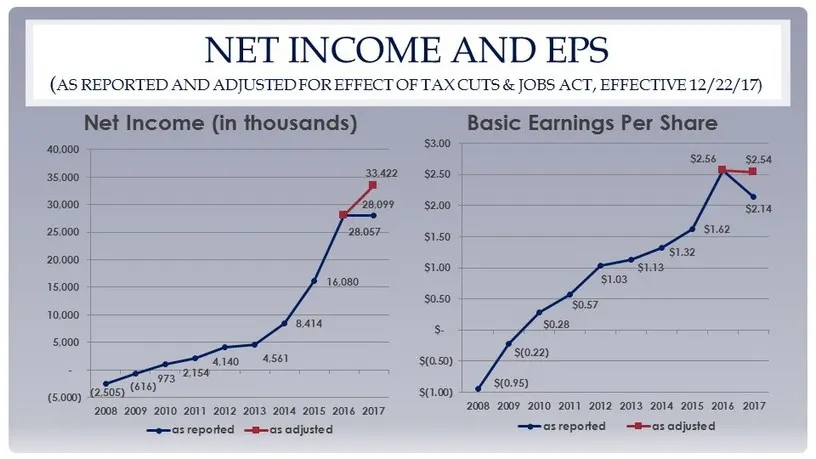
NET INCOME AND EPS ( AS REPORTED AND ADJUSTED FOR EFFECT OF TAX CUTS & JOBS ACT, EFFE CTIVE 12/22/17) (2,505) (616) 973 2,154 4,140 4,561 8,414 16,080 28,057 28,099 33,422 (5,000) - 5,000 10,000 15,000 20,000 25,000 30,000 35,000 40,000 2008 2009 2010 2011 2012 2013 2014 2015 2016 2017 Net Income (i
Slide 21: Profitability: Return on Assets and Equity
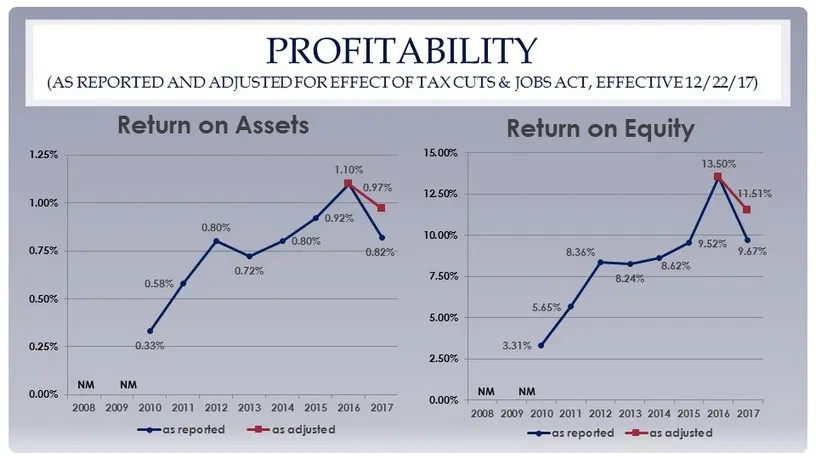
PROFITABILITY (AS REPORTED AND ADJUSTED FOR EFFECT OF TAX CUTS & JOBS ACT, EFF ECTIVE 12/22/17) 0.33% 0.58% 0.80% 0.72% 0.80% 0.92% 1.10% 0.82% 0.97% 0.00% 0.25% 0.50% 0.75% 1.00% 1.25% 2008 2009 2010 2011 2012 2013 2014 2015 2016 2017 Return on Assets as reported as adjusted NM NM 3.31% 5.65% 8.36%
Slide 22: Key Elements of Profitability
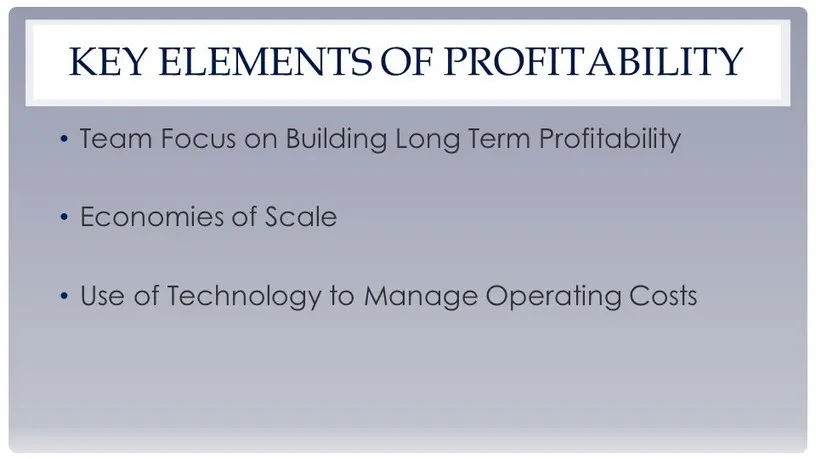
KEY ELEMENTS OF PROFITABILITY • Team Focus on Building Long Term Profitability • Economies of Scale • Use of Technology to Manage Operating Costs

Slide 23: Corporate Citizenship
CORPORATE CITIZENSHIP

Slide 24: Corporate Citizenship
CORPORATE CITIZENSHIP • Provide Leadership for Civic, Professional, and Charitable Organizations within the Community • As “Trustee of Public Faith”, Adhere to Regulatory Guidelines and Practices

Slide 25: First Quarter 2018 Update
FIRST QUARTER 2018 UPDATE
Slide 26: First Quarter 2018 Highlights
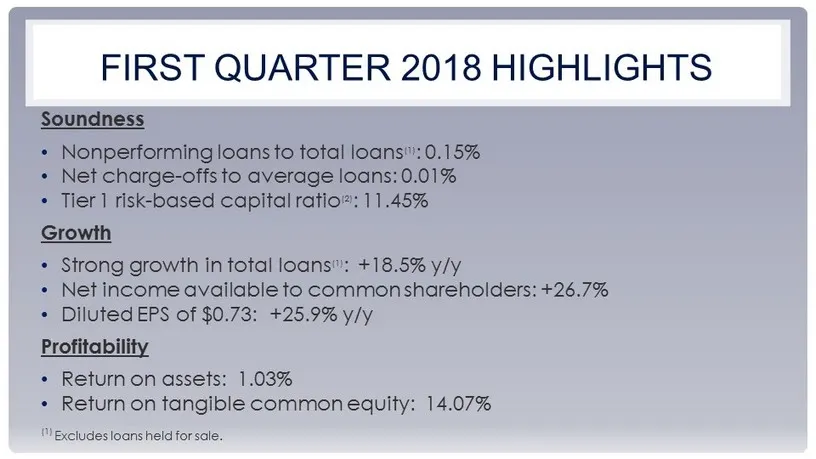
FIRST QUARTER 2018 HIGHLIGHTS Soundness • Nonperforming loans to total loans (1) : 0.15% • Net charge - offs to average loans: 0.01% • Tier 1 risk - based capital ratio (2) : 11.45% Growth • Strong growth in total loans (1) : +18.5% y/y • Net income available to common shareholders: + 26.7% • Dilute
Slide 27: Loan Growth and Diversification
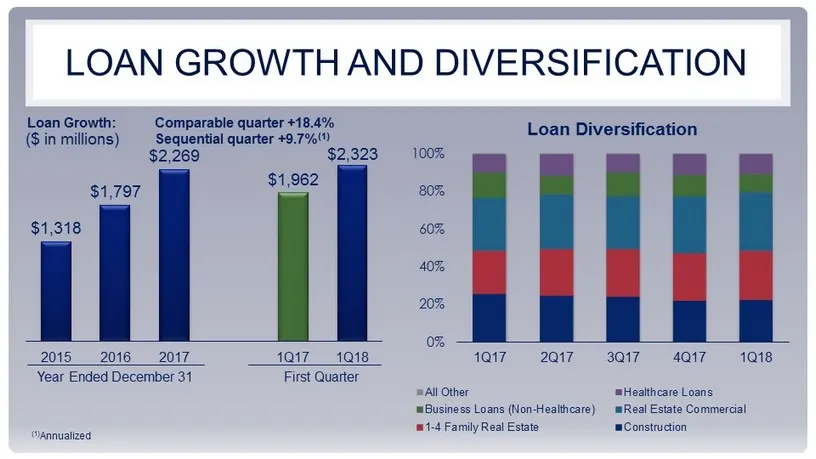
LOAN GROWTH AND DIVERSIFICATION ($ in millions) Loan Growth: Comparable quarter +18.4% Sequential quarter +9.7% (1) Loan Diversification $1,318 $1,797 $2,269 $1,962 $2,323 2015 2016 2017 1Q17 1Q18 Year Ended December 31 First Quarter 0% 20% 40% 60% 80% 100% 1Q17 2Q17 3Q17 4Q17 1Q18 All Other Healthc
Slide 28: Key Metric - Asset Quality: Primary Measures
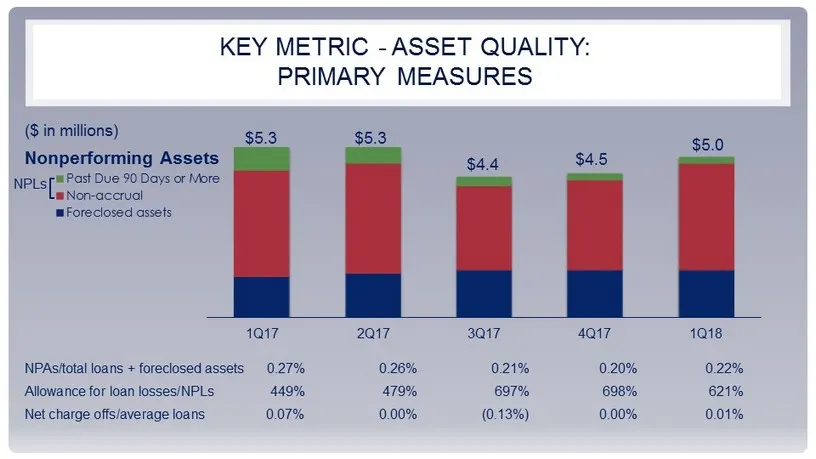
KEY METRIC - ASSET QUALITY: PRIMARY MEASURES ($ in millions) Nonperforming Assets NPAs/total loans + foreclosed assets 0.27% 0.26% 0.21% 0.20% 0.22% Allowance for loan losses/NPLs 449% 479% 697% 698 % 621% Net charge offs/average loans 0.07% 0.00% (0.13%) 0.00% 0.01% 1Q17 2Q17 3Q17 4Q17 1Q18 Past Du
Slide 29: Improving Efficiencies
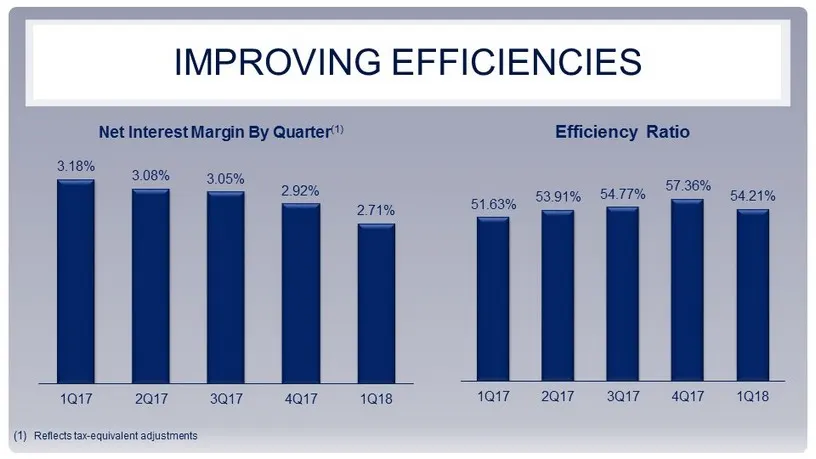
IMPROVING EFFICIENCIES Net Interest Margin By Quarter (1) (1) Reflects tax - equivalent adjustments Efficiency Ratio 3.18% 3.08% 3.05% 2.92% 2.71% 1Q17 2Q17 3Q17 4Q17 1Q18 51.63% 53.91% 54.77% 57.36% 54.21% 1Q17 2Q17 3Q17 4Q17 1Q18

Slide 30: Questions
QUESTIONS
Source: SEC EDGAR · 8-K filed May 24, 2018
More decks from Franklin Financial Network Inc
 Merger or Acquisition (January 2020)17 slides · Jan 21, 2020
 Q3 2019 Earnings Presentation21 slides · Nov 1, 2019
 Q3 2019 Earnings Presentation15 slides · Oct 23, 2019
 Q2 2019 Earnings Presentation19 slides · Jul 26, 2019
 Q2 2019 Earnings Presentation15 slides · Jul 24, 2019
 Q1 2019 Earnings Presentation19 slides · May 10, 2019