Dresser-Rand — Morgan Stanley Houston Bus Tour (August 2009)
21 slides from Dresser-Rand's conference presentation, Aug 25, 2009
Slide 1: Morgan Stanley Houston Bus Tour
DRESSER RAND Morgan Stanley Houston Bus Tour ; August 25, 2009
Slide 2: Disclosure
Disclosure The Private Securities Litigation Reform Act of 1995 provides a “safe harbor” for certain forward-looking statements so long as such information is identified as forward-looking and is. accompanied by meaningful cautionary statements identifying important factors that could cause actual r
Slide 3: E
E
Slide 4: Dresser-Rand - Global Supplier of Energy Solutions
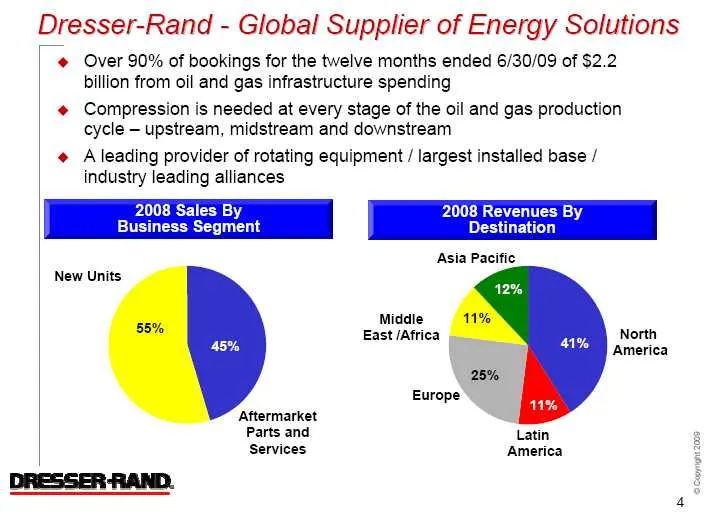
Dresser-Rand - Global Supplier of Energy Solutions @ Over 90% of bookings for the twelve months ended 6/30/09 of $2.2 billion from oil and gas infrastructure spending ¢ Compression is needed at every stage of the oil and gas production cycle — upstream, midstream and downstream ¢@ A leading provider
Slide 5: Extensive Global Presence
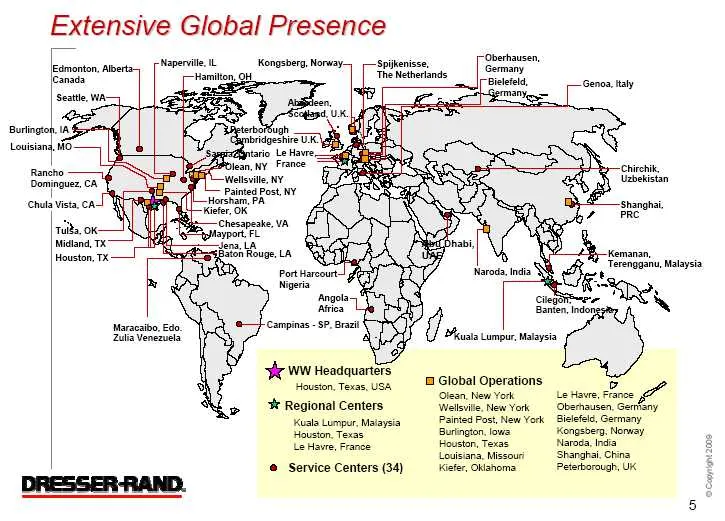
Extensive Global Presence leomonton, Aberta-, Naperville IL Kongsberg, Norway |eanads Hamiton, Oberhausen, Germany Spikenisse, ‘The Netherlands Burlington. Sere terbarbugh Louisiana, WO Semin CR tile ey tan cchuta vista. ca see ITN shanahat Tubs, 0: eek voor x! ions OY ROA CF | MeN pete 7 t/——Naroda
Slide 6: Strong Value Proposition and Selling Strategy
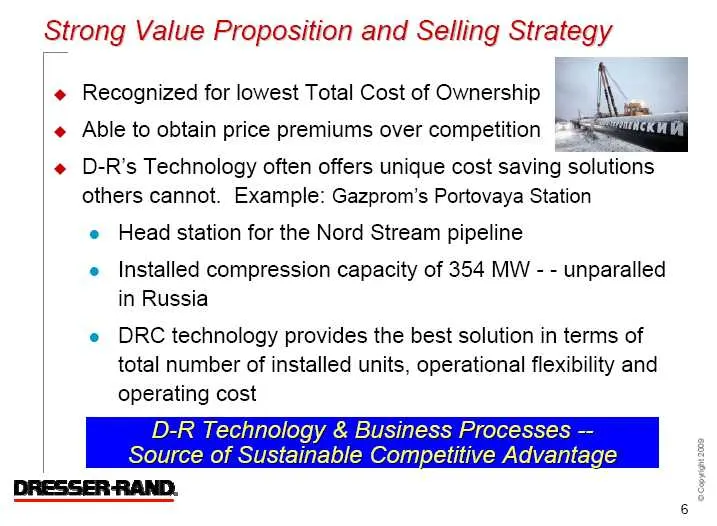
Strong Value Proposition and Selling Strategy « Recognized for lowest Total Cost of Ownership @ Able to obtain price premiums over competition ~ @ D-R’s Technology often offers unique cost saving solutions others cannot. Example: Gazprom’s Portovaya Station e Head station for the Nord Stream pipelin
Slide 7: Most Client Alliances in Industry
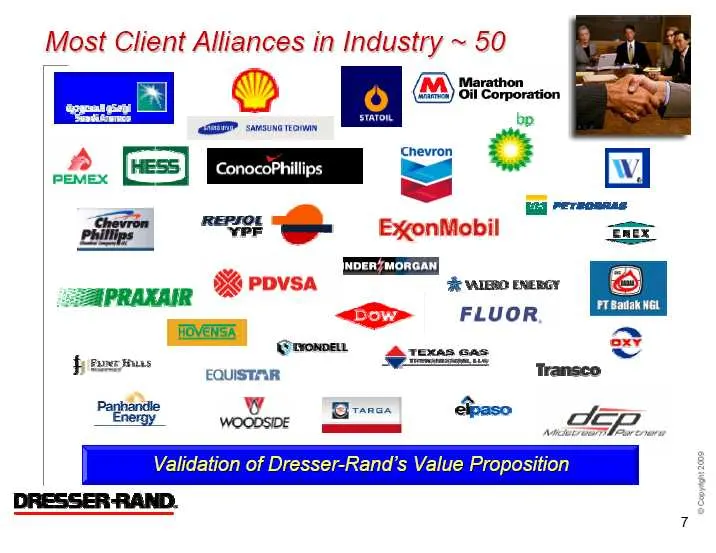
Most Client Alliances in Industry ~ 50 © Be an ConocoPhillips <2 ia es never G@- — ExonMobil
Slide 8: Solid Revenue and Income Growth
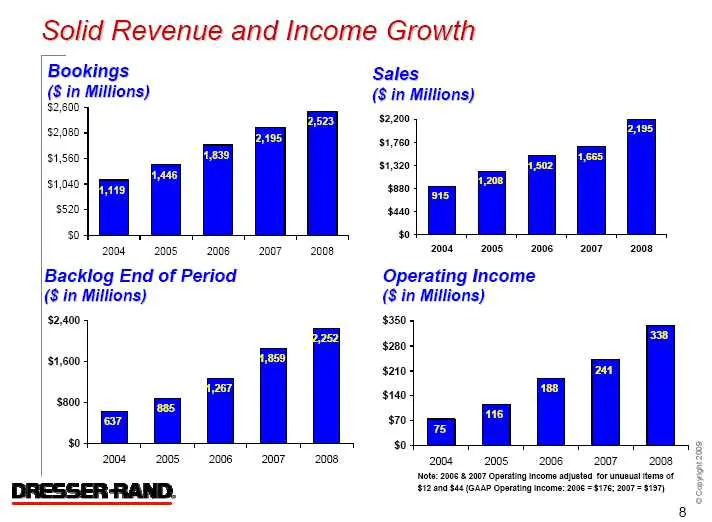
Solid Revenue and Income Growth Bookings ($ in Millions) 52,800, $2,080 $1,560 $1,040 $520 2004 200520082007 2008, Backlog End of Period ($ in Millions) 200s 20052006. 2007) 208, Sales ($ in Millions) $2,200 1.760 1.220 $200 suo $0 zoos 20052006 2007-2008 Operating Income ($ in Millions) 250 $200 $2
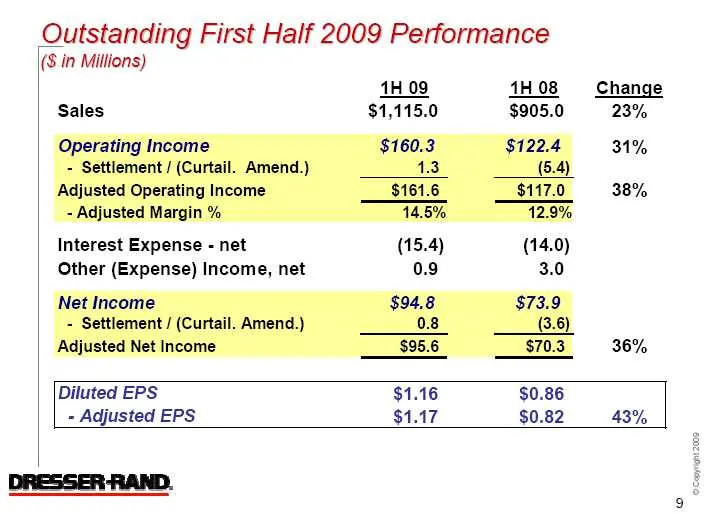
Slide 9: Outstanding First Half 2009 Performance
Outstanding First Half 2009 Performance (($ in Millions) 1H 09 41H 08 Change Sales $1,115.0 $905.0 23% Operating Income $160.3 $122.4 31% - Settlement / (Curtail. Amend.) 13 (5.4) Adjusted Operating Income $161.6 $117.0 38% - Adjusted Margin % 14.5% 12.9% Interest Expense - net (15.4) (14.0) Other (
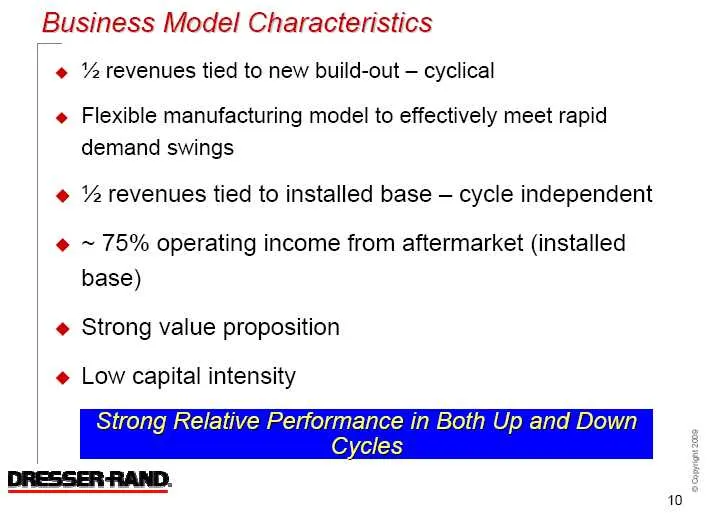
Slide 10: Business Model Characteristics
Business Model Characteristics Sd % revenues tied to new build-out — cyclical Flexible manufacturing model to effectively meet rapid demand swings % revenues tied to installed base — cycle independent ~ 75% operating income from aftermarket (installed base) Strong value proposition Low capital inten
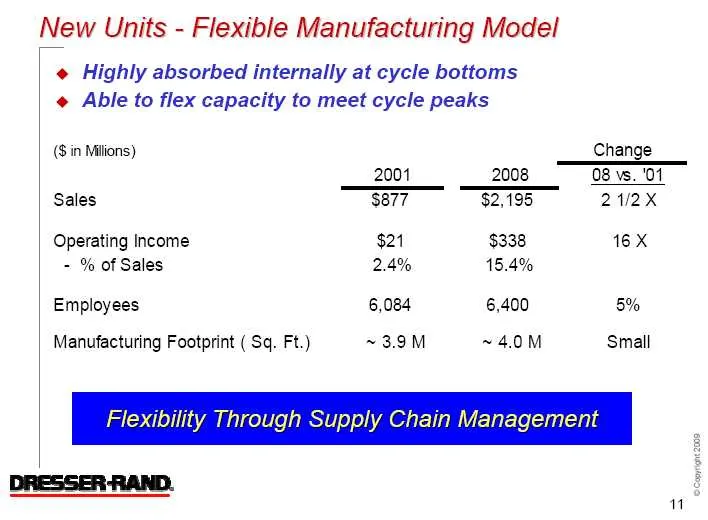
Slide 11: New Units - Flexible Manufacturing Model
New Units - Flexible Manufacturing Model @ Highly absorbed internally at cycle bottoms ¢@ Able to flex capacity to meet cycle peaks ($ in Milions) Change 2001 2008 08 vs. '01 Sales $877 $2,195 21/2X Operating Income $21 $338 16 X - % of Sales 2.4% 15.4% Employees 6,084 6,400 5% Manufacturing Footpri
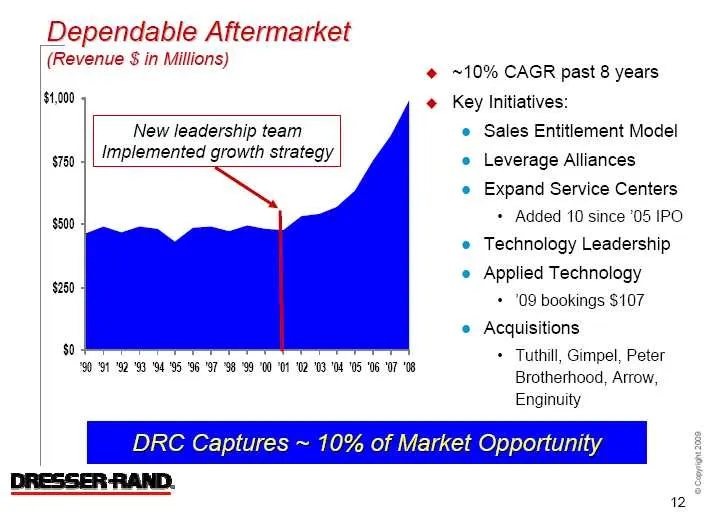
Slide 12: Dependable Aftermarket
Dependable Aftermarket (Revenue $ in Millions) $4,000 New leadership team Implemented growth strategy Se $750 $0 DB WS HT EH OD HO 6 OT @ ~10% CAGR past 8 years @ Key Initiatives: e Sales Entitlement Model e Leverage Alliances e Expand Service Centers + Added 10 since ‘05 IPO ® Technology Leadership
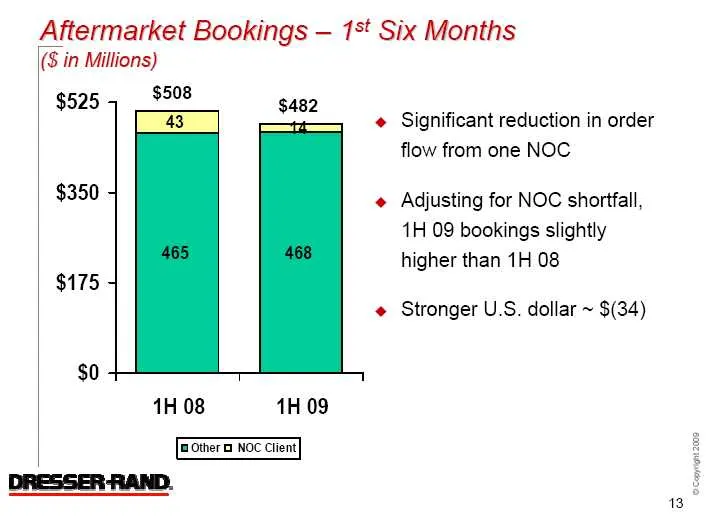
Slide 13: Aftermarket Bookings — 1H Six Months
Aftermarket Bookings — 1%* Six Months ($ in Millions) $525 $508 = ¢ Significant reduction in order flow from one NOC $350 @ Adjusting for NOC shortfall, 1H 09 bookings slightly higher than 1H 08 $175 @ Stronger U.S. dollar ~ $(34) $0 1H 08 1H 09 m Other o NOC Client 13
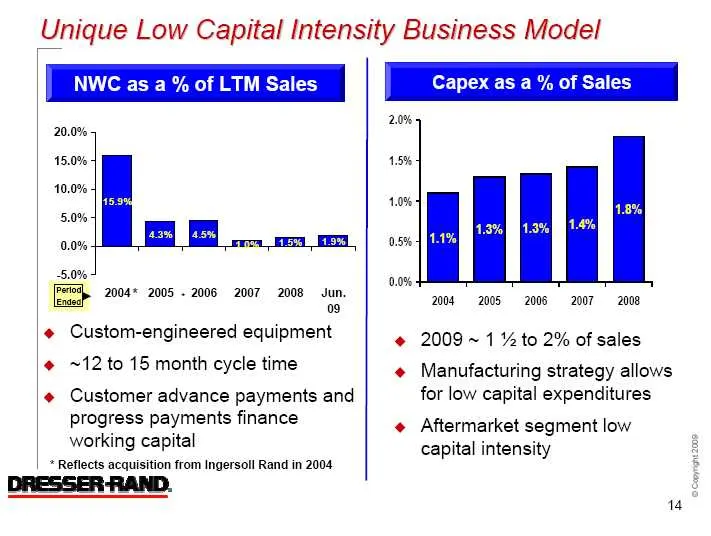
Slide 14: Unique Low Capital Intensity Business Model
Unique Low Capital Intensity Business Model NWC as a % of LTM Sales 20.0% 15.0% 10.0% 5.0% 0.0% 5.0% Ee 2004* 2005 - 2006 2007 2008 Jun. J 09 @ Custom-engineered equipment @ ~12 to 15 month cycle time @ Customer advance payments and progress payments finance working capital * Reflects acquisition fr
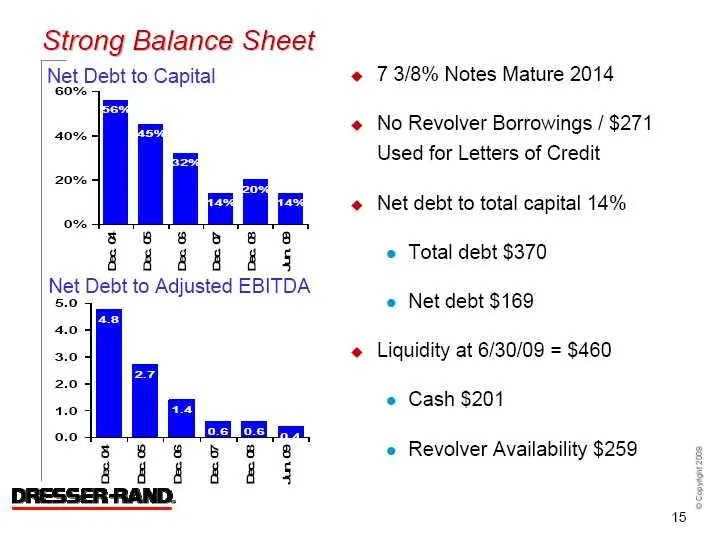
Slide 15: Strong Balance Sheet
Strong Balance Sheet Net Debt to Capital 60% 40% 20% 0% 3/68 8 8 6 8B aaa 4 & § Net Debt to Adjusted EBITDA 5.0 4.3] 4.0 3.0 2.7] 2.0 4.0 1.4] 0.0 7 3/8% Notes Mature 2014 No Revolver Borrowings / $271 Used for Letters of Credit Net debt to total capital 14% e Total debt $370 e Net debt $169 Liquidi
Slide 16: Outlook
Outlook
Slide 17: Current Market Conditions
Current Market Conditions @ New unit bookings remain sluggish e Believe client delays in placing orders are temporary e Steady flow of inquiries « Continue to expect new unit bookings for the full year to be in the range of $700 million to $1.1 billion e Visibility to many projects ¢@ Aftermarket bo
Slide 18: Traditional Market Opportunities
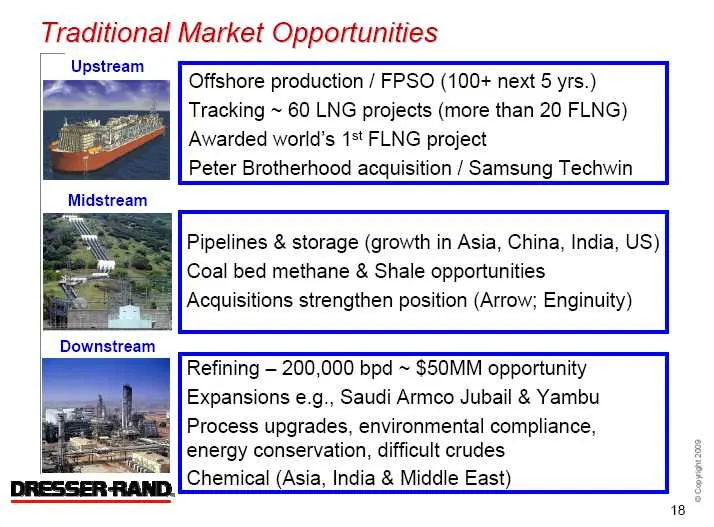
Traditional Market Opportunities Upstream Offshore production / FPSO (100+ next 5 yrs.) Tracking ~ 60 LNG projects (more than 20 FLNG) Awarded world’s 1st FLNG project Peter Brotherhood acquisition / Samsung Techwin Pipelines & storage (growth in Asia, China, India, US) Coal bed methane & Shale oppo
Slide 19: Emerging Market Opportunities
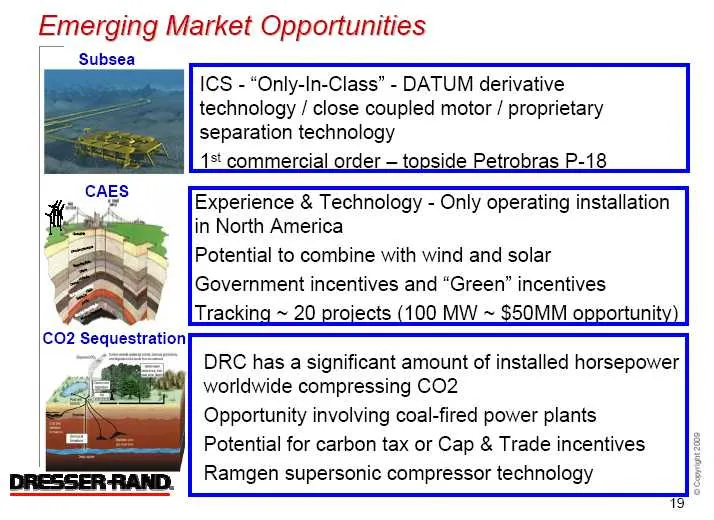
Emerging Market Opportunities ICS - “Only-In-Class” - DATUM derivative technology / close coupled motor / proprietary separation technology Experience & Technology - Only operating installation in North America Potential to combine with wind and solar Government incentives and “Green” incentives Tra
Slide 20: Summary
Summary «@ Believe we have sustainable competitive advantages: Technology, Alliances, Installed Base, Service Network ¢ Believe we are very well positioned for difficult economy e DRC Business Model Characteristics * Steady high margin aftermarket + Flexible manufacturing model e Results: * Ability

Slide 21: are fr
gE t are fr DRESSER RAND www.dresser-rand.com a info@dresser-rand.com "403
Source: SEC EDGAR · 8-K filed Aug 25, 2009
More decks from Dresser-Rand Group Inc
 Merger or Acquisition (September 2014)16 slides · Sep 23, 2014
 Merger or Acquisition (March 2011)32 slides · Mar 7, 2011
 Credit Suisse Energy Summit 201128 slides · Feb 7, 2011
 Investor Day (November 2010)111 slides · Nov 10, 2010
 Howard Weil 2010 Energy Conference24 slides · Mar 19, 2010
 Pritchard Capital Partners – Energize 201022 slides · Jan 5, 2010