Dresser-Rand — Howard Weil 2010 Energy Conference
24 slides from Dresser-Rand's conference presentation, Mar 19, 2010
Slide 1: Howard Weil 2010 Energy Conference
DRESSER RAND ... Howard Weil 2010 Energy Conference. March 22, 2010
Slide 2: Disclosure
Disclosure The Private Securities Litigation Reform Act of 1995 provides a “safe harbor’ for certain forearc-ooking statements 8 lng ax such ifermalion la kariied 98 forwarding ae a cautionary statements identifying important factors that could ause actual results to differ mately rom those projecte
Slide 3: Company Overview
Company Overview
Slide 4: Global Supplier of Energy Solutions
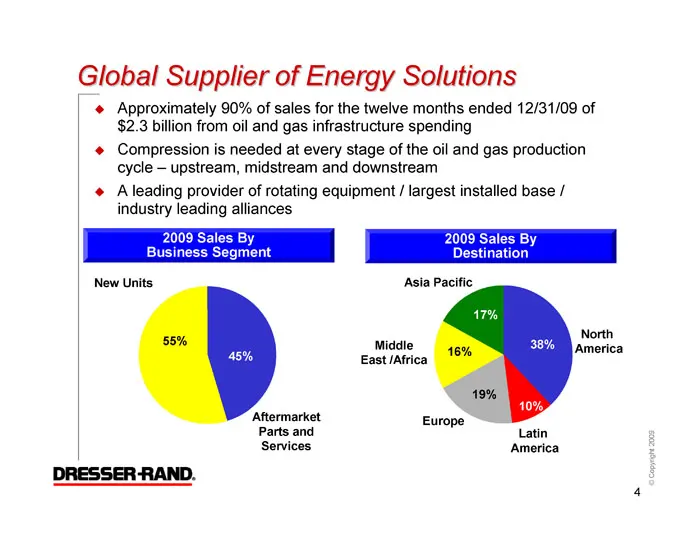
Global Supplier of Energy Solutions Approximately 90% of sales for the twelve months ended 12/31/09 of $2.3 billion from oil and gas infrastructure spending Compression is needed at every stage of the oil and gas production cycle — upstream, midstream and downstream Aleading provider of rotating equ
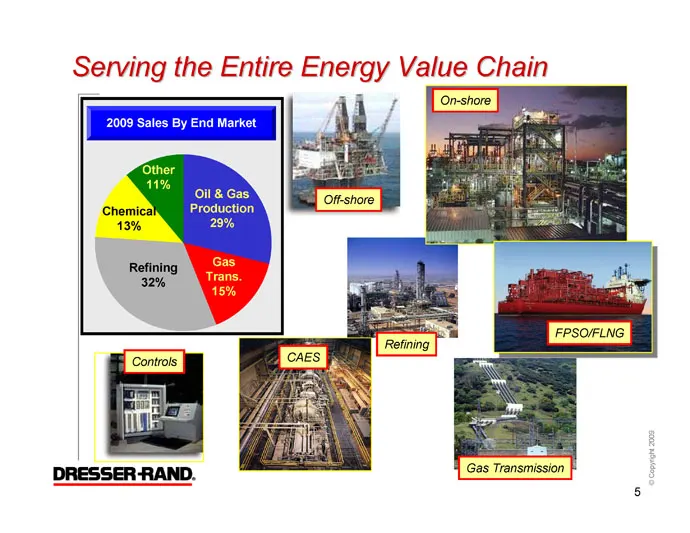
Slide 5: Gas Transmission
Gas Transmission
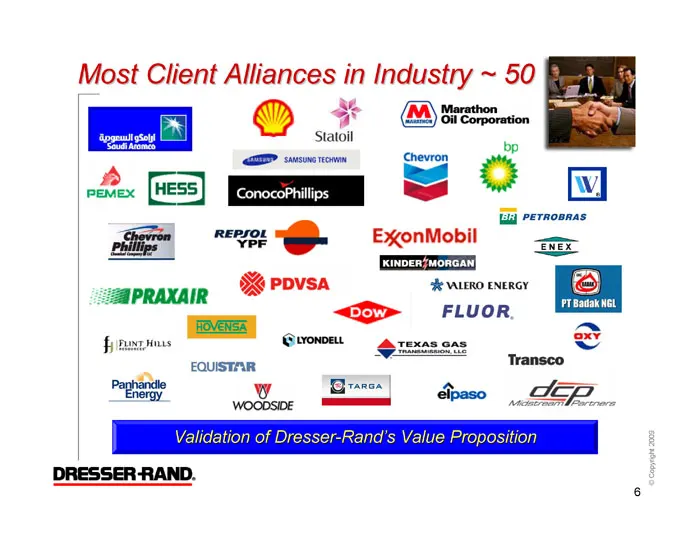
Slide 6: Most Client Alliances
Most Client Alliances a beens ~ 50 ® sia Gj rernopnas fli 2. ExonMobil as KINDER; MORGAN] Fe VALERO ENERGY <> FLUOR roots vagpraxain "%® PPVSA
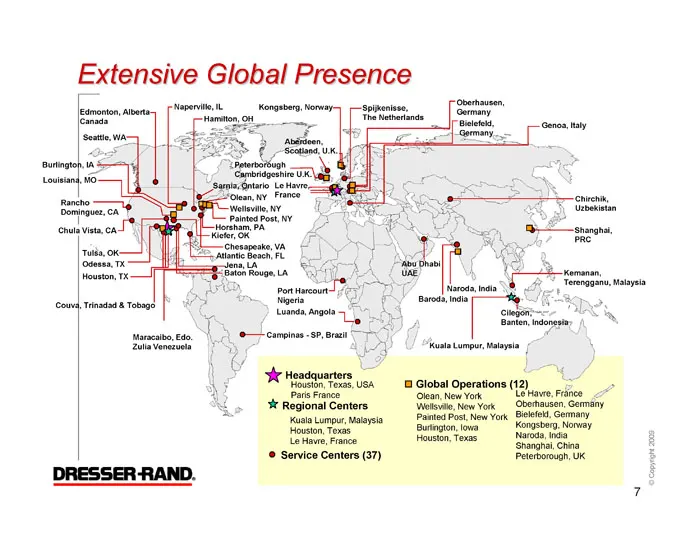
Slide 7: Extensive Global Presence
Extensive Global Presence snot “He Headquarters i Mn Yous. UGA Global Operations (12), . i ‘3 Regional Centers Relves Ne York eerie! _ Eemtcdot hen You Sl, Gos ‘at Lump Maa Congsberg, Nonny ferent Col funn eras 3 i Shanghal china © Service Centers (37) eterborugh, UK
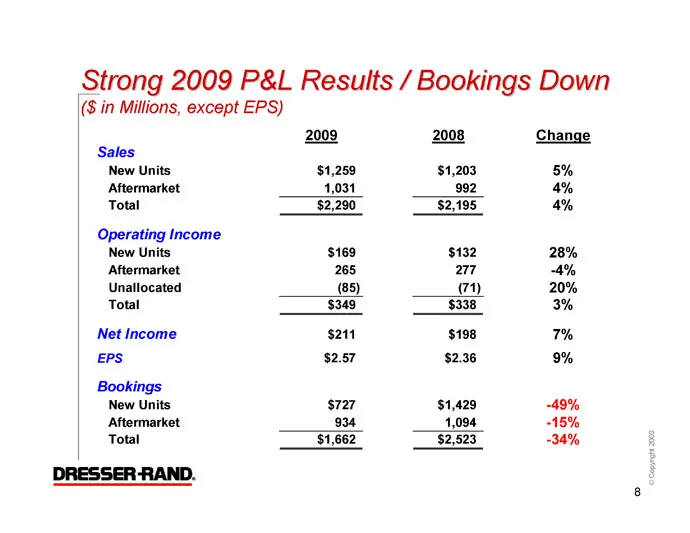
Slide 8: Strong 2009 P&L Results / Bookings Down
Strong 2009 P&L Results / Bookings Down ($ in Millions, except EPS) 2009 2008 Change Sales New Units $1,259 $1,203 5% Aftermarket 4,031 992 4% Total $2,290 $2,195 4% Operating Income it st69 $132 28% Aftermarket 265 277 4% Unallocated (85) my 20% Total $349 $338 3% Net Income s2t1 $198 Th EPS $2.57
Slide 9: Business Model Characteristics
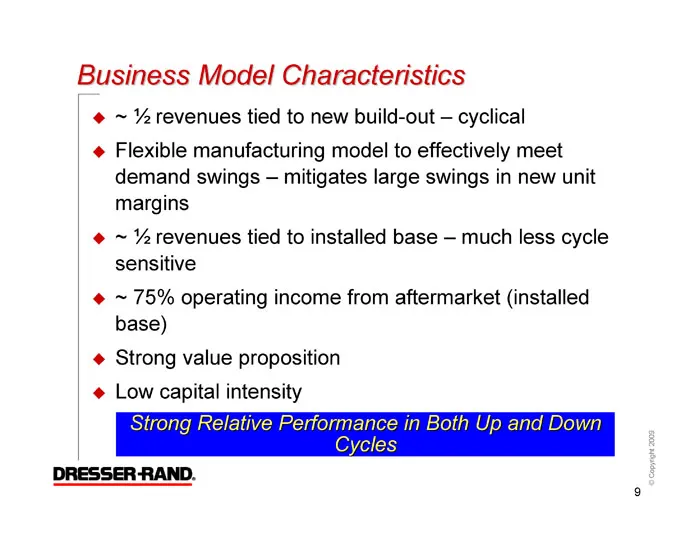
Business Model Characteristics ~ % revenues tied to new build-out — cyclical ¢ Flexible manufacturing model to effectively meet demand swings — mitigates large swings in new unit margins ~ % revenues tied to installed base — much less cycle sensitive ¢ ~ 75% operating income from aftermarket (instal
Slide 10: New Units - Flexible Manufacturing Model
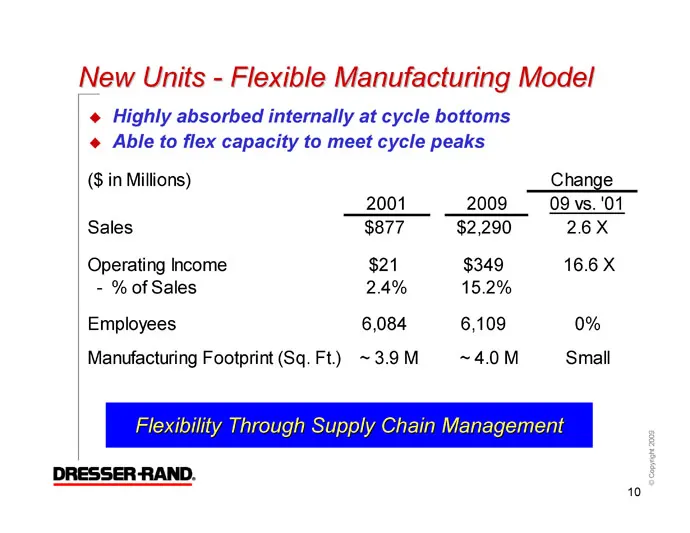
New Units - Flexible Manufacturing Model Manufacturing Footprint (Sq. Ft.) ~3.9M ($ in Millions) 2001 Sales $877 Operating Income $21 - % of Sales 24% Employees 6,084 ¢@ Highly absorbed internally at cycle bottoms « Able to flex capacity to meet cycle peaks 2009 $2,290 $349 15.2% 6,109 ~4.0M
Slide 11: Dependable Aftermarket
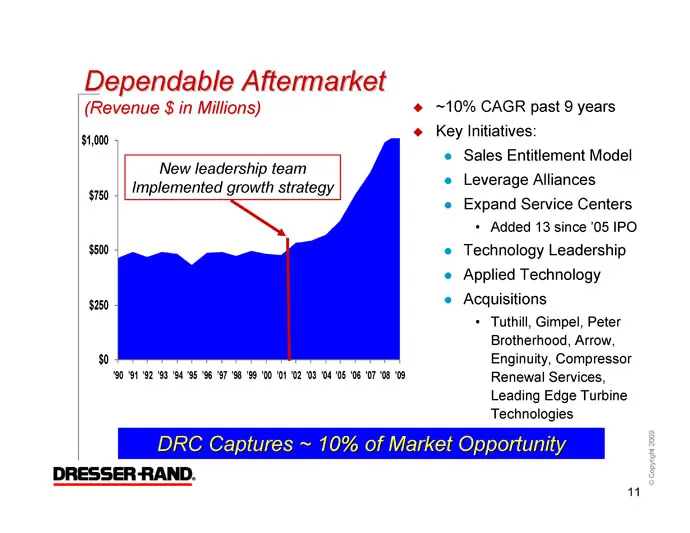
Dependable Aftermarket (Revenue $ in Millions) 1,000 » New leadership team sr, Implemented growth strategy ‘80 91-92 50 94 956 97 56 98 00 UF 02 UO OE OS U6 OT . . ~10% CAGR past 9 years Key Initiatives: © Sales Entitlement Model © Leverage Alliances © Expand Service Centers + Added 13 since '05 IPO
Slide 12: Aftermarket Bookings — December YTD
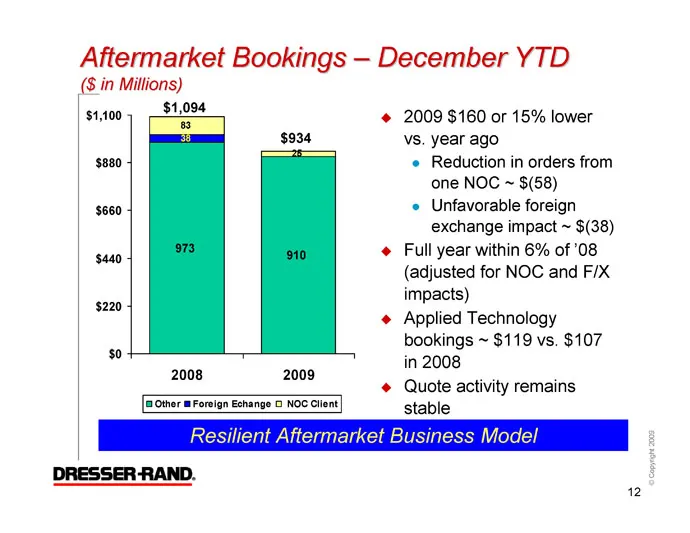
Aftermarket Bookings — December YTD ($ in Millions) $1,100 $1,094 $934 see0 $660 $440 $220 $0 2008 2009 [a Other m Foreign Eshange © NOC Client ° ° ° 2009 $160 or 15% lower vs. year ago Reduction in orders from one NOC ~ $(58) Unfavorable foreign exchange impact ~ $(38) Full year within 6% of 08 (ad
Slide 13: NWC as a % of LTM Sales
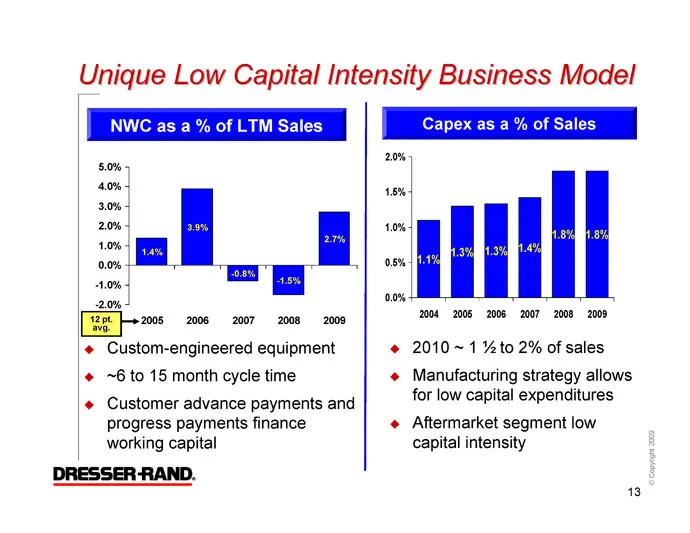
NWC as a % of LTM Sales 2008 2007 2008-2009 . Custom-engineered equipment * ~6to 15 month cycle time Customer advance payments and progress payments finance working capital Unique Low Capital Intensity Business Model Capex as a % of Sales 2004 2006 2006 2007 2008 2008 @ 2010~1 %to 2% of sales + Manu
Slide 14: Strong Balance Sheet
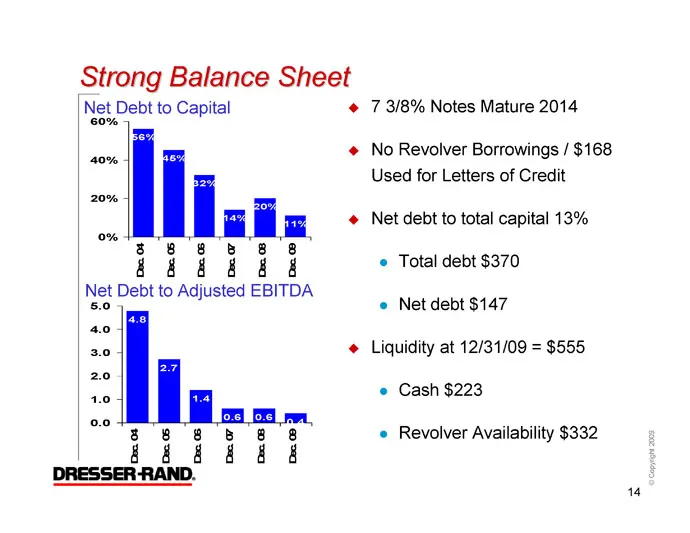
Strong Balance Sheet Net Debt to Capital Net he ‘ eee nn 5.0 @ 7 3/8% Notes Mature 2014 @ No Revolver Borrowings / $168 Used for Letters of Credit Net debt to total capital 13% e Total debt $370 e Net debt $147 @ Liquidity at 12/31/09 = $555 e Cash $223 e Revolver Availability $332
Slide 15: $200 Million Share Repurchase Program
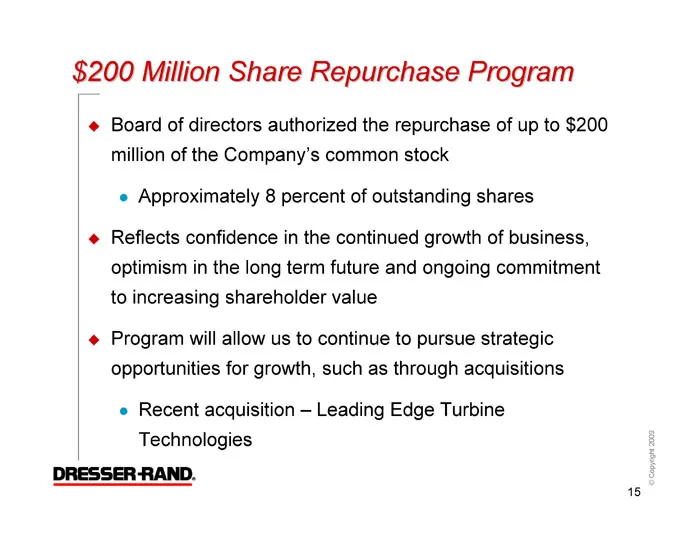
$200 Million Share Repurchase Program ¢ Board of directors authorized the repurchase of up to $200 million of the Company's common stock e Approximately 8 percent of outstanding shares @ Reflects confidence in the continued growth of business, optimism in the long term future and ongoing commitment
Slide 16: Leading Edge Turbine Technologies
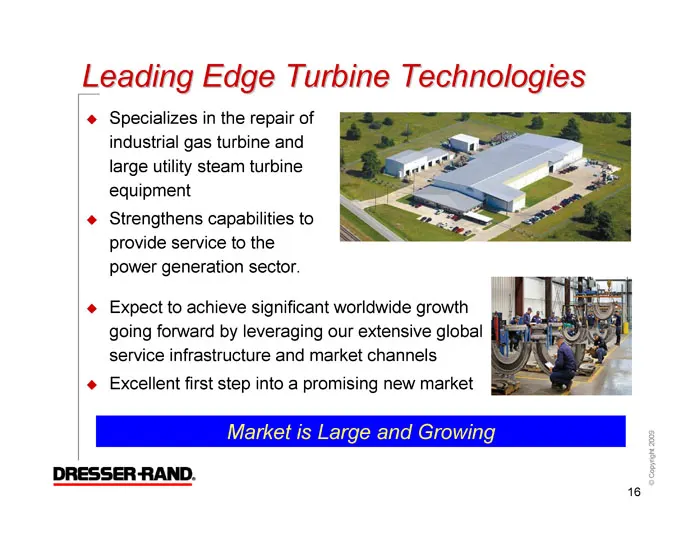
Leading Edge Turbine Technologies Specializes in the repair of industrial gas turbine and large utility steam turbine equipment ° Strengthens capabilities to provide service to the power generation sector. ° Expect to achieve significant worldwide growth going forward by leveraging our extensive glo
Slide 17
Slide 18: Traditional Market Opportunities
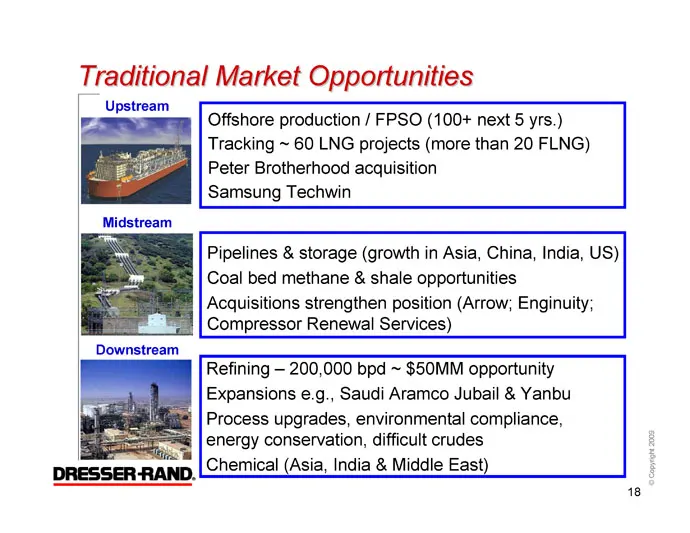
Traditional Market Opportunities Upstream an Offshore production / FPSO (100+ next 5 yrs.) Tracking ~ 60 LNG projects (more than 20 FLNG) Peter Brotherhood acquisition Samsung Techwin Pipelines & storage (growth in Asia, China, India, US) Coal bed methane & shale opportunities Acquisitions strengthe
Slide 19: Emerging Market Opportunities
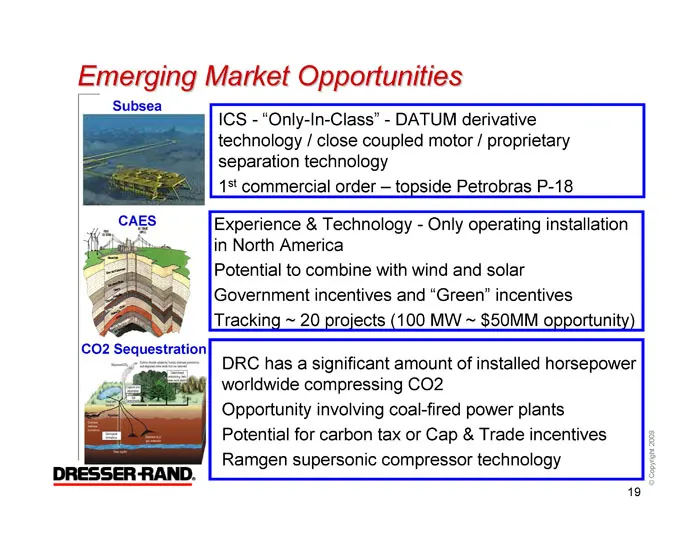
Emerging Market Opportunities Subsea ICS - “Only-In-Class” - DATUM derivative technology / close coupled motor / proprietary separation technology 1s commercial order — topside Petrobras P-18 Experience & Technology - Only operating installation in North America Potential to combine with wind and so
Slide 20: 2010 New Units Outlook
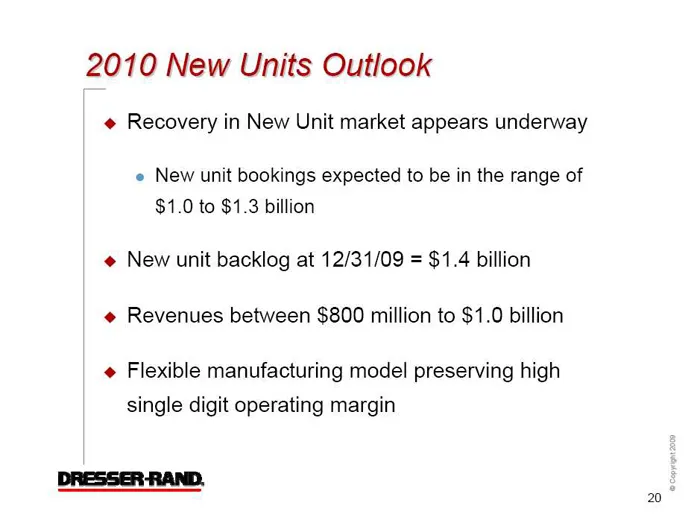
2010 New Units Outlook « Recovery in New Unit market appears underway e New unit bookings expected to be in the range of $1.0 to $1.3 billion @ New unit backlog at 12/31/09 = $1.4 billion @ Revenues between $800 million to $1.0 billion @ Flexible manufacturing model preserving high single digit oper
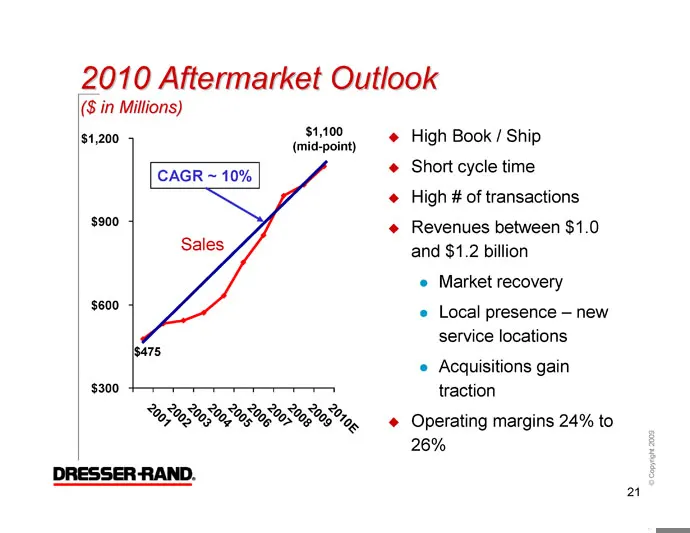
Slide 21: 2010 Aftermarket Outlook
2010 Aftermarket Outlook ($ in Millions) $1,200 $1,100 (mid-point) eRasesereseseresesn, ° High Book / Ship Short cycle time High # of transactions Revenues between $1.0 and $1.2 billion e Market recovery e Local presence — new service locations © Acquisitions gain traction Operating margins 24% to 2
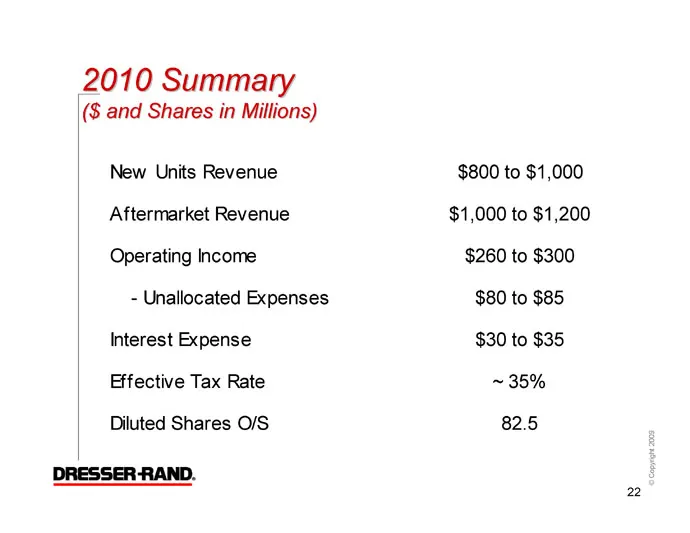
Slide 22: 2010 Summary
2010 Summary ($ and Shares in Millions) New Units Revenue Aftermarket Revenue Operating Income - Unallocated Expenses Interest Expense Effective Tax Rate Diluted Shares O/S DRESSER RAND. $800 to $1,000 $1,000 to $1,200 $260 to $300 $80 to $85 $30 to $35 ~ 35% 82.5
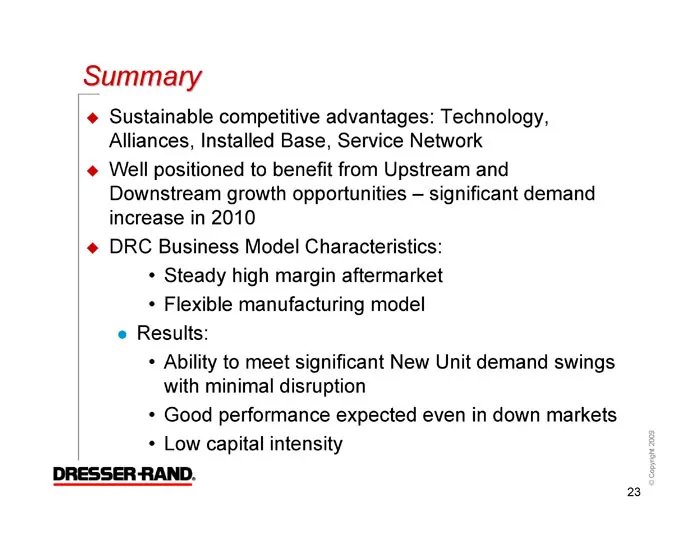
Slide 23: Summary
Summary qT Alliances, Installed Base, Service Network ¢@ Well positioned to benefit from Upstream and Downstream growth opportunities — significant demand increase in 2010 « DRC Business Model Characteristics: + Steady high margin aftermarket * Flexible manufacturing model e Results: + Ability to me
Slide 24: www.dresser-rand.com
www.dresser-rand.com _info@dresser-rand.com
Source: SEC EDGAR · 8-K filed Mar 19, 2010
More decks from Dresser-Rand Group Inc
 Merger or Acquisition (September 2014)16 slides · Sep 23, 2014
 Merger or Acquisition (March 2011)32 slides · Mar 7, 2011
 Credit Suisse Energy Summit 201128 slides · Feb 7, 2011
 Investor Day (November 2010)111 slides · Nov 10, 2010
 Pritchard Capital Partners – Energize 201022 slides · Jan 5, 2010
 Annual Small / Mid Cap Conference (November 2009)23 slides · Nov 19, 2009