Dresser-Rand — Pritchard Capital Partners – Energize 2010
22 slides from Dresser-Rand's conference presentation, Jan 5, 2010
Slide 1: Pritchard Capital Partners – Energize 2010
Pritchard Capital Partners – Energize 2010
Slide 2: Disclosure
Disclosure The Private Securities Litigation Reform Act of 1995 provides a “safe harbor” for certain forward-looking statements so long as such information is identified as forward-looking and is accompanied by meaningful cautionary statements identifying important factors that could cause actual re
Slide 3: Company Overview
Company Overview
Slide 4: Global Supplier of Energy Solutions
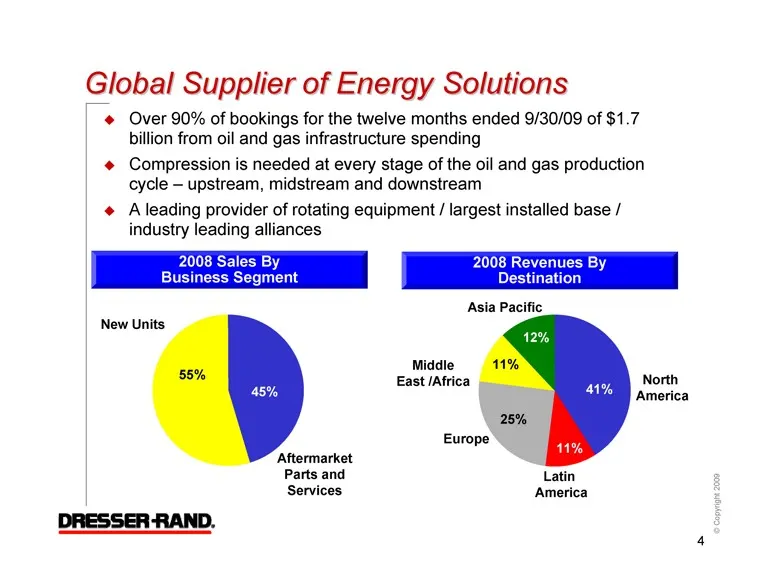
12% 11% 25% MiddleEast /Africa Europe Latin America 41% 11% Asia Pacific North America Global Supplier of Energy Solutions Over 90% of bookings for the twelve months ended 9/30/09 of $1.7 billion from oil and gas infrastructure spending Compression is needed at every stage of the oil and gas product
Slide 5: Extensive Global Presence
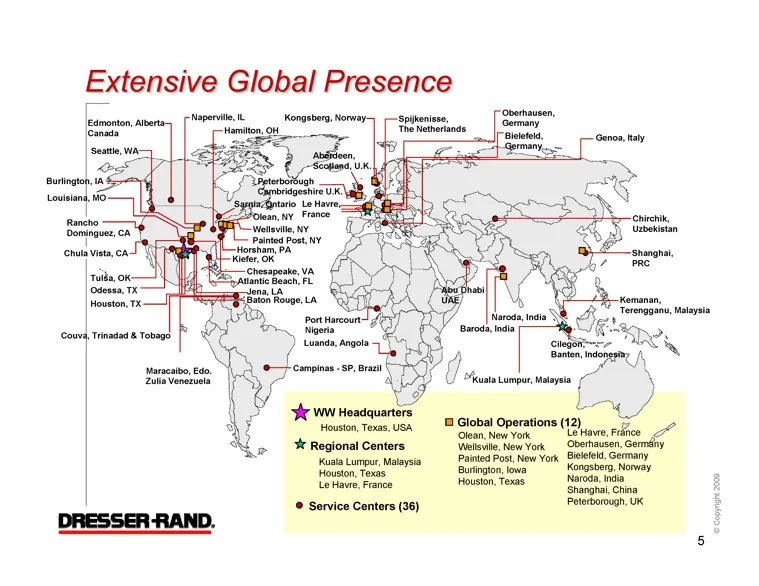
Extensive Global Presence Shanghai,PRC Kemanan, Terengganu, Malaysia Cilegon, Banten, Indonesia Naroda, India Kongsberg, Norway Spijkenisse,The Netherlands Oberhausen,Germany Peterborough Cambridgeshire U.K. Le Havre,France Genoa, Italy Campinas - SP, Brazil Maracaibo, Edo.Zulia Venezuela Edmonton,
Slide 6: Most Client Alliances in Industry
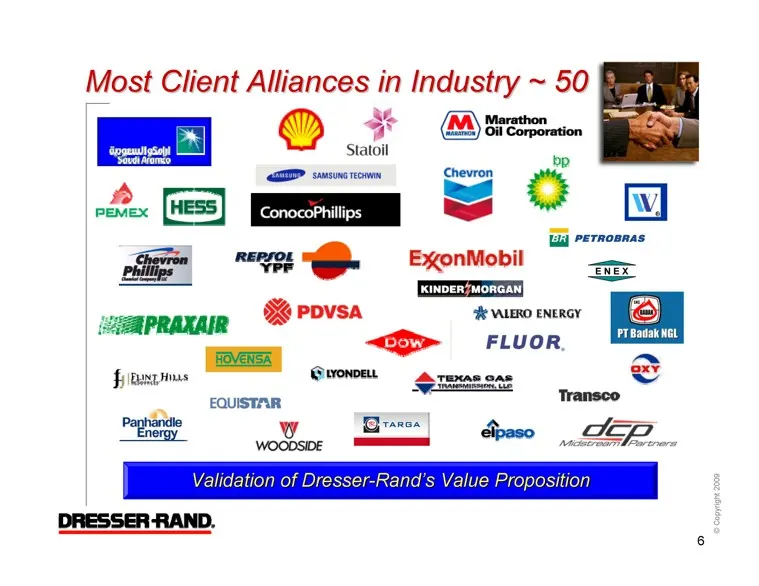
Most Client Alliances in Industry ~ 50 Validation of Dresser-Rand’s Value Proposition 6
Slide 7: Solid Revenue and Income Growth
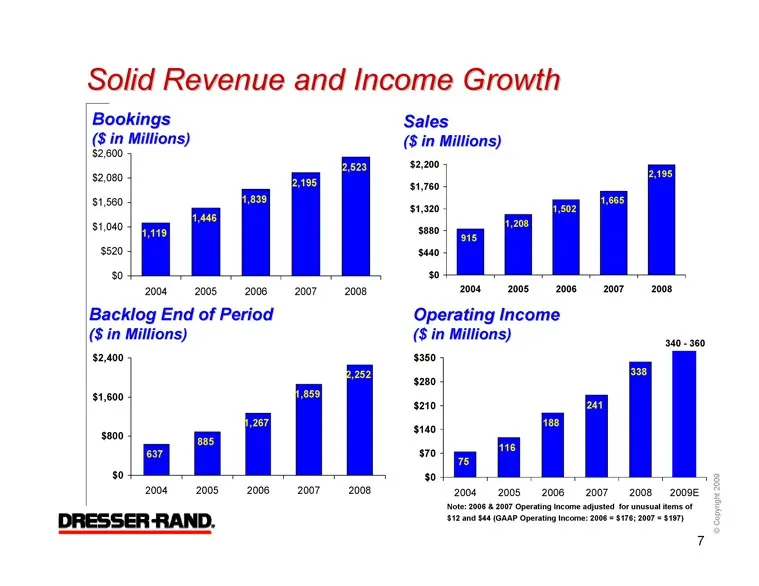
Solid Revenue and Income Growth 2008 2007 2006 2005 2004 $2,600 $2,080 $1,560 $1,040 $520 $0 2,523 2,195 1,839 1,446 1,119 2008 2007 2006 2005 2004 $2,400 $1,600 $800 $0 2,252 1,859 1,267 885 637 340 - 360 ($ in Millions) ($ in Millions) 915 1,208 1,502 1,665 2,195 $0 $440 $880 $1,320 $1,760 $2,200
Slide 8: Nine Months Results Summary
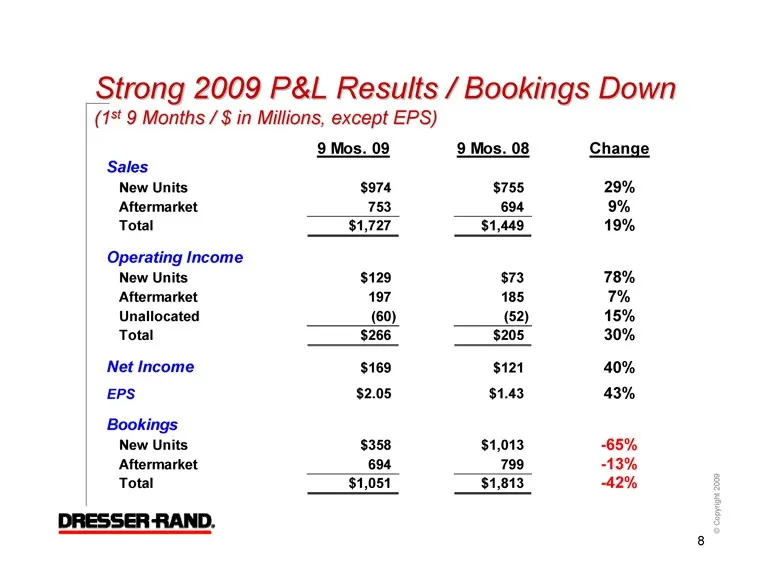
(1 9 Months / $ in Millions, except EPS) 9 Mos. 09 9 Mos. 08 Change Sales New Units $974 $755 29% Aftermarket 753 694 9% Total $1,727 $1,449 19% Operating Income New Units $129 $73 78% Aftermarket 197 185 7% Unallocated (60) (52) 15% Total $266 $205 30% Net Income $169 $121 40% EPS $2.05 $1.43 43% B
Slide 9: Business Model Characteristics
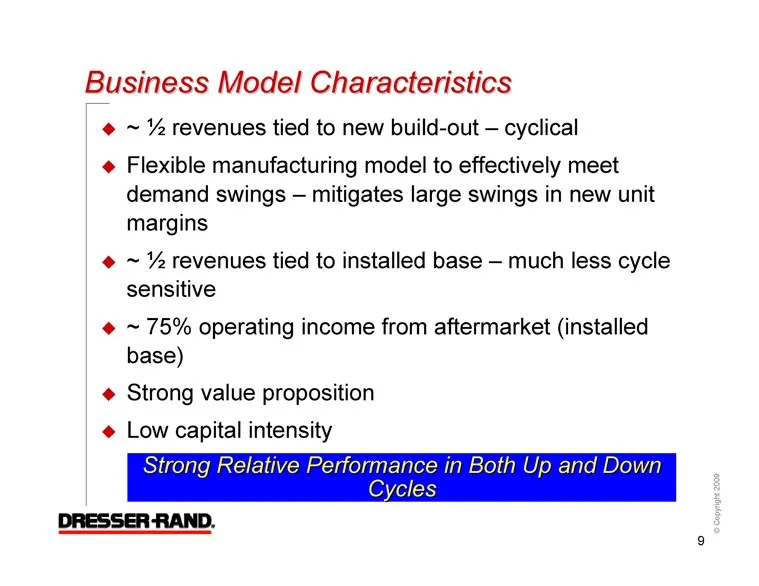
Business Model Characteristics ~ ½ revenues tied to new build-out – cyclical Flexible manufacturing model to effectively meet demand swings – mitigates large swings in new unit margins ~ ½ revenues tied to installed base – much less cycle sensitive ~ 75% operating income from aftermarket (installed
Slide 10: New Units - Flexible Manufacturing Model
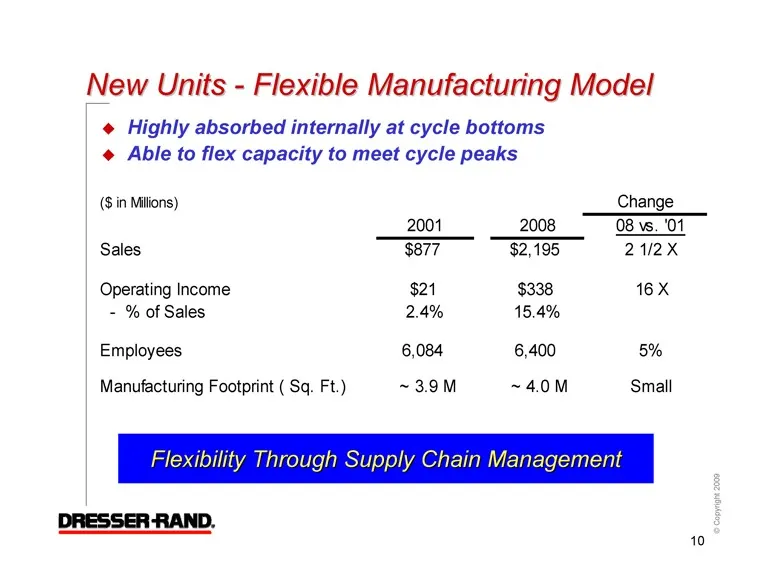
New Units - Flexible Manufacturing Model Highly absorbed internally at cycle bottoms Able to flex capacity to meet cycle peaks Flexibility Through Supply Chain Management ($ in Millions) 2001 2008 08 vs. '01 Sales $877 $2,195 2 1/2 X Operating Income $21 $338 16 X - % of Sales 2.4% 15.4% Employees 6
Slide 11: Growth Strategy and Key Initiatives
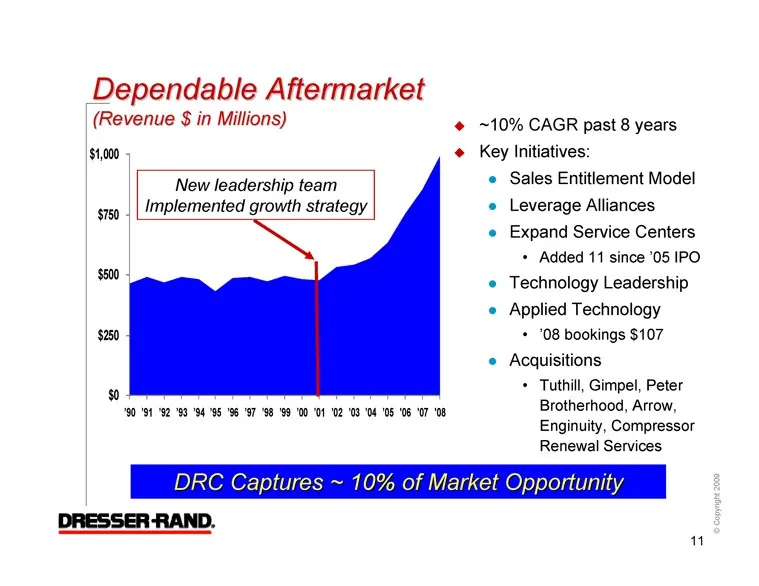
New leadership team Implemented growth strategy ~10% CAGR past 8 years Key Initiatives: Sales Entitlement Model Leverage Alliances Expand Service Centers Added 11 since ’05 IPO Technology Leadership Applied Technology ’08 bookings $107 Acquisitions Tuthill, Gimpel, Peter Brotherhood, Arrow, Enginuit
Slide 12: Resilient Aftermarket Business Model
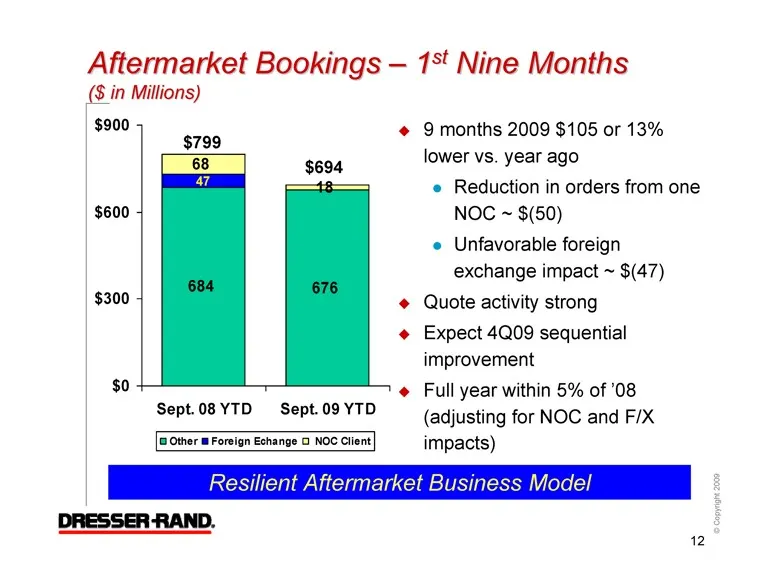
Nine Months ($ in Millions) Resilient Aftermarket Business Model $694 $799 9 months 2009 $105 or 13% lower vs. year ago Reduction in orders from one NOC ~ $(50) Unfavorable foreign exchange impact ~ $(47) Quote activity strong Expect 4Q09 sequential improvement Full year within 5% of ’08 (adjusting
Slide 13: Unique Low Capital Intensity Business Model
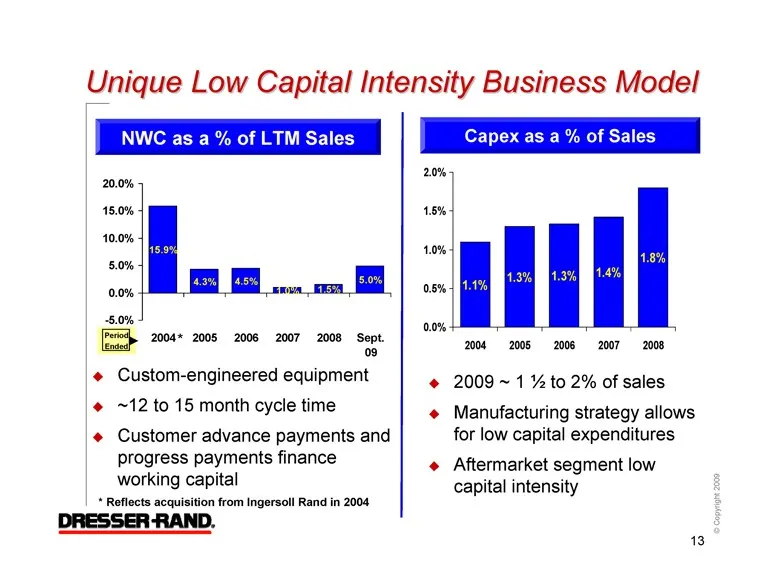
Unique Low Capital Intensity Business Model NWC as a % of LTM Sales 09 Sept. 2008 2007 2006 2005 2004 20.0% 15.0% 10.0% 5.0% 0.0% -5.0% 5.0% 1.5% 1.0% 4.5% 4.3% 15.9% * Period Ended * Reflects acquisition from Ingersoll Rand in 2004 Capex as a % of Sales 2009 ~ 1 ½ to 2% of sales Manufacturing strat
Slide 14: Strong Balance Sheet
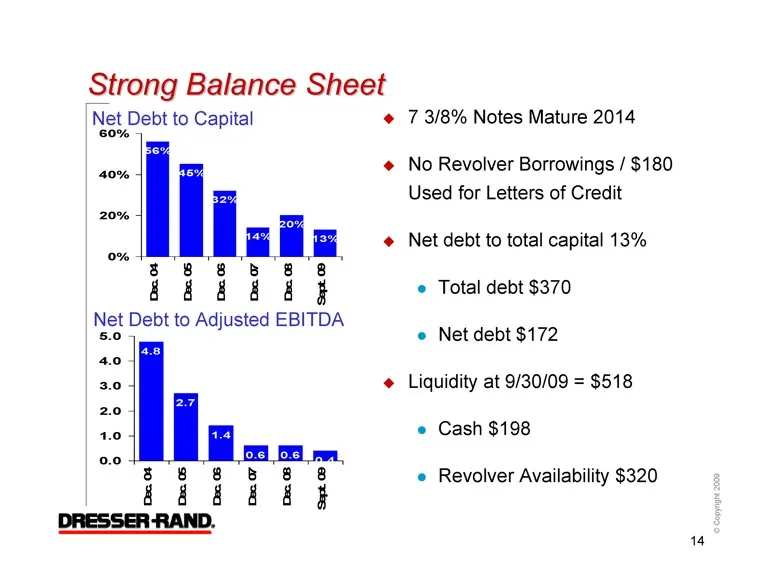
Strong Balance Sheet Net Debt to Capital Net Debt to Adjusted EBITDA 60% 40% 20% 0% 13% 20% 14% 32% 45% 56% 7 3/8% Notes Mature 2014 No Revolver Borrowings / $180 Used for Letters of Credit Net debt to total capital 13% Total debt $370 Net debt $172 Liquidity at 9/30/09 = $518 Cash $198 Revolver Ava
Slide 15: Outlook
Outlook
Slide 16: Traditional Market Opportunities
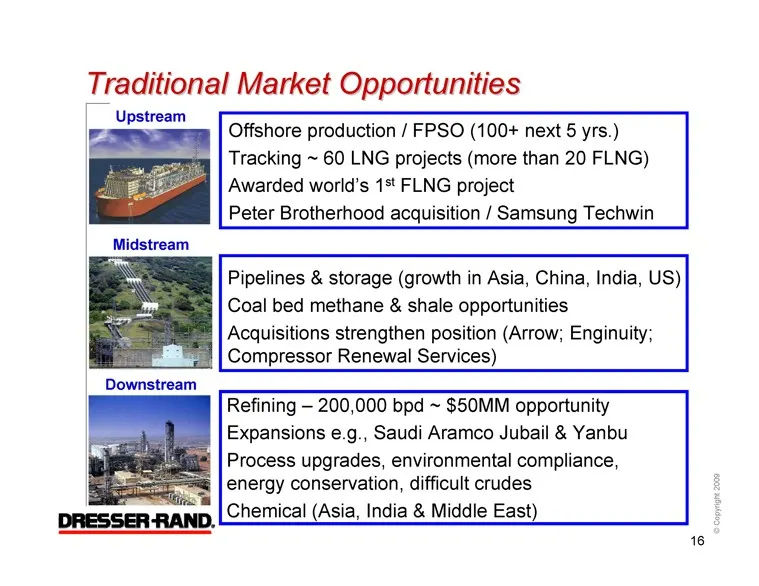
Traditional Market Opportunities Offshore production / FPSO (100+ next 5 yrs.) Tracking ~ 60 LNG projects (more than 20 FLNG) FLNG project Peter Brotherhood acquisition / Samsung Techwin Upstream Midstream Downstream Pipelines & storage (growth in Asia, China, India, US) Coal bed methane & shale opp
Slide 17: Emerging Market Opportunities
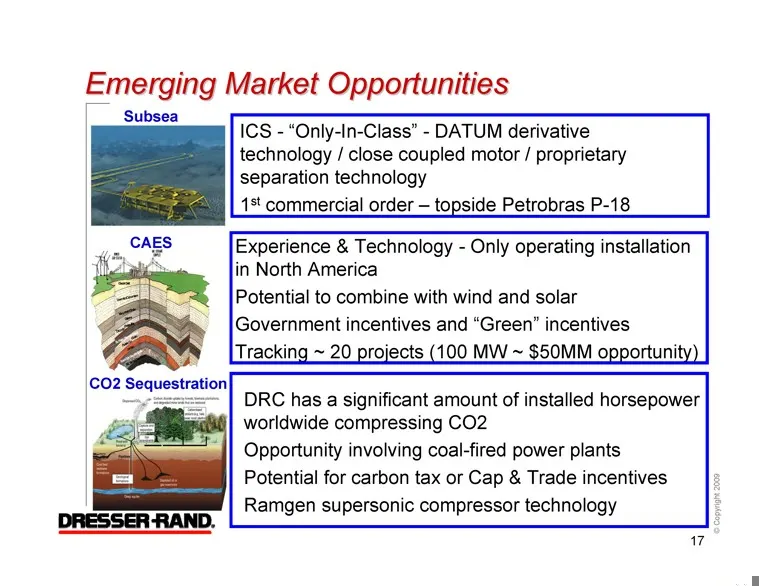
Emerging Market Opportunities ICS - “Only-In-Class” - DATUM derivative technology / close coupled motor / proprietary separation technology commercial order – topside Petrobras P-18 Subsea CAES CO2 Sequestration Experience & Technology - Only operating installation in North America Potential to comb
Slide 18: 2010 New Units Outlook
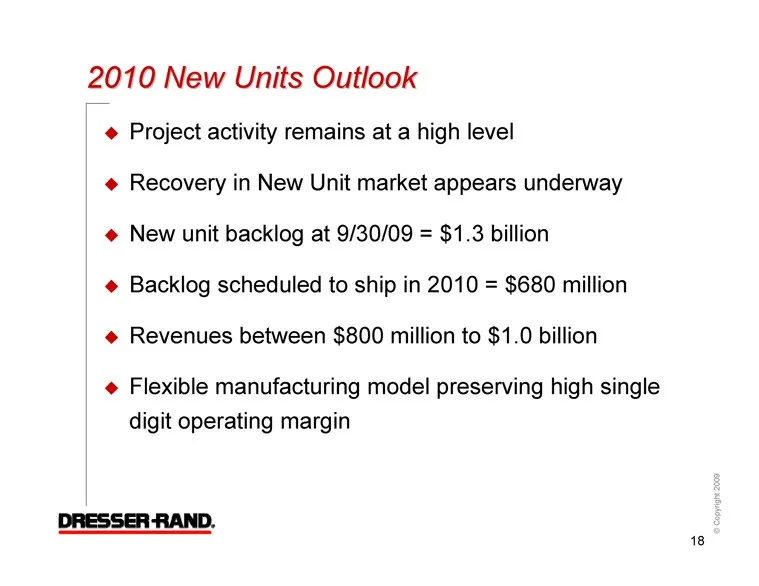
2010 New Units Outlook Project activity remains at a high level Recovery in New Unit market appears underway New unit backlog at 9/30/09 = $1.3 billion Backlog scheduled to ship in 2010 = $680 million Revenues between $800 million to $1.0 billion Flexible manufacturing model preserving high single d
Slide 19: Aftermarket Revenue Outlook
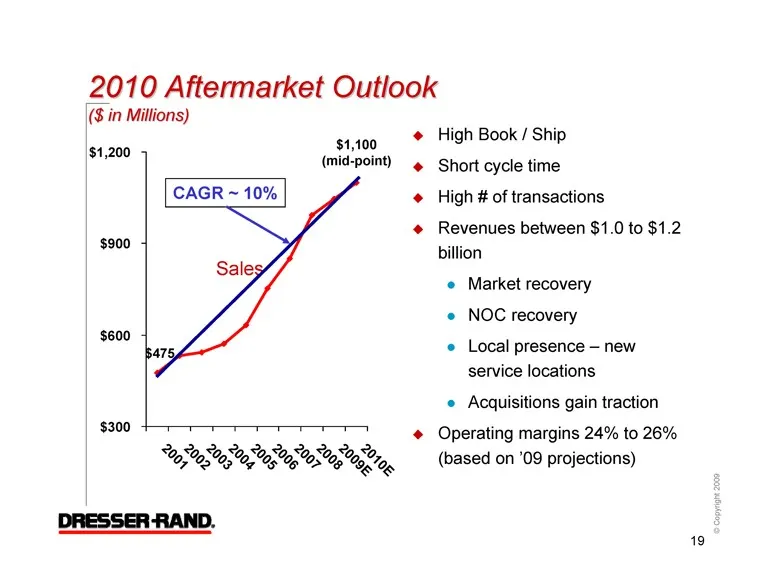
($ in Millions) CAGR ~ 10% Sales $1,100 (mid-point) $475 High Book / Ship Short cycle time High # of transactions Revenues between $1.0 to $1.2 billion Market recovery NOC recovery Local presence – new service locations Acquisitions gain traction $300 $600 $900 $1,200 19
Slide 20: 2010 Financial Guidance
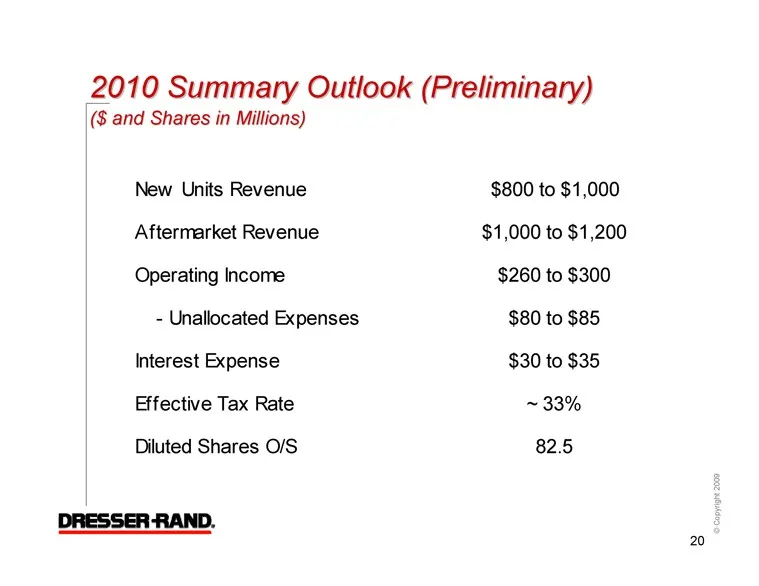
($ and Shares in Millions) New Units Revenue $800 to $1,000 Aftermarket Revenue $1,000 to $1,200 Operating Income $260 to $300 - Unallocated Expenses $80 to $85 Interest Expense $30 to $35 Effective Tax Rate ~ 33% Diluted Shares O/S 82.5 20
Slide 21: Summary
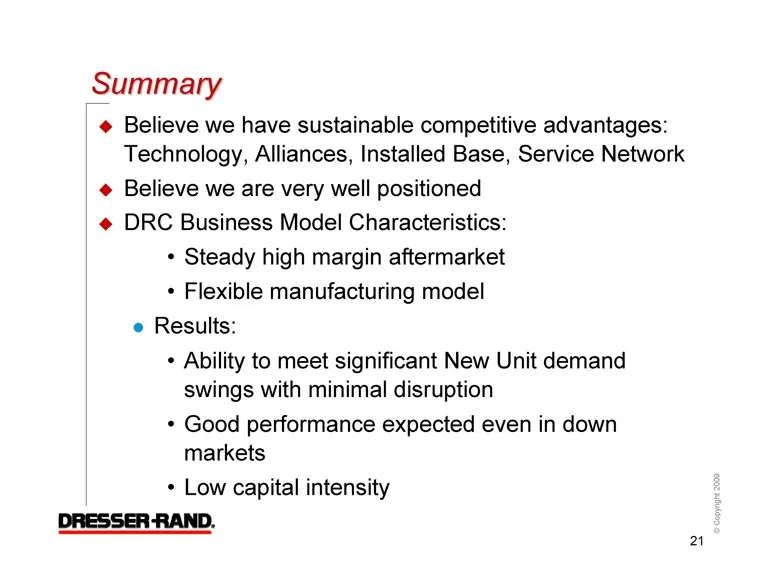
Summary Believe we have sustainable competitive advantages: Technology, Alliances, Installed Base, Service Network Believe we are very well positioned DRC Business Model Characteristics: Steady high margin aftermarket Flexible manufacturing model Results: Ability to meet significant New Unit demand
Slide 22: www.dresser-rand.com info@dresser-rand.com
www.dresser-rand.com info@dresser-rand.com
Source: SEC EDGAR · 8-K filed Jan 5, 2010
More decks from Dresser-Rand Group Inc
 Merger or Acquisition (September 2014)16 slides · Sep 23, 2014
 Merger or Acquisition (March 2011)32 slides · Mar 7, 2011
 Credit Suisse Energy Summit 201128 slides · Feb 7, 2011
 Investor Day (November 2010)111 slides · Nov 10, 2010
 Howard Weil 2010 Energy Conference24 slides · Mar 19, 2010
 Annual Small / Mid Cap Conference (November 2009)23 slides · Nov 19, 2009