Dresser-Rand — Credit Suisse Energy Summit 2011
28 slides from Dresser-Rand's conference presentation, Feb 7, 2011
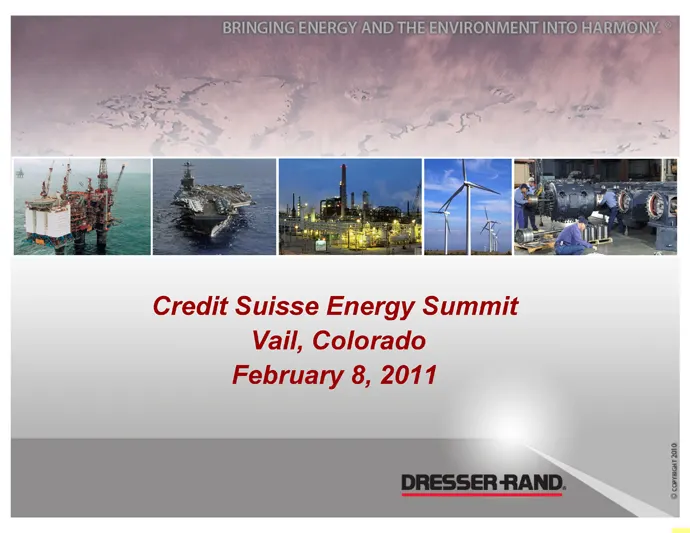
Slide 1: Credit Suisse Energy Summit
Credit Suisse Energy Summit Vail, Colorado February 8, 2011 ‘ocormanr210
Slide 2: Disclosure
= Disclosure The Private Securities Litigation Reform Act of 1995 provides a “safe harbor” for certain forward- looking statements so long as such information is identified as forward-looking and is accompanied by meaningful cautionary statements identifying important factors that could cause actual
Slide 3: Market Dynamics
= Market Dynamics @ We have taken a 20 year view of markets with the following expectations: Major growth in oil & gas will come from outside the US National Oil C ies will become it i promii in supply decisions The ability to provide goods and services locally will be critical There will be a growi
Slide 4: Dresser-Rand Investment Highlights
" Dresser-Rand Investment Highlights @ Well positioned to benefit from continuing energy infrastructure investment: Traditional oil & gas upstream and downstream growth opportunities Emerging market o i Ci iti / Growth « Technology / R&D Initiatives ° Alliances Installed Base e Service Network Infra
Slide 5: Global Supplier of Energy Infrastructure Solutions
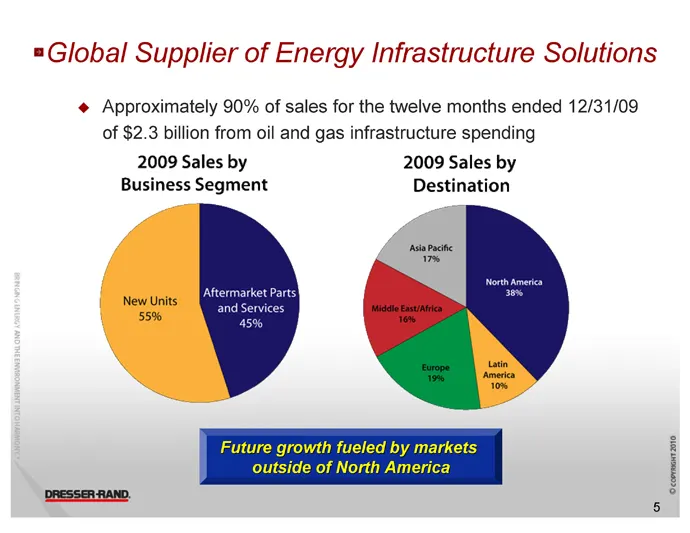
=Global Supplier of Energy Infrastructure Solutions Approximately 90% of sales for the twelve months ended 12/31/09 of $2.3 billion from oil and gas infrastructure spending 2009 Sales by 2009 Sales by Business Segment Destination
Slide 6: Energy Infrastructure Expansion
Energy Infrastructure Expansion
Slide 7: Upstream - FPSO/LNG
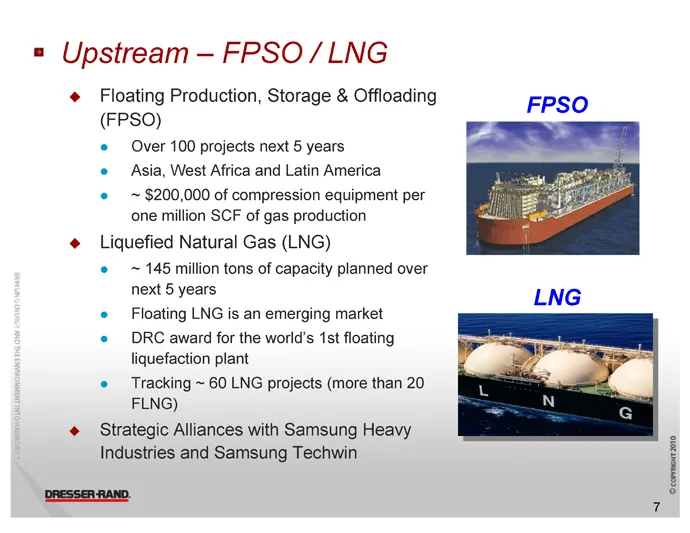
=» Upstream —-FPSO/LNG ° ° ° Floating Production, Storage & Offloading (FPSO) © Over 100 projects next 5 years e Asia, West Africa and Latin America © ~ $200,000 of compression equipment per one million SCF of gas production Liquefied Natural Gas (LNG) © ~ 145 million tons of capacity planned over n
Slide 8: Midstream - Pipelines & Storage
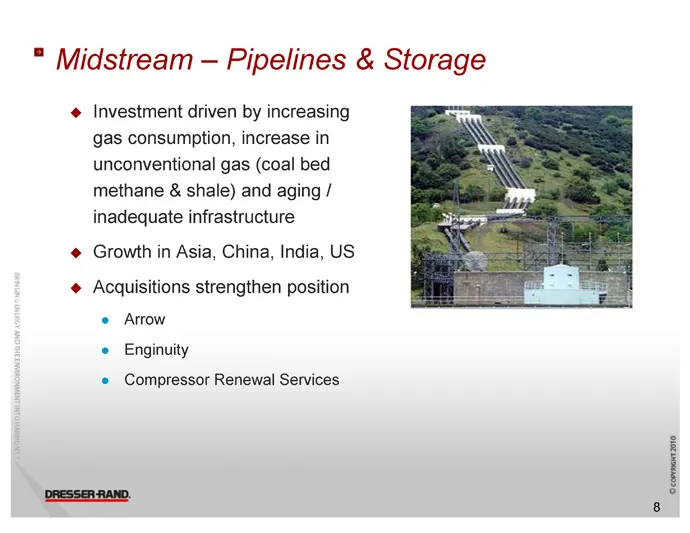
" Midstream — Pipelines & Storage Investment driven by increasing gas consumption, increase in unconventional gas (coal bed methane & shale) and aging / inadequate infrastructure @ Growth in Asia, China, India, US Acquisitions strengthen position © Arrow e Enginuity Compressor Renewal Services ‘ocee
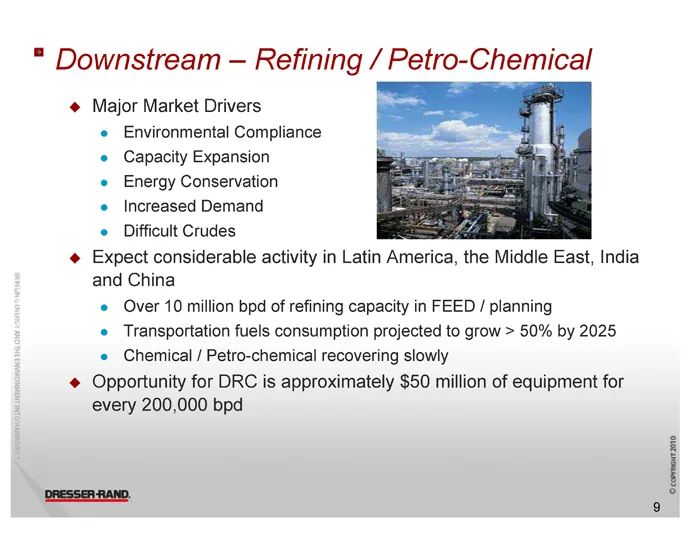
Slide 9: Downstream - Refining / Petro-Chemical
" Downstream — Refining / Petro-Chemical @ Major Market Drivers ° ° Environmental Compliance Capacity Expansion Energy Conservation Increased Demand Difficult Crudes Expect considerable activity in Latin America, the Middle East, India and China © Over 10 million bpd of refining capacity in FEED / p
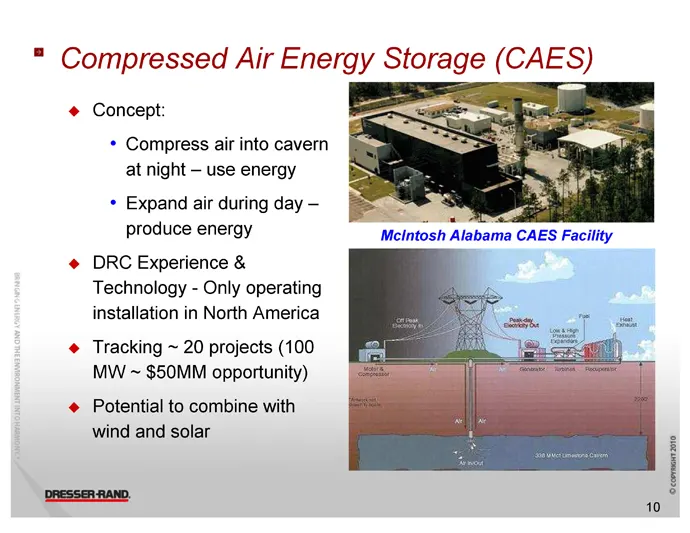
Slide 10: Compressed Air Energy Storage (CAES)
*" Compressed Air Energy =iO)H08 (CAES) Concept: * Compress air into cavern at night — use energy * Expand air during day — produce energy DRC Experience & Technology - Only operating installation in North America Tracking ~ 20 projects (100 MW ~ $50MM opportunity) Potential to combine with wind and
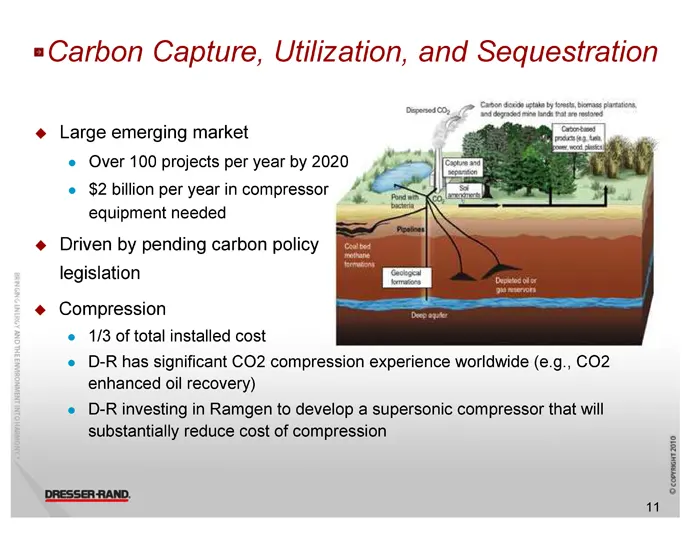
Slide 11: Carbon Capture, Utilization, and Sequestration
=Carbon Capture, Utilization, and Sequestration @ Large emerging market © Over 100 projects per year by 2020 © $2 billion per year in compressor equipment needed @ Driven by pending carbon policy legislation Compression 1/3 of total installed cost D-Rhas significant CO2 compression experience worldw
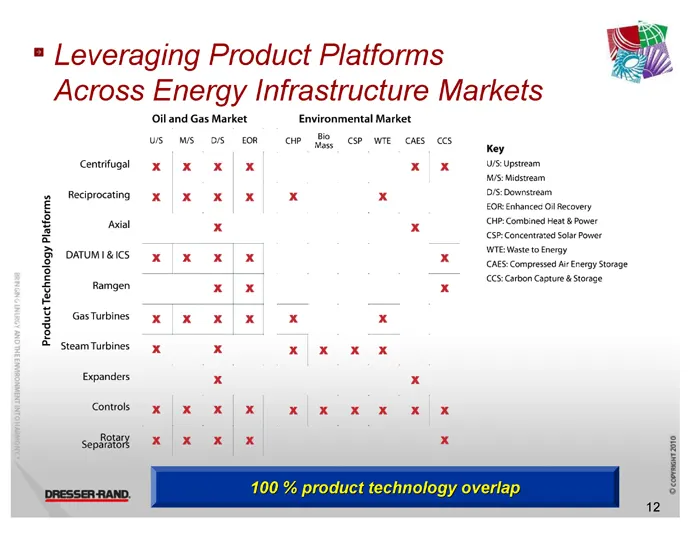
Slide 12: Leveraging Product Platforms Across Energy Infrastructure Markets
= Leveraging Product Platforms 3) Across Energy Infrastructure Markets il and Gas Market Environmental Market us Ms os con cw BS csp wie cats ccs oa Key Cenintogsl ox x x) x xx UUM ss:nesoeam Reciprocating x xX XK xX x x eu é for tance OF corey 5 ‘ct Chr combined eat Pones 2 x x CSP: Concentrated So
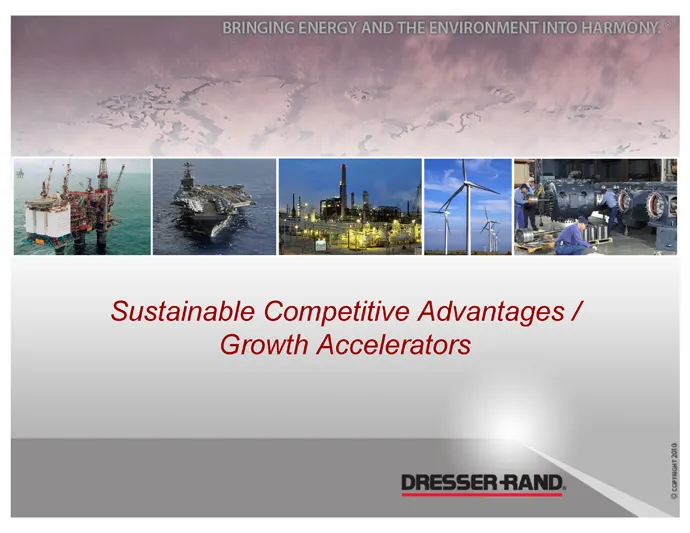
Slide 13: Sustainable Competitive Advantages / Growth Accelerators
Sustainable Competitive Advantages / Growth Accelerators
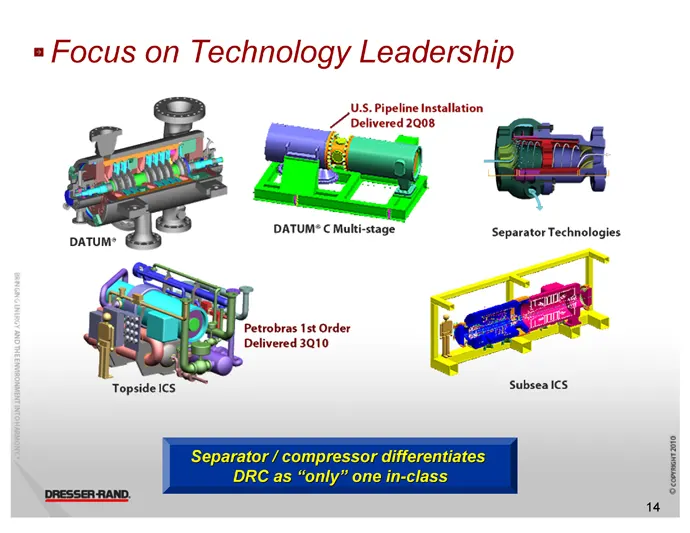
Slide 14: Focus on Technology Leadership
= Focus on Technology Leadership US. Pipeline installation / Delivered 2008 ee DATUM CMuli-stage Separator Technologies DATUM* ara 9 Petrobras 1st Order Delivered 3010 Subsea ICS Topside Ics cco 019
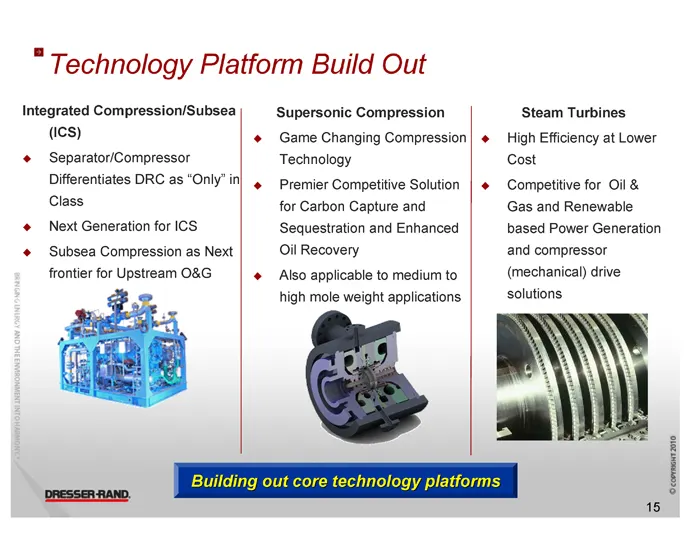
Slide 15: Technology Platform Build Out
"Technology Platform Build Out Integrated i Supersonic (ics) Game Changing Compression | + ‘@ Separator/Compressor Technology . . Differentiates DRC as “Only” in] Class Next Generation for ICS Subsea Compression as Next frontier for Upstream O&G . Premier Competitive Solution | « for Carbon Capture
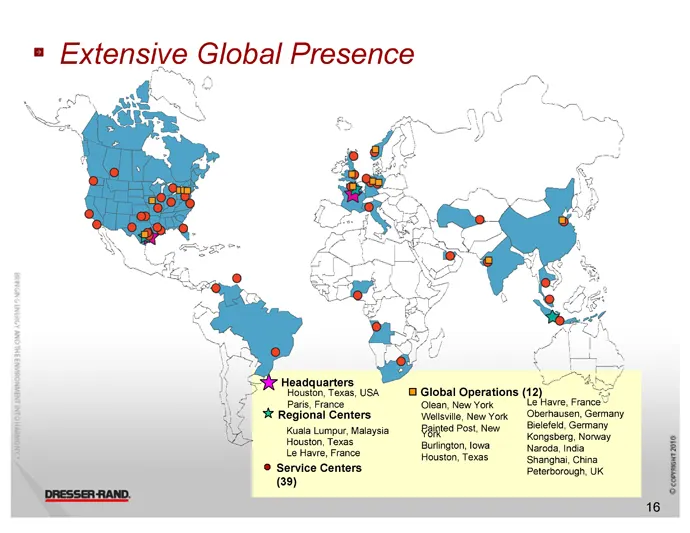
Slide 16: Extensive Global Presence
. Extensive Cicaal Presence } ¥.... % — nore “ tomonteae
Slide 17: Infrastructure Initiatives
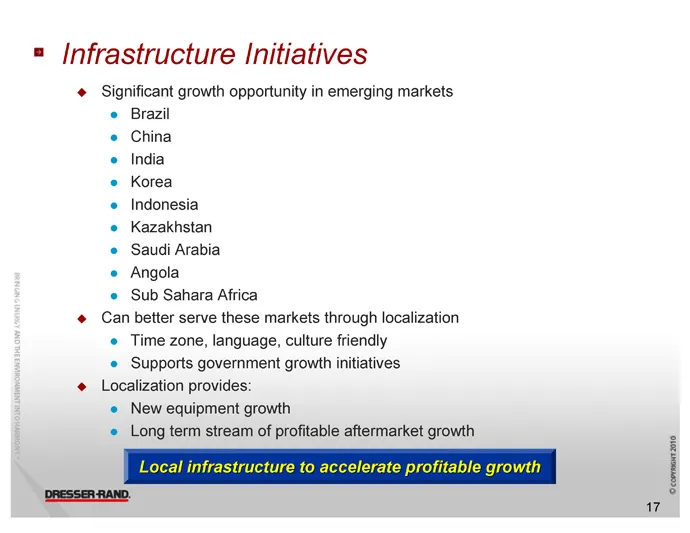
Infrastructure Initiatives Significant growth opportunity in emerging markets Brazil China India Korea Indonesia Kazakhstan Saudi Arabia Angola ‘Sub Sahara Africa Can better serve these markets through localization Time zone, language, culture friendly ‘Supports government growth initiatives ¢ Local
Slide 18: Unique Business Model Characteristics
Unique Business Model Characteristics
Slide 19: Unique Business Model Characteristics
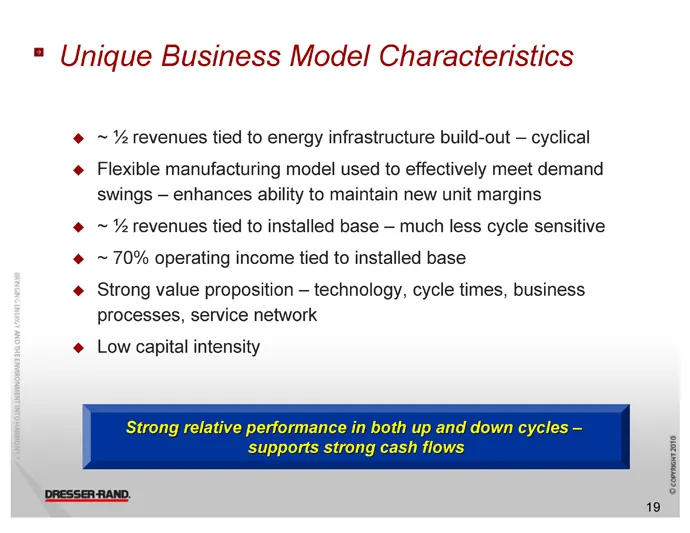
=" Unique Business Model Characteristics ° ° oo ° ~ % revenues tied to energy infrastructure build-out — cyclical Flexible manufacturing model used to effectively meet demand swings — enhances ability to maintain new unit margins ~ % revenues tied to installed base — much less cycle sensitive ~ 70%
Slide 20: Increase Operating Income
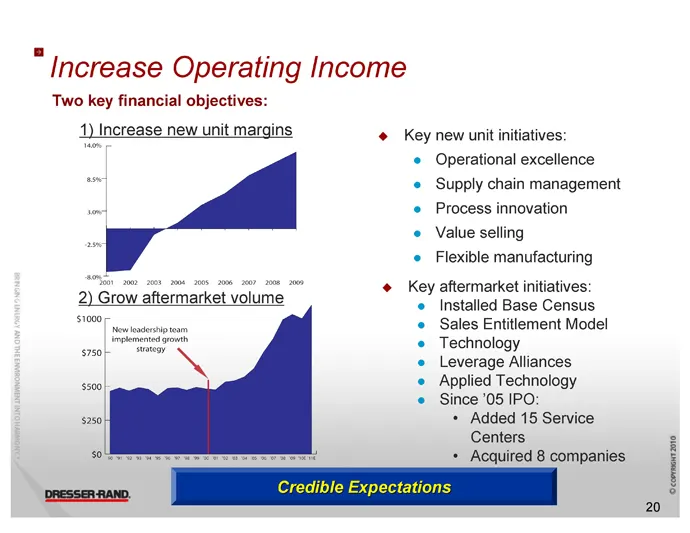
. . Increase Operating Income Two key financial objectives: 1) Increase new unit margins Key new unit initiatives: _ © Operational excellence © Supply chain management © Process innovation * Value selling e Flexible manufacturing ° Key aftermarket initiatives: © Installed Base Census selenite © Sale
Slide 21: Low Capital Intensity
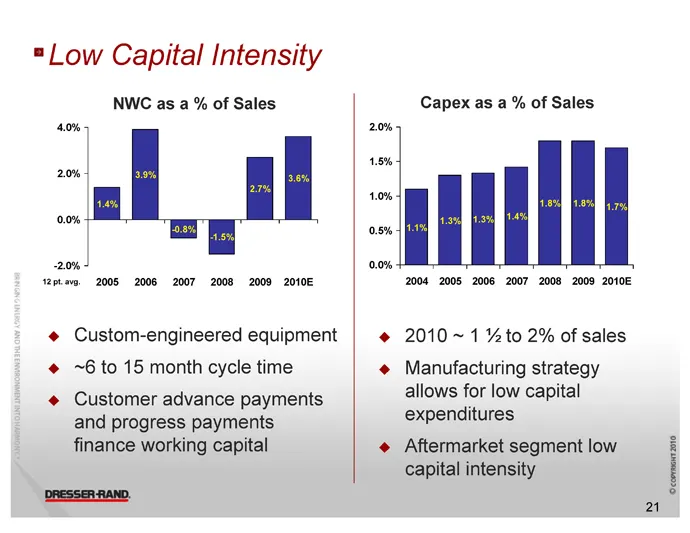
=Low Capital Intensity NWC as a % of Sales 0%! vaptave. 2005 2008 2007 2008 2009 2010, ¢ Custom-engineered equipment @ ~6 to 15 month cycle time ¢ Customer advance payments and progress payments finance working capital ° ° Capex as a % of Sales 2004 2005 2006 2007 2008 2009 20108 2010 ~ 1 %to 2% of
Slide 22: Result - Significant Free Cash Flow
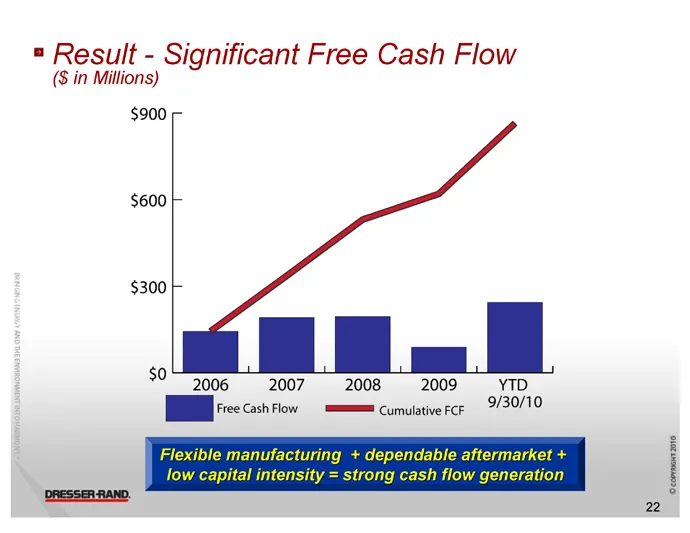
® Result - Significant Free Cash Flow ($ in Millions) $900 so 2006 2007 2008 2009 Free Cash Flow EN Cumulative FCF YTD 9/30/10
Slide 23: Under-leveraged Balance Sheet
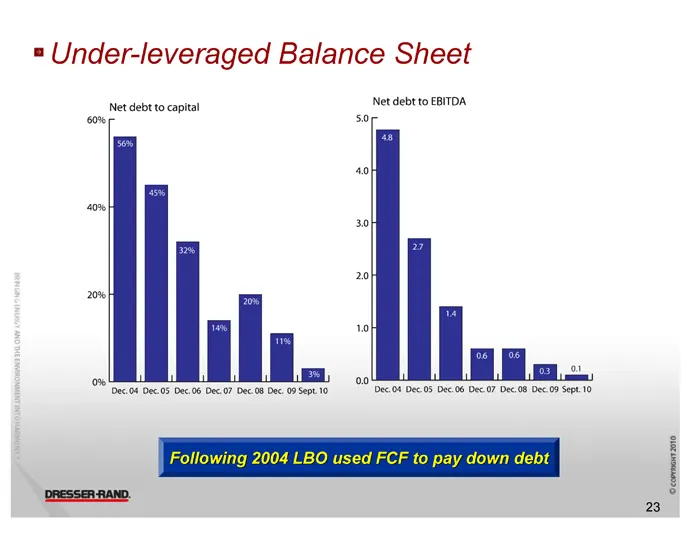
= Under-leveraged Balance Sheet Net debs to capital 60% on 'ec.0f 06.05 Dec 06 D507 Dec 08 Dec 09 Sep. 10 [Net debt to EBITDA or 00! ee 04 Dee. 05 Dee 06 Ose. 07 Dee.08 Dee. 09 Sept. 10
Slide 24: Internal Uses of Cash - 2011 through 2013
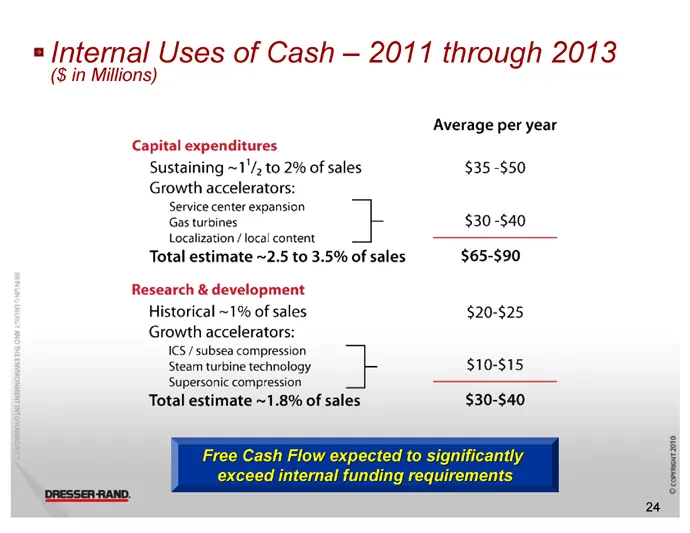
= /nternal Uses of Cash — 2011 through 2013 ($ in Millions) Average per year Capital expenditures Sustaining ~1'/, to 2% of sales $35 -$50 Growth accelerators: Service center expansion Gas turbines $30 -$40 Localization / local content ——— Total estimate ~2.5 to 3.5% of sales $65-$90 Research & deve
Slide 25: Business Results
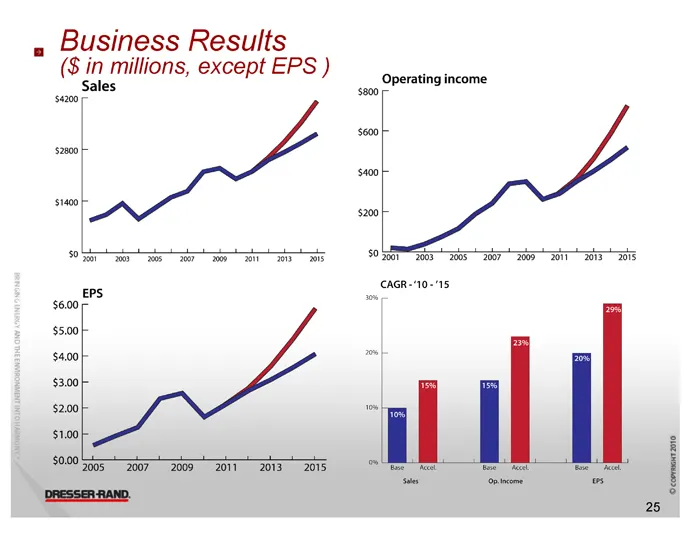
2 Business Results ($ in millions, except EPS ) Operating income Sales 000 $600 2300 400 400 $200 cAGR-"10-"15 EPS wos 3600 $5.00 $400 eI $3.00 $200 ms $1.00 $0.00 5095-2007 2009-2017 —=2013.—2075 oe ke Poe te om
Slide 26: Cumulative Total Shareholder Return
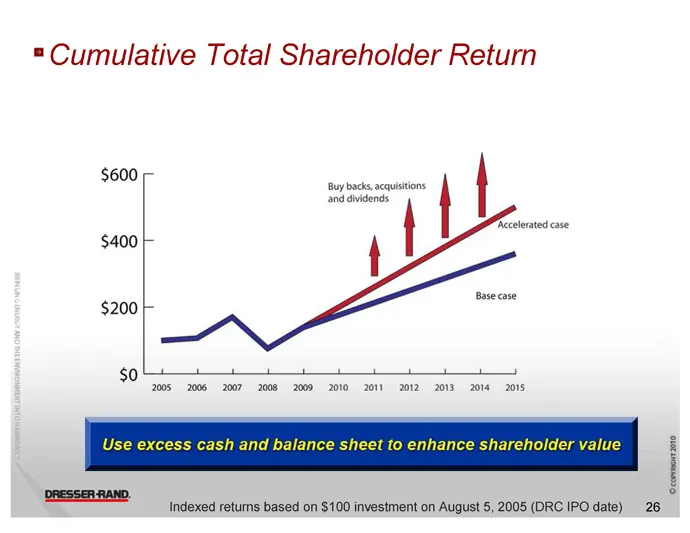
= Cumulative Total Shareholder Return $600 | Buy backs, acquisitions and dividends | Recelerated case $400 f Base case $200 $0 2005 2008 2007 200820092010 2011. 2012-2013 «20142015 Indexed August 5, 2005 (DRC IPO date) 26 ‘oceermac 210
Slide 27: Conclusion
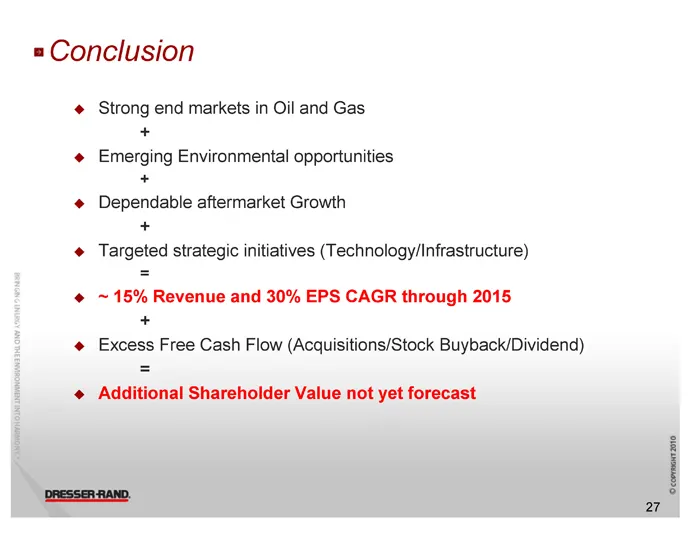
= Conclusion Strong end markets in Oil and Gas + Emerging Environmental opportunities + ° Dependable aftermarket Growth + Targeted strategic initiatives (Technology/Infrastructure) ° ° ~ 15% Revenue and 30% EPS CAGR through 2015 + Excess Free Cash Flow (Acquisitions/Stock Buyback/Dividend) ° ional S
Slide 28: www.dresser-rand.com info@dresser-rand.com
www.dresser-rand.com info@dresser-rand.com
Source: SEC EDGAR · 8-K filed Feb 7, 2011
More decks from Dresser-Rand Group Inc
 Merger or Acquisition (September 2014)16 slides · Sep 23, 2014
 Merger or Acquisition (March 2011)32 slides · Mar 7, 2011
 Investor Day (November 2010)111 slides · Nov 10, 2010
 Howard Weil 2010 Energy Conference24 slides · Mar 19, 2010
 Pritchard Capital Partners – Energize 201022 slides · Jan 5, 2010
 Annual Small / Mid Cap Conference (November 2009)23 slides · Nov 19, 2009