Hamborner REIT AG · XETR:HABA
Hamborner REIT — IPO Roadshow (July 2012)
43 slides from Hamborner REIT's IPO roadshow presentation, July 2012
Slide 1: Roadshow Presentation
Roadshow Presentation July 2012
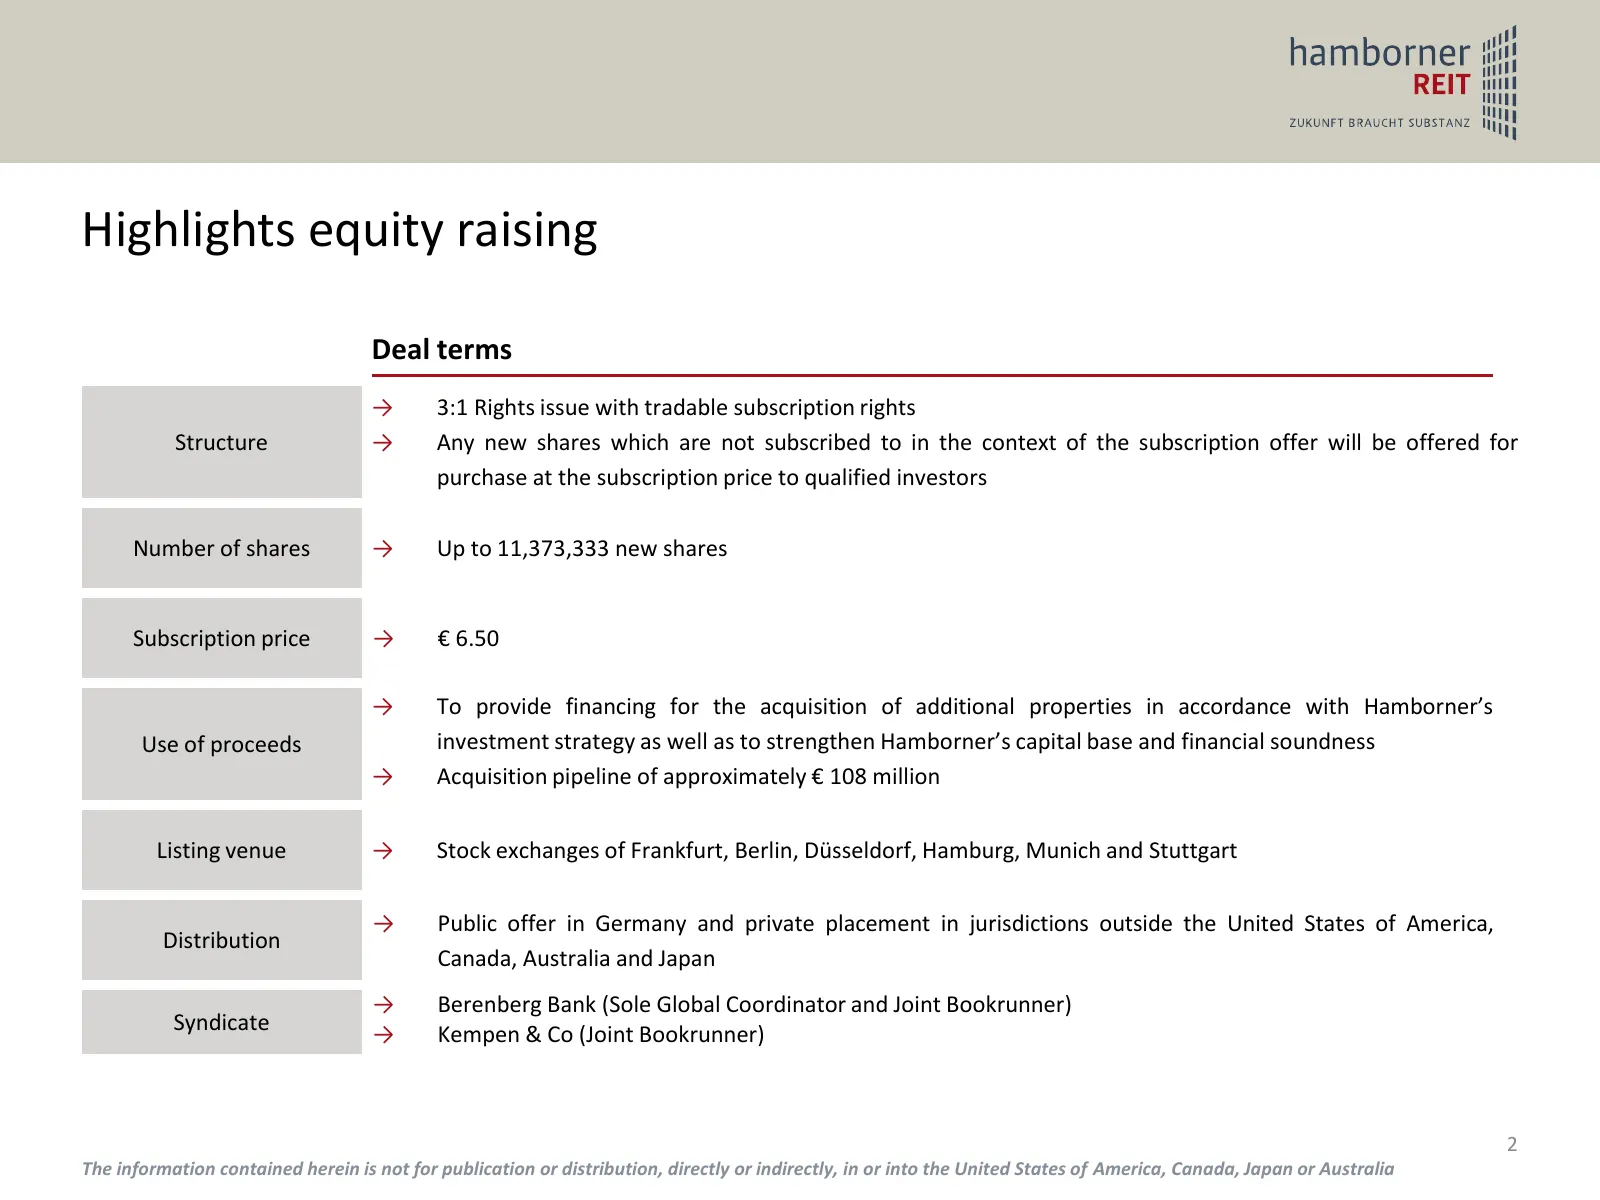
Slide 2: Highlights equity raising
Highlights equity raising Deal terms → 3:1 Rights issue with tradable subscription rights Structure → Any new shares which are not subscribed to in the context of the subscription offer will be offered for purchase at the subscription price to qualified investors Number of shares → Up to 11,373,333
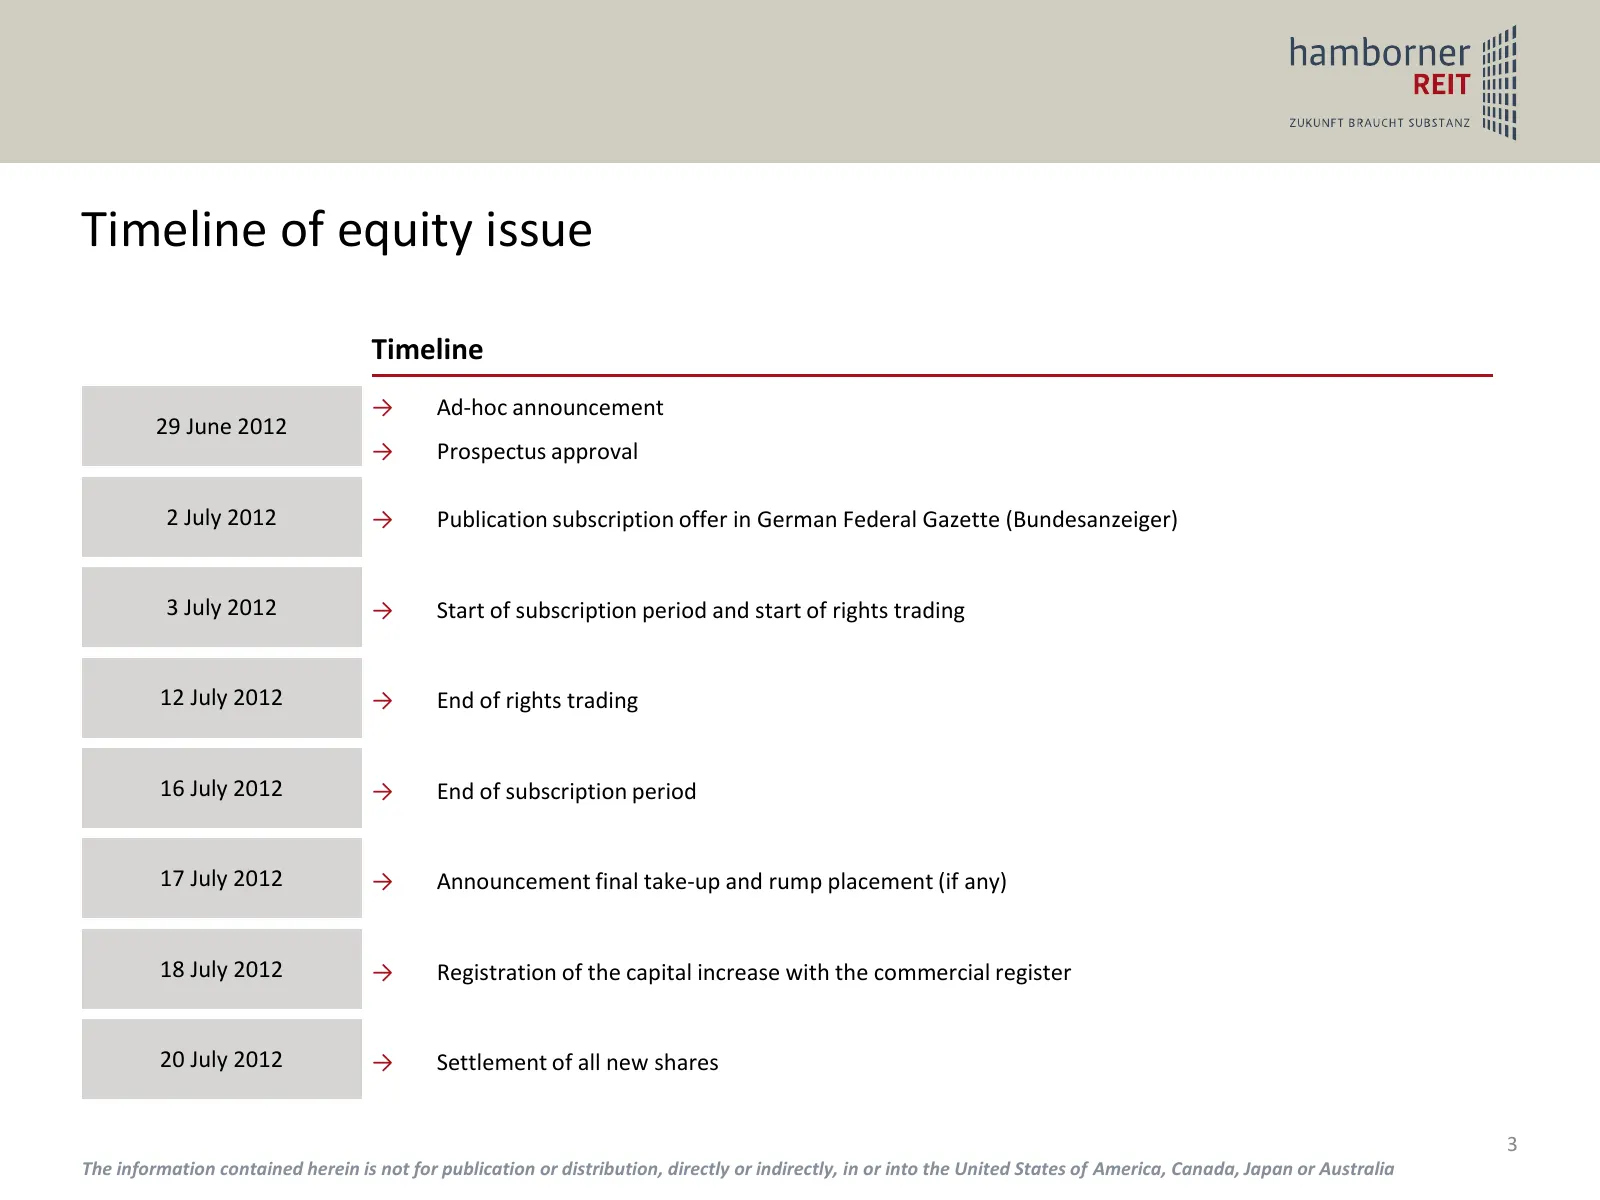
Slide 3: Timeline of equity issue
Timeline of equity issue Timeline → Ad-hoc announcement 29 June 2012 → Prospectus approval 2 July 2012 → Publication subscription offer in German Federal Gazette (Bundesanzeiger) 3 July 2012 → Start of subscription period and start of rights trading 12 July 2012 → End of rights trading 16 July 2012
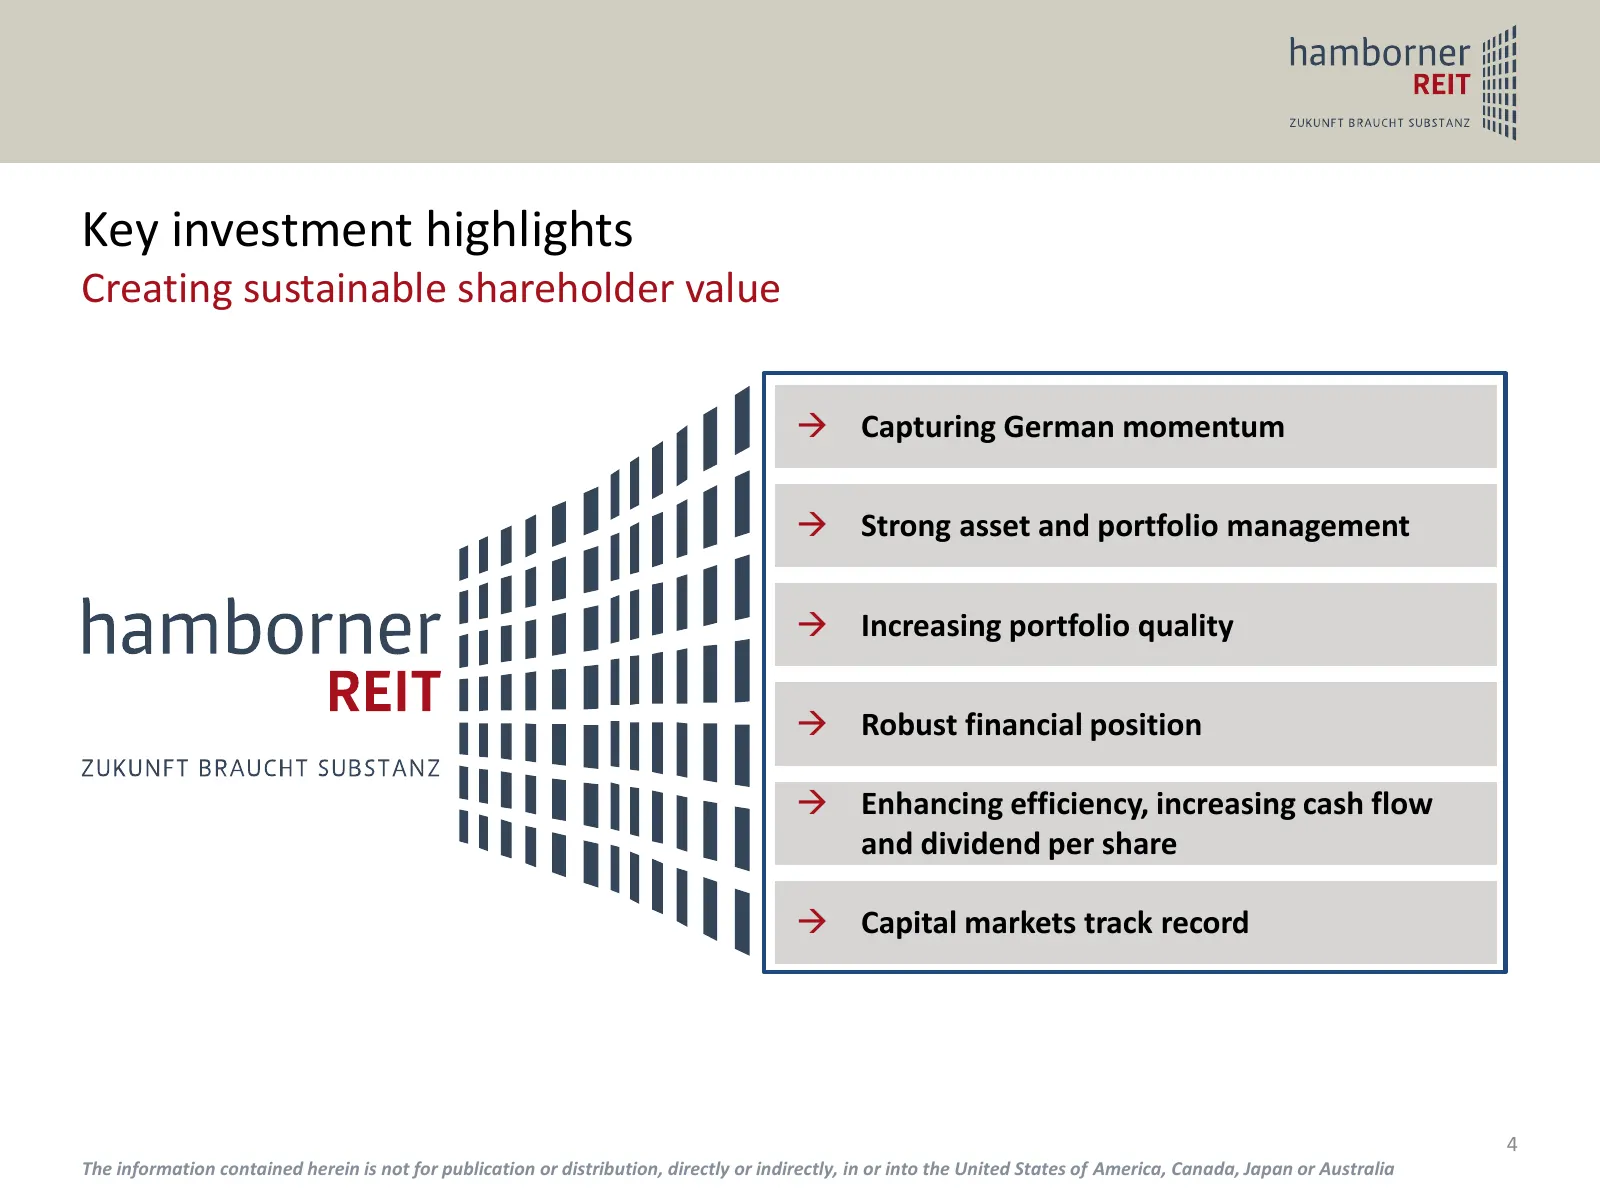
Slide 4: Key investment highlights
Key investment highlights Creating sustainable shareholder value Capturing German momentum Strong asset and portfolio management Increasing portfolio quality Robust financial position Enhancing efficiency, increasing cash flow and dividend per share Capital markets track record 4 The inf
Slide 5: Agenda
Agenda 1 Capturing German momentum 2 Increasing portfolio quality 3 Strong asset and portfolio management 4 Robust financial position 5 Enhancing efficiency, increasing cash flow and dividend per share 6 Capital markets track record 7 Outlook 8 Appendix 5 The information contained herein is not for
Slide 6: Well positioned to capture positive German momentum
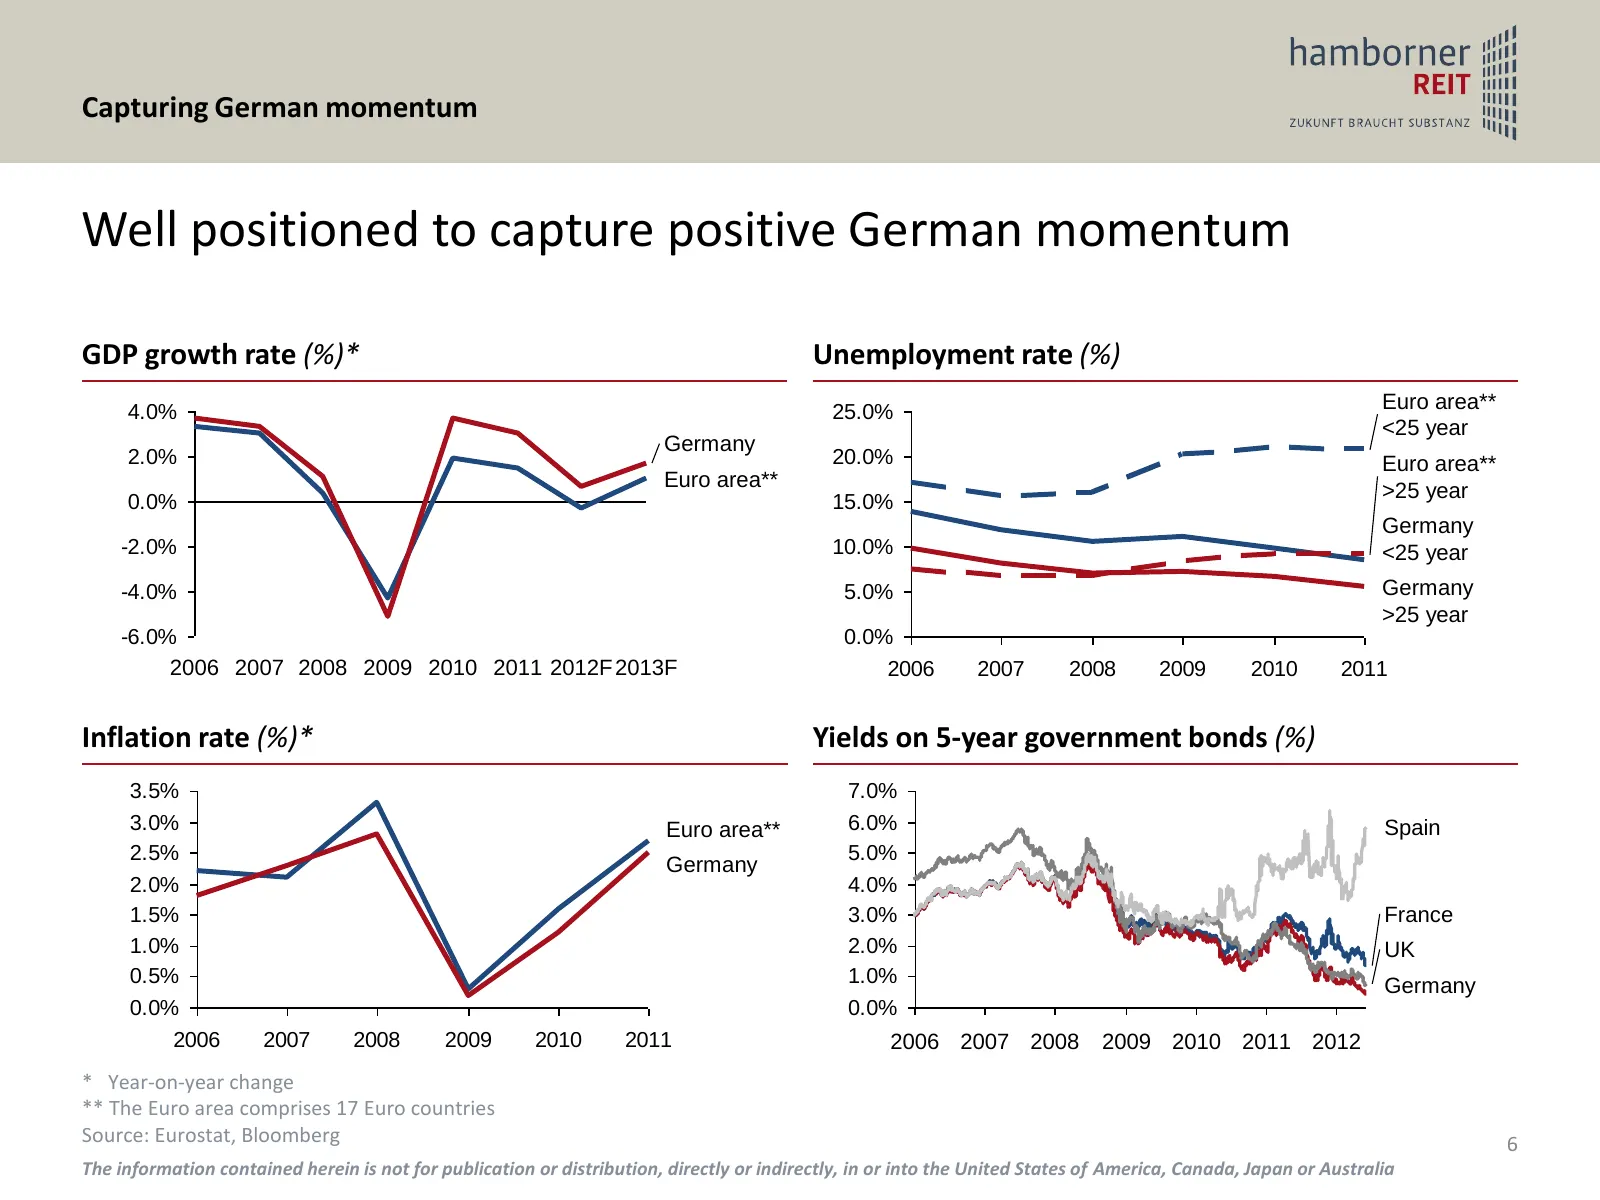
Capturing German momentum Well positioned to capture positive German momentum GDP growth rate (%)* Unemployment rate (%) 4.0% 25.0% Euro area** <25 year Germany 2.0% 20.0% Euro area** Euro area** >25 year 0.0% 15.0% Germany -2.0% 10.0% <25 year -4.0% 5.0% Germany >25 year -6.0% 0.0% 2006 2007 2008 2
Slide 7: Agenda
Agenda 1 Capturing German momentum 2 Increasing portfolio quality 3 Strong asset and portfolio management 4 Robust financial position 5 Enhancing efficiency, increasing cash flow and dividend per share 6 Capital markets track record 7 Outlook 8 Appendix 7 The information contained herein is not for
Slide 8: Balanced portfolio with 100% German focus
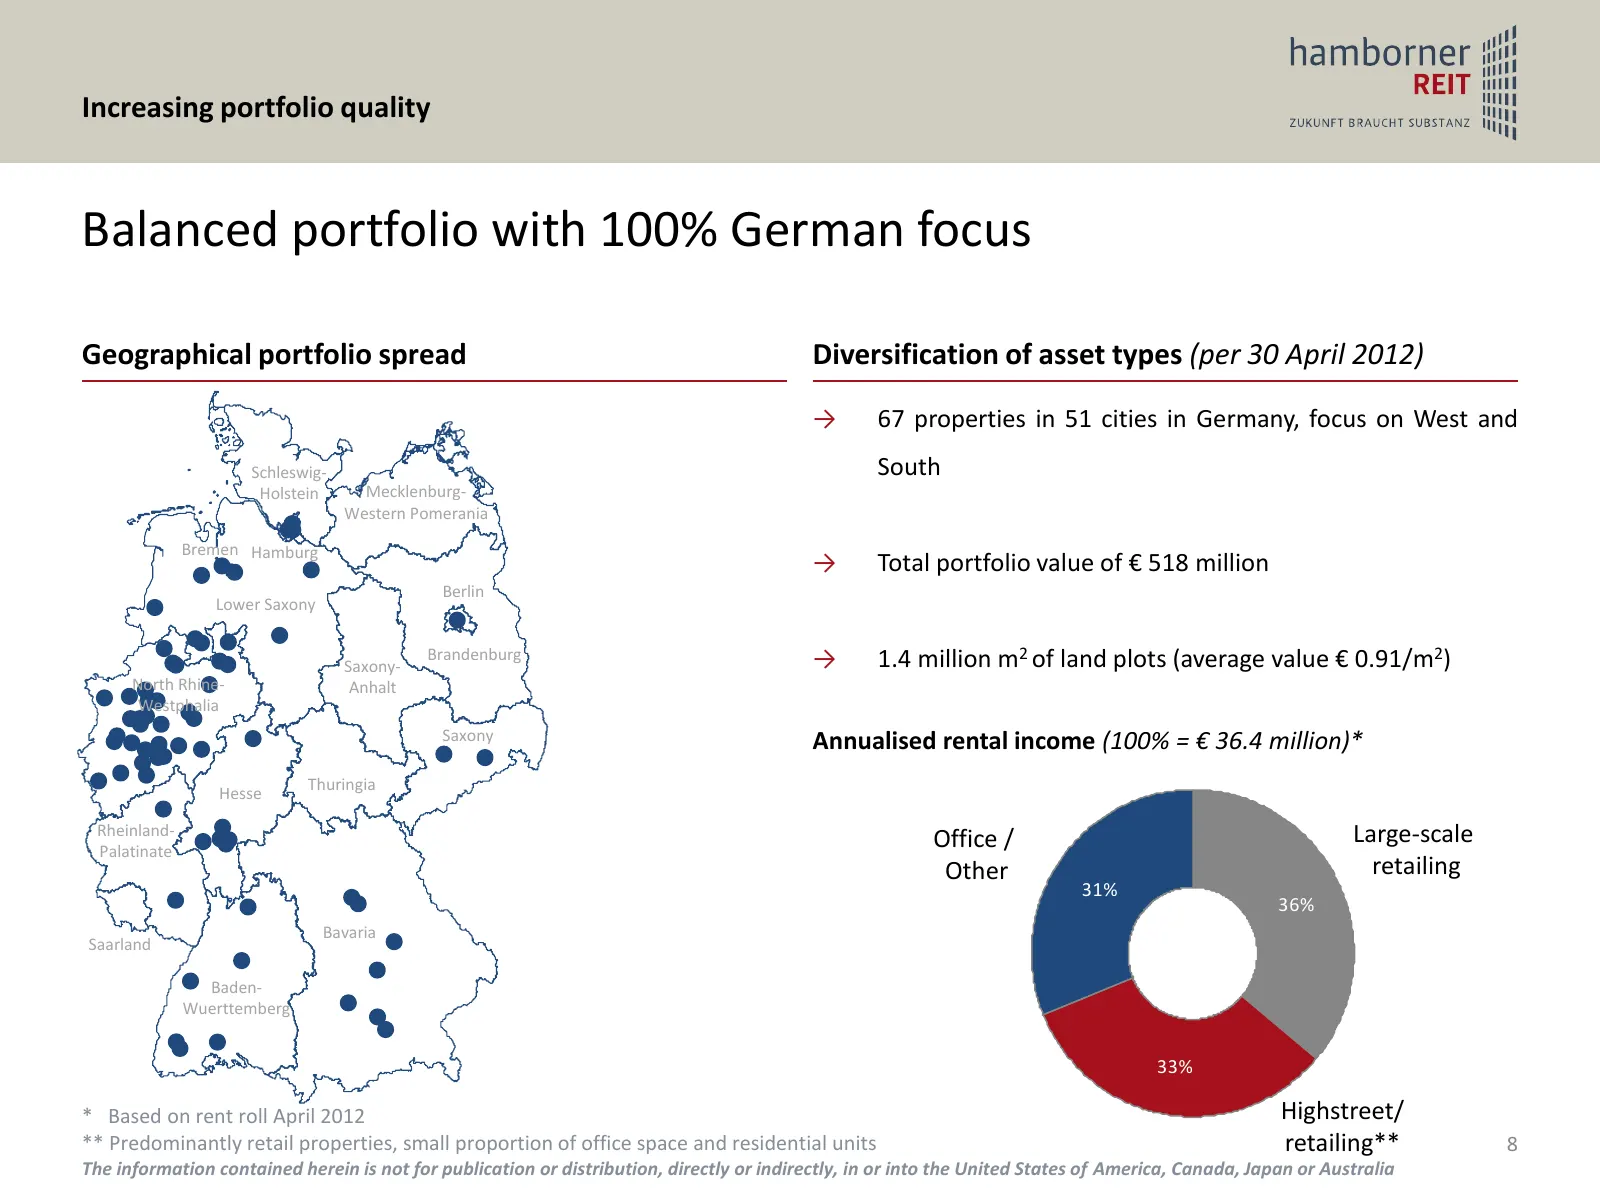
Increasing portfolio quality Balanced portfolio with 100% German focus Geographical portfolio spread Diversification of asset types (per 30 April 2012) → 67 properties in 51 cities in Germany, focus on West and Schleswig- South Holstein Mecklenburg- Western Pomerania Bremen Hamburg → Total portfolio
Slide 9: Well defined acquisition strategy
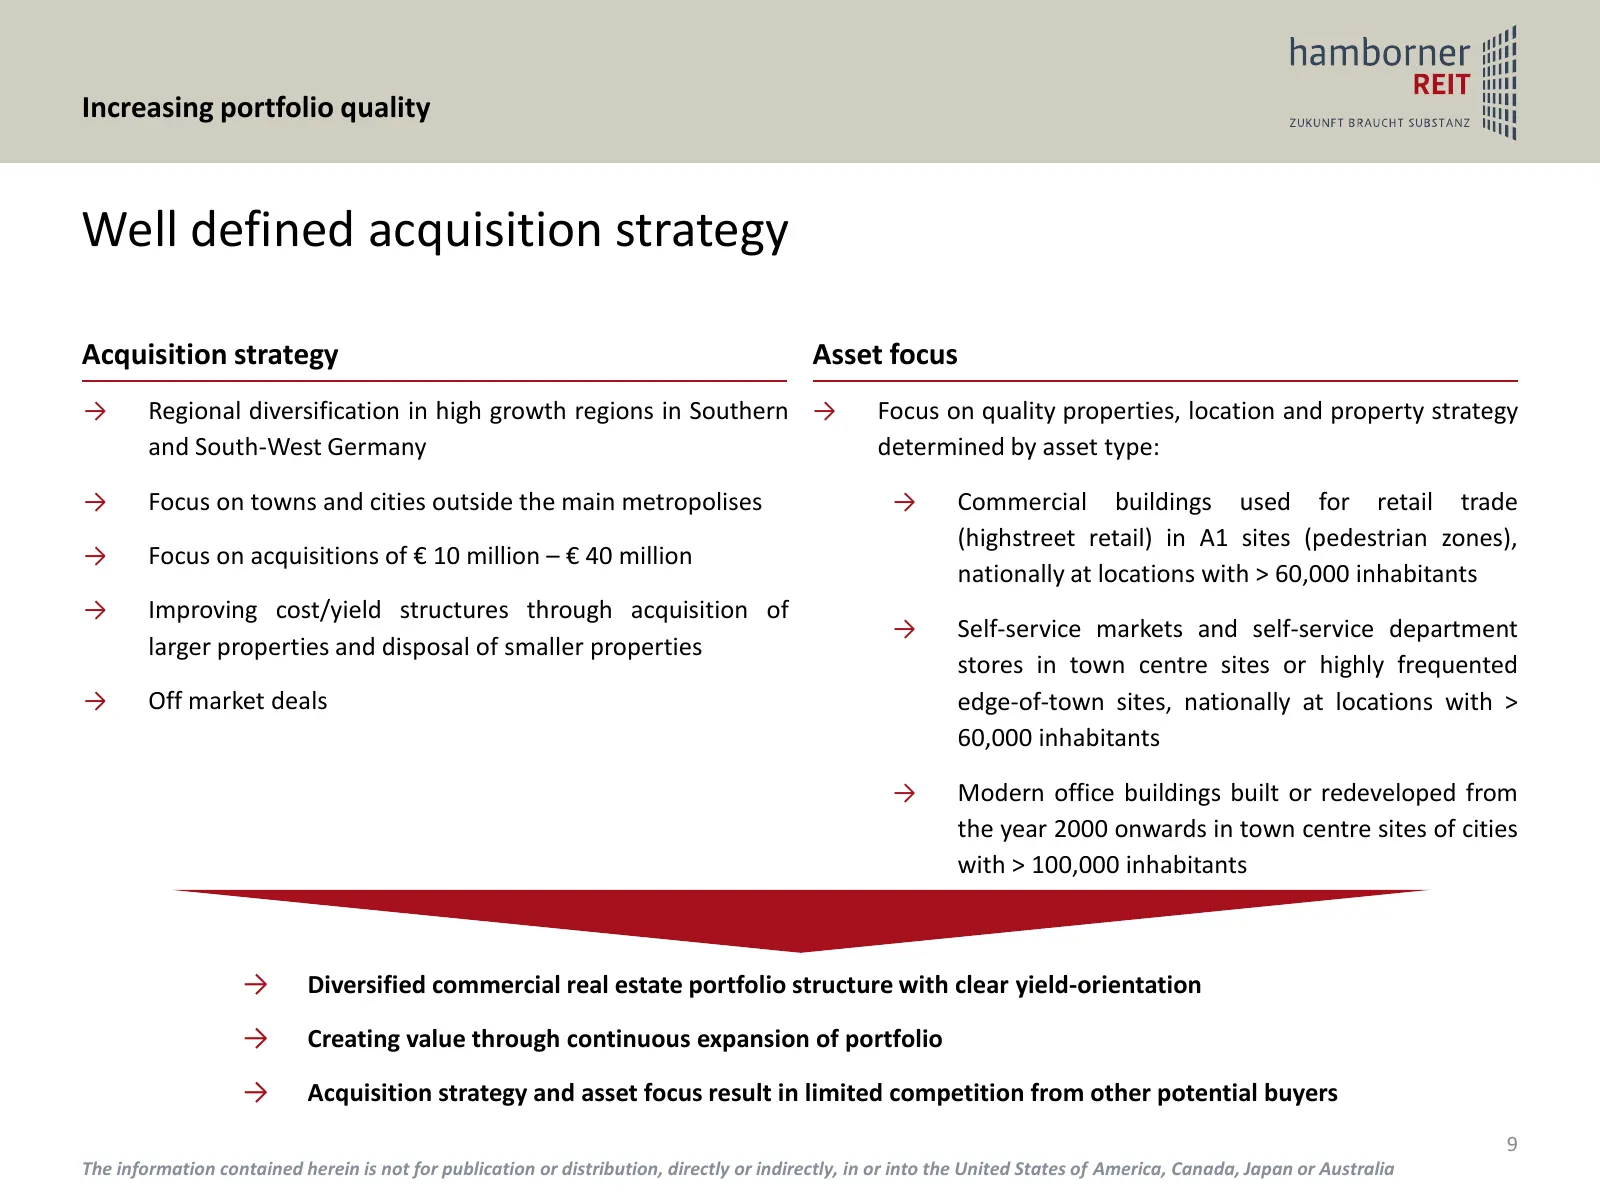
Increasing portfolio quality Well defined acquisition strategy Acquisition strategy Asset focus → Regional diversification in high growth regions in Southern → Focus on quality properties, location and property strategy and South-West Germany determined by asset type: → Focus on towns and cities out
Slide 10: Acquisition pipeline
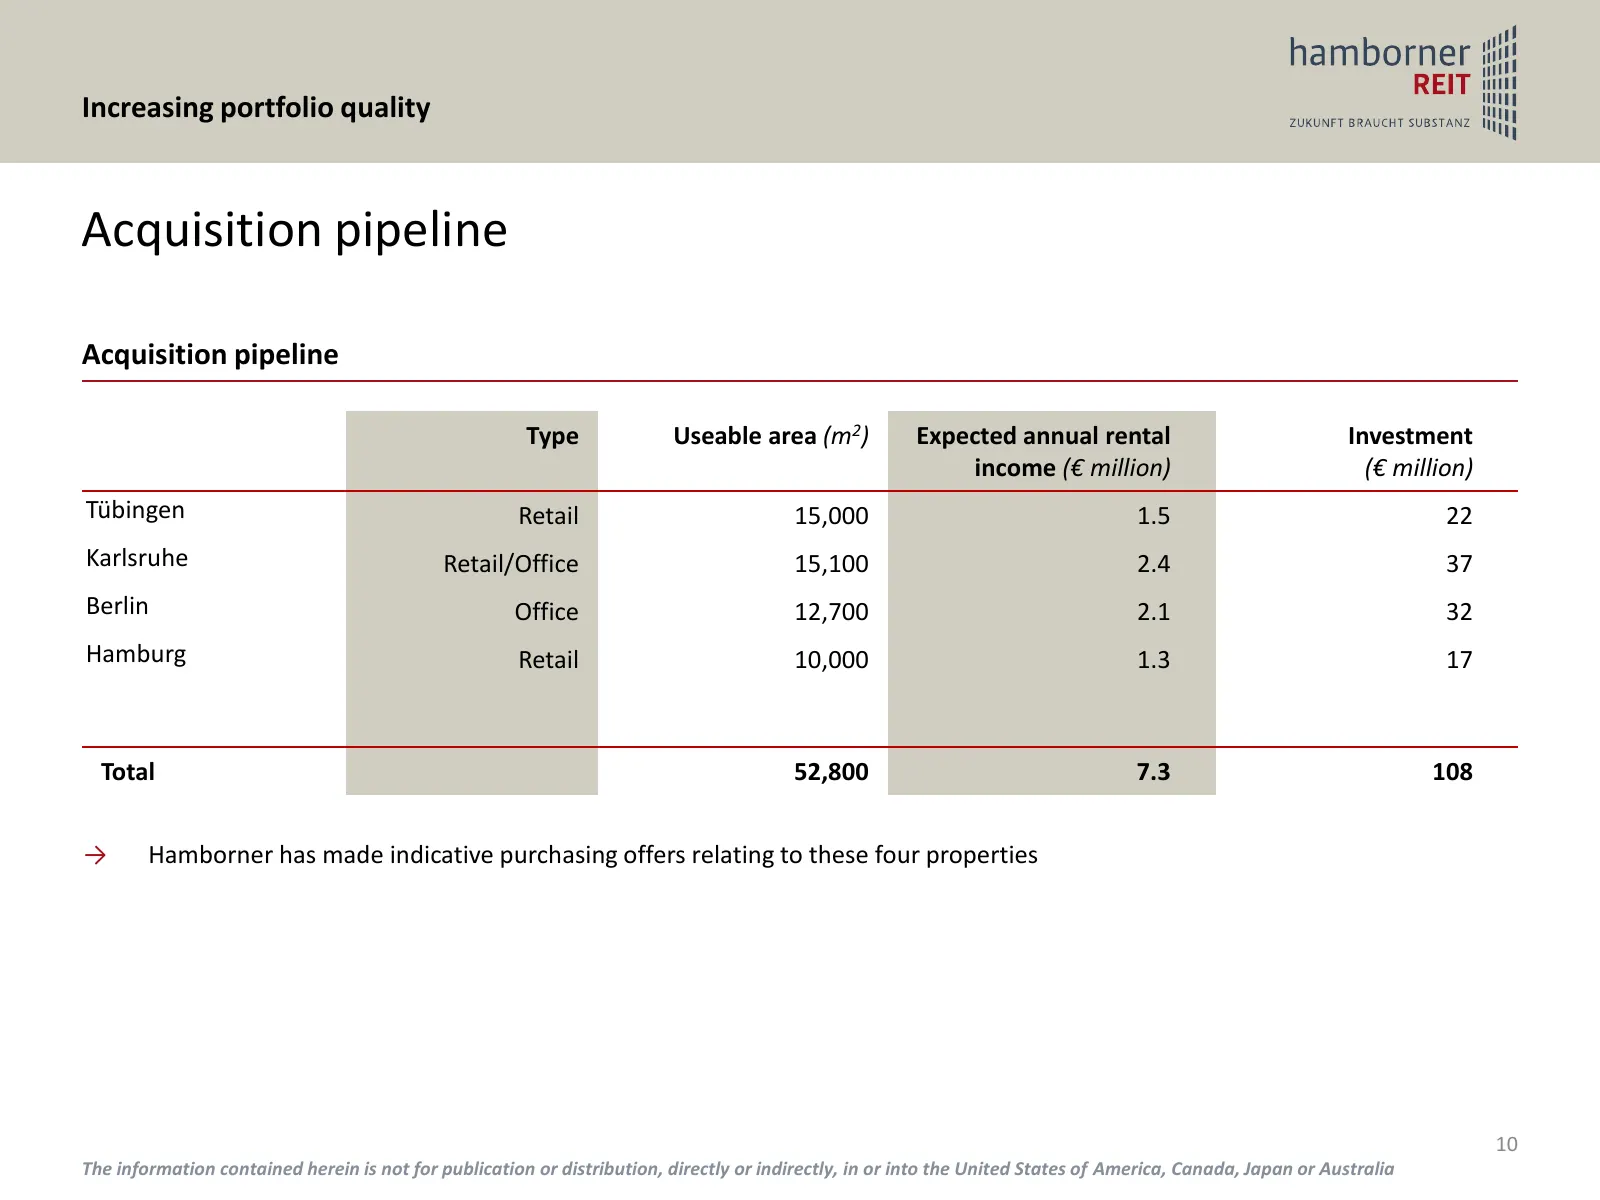
Increasing portfolio quality Acquisition pipeline Acquisition pipeline Type Useable area (m2) Expected annual rental Investment income (€ million) (€ million) Tübingen Retail 15,000 1.5 22 Karlsruhe Retail/Office 15,100 2.4 37 Berlin Office 12,700 2.1 32 Hamburg Retail 10,000 1.3 17 Total 52,800 7.3
Slide 11: Increasing regional diversification
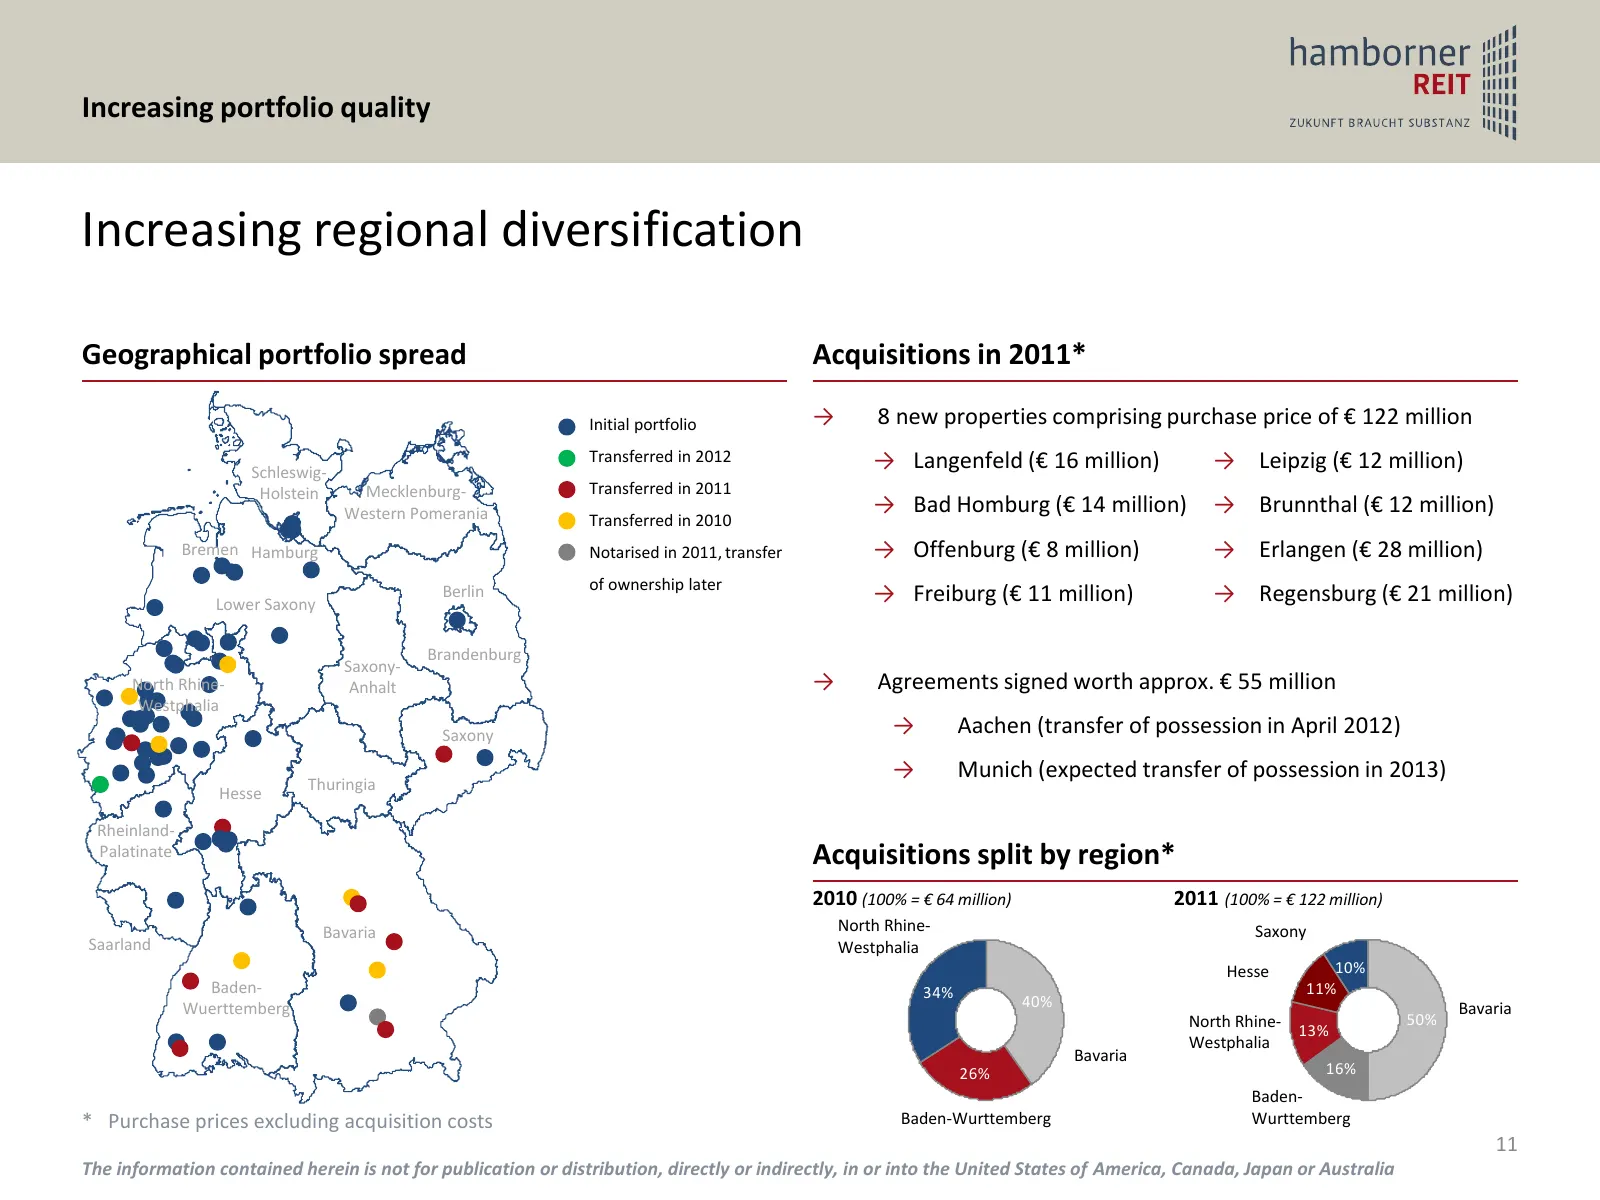
Increasing portfolio quality Increasing regional diversification Geographical portfolio spread Acquisitions in 2011* Initial portfolio → 8 new properties comprising purchase price of € 122 million Transferred in 2012 → Langenfeld (€ 16 million) → Leipzig (€ 12 million) Schleswig- Holstein Mecklenbur
Slide 12: Improving margin through acquiring larger portfolios
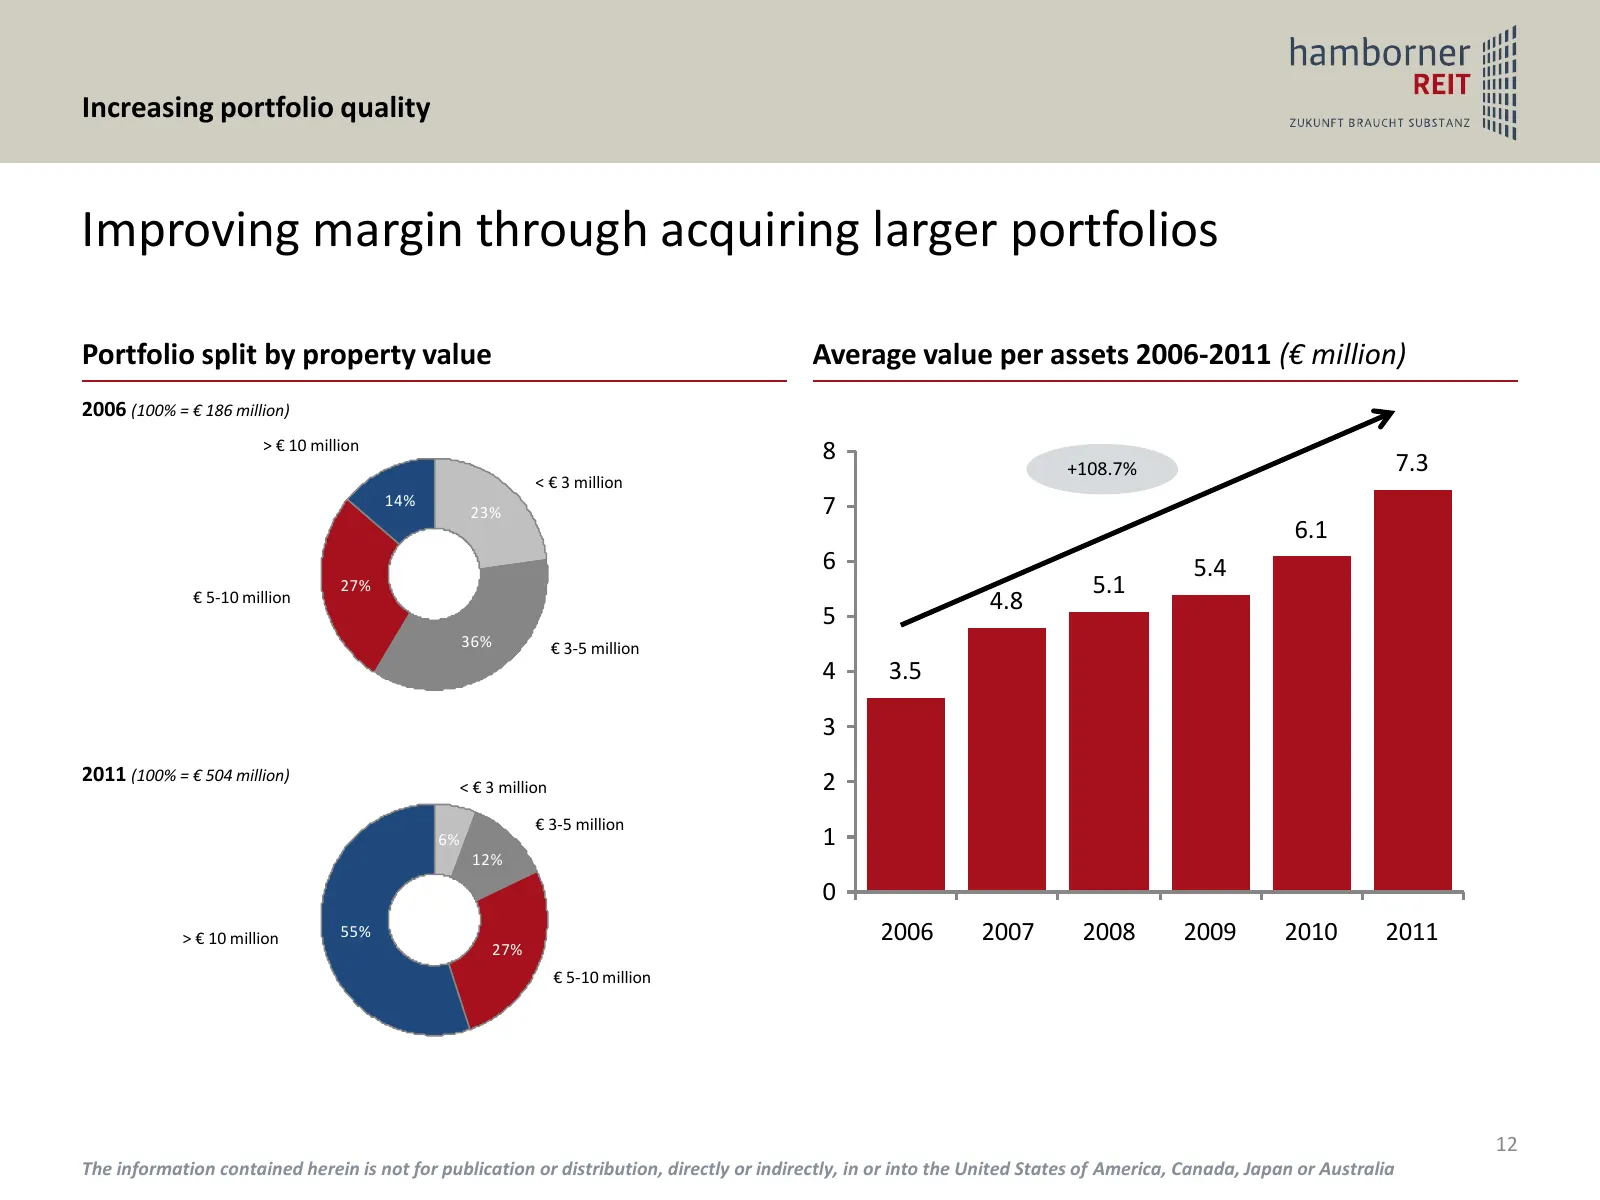
Increasing portfolio quality Improving margin through acquiring larger portfolios Portfolio split by property value Average value per assets 2006-2011 (€ million) 2006 (100% = € 186 million) > € 10 million 8 +108.7% 7.3 < € 3 million 14% 7 23% 6.1 6 5.4 27% 5.1 € 5-10 million 4.8 5 36% € 3-5 million
Slide 13: Agenda
Agenda 1 Capturing German momentum 2 Increasing portfolio quality 3 Strong asset and portfolio management 4 Robust financial position 5 Enhancing efficiency, increasing cash flow and dividend per share 6 Capital markets track record 7 Outlook 8 Appendix 13 The information contained herein is not for
Slide 14: High and stable occupancy
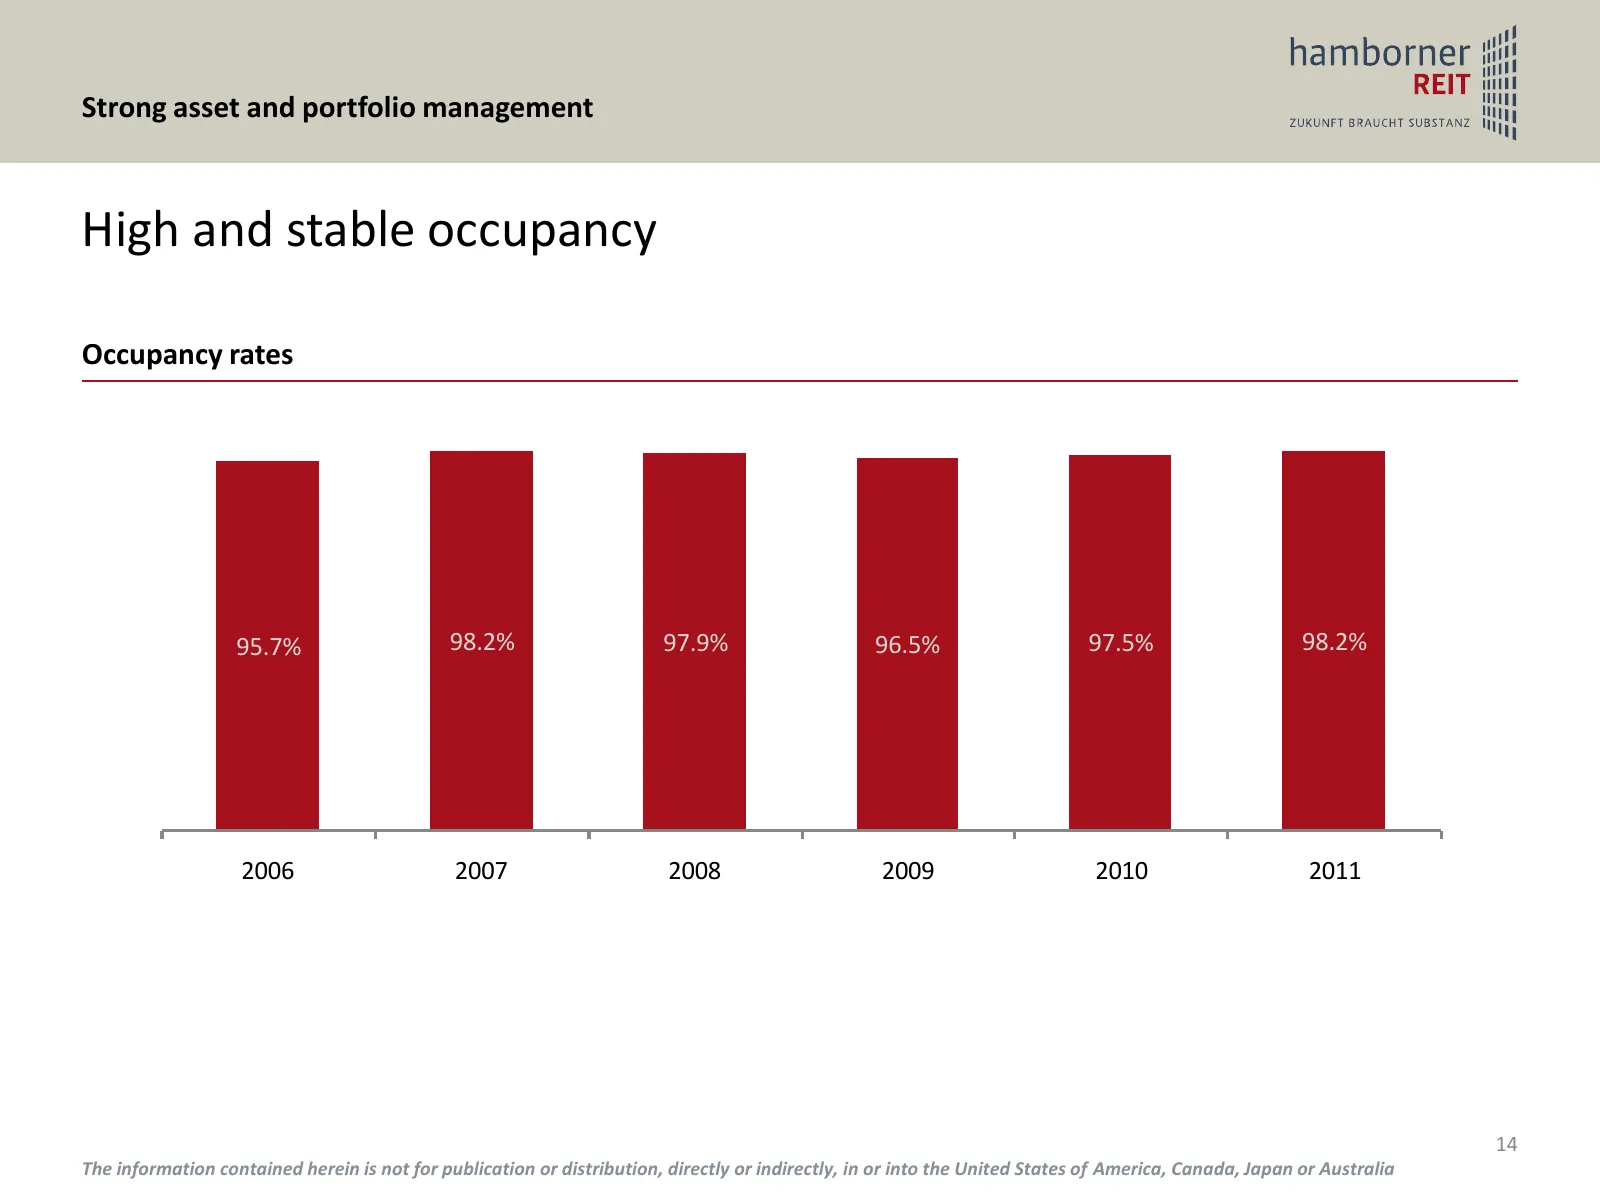
Strong asset and portfolio management High and stable occupancy Occupancy rates 95.7% 98.2% 97.9% 96.5% 97.5% 98.2% 2006 2007 2008 2009 2010 2011 14 The information contained herein is not for publication or distribution, directly or indirectly, in or into the United States of America, Canada, Japan
Slide 15: Long-term leases with strong tenants
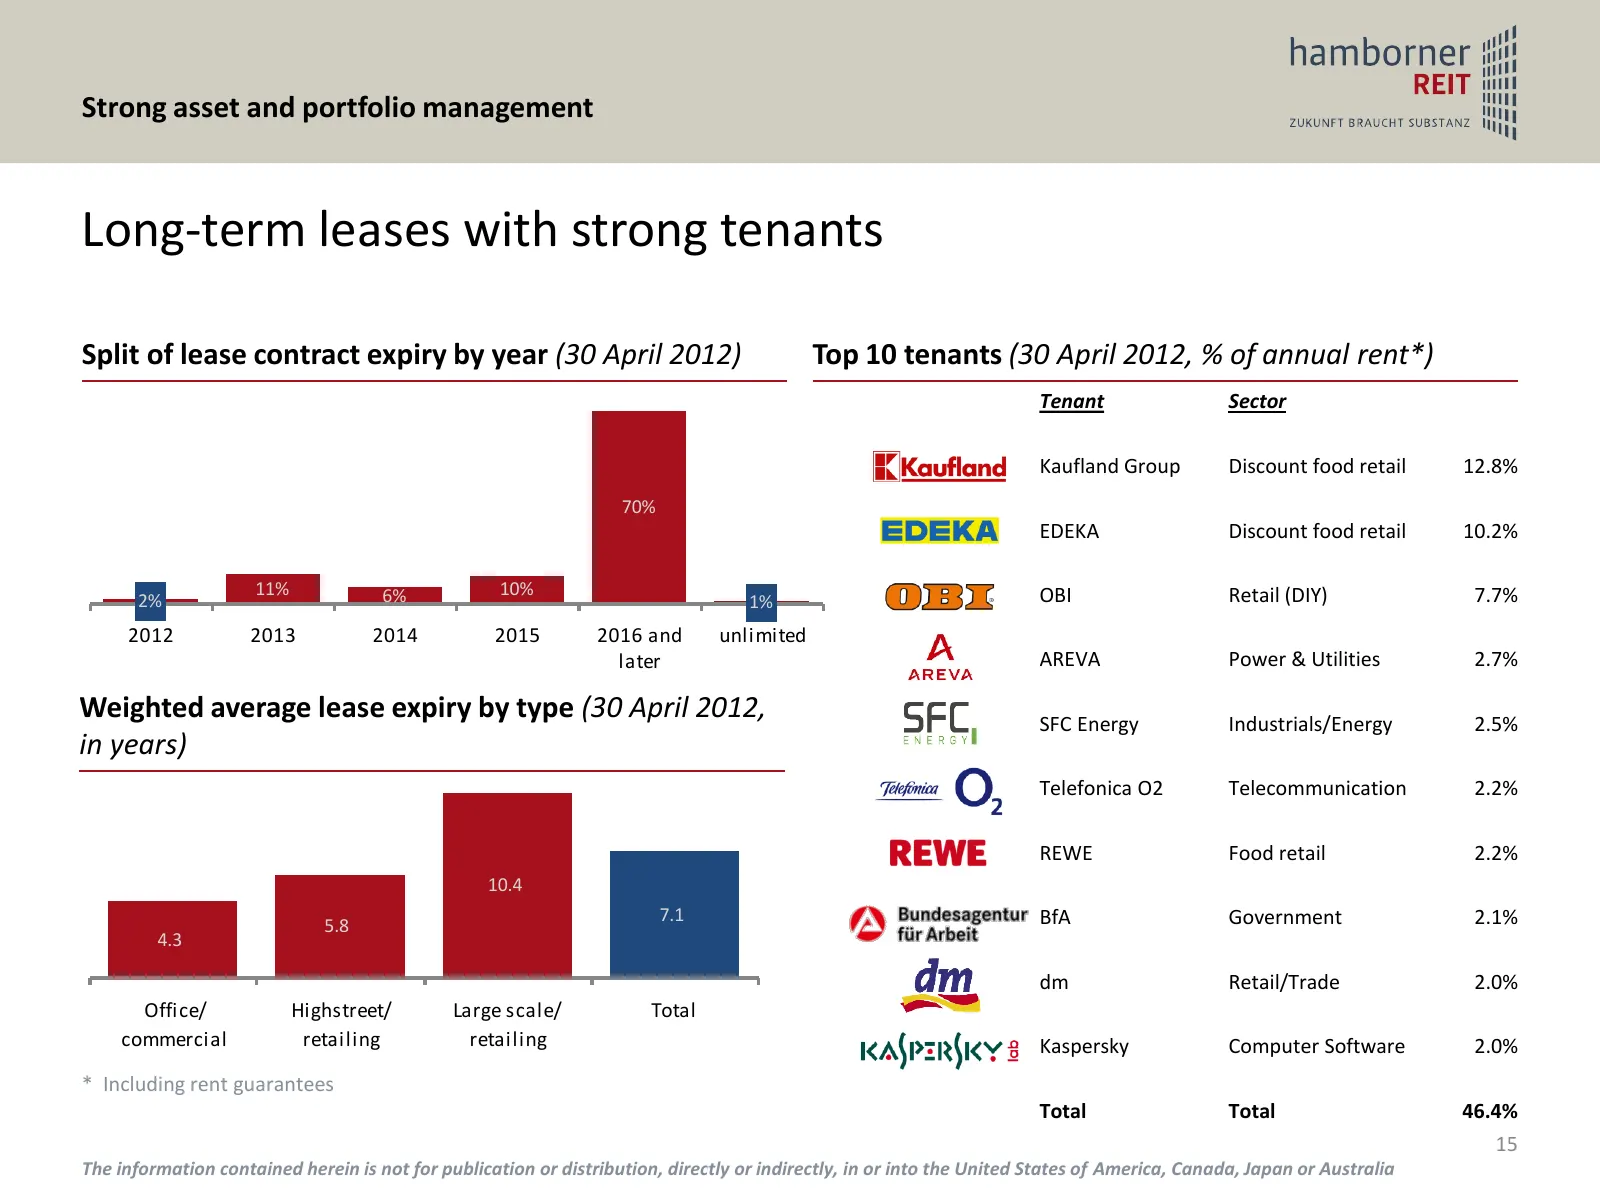
Strong asset and portfolio management Long-term leases with strong tenants Split of lease contract expiry by year (30 April 2012) Top 10 tenants (30 April 2012, % of annual rent*) Tenant Sector Kaufland Group Discount food retail 12.8% 70% EDEKA Discount food retail 10.2% 11% 6% 10% OBI Retail (DIY)
Slide 16: Benefitting from economies of scale
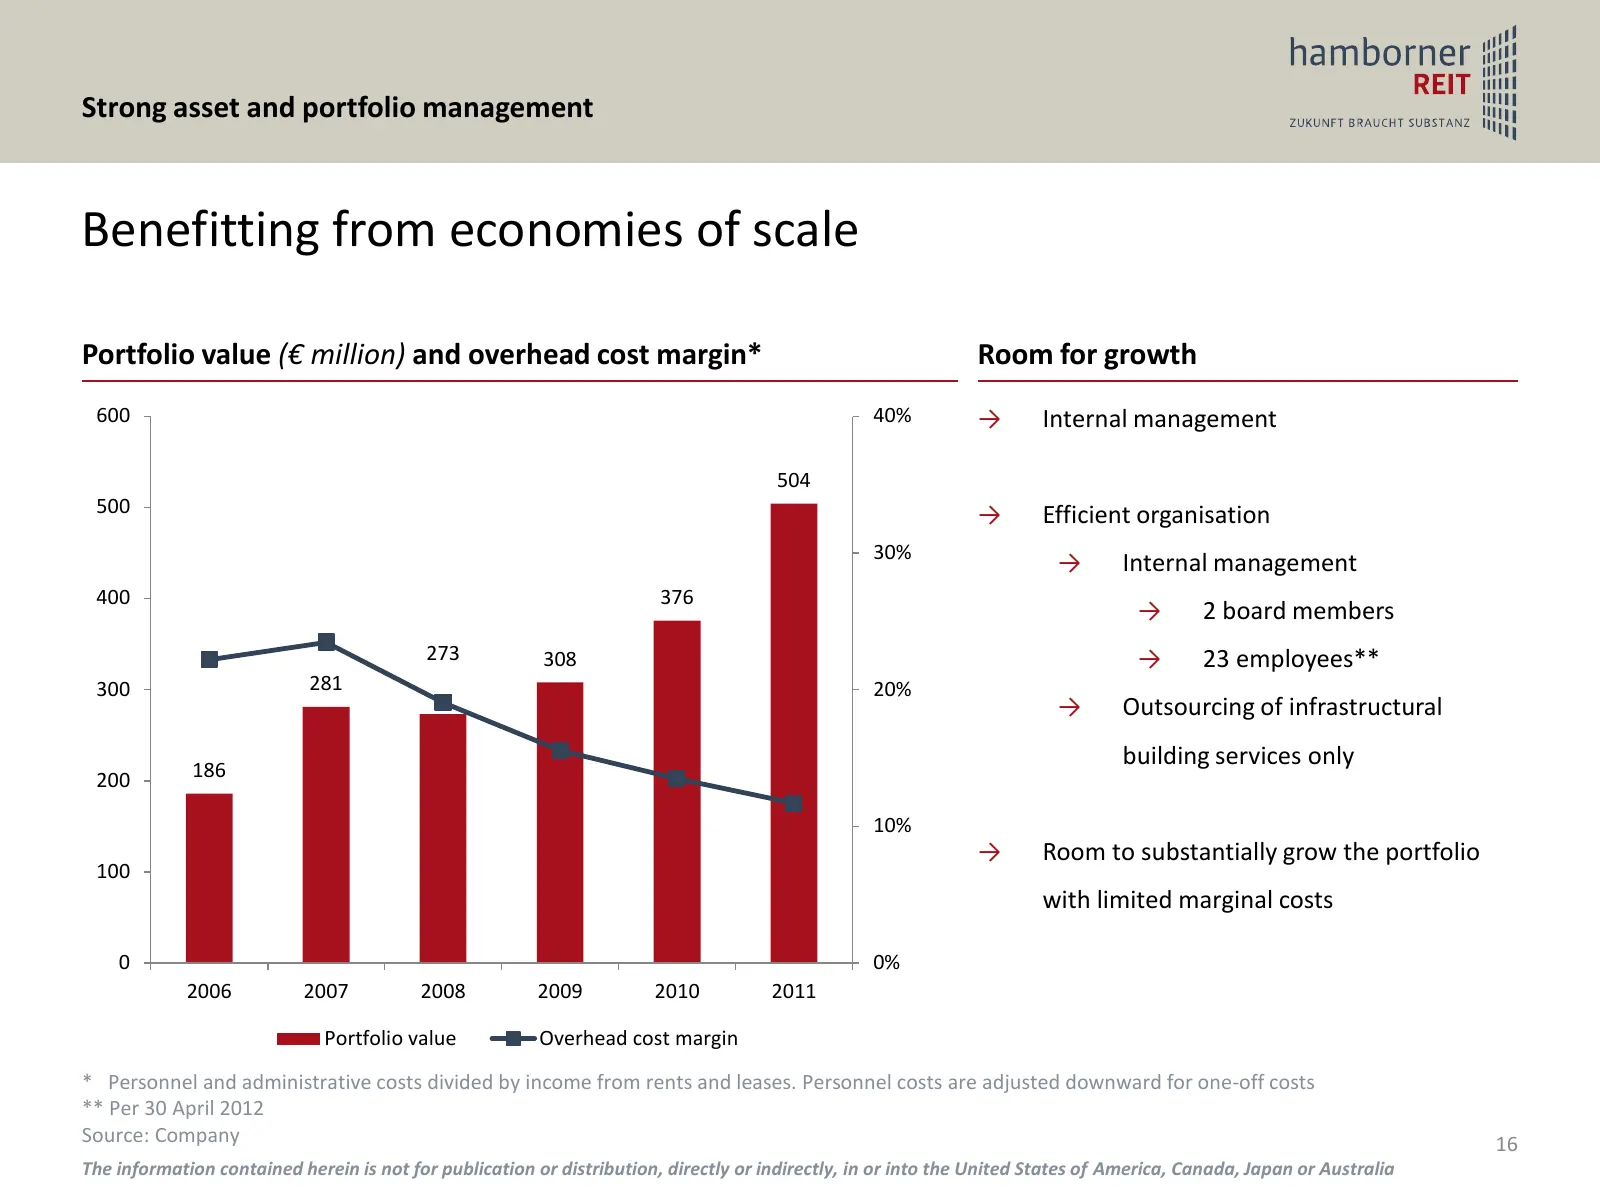
Strong asset and portfolio management Benefitting from economies of scale Portfolio value (€ million) and overhead cost margin* Room for growth 600 40% → Internal management 504 500 → Efficient organisation 30% → Internal management 400 376 → 2 board members 273 308 → 23 employees** 300 281 20% → Ou
Slide 17: Agenda
Agenda 1 Capturing German momentum 2 Increasing portfolio quality 3 Strong asset and portfolio management 4 Robust financial position 5 Enhancing efficiency, increasing cash flow and dividend per share 6 Capital markets track record 7 Outlook 8 Appendix 17 The information contained herein is not for
Slide 18: Stable and predictable cost of debt
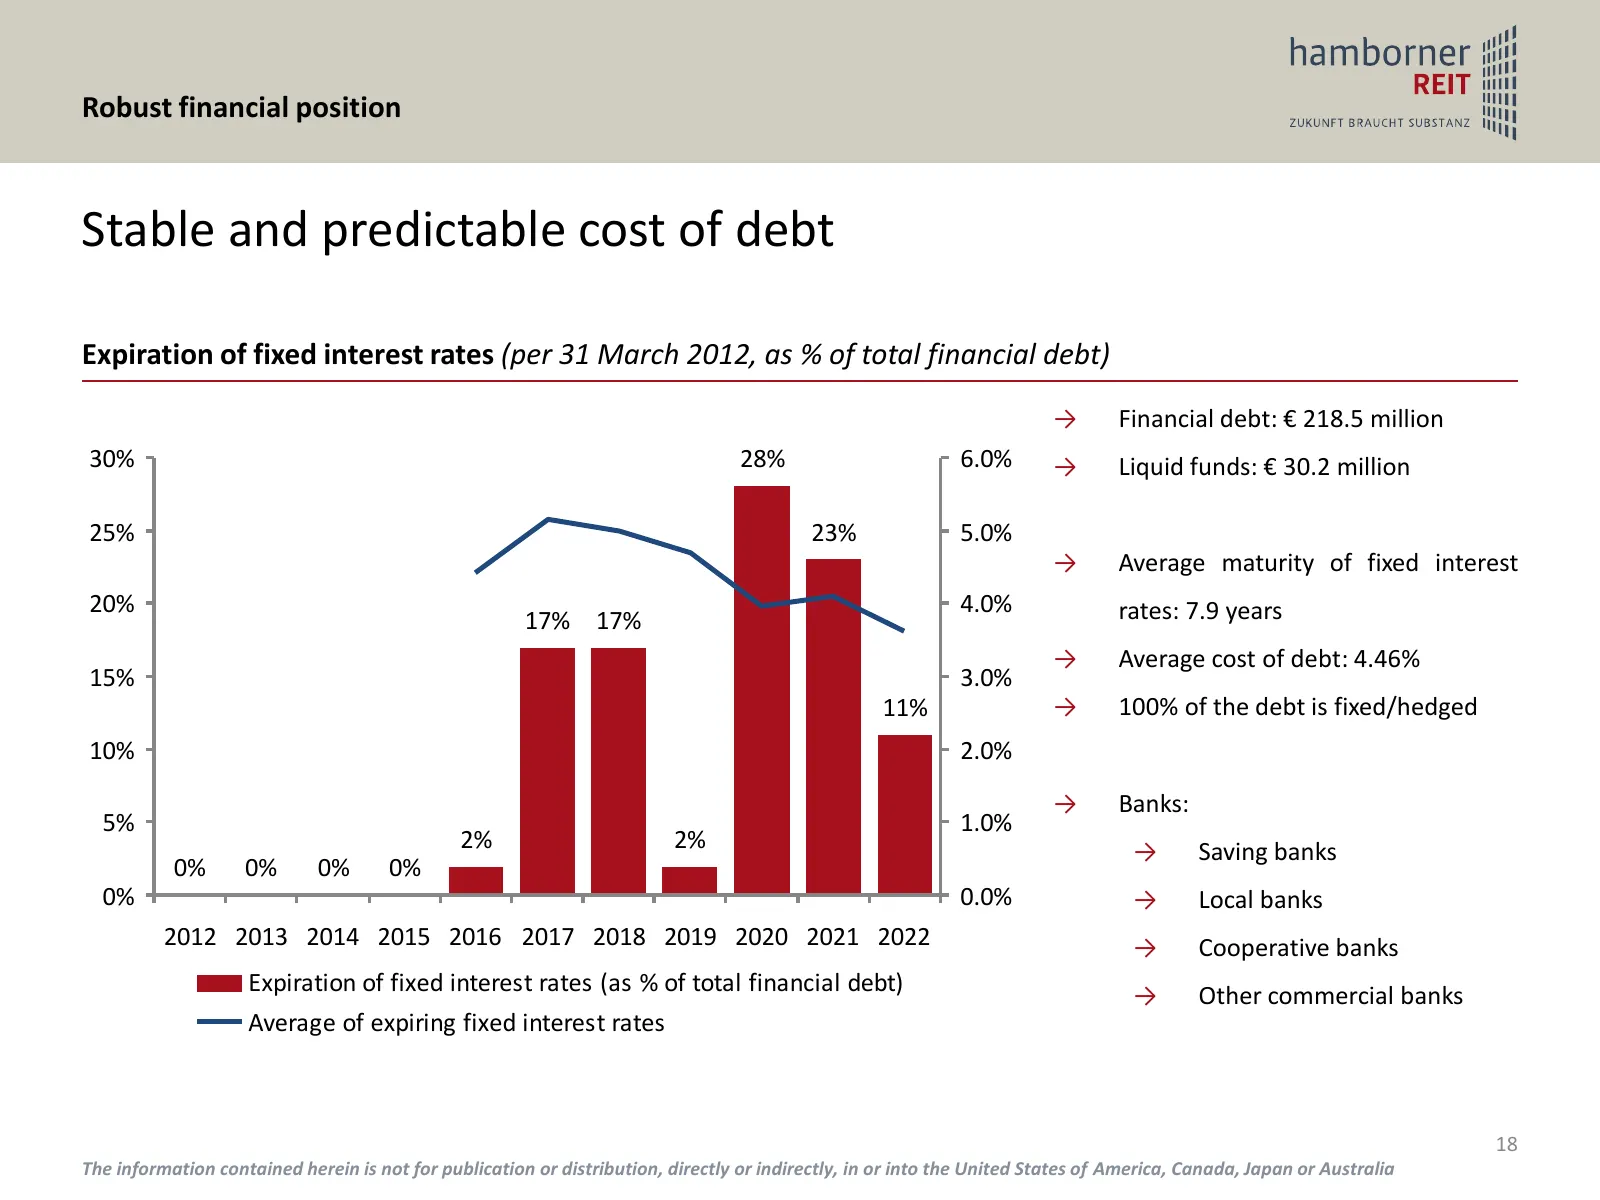
Robust financial position Stable and predictable cost of debt Expiration of fixed interest rates (per 31 March 2012, as % of total financial debt) → Financial debt: € 218.5 million 30% 28% 6.0% → Liquid funds: € 30.2 million 25% 23% 5.0% → Average maturity of fixed interest 20% 4.0% rates: 7.9 years
Slide 19: Low LTV, equity ratio well within REIT criteria
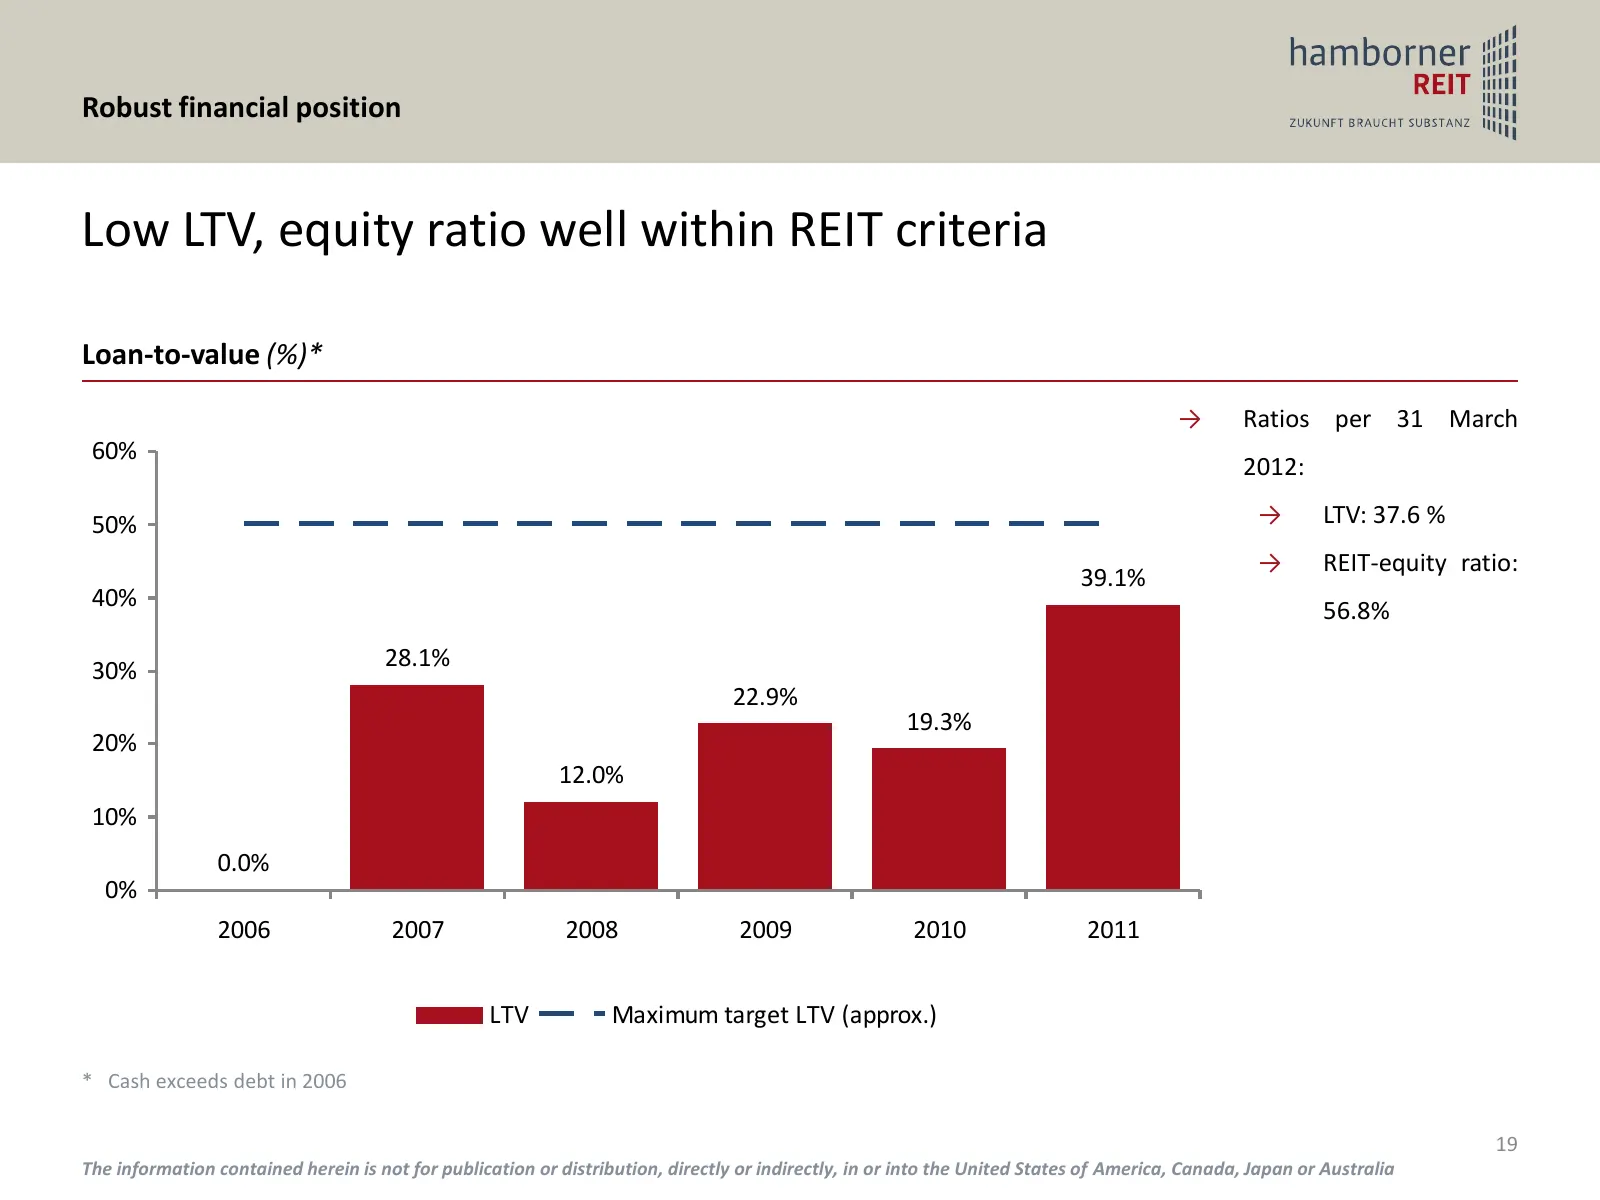
Robust financial position Low LTV, equity ratio well within REIT criteria Loan-to-value (%)* → Ratios per 31 March 60% 2012: 50% → LTV: 37.6 % → REIT-equity ratio: 39.1% 40% 56.8% 28.1% 30% 22.9% 19.3% 20% 12.0% 10% 0.0% 0% 2006 2007 2008 2009 2010 2011 LTV Maximum target LTV (approx.) * Cash exceed
Slide 20: Lower marginal funding costs
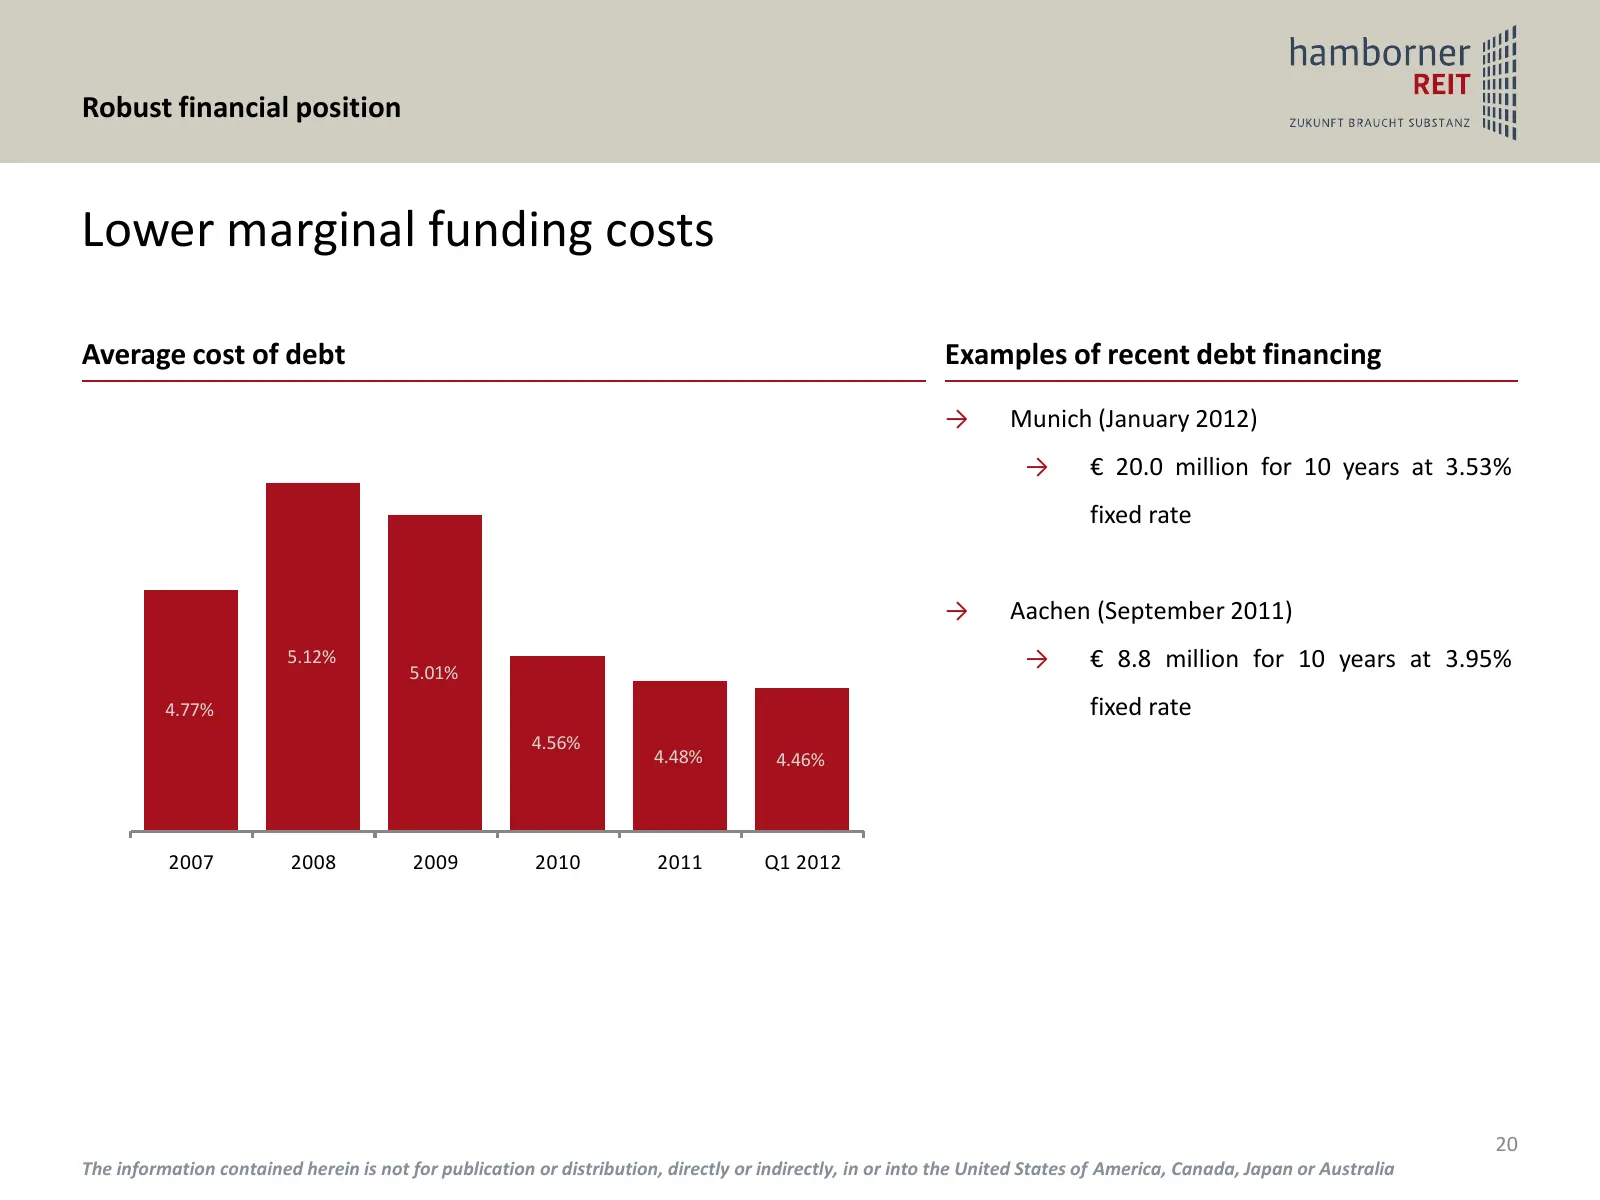
Robust financial position Lower marginal funding costs Average cost of debt Examples of recent debt financing → Munich (January 2012) → € 20.0 million for 10 years at 3.53% fixed rate → Aachen (September 2011) 5.12% 5.01% → € 8.8 million for 10 years at 3.95% 4.77% fixed rate 4.56% 4.48% 4.46% 2007
Slide 21: Agenda
Agenda 1 Capturing German momentum 2 Increasing portfolio quality 3 Strong asset and portfolio management 4 Robust financial position 5 Enhancing efficiency, increasing cash flow and dividend per share 6 Capital markets track record 7 Outlook 8 Appendix 21 The information contained herein is not for
Slide 22: Increasing efficiency resulting in higher margins
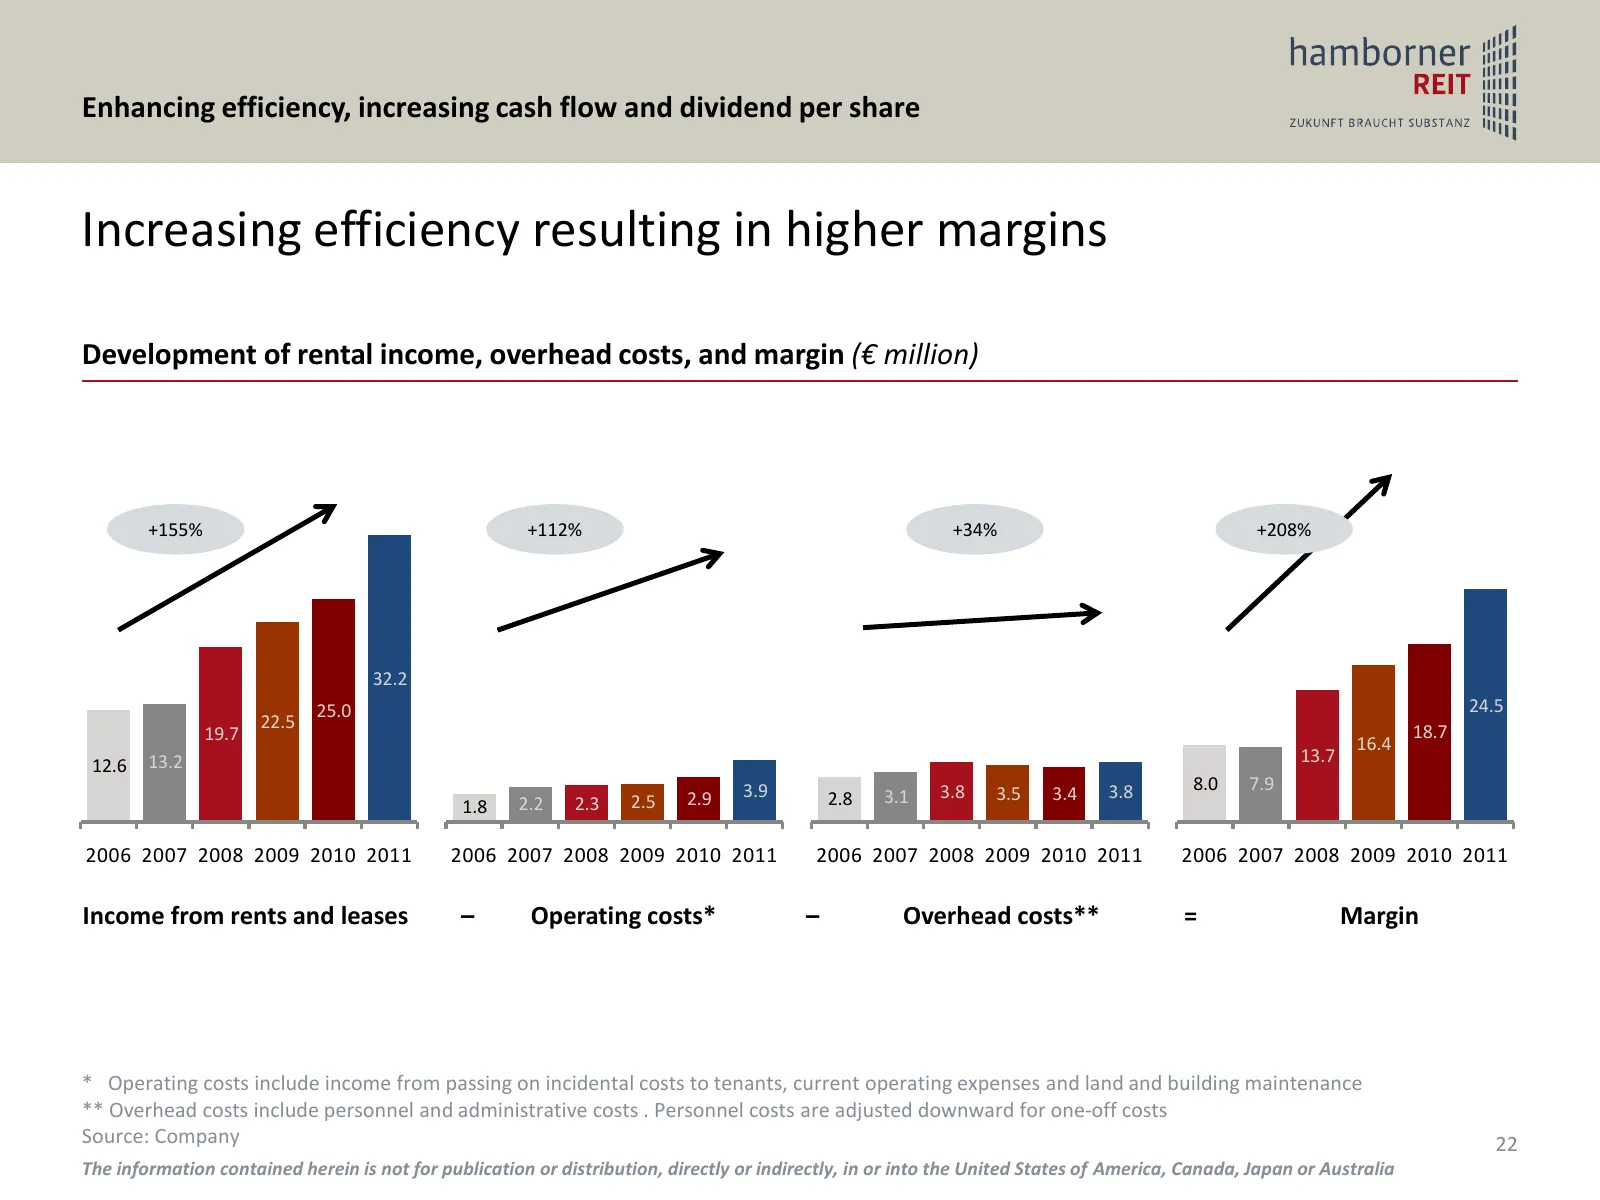
Enhancing efficiency, increasing cash flow and dividend per share Increasing efficiency resulting in higher margins Development of rental income, overhead costs, and margin (€ million) +155% +112% +34% +208% 32.2 25.0 24.5 22.5 19.7 18.7 16.4 12.6 13.2 13.7 3.9 3.8 3.5 3.4 3.8 8.0 7.9 1.8 2.2 2.3 2.
Slide 23: Increasing Funds From Operations and dividend per share
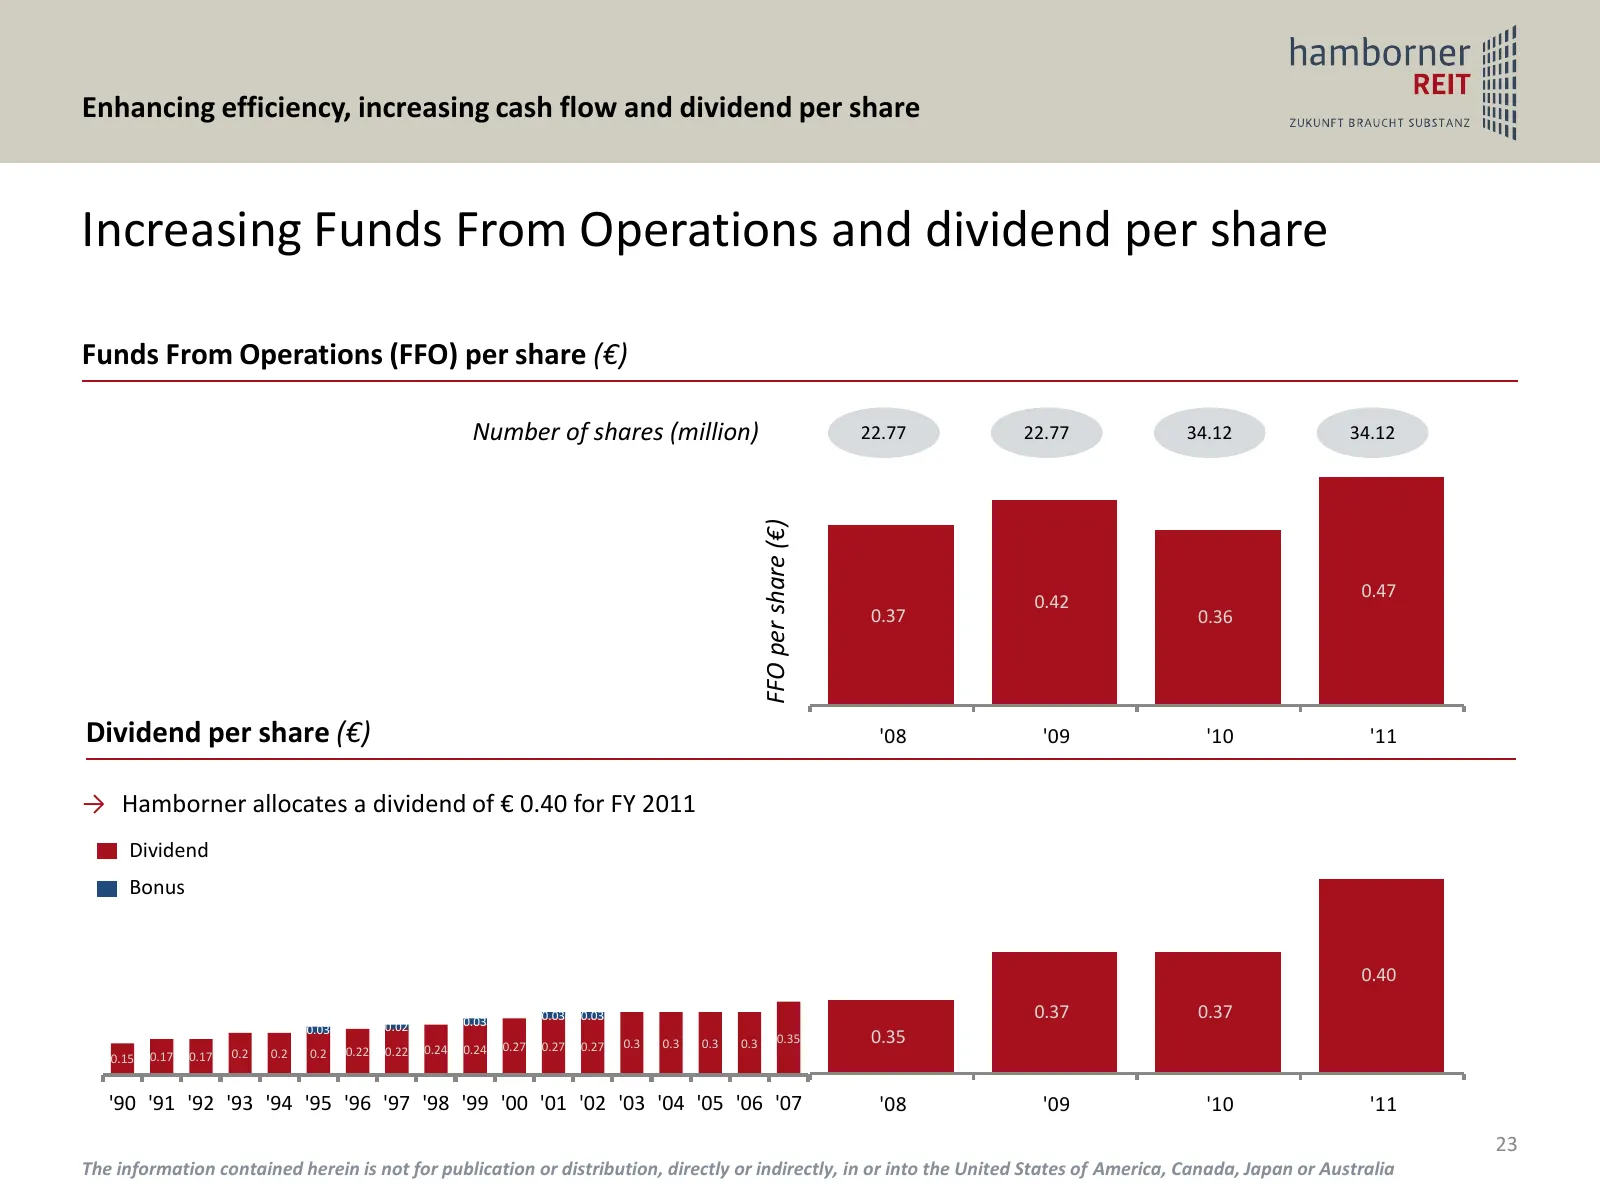
Enhancing efficiency, increasing cash flow and dividend per share Increasing Funds From Operations and dividend per share Funds From Operations (FFO) per share (€) Number of shares (million) 22.77 22.77 34.12 34.12 FFO per share (€) 0.47 0.42 0.37 0.36 Dividend per share (€) '08 '09 '10 '11 → Hambor
Slide 24: Agenda
Agenda 1 Capturing German momentum 2 Increasing portfolio quality 3 Strong asset and portfolio management 4 Robust financial position 5 Enhancing efficiency, increasing cash flow and dividend per share 6 Capital markets track record 7 Outlook 8 Appendix 24 The information contained herein is not for
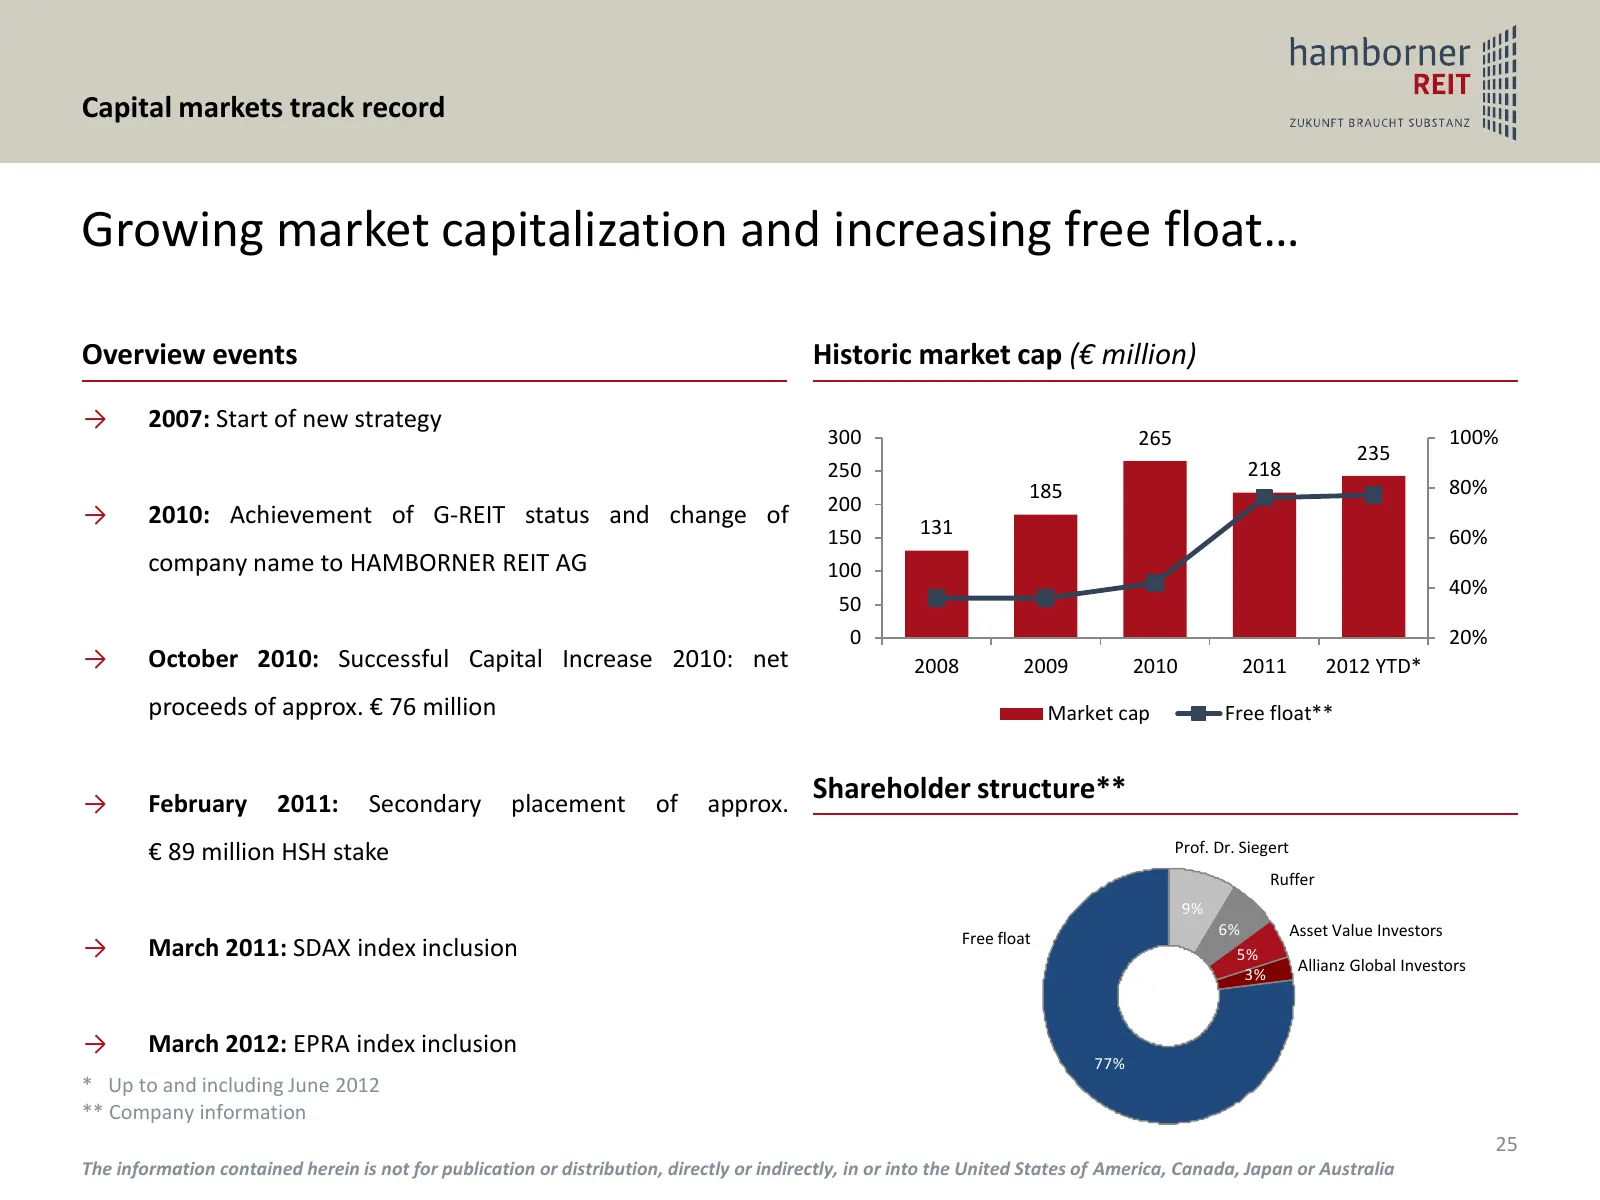
Slide 25: Growing market capitalization and increasing free float
Capital markets track record Growing market capitalization and increasing free float… Overview events Historic market cap (€ million) → 2007: Start of new strategy 300 265 100% 235 250 218 185 80% 200 → 2010: Achievement of G-REIT status and change of 131 150 60% company name to HAMBORNER REIT AG 10
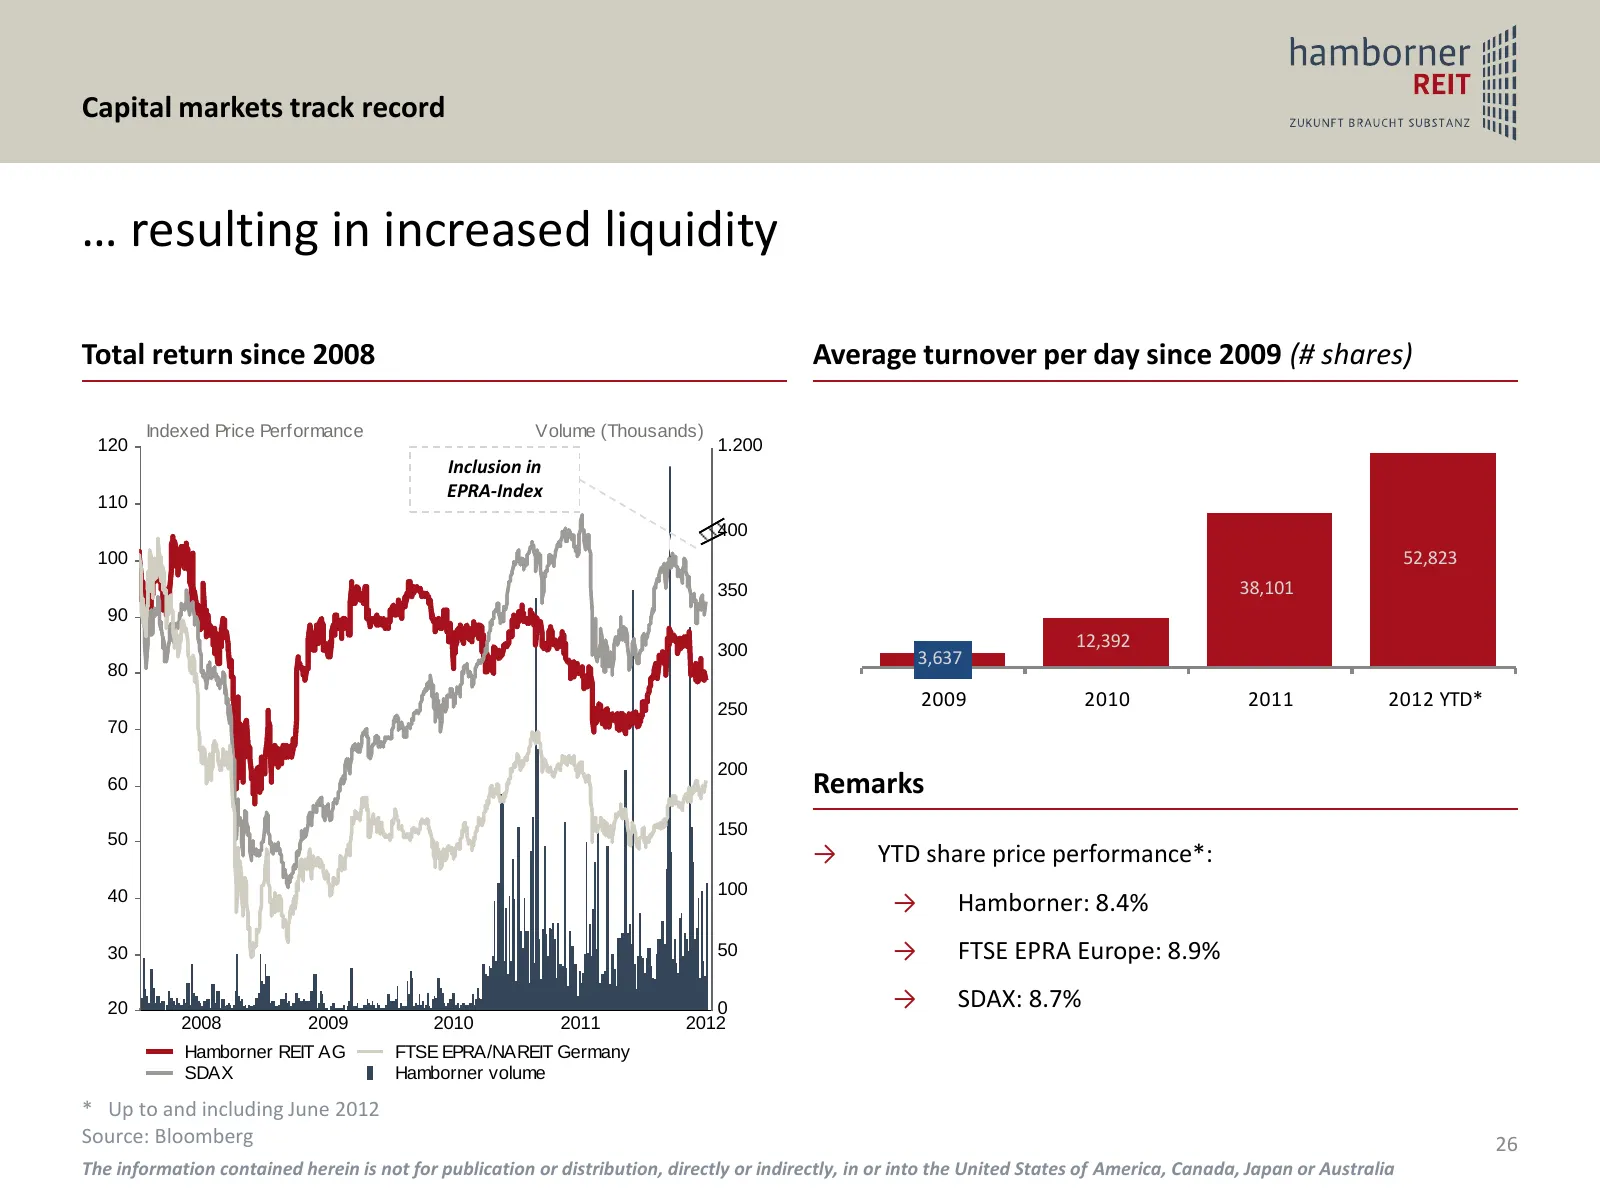
Slide 26: … resulting in increased liquidity
Capital markets track record … resulting in increased liquidity Total return since 2008 Average turnover per day since 2009 (# shares) Indexed Price Performance Volume (Thousands) 120 1.200 Inclusion in EPRA-Index 110 400 100 52,823 350 38,101 90 300 12,392 3,637 80 250 2009 2010 2011 2012 YTD* 70 2
Slide 27: Agenda
Agenda 1 Capturing German momentum 2 Increasing portfolio quality 3 Strong asset and portfolio management 4 Robust financial position 5 Enhancing efficiency, increasing cash flow and dividend per share 6 Capital markets track record 7 Outlook 8 Appendix 27 The information contained herein is not for
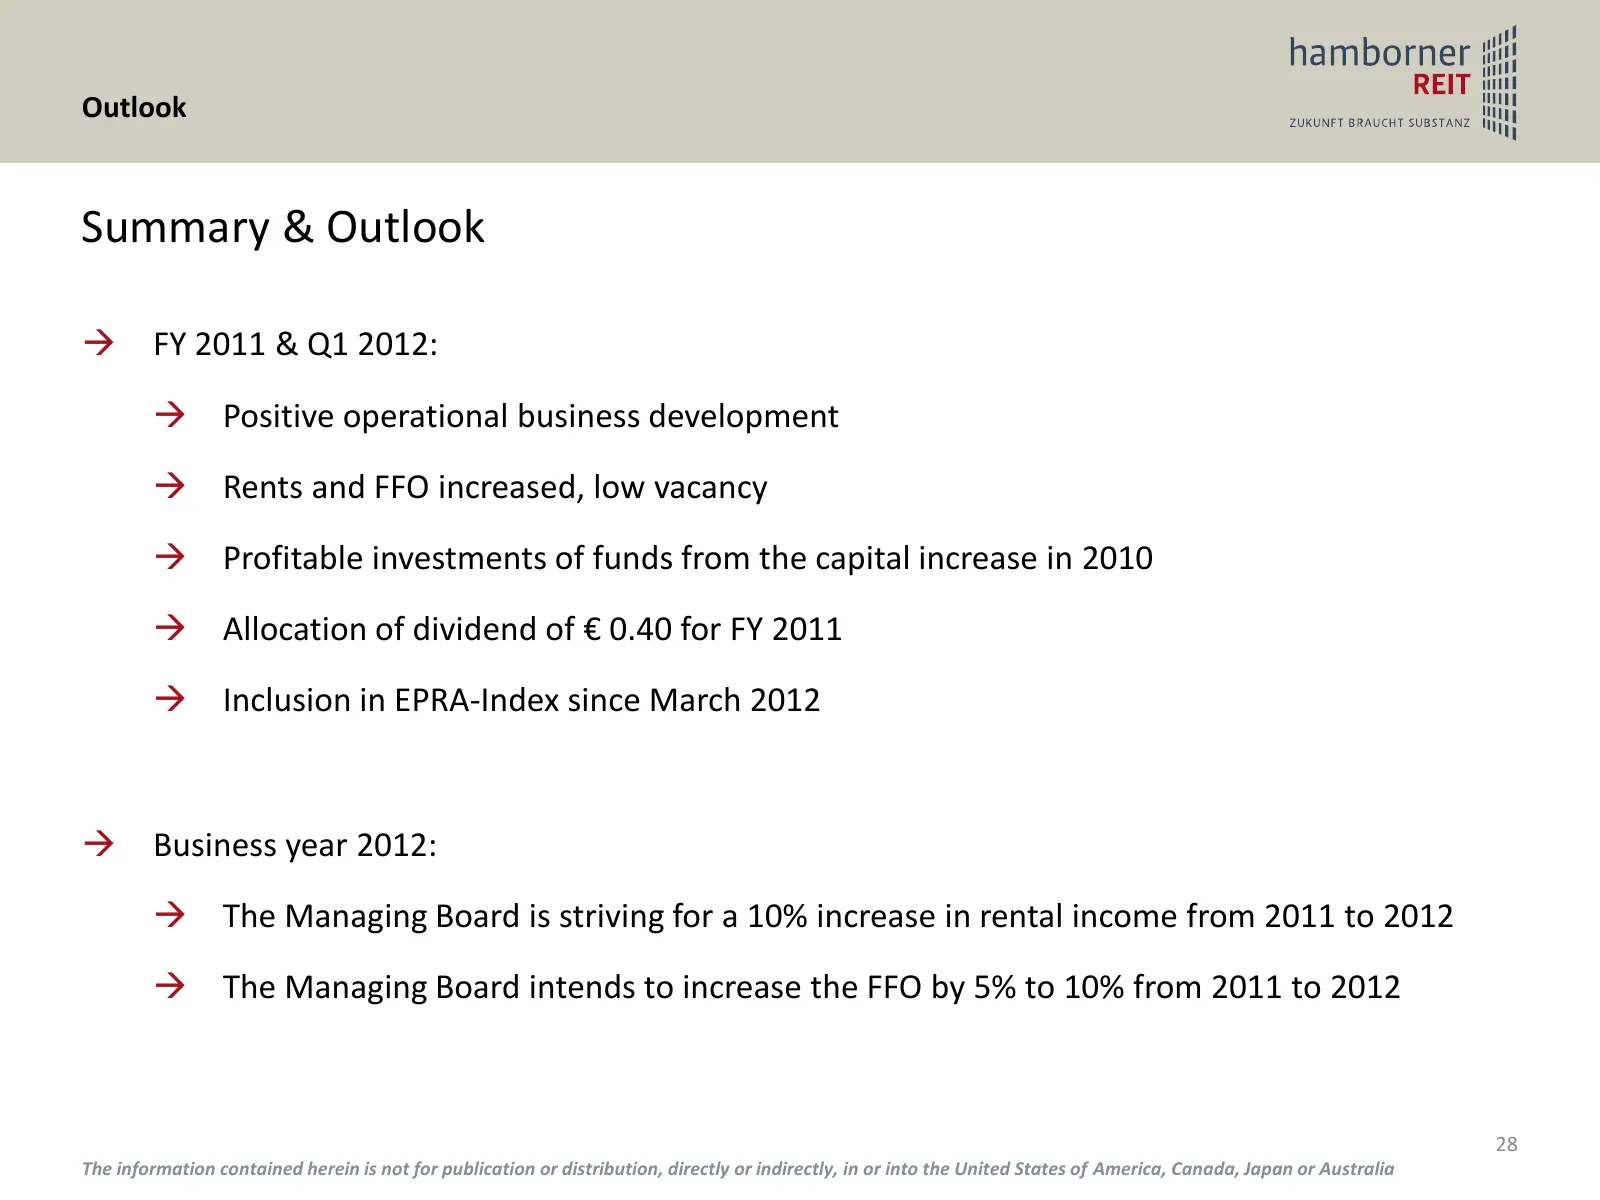
Slide 28: Summary & Outlook
Outlook Summary & Outlook FY 2011 & Q1 2012: Positive operational business development Rents and FFO increased, low vacancy Profitable investments of funds from the capital increase in 2010 Allocation of dividend of € 0.40 for FY 2011 Inclusion in EPRA-Index since March 2012 Business y
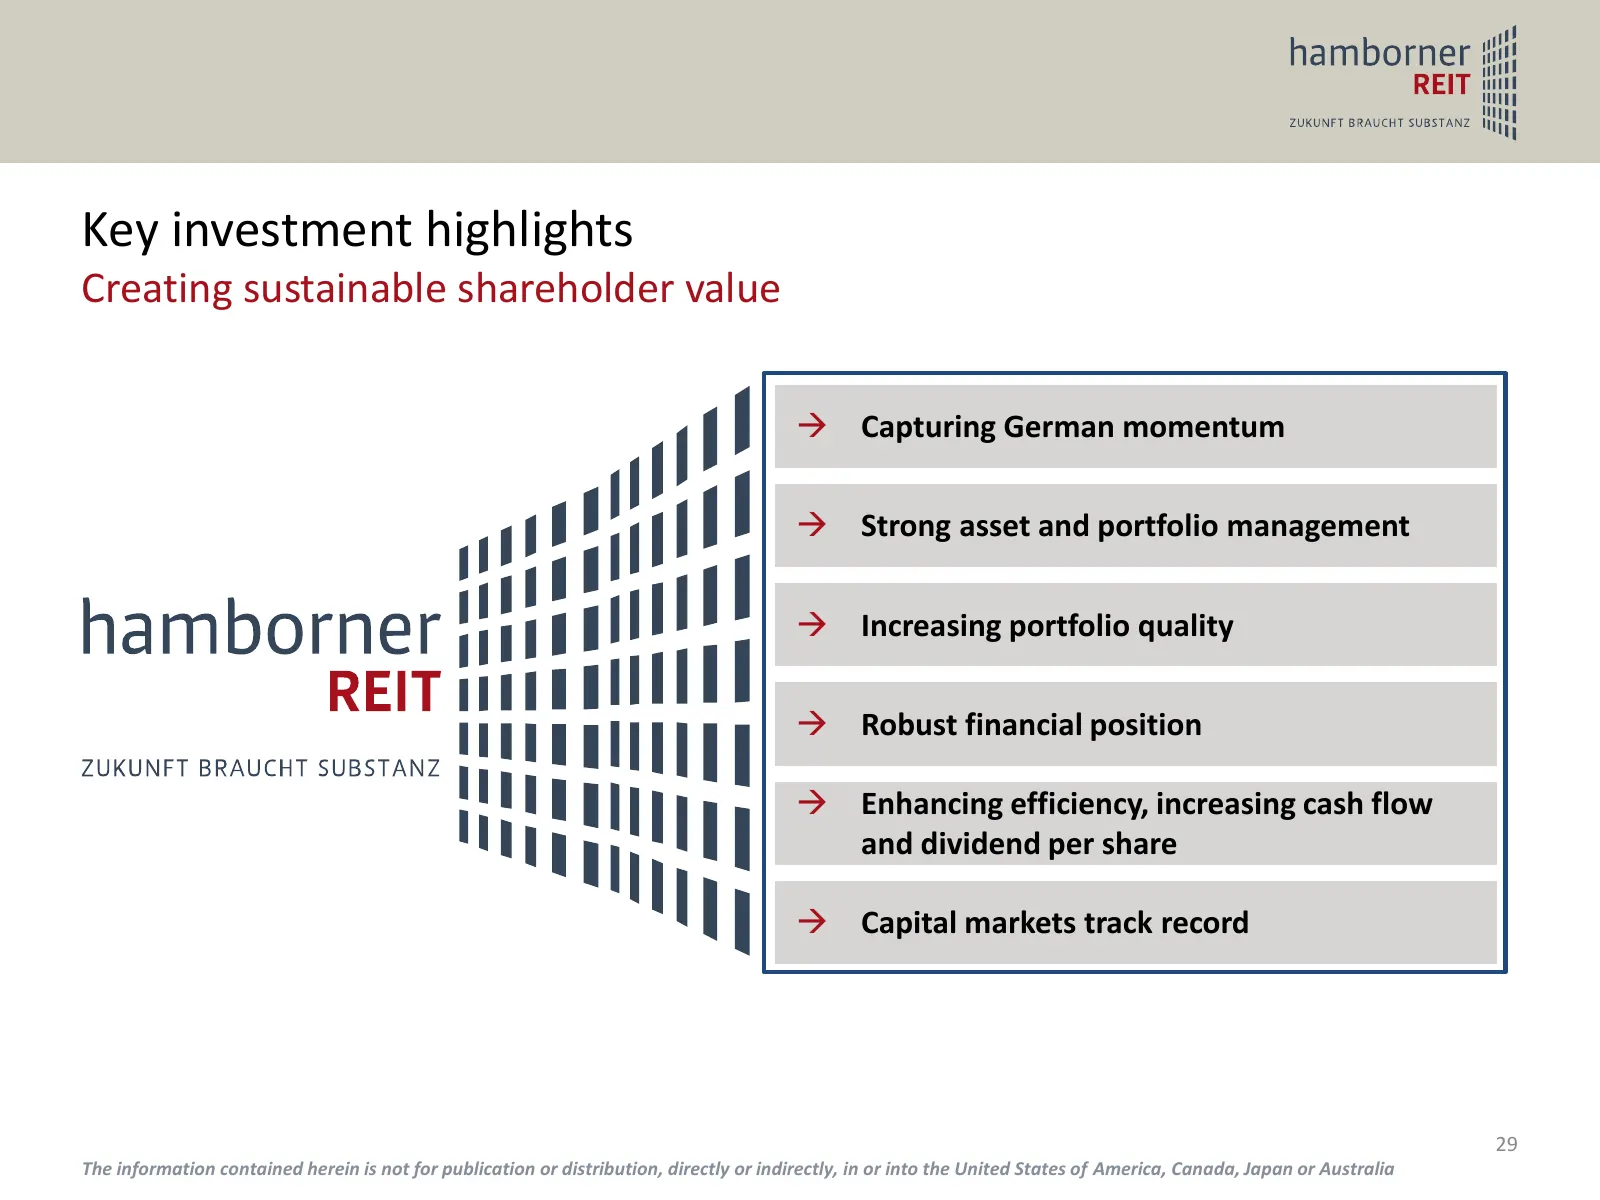
Slide 29: Key investment highlights
Key investment highlights Creating sustainable shareholder value Capturing German momentum Strong asset and portfolio management Increasing portfolio quality Robust financial position Enhancing efficiency, increasing cash flow and dividend per share Capital markets track record 29 The in
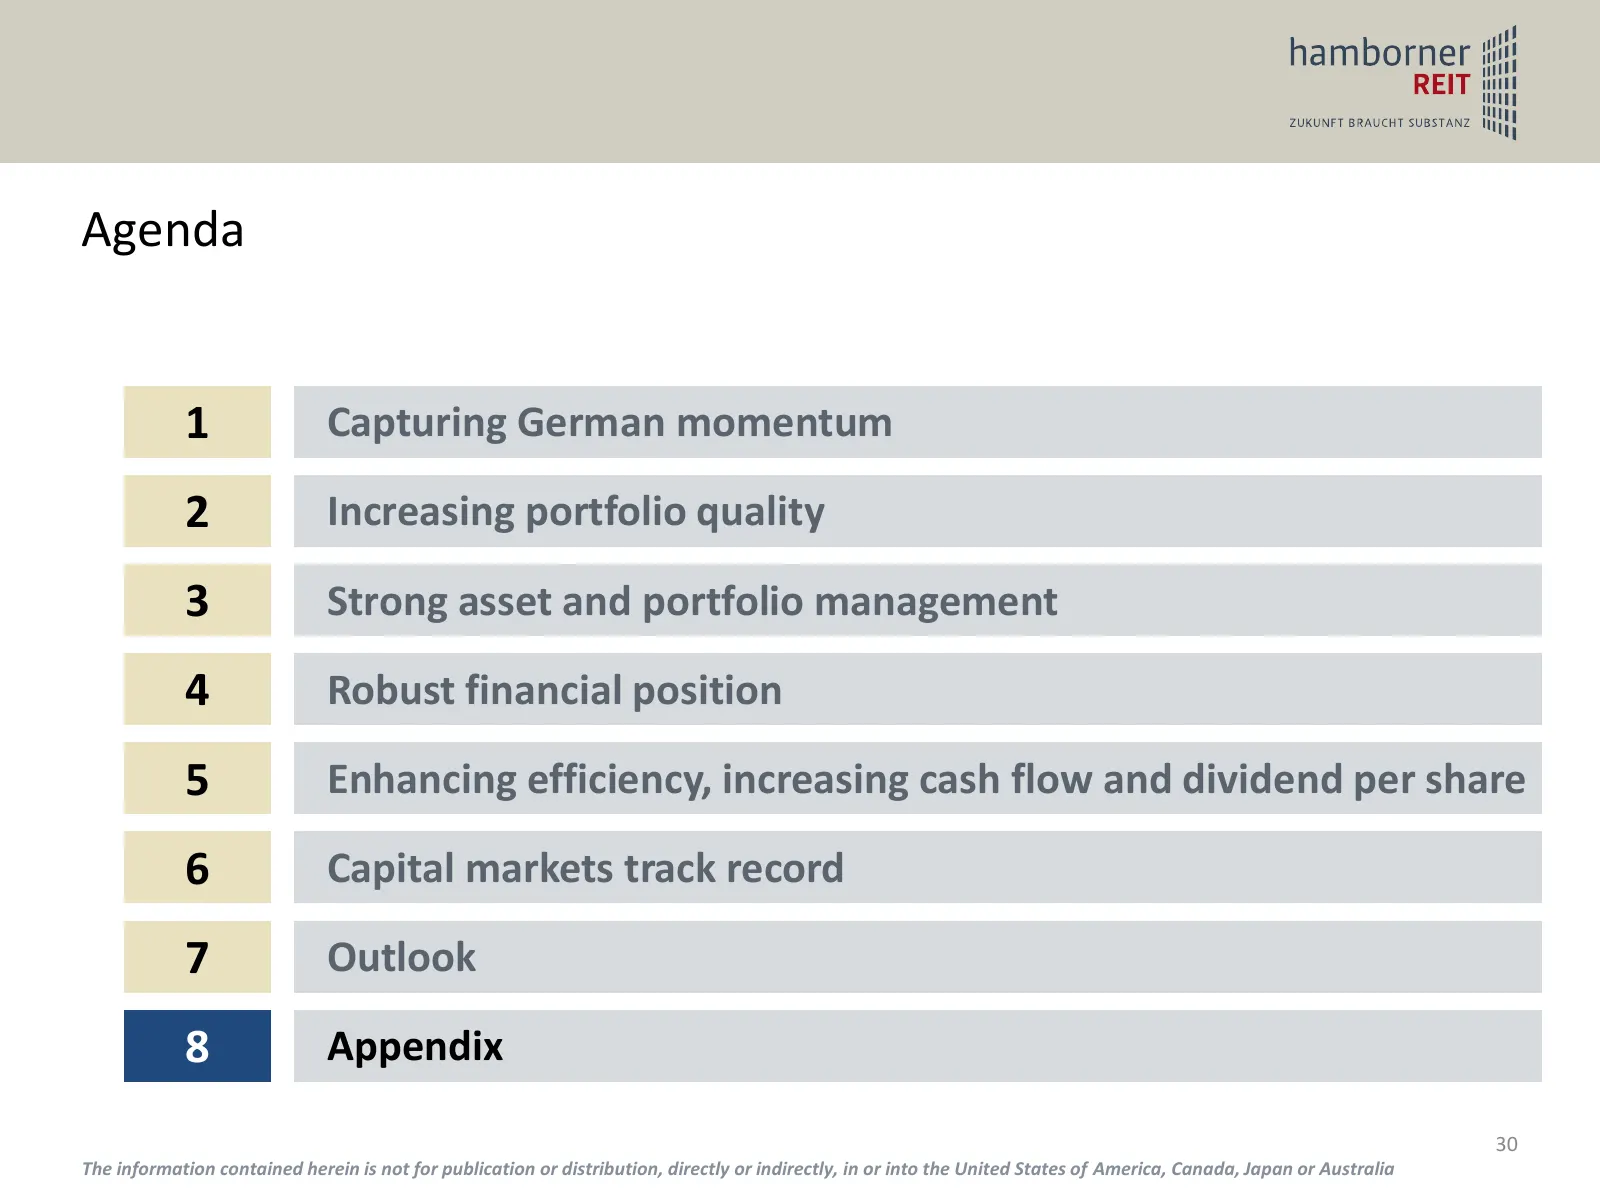
Slide 30: Agenda
Agenda 1 Capturing German momentum 2 Increasing portfolio quality 3 Strong asset and portfolio management 4 Robust financial position 5 Enhancing efficiency, increasing cash flow and dividend per share 6 Capital markets track record 7 Outlook 8 Appendix 30 The information contained herein is not for
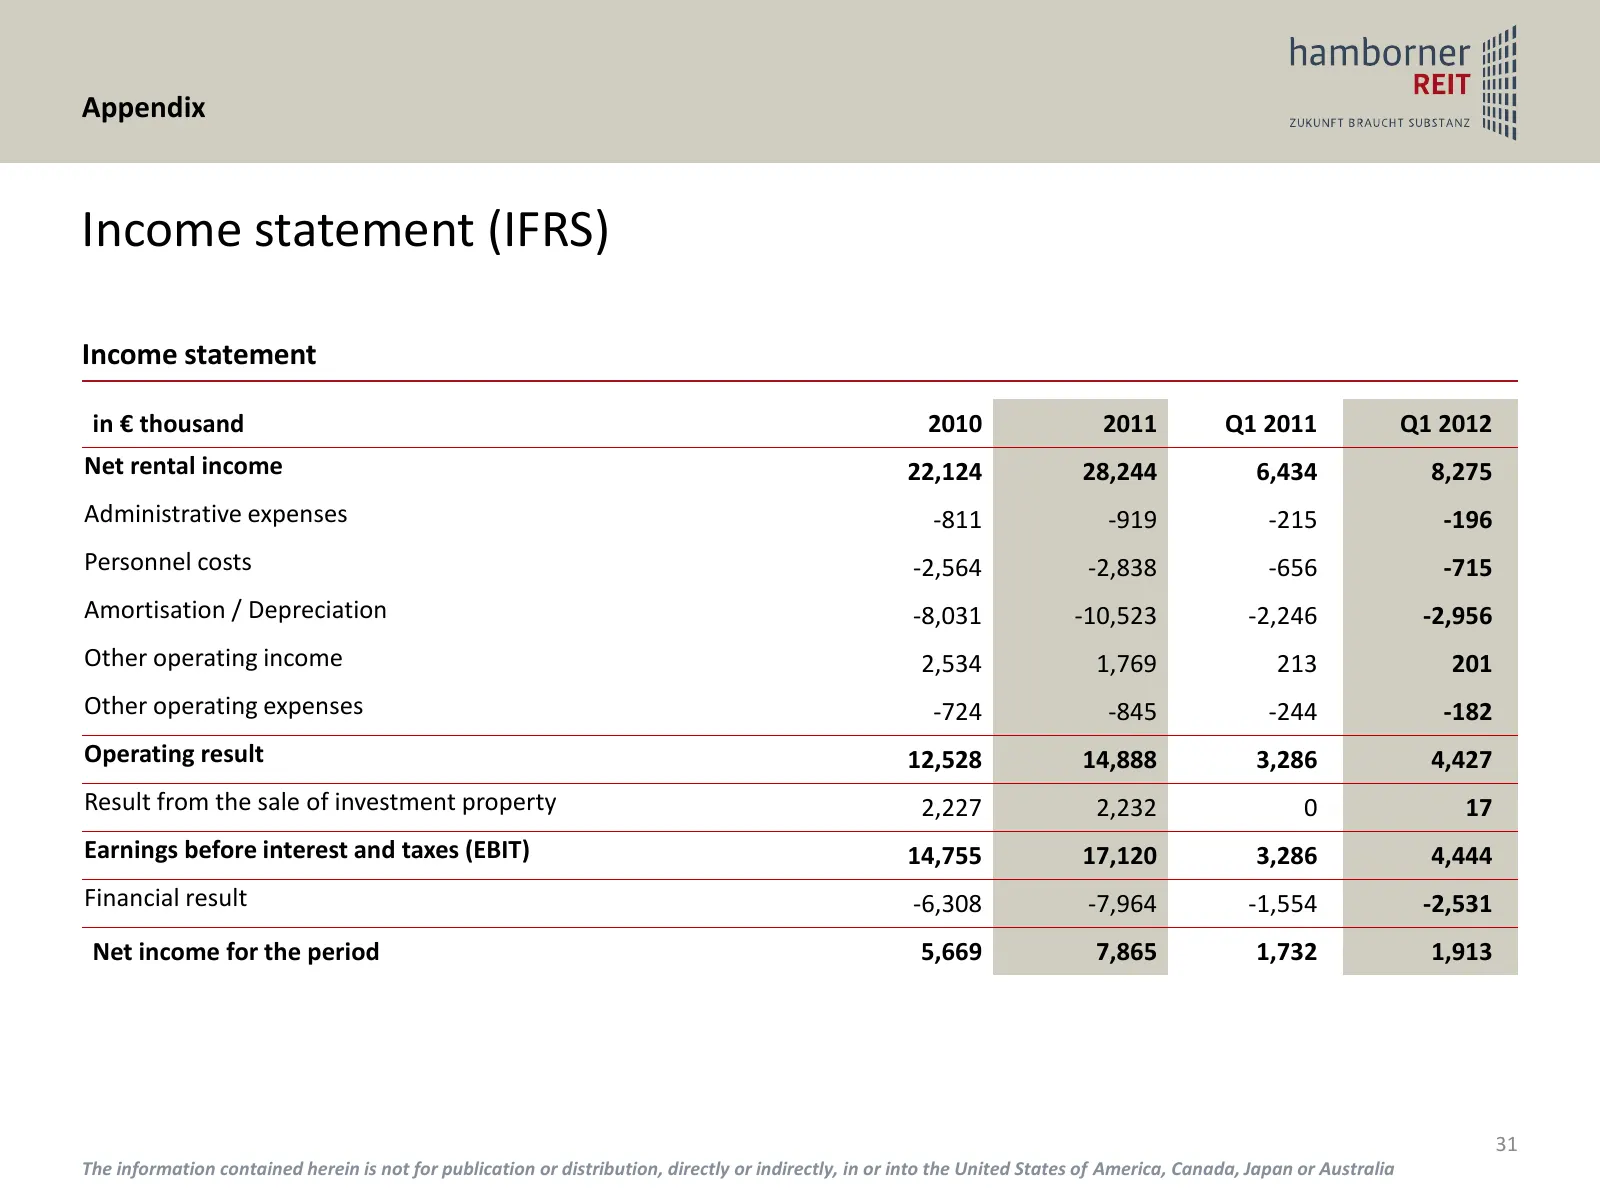
Slide 31: Income statement (IFRS)
Appendix Income statement (IFRS) Income statement in € thousand 2010 2011 Q1 2011 Q1 2012 Net rental income 22,124 28,244 6,434 8,275 Administrative expenses -811 -919 -215 -196 Personnel costs -2,564 -2,838 -656 -715 Amortisation / Depreciation -8,031 -10,523 -2,246 -2,956 Other operating income 2,
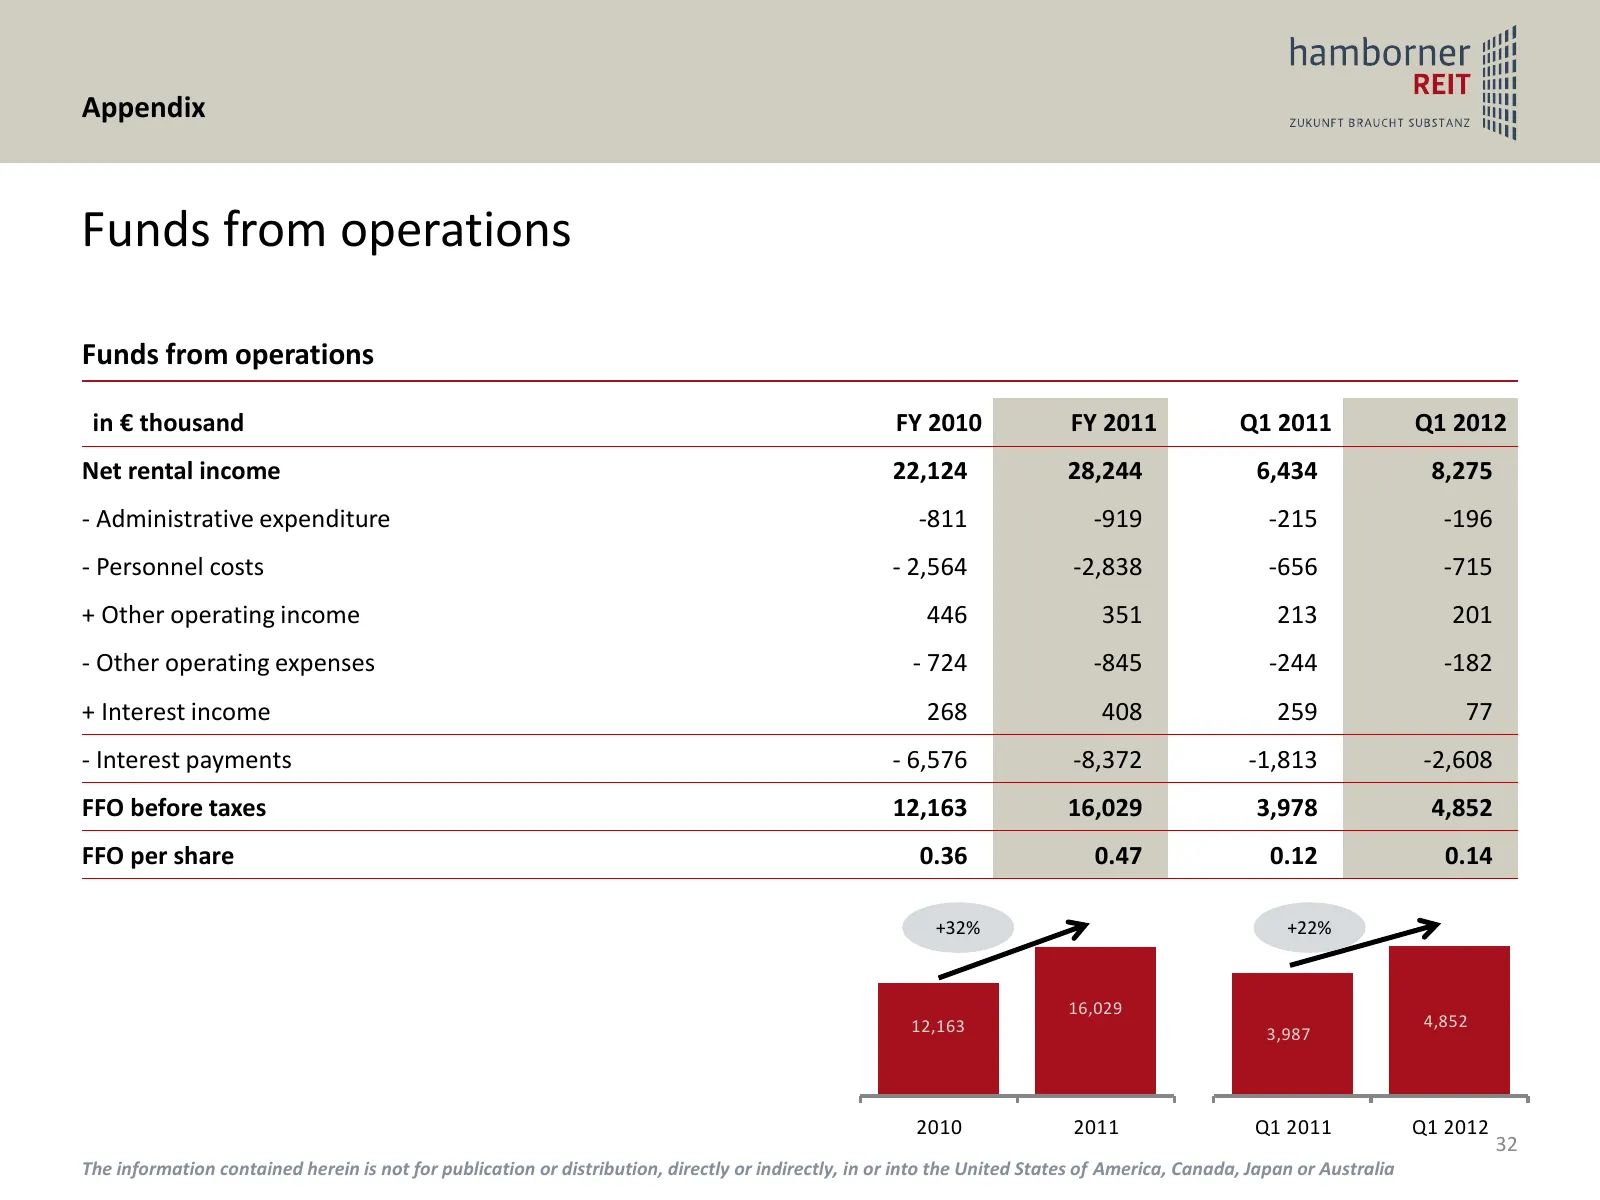
Slide 32: Funds from operations
Appendix Funds from operations Funds from operations in € thousand FY 2010 FY 2011 Q1 2011 Q1 2012 Net rental income 22,124 28,244 6,434 8,275 - Administrative expenditure -811 -919 -215 -196 - Personnel costs - 2,564 -2,838 -656 -715 + Other operating income 446 351 213 201 - Other operating expens
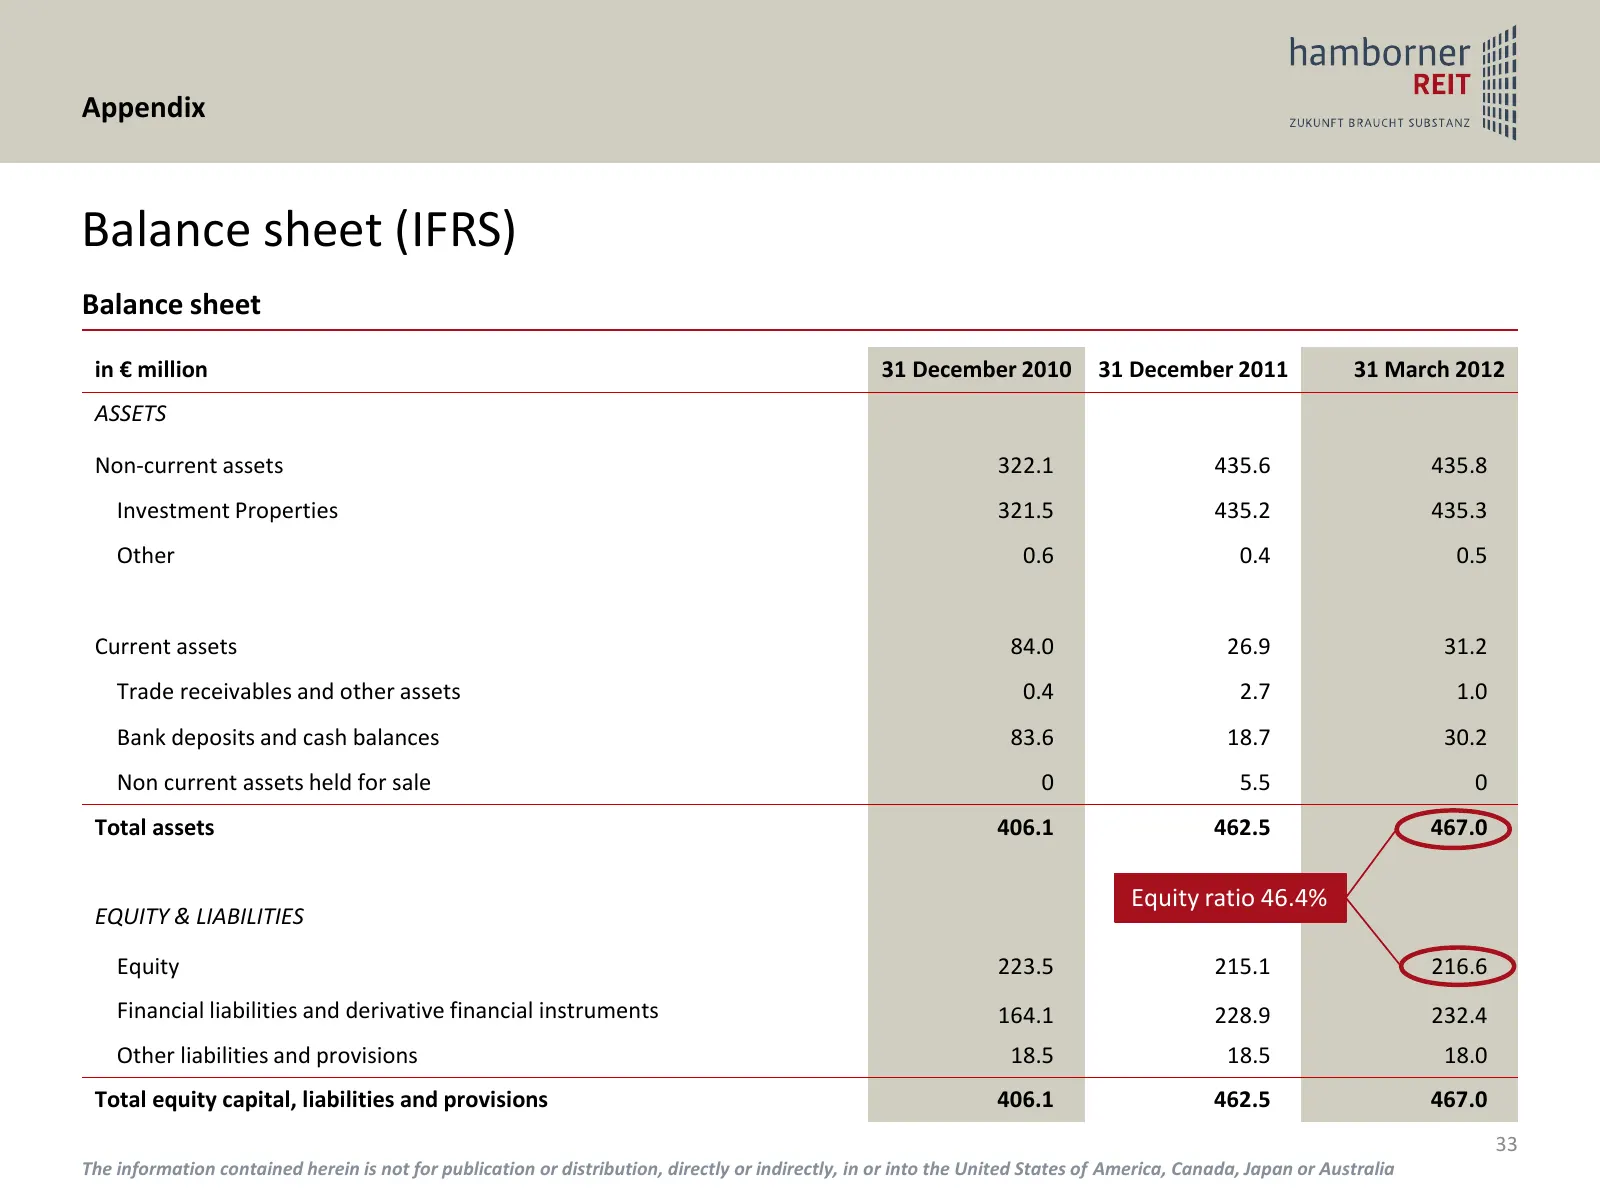
Slide 33: Balance sheet (IFRS)
Appendix Balance sheet (IFRS) Balance sheet in € million 31 December 2010 31 December 2011 31 March 2012 ASSETS Non-current assets 322.1 435.6 435.8 Investment Properties 321.5 435.2 435.3 Other 0.6 0.4 0.5 Current assets 84.0 26.9 31.2 Trade receivables and other assets 0.4 2.7 1.0 Bank deposits an
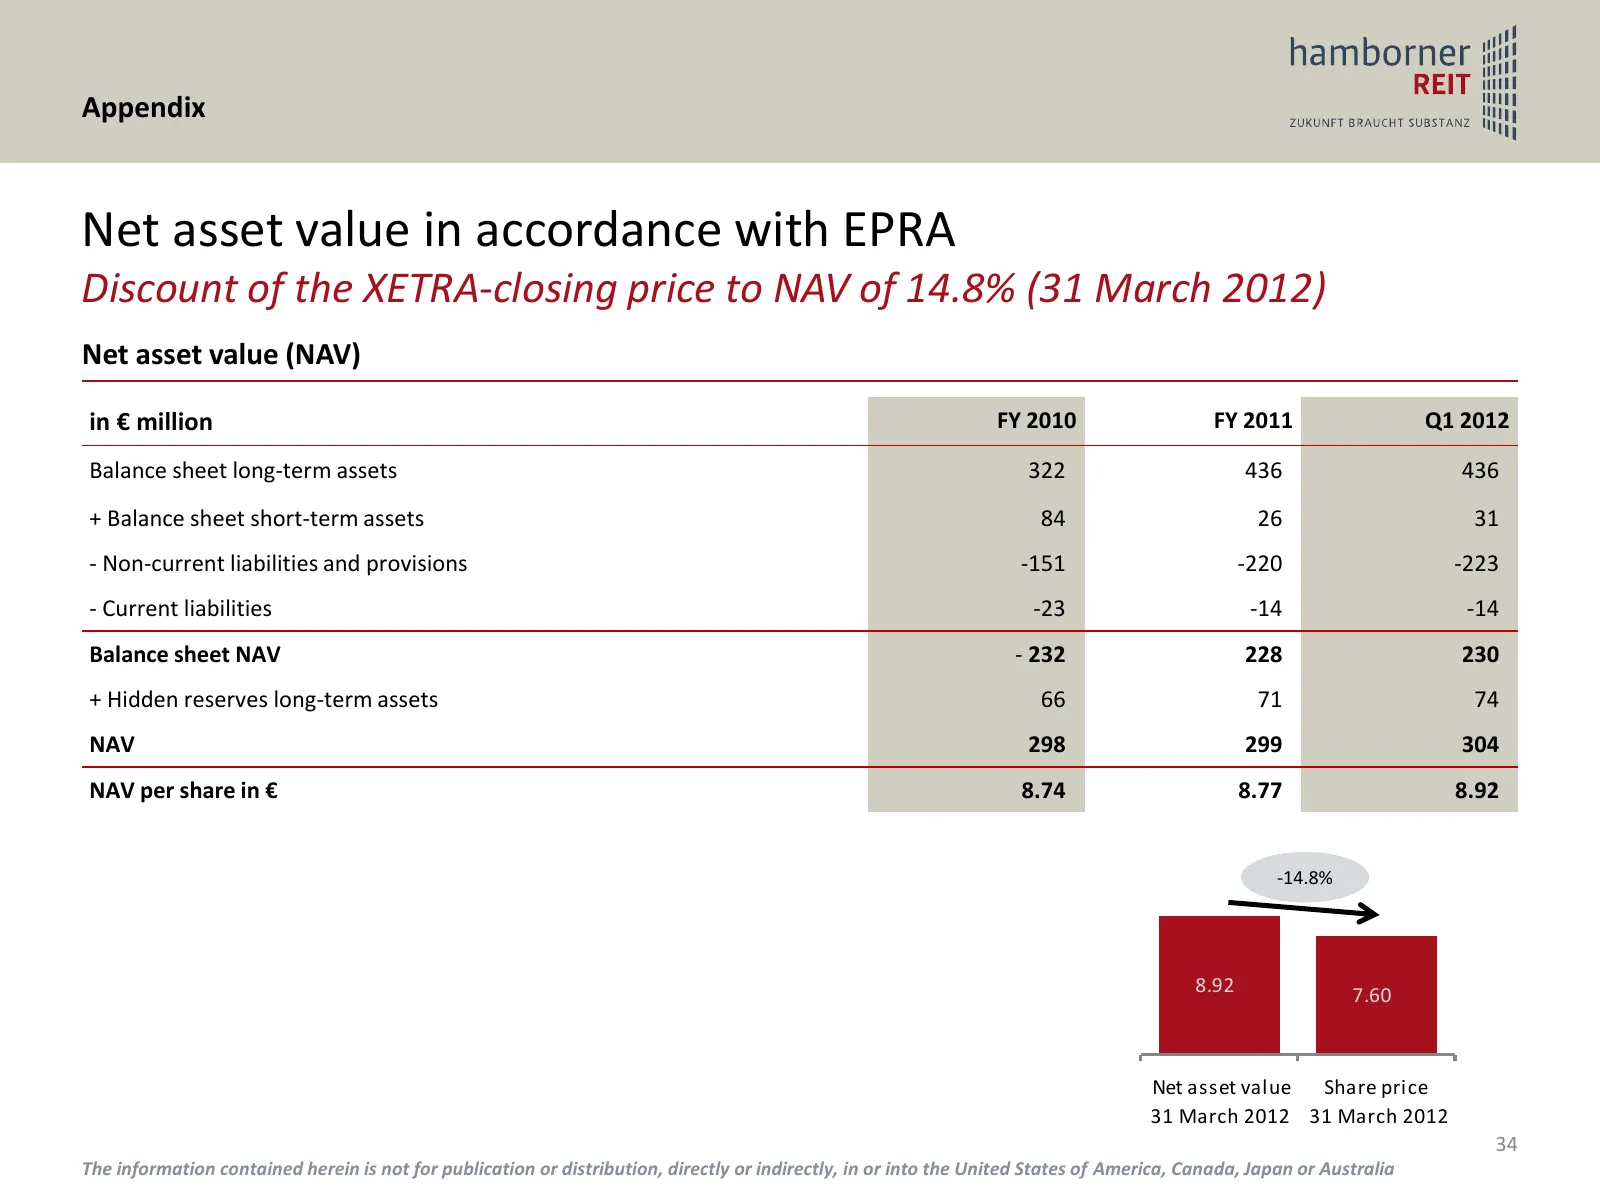
Slide 34: Net asset value in accordance with EPRA
Appendix Net asset value in accordance with EPRA Discount of the XETRA-closing price to NAV of 14.8% (31 March 2012) Net asset value (NAV) in € million FY 2010 FY 2011 Q1 2012 Balance sheet long-term assets 322 436 436 + Balance sheet short-term assets 84 26 31 - Non-current liabilities and provisio
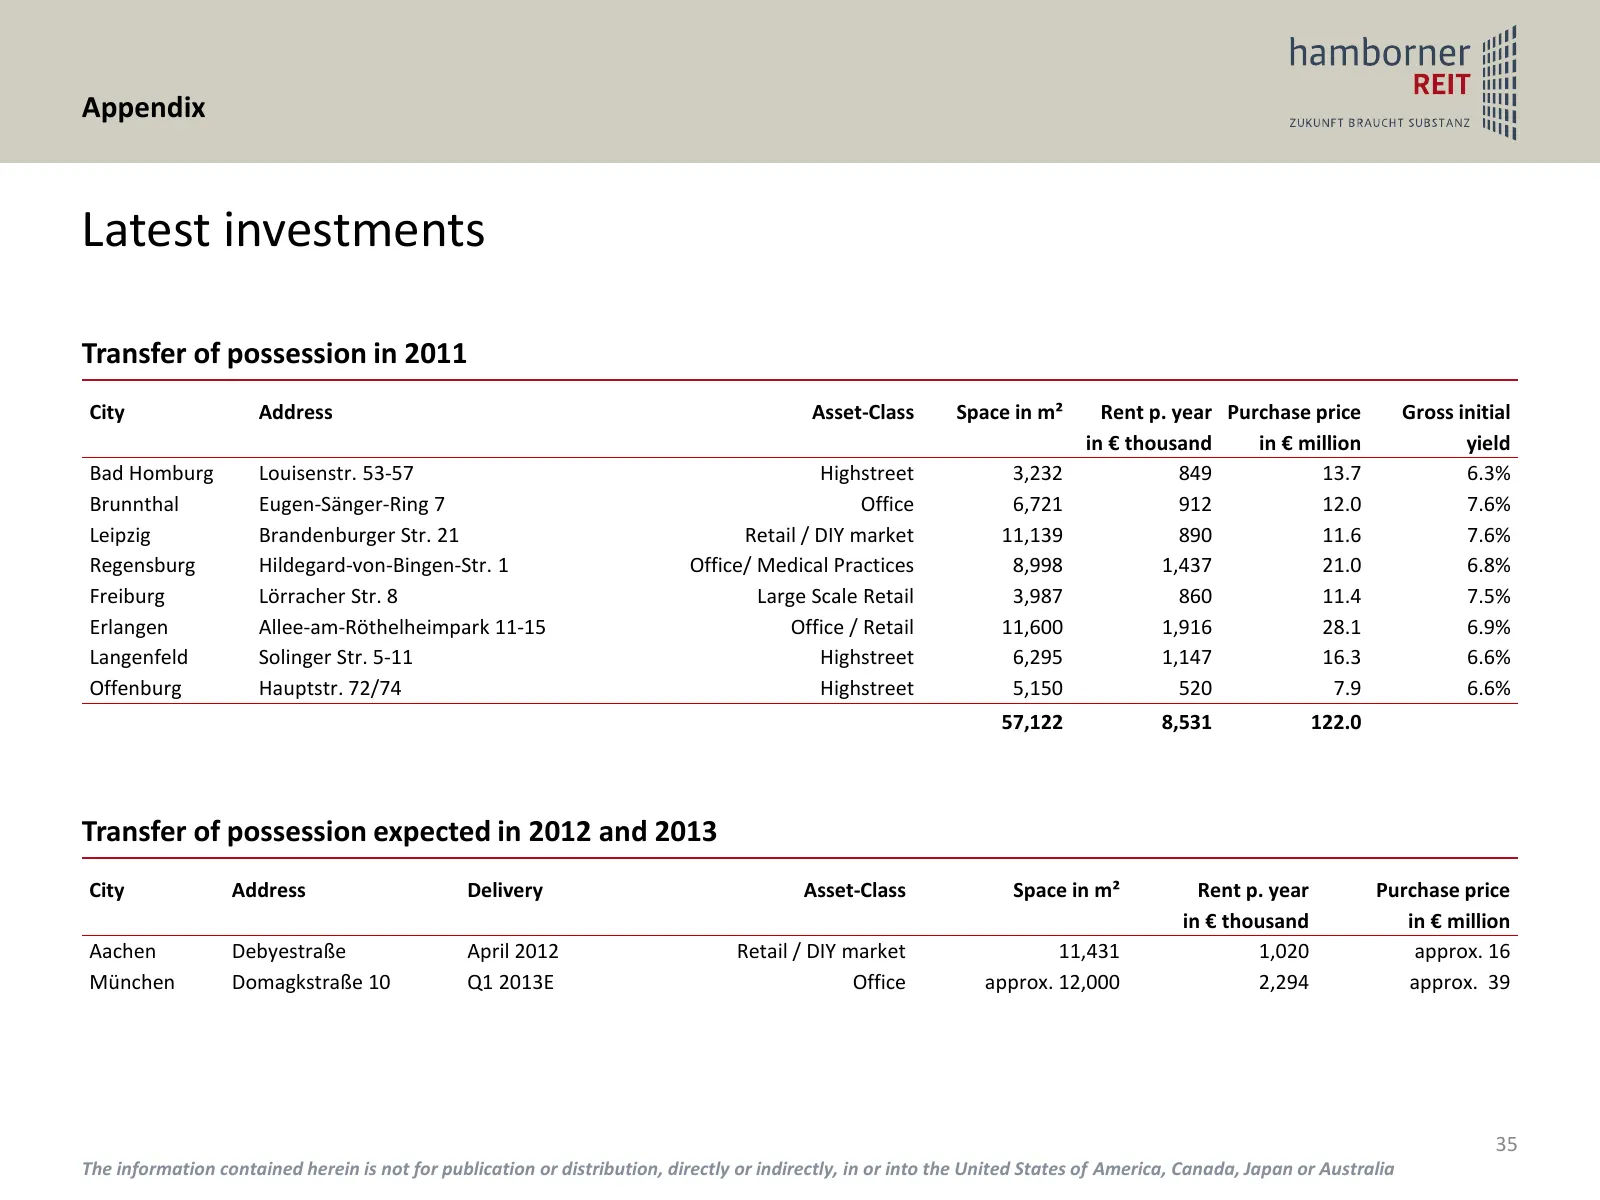
Slide 35: Latest investments
Appendix Latest investments Transfer of possession in 2011 City Address Asset-Class Space in m² Rent p. year Purchase price Gross initial in € thousand in € million yield Bad Homburg Louisenstr. 53-57 Highstreet 3,232 849 13.7 6.3% Brunnthal Eugen-Sänger-Ring 7 Office 6,721 912 12.0 7.6% Leipzig Bra
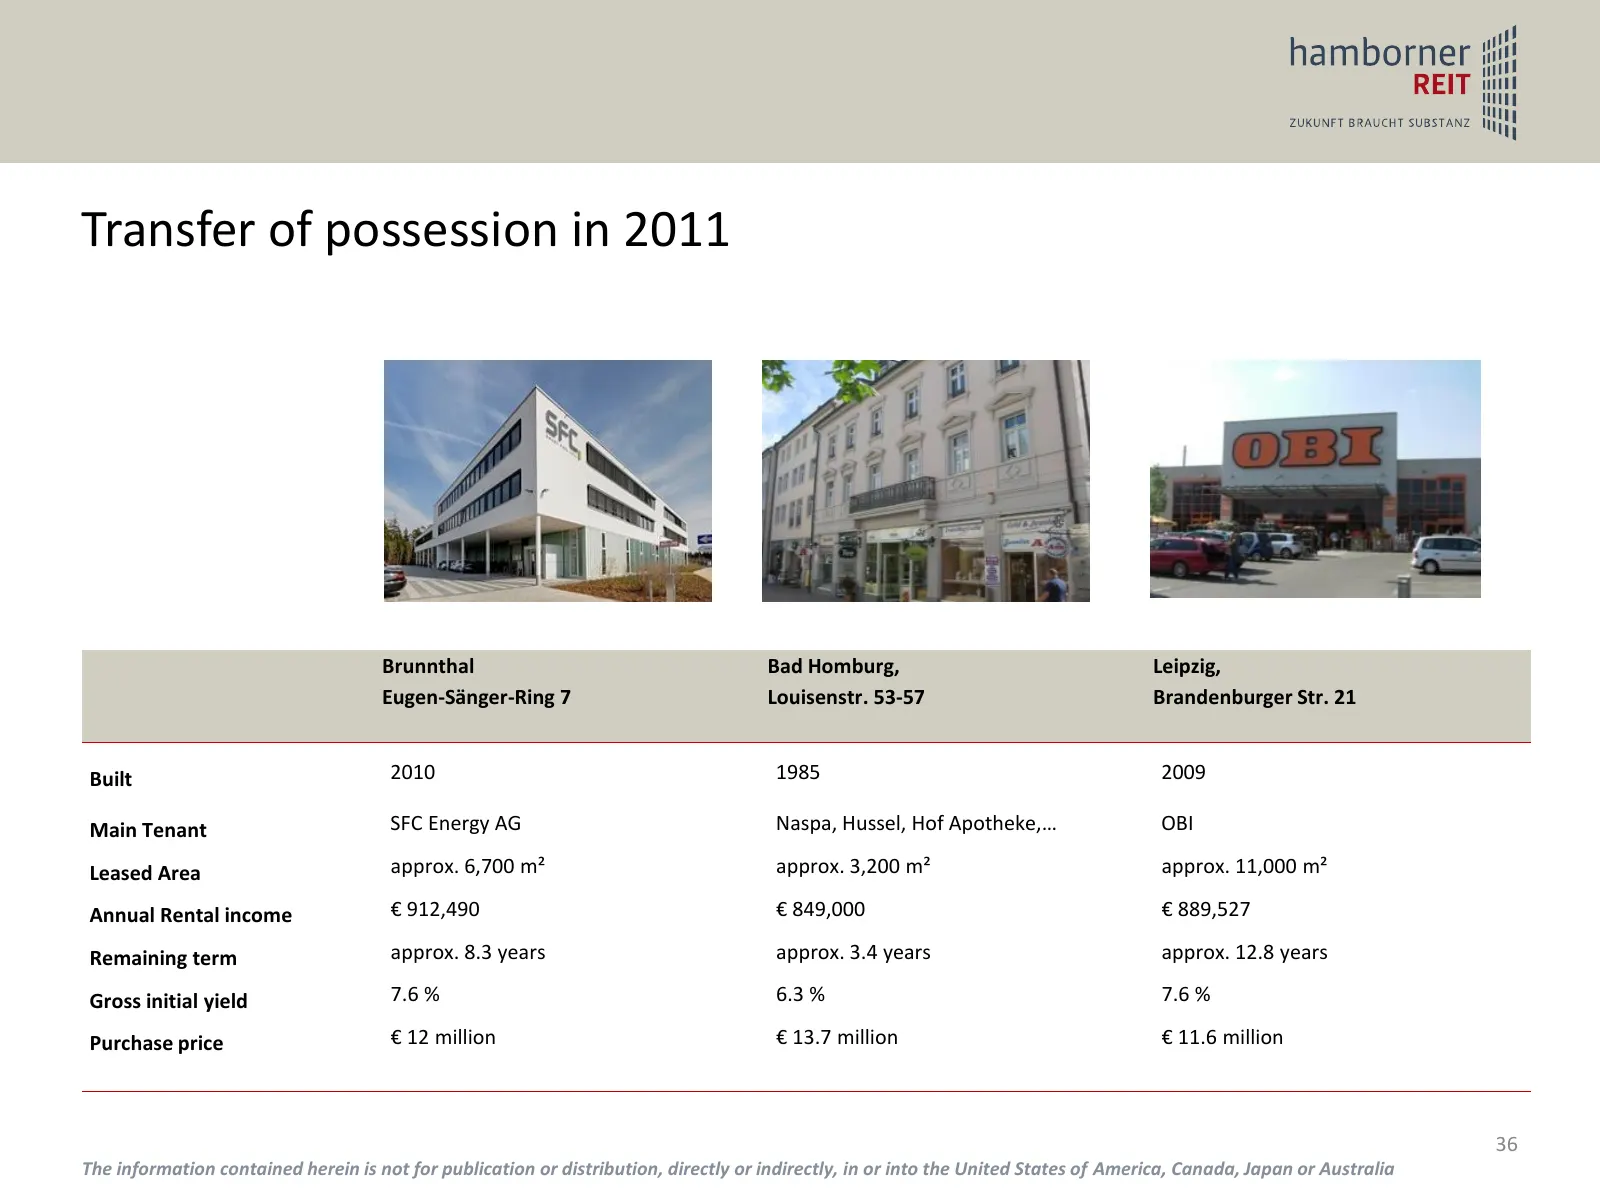
Slide 36: Transfer of possession in 2011
Transfer of possession in 2011 Brunnthal Bad Homburg, Leipzig, Eugen-Sänger-Ring 7 Louisenstr. 53-57 Brandenburger Str. 21 Built 2010 1985 2009 Main Tenant SFC Energy AG Naspa, Hussel, Hof Apotheke,… OBI Leased Area approx. 6,700 m² approx. 3,200 m² approx. 11,000 m² Annual Rental income € 912,490 €
Slide 37: Transfer of possession in 2011
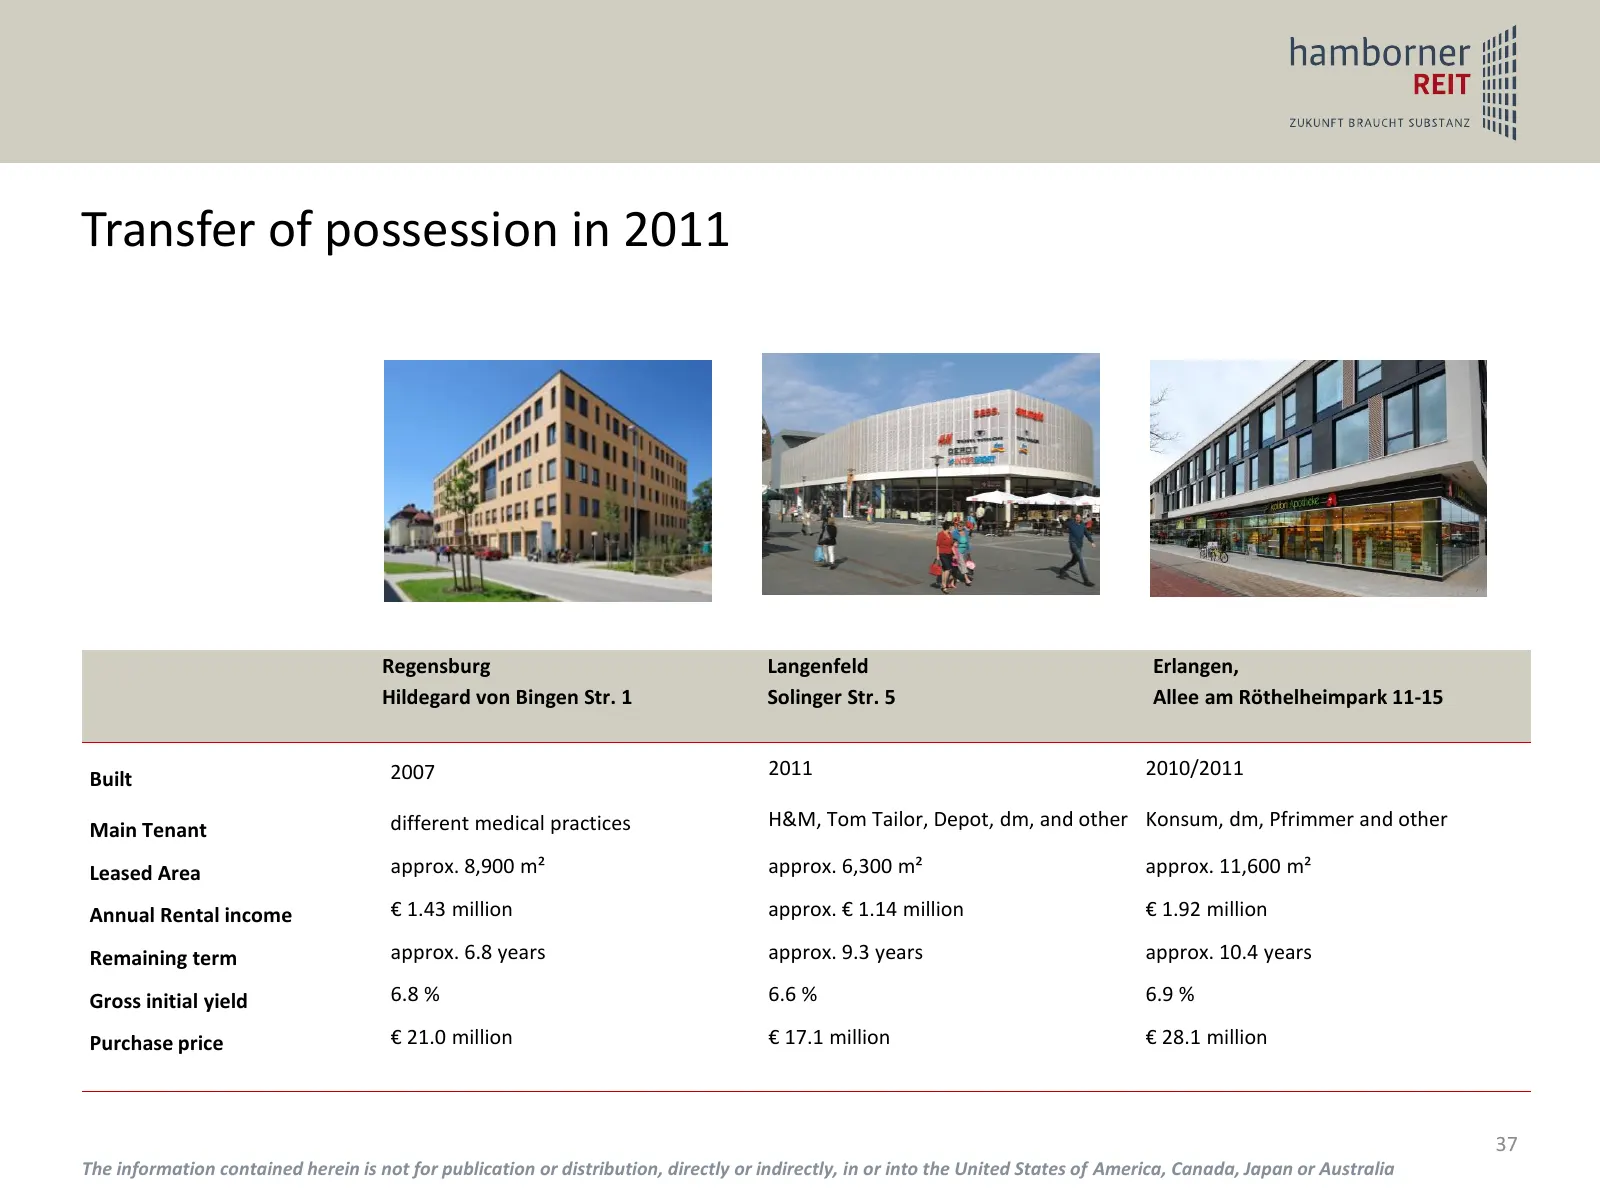
Transfer of possession in 2011 Regensburg Langenfeld Erlangen, Hildegard von Bingen Str. 1 Solinger Str. 5 Allee am Röthelheimpark 11-15 Built 2007 2011 2010/2011 Main Tenant different medical practices H&M, Tom Tailor, Depot, dm, and other Konsum, dm, Pfrimmer and other Leased Area approx. 8,900 m²
Slide 38: Transfer of possession in 2011 …in April 2012
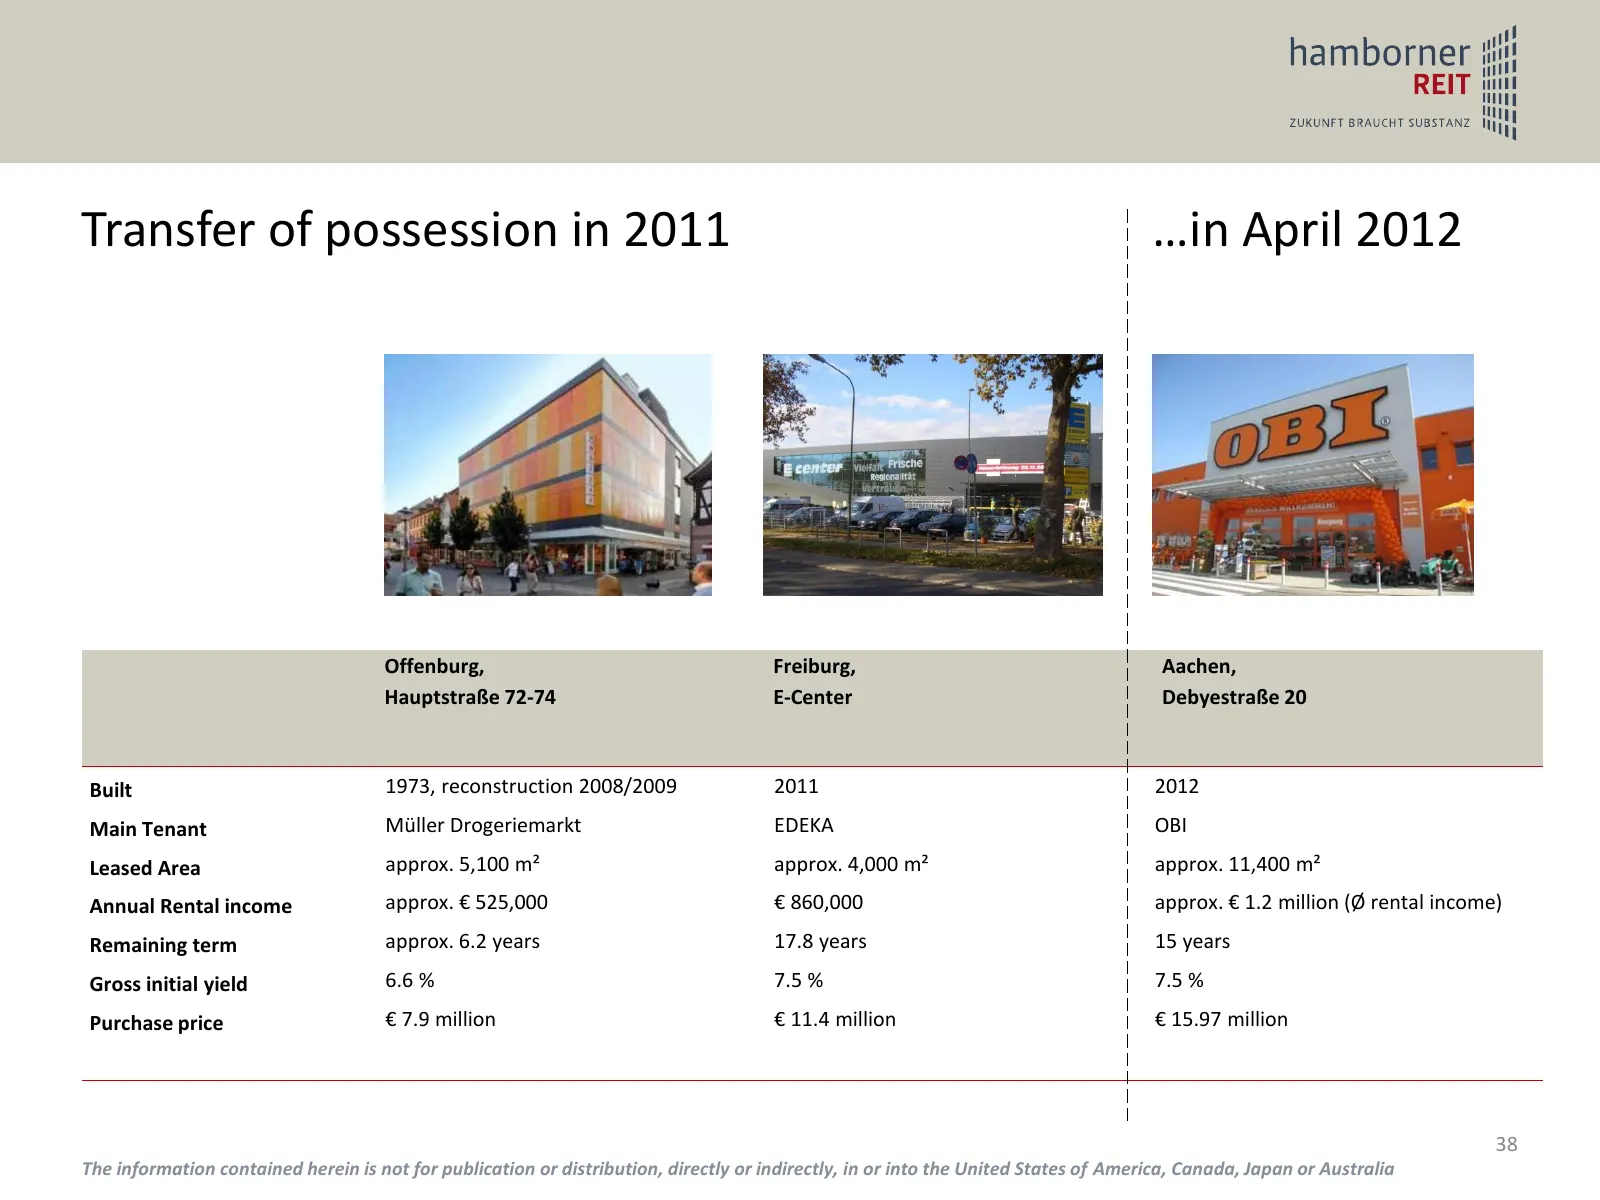
Transfer of possession in 2011 …in April 2012 Offenburg, Freiburg, Aachen, Hauptstraße 72-74 E-Center Debyestraße 20 Built 1973, reconstruction 2008/2009 2011 2012 Main Tenant Müller Drogeriemarkt EDEKA OBI Leased Area approx. 5,100 m² approx. 4,000 m² approx. 11,400 m² Annual Rental income approx.
Slide 39: Already signed, transfer of possession expected in 2013
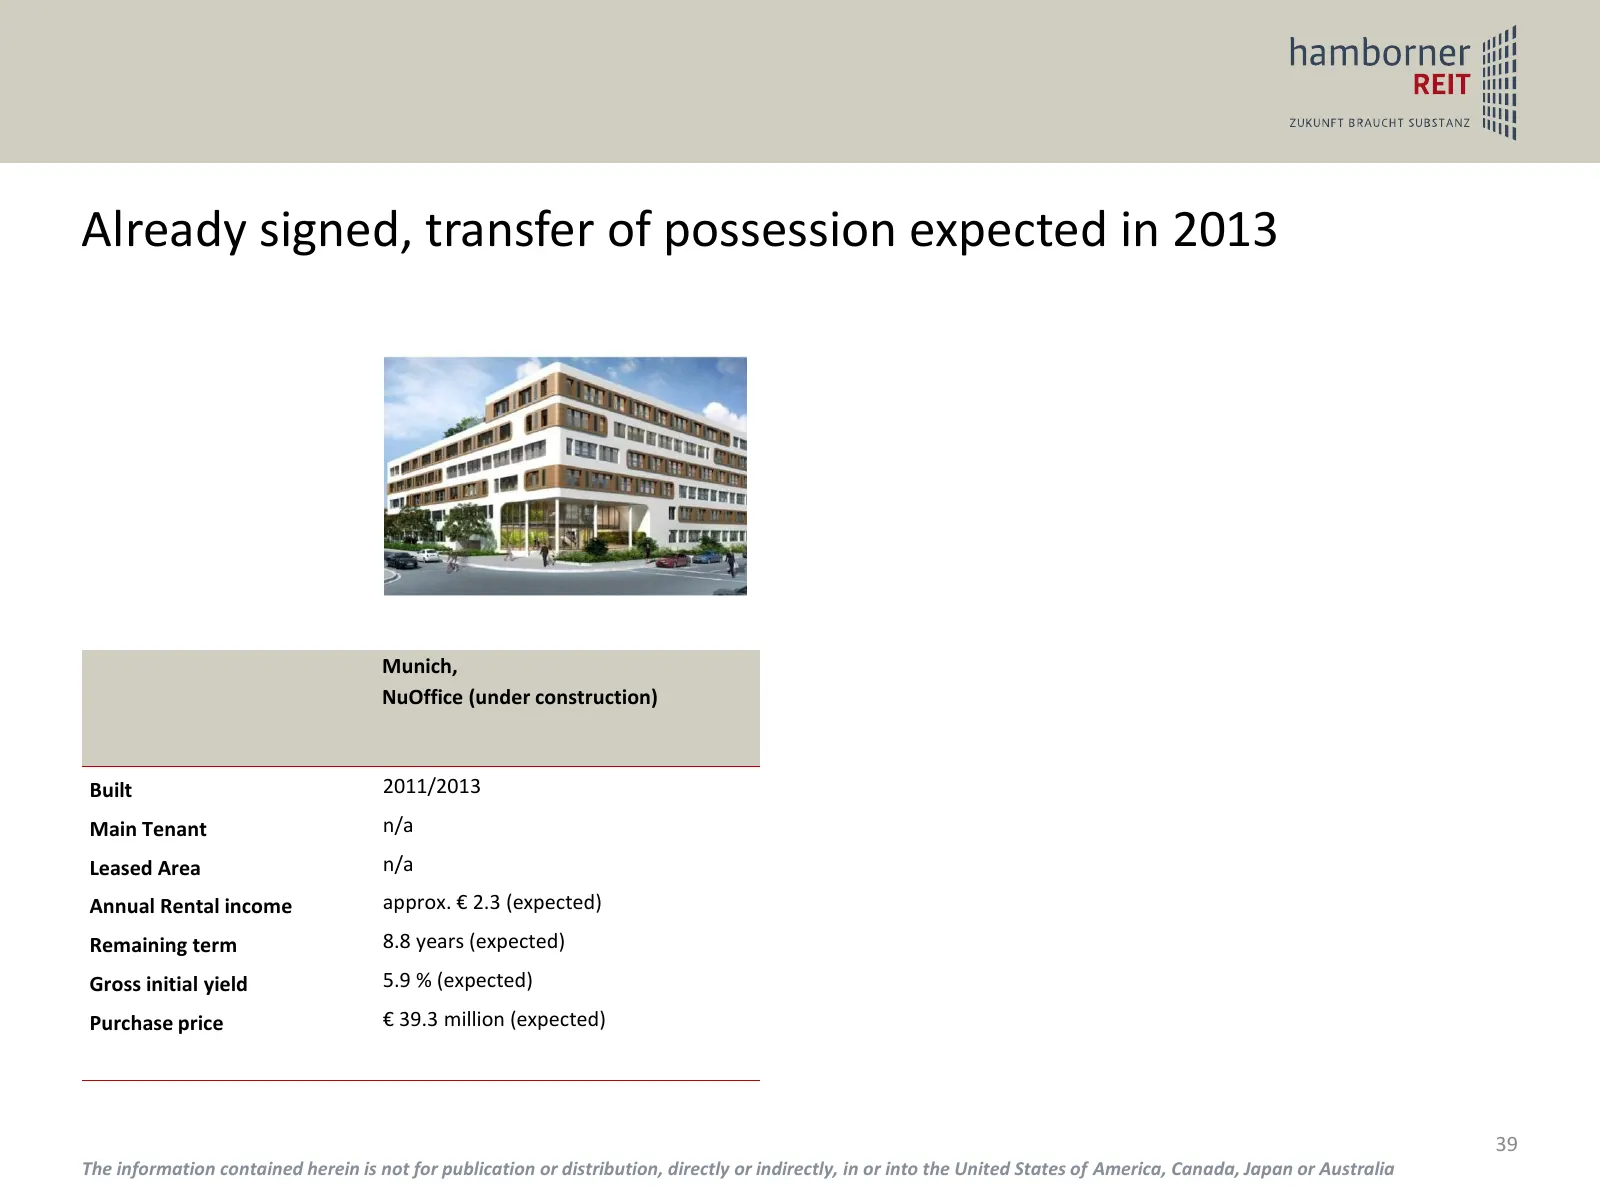
Already signed, transfer of possession expected in 2013 Munich, NuOffice (under construction) Built 2011/2013 Main Tenant n/a Leased Area n/a Annual Rental income approx. € 2.3 (expected) Remaining term 8.8 years (expected) Gross initial yield 5.9 % (expected) Purchase price € 39.3 million (expected
Slide 40: Disposals
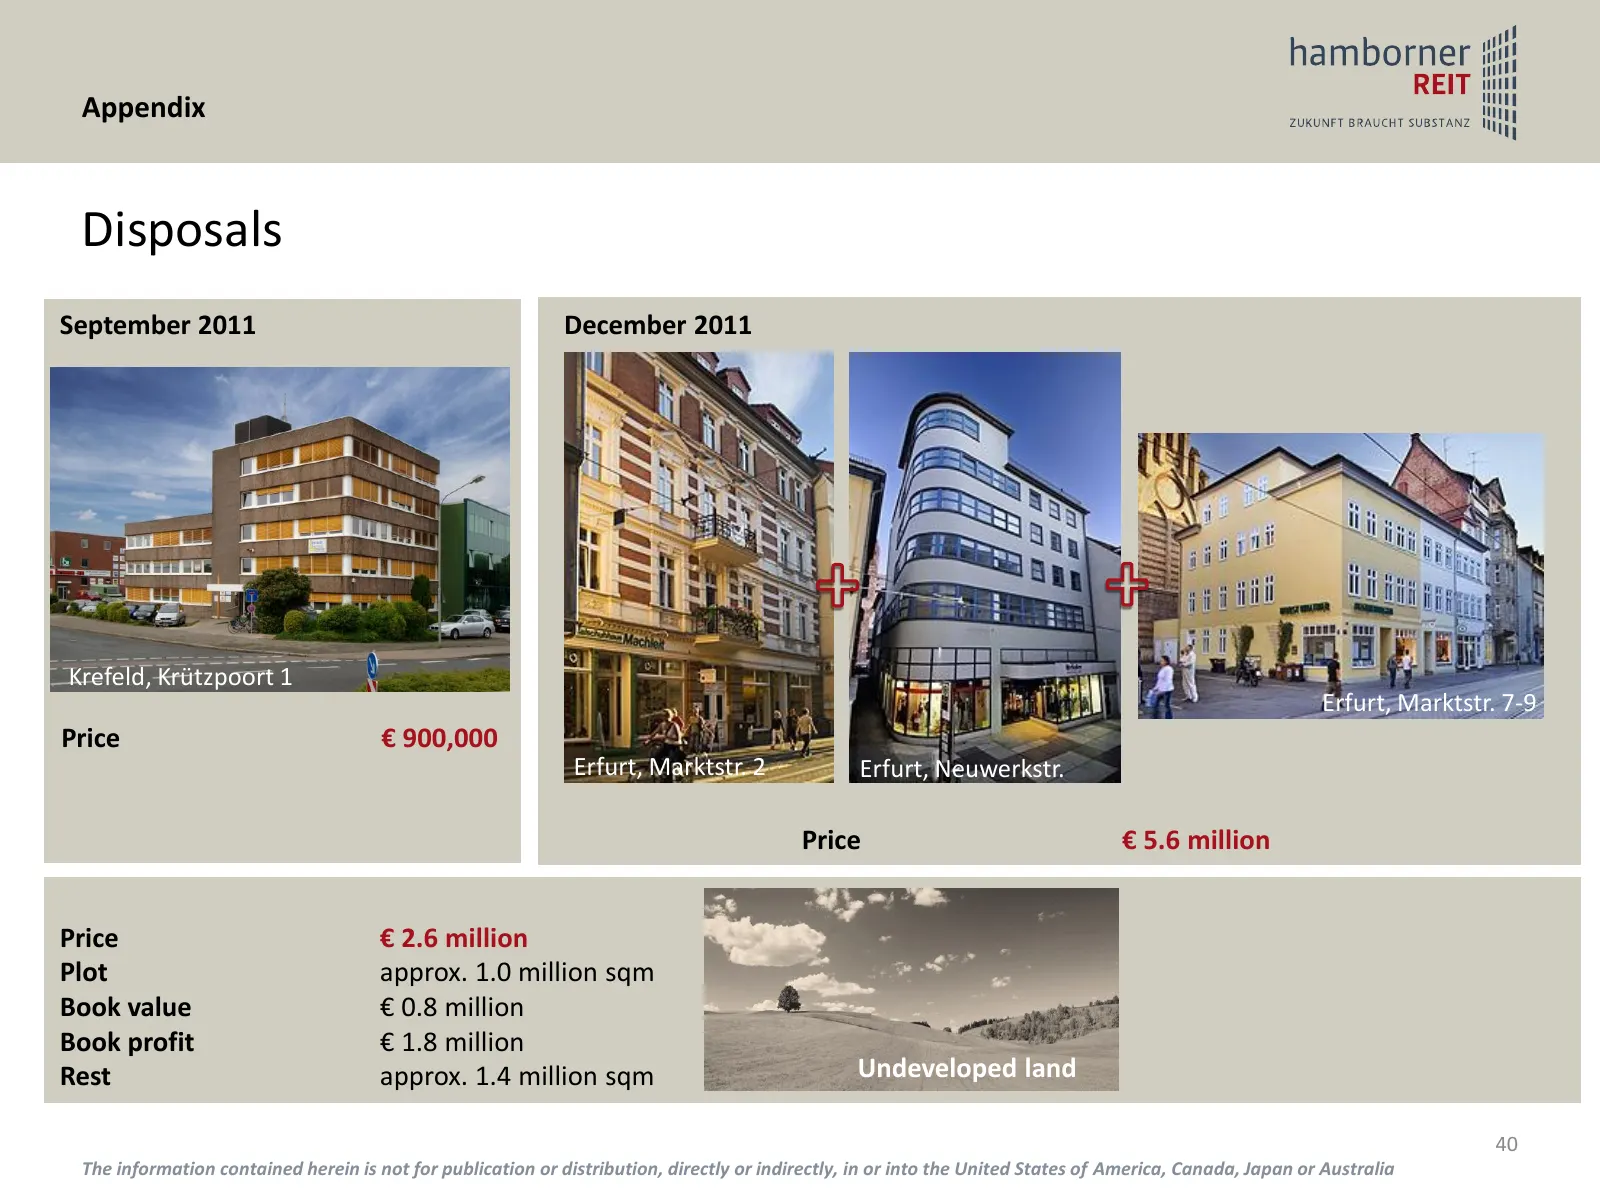
Appendix Disposals September 2011 December 2011 Krefeld, Krützpoort 1 Erfurt, Marktstr. 7-9 Price € 900,000 Erfurt, Marktstr. 2 Erfurt, Neuwerkstr. Price € 5.6 million Price € 2.6 million Plot approx. 1.0 million sqm Book value € 0.8 million Book profit € 1.8 million Rest approx. 1.4 million sqm Und
Slide 41: Financial Calendar
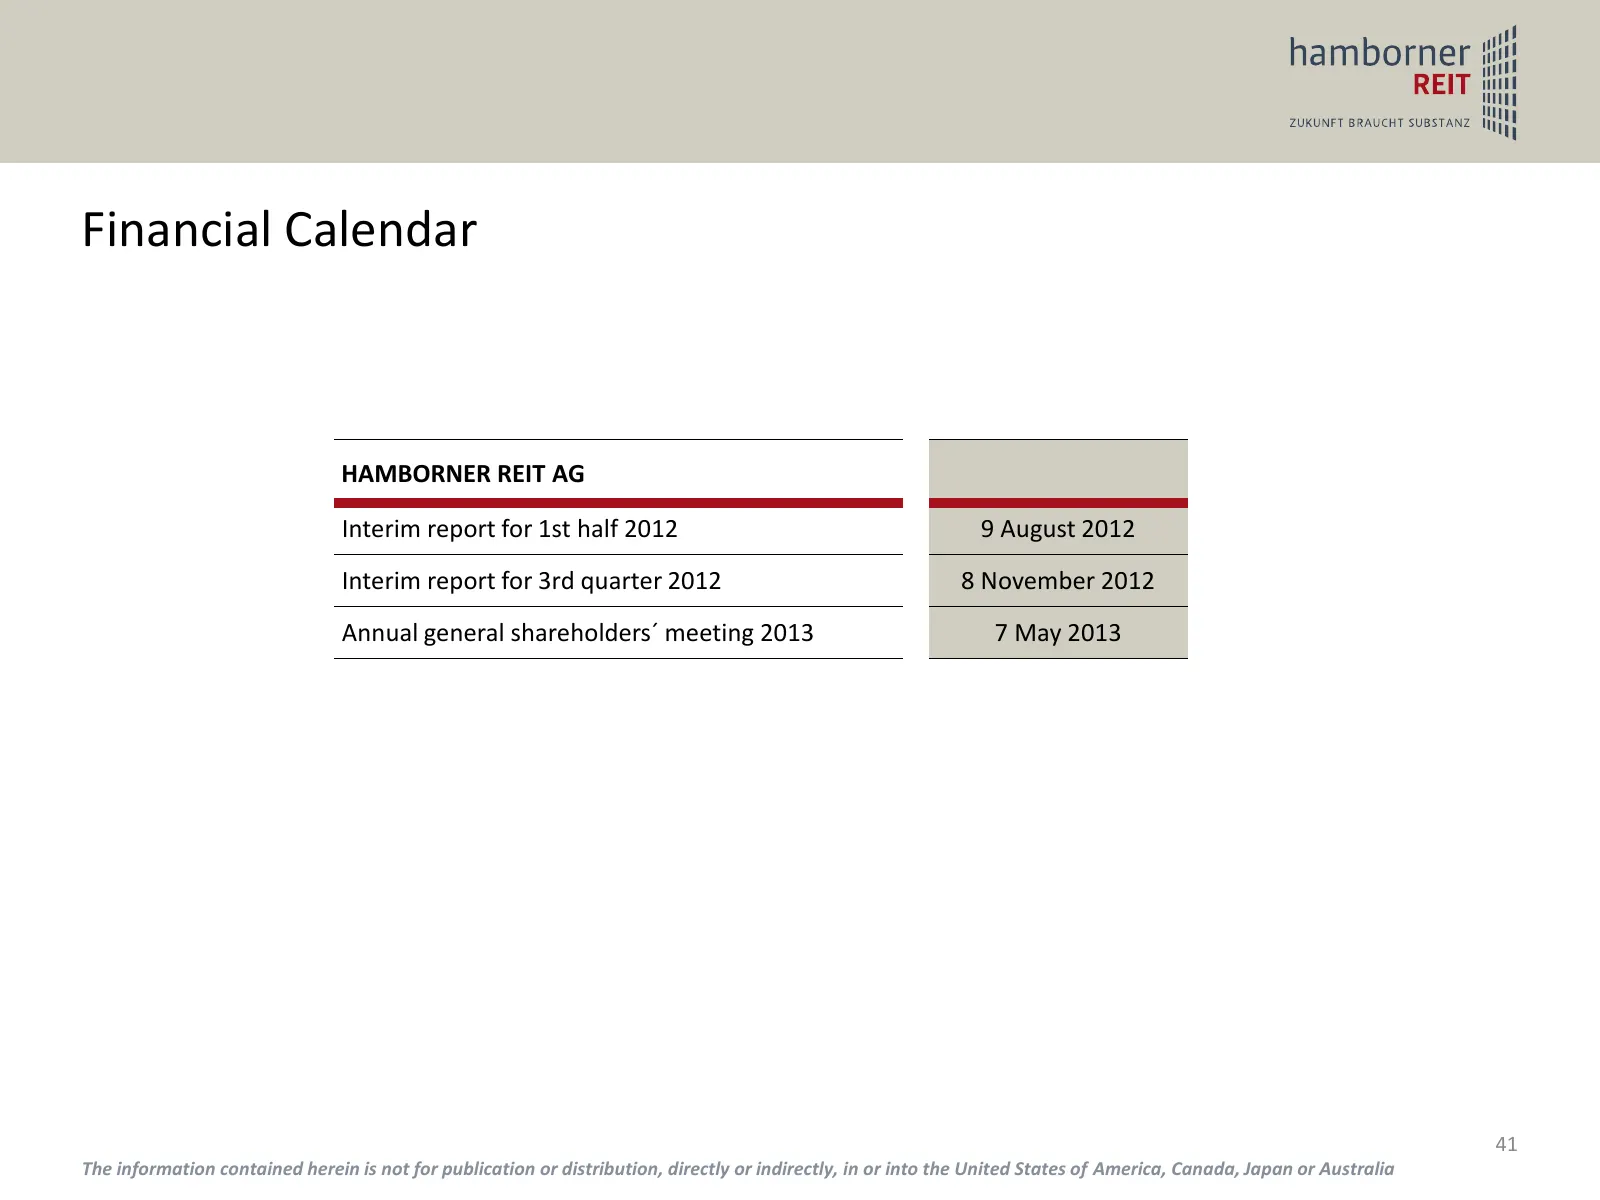
Financial Calendar HAMBORNER REIT AG Interim report for 1st half 2012 9 August 2012 Interim report for 3rd quarter 2012 8 November 2012 Annual general shareholders´ meeting 2013 7 May 2013 41 The information contained herein is not for publication or distribution, directly or indirectly, in or into
Slide 42: Contact
Contact Dr. Rüdiger Mrotzek – Member of the Board T +49 (0)203 / 54405-55 M r.mrotzek@hamborner.de Hans Richard Schmitz – Member of the Board T +49 (0)203 / 54405-21 M h.schmitz@hamborner.de Sybille Schlinge – Investor Relations T +49 (0)203 / 54405-32 M s.schlinge@hamborner.de 42 The information co
Slide 43: Disclaimer
Disclaimer This publication constitutes neither an offer to sell nor a solicitation to buy or subscribe to securities. Any such offer is being made solely on the basis of the Securities Prospectus published and registered with the German Financial Supervisory Authority (BaFin), and the rights offeri
Source: Internet Archive copy of hamborner.de
More decks from Hamborner REIT AG
 9M 2026 Earnings Presentation10 slides · Nov 10, 2026
 Fact Sheet (November 2026)2 slides · November 2026
 Investor Presentation (November 2026)35 slides · November 2026
 Investor Presentation (November 2026)35 slides · November 2026
 Fact Sheet (September 2026)2 slides · Sep 30, 2026
 Investor Presentation (September 2026)36 slides · September 2026