USS Co., Ltd. · TSE:4732
USS — Q2 2027 Earnings Presentation
40 slides from USS's earnings presentation, Nov 20, 2026
Slide 1: Consolidated Results of Operations
Q2 FY2 26 Consolidated Results of Operations USS Co., Ltd. November 2026 FY2026 (FY3/2027) : from April 1, 2026 to March 31, 2027
Slide 2: Contents
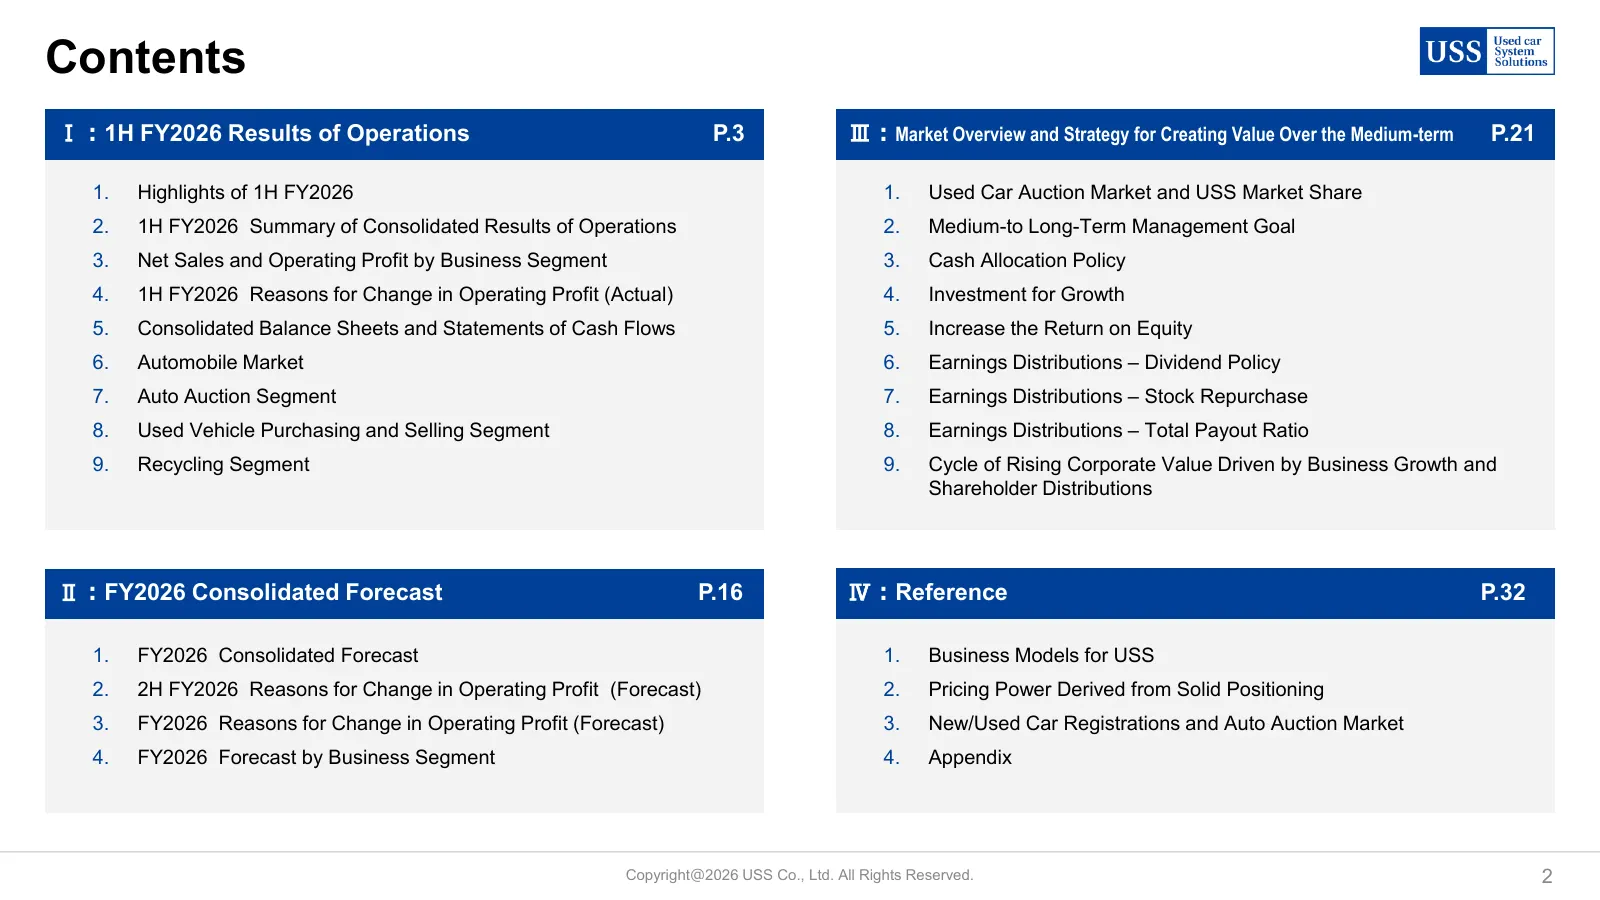
Contents Ⅰ:1H FY2026 Results of Operations P.3 Ⅲ:Market Overview and Strategy for Creating Value Over the Medium-term P.21 1. Highlights of 1H FY2026 1. Used Car Auction Market and USS Market Share 2. 1H FY2026 Summary of Consolidated Results of Operations 2. Medium-to Long-Term Management Goal 3. N
Slide 3: 1H FY2026 Results of Operations
1H FY2026 Results of Operations Copyright@2026 USS Co., Ltd. All Rights Reserved. 3
Slide 4: Highlights of 1H FY2026
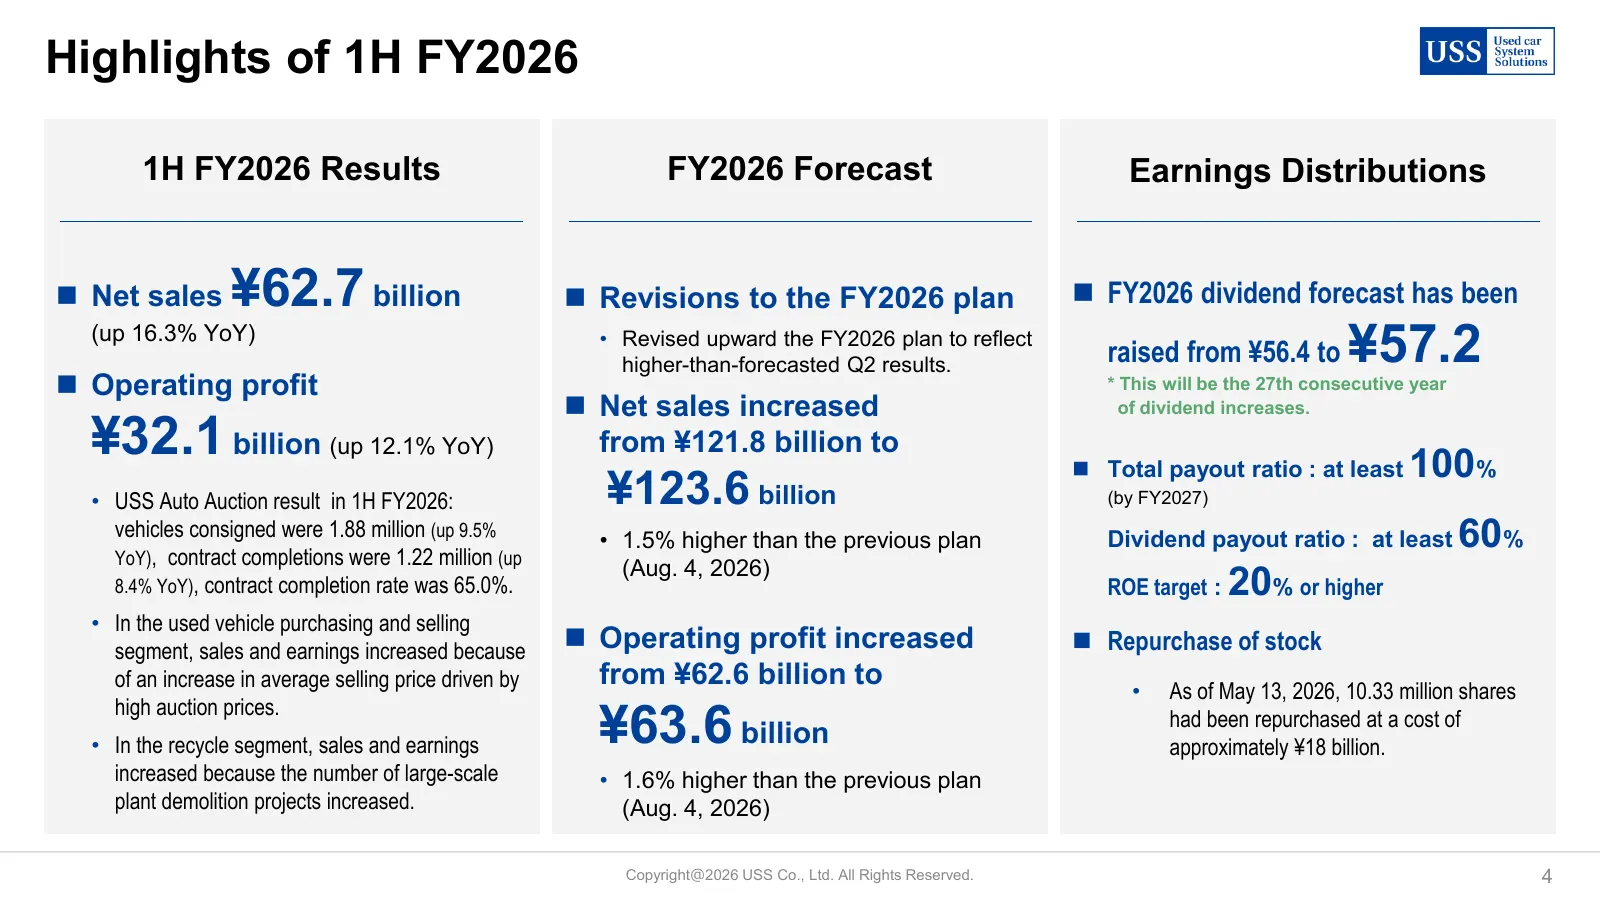
Highlights of 1H FY2026 1H FY2026 Results FY2026 Forecast Earnings Distributions 株主還元 ◼ Net sales ¥62.7 billion ◼ Revisions to the FY2026 plan ◼ FY2026 dividend forecast has been (up 16.3% YoY) • Revised upward the FY2026 plan to reflect higher-than-forecasted Q2 results. raised from ¥56.4 to ¥57.2
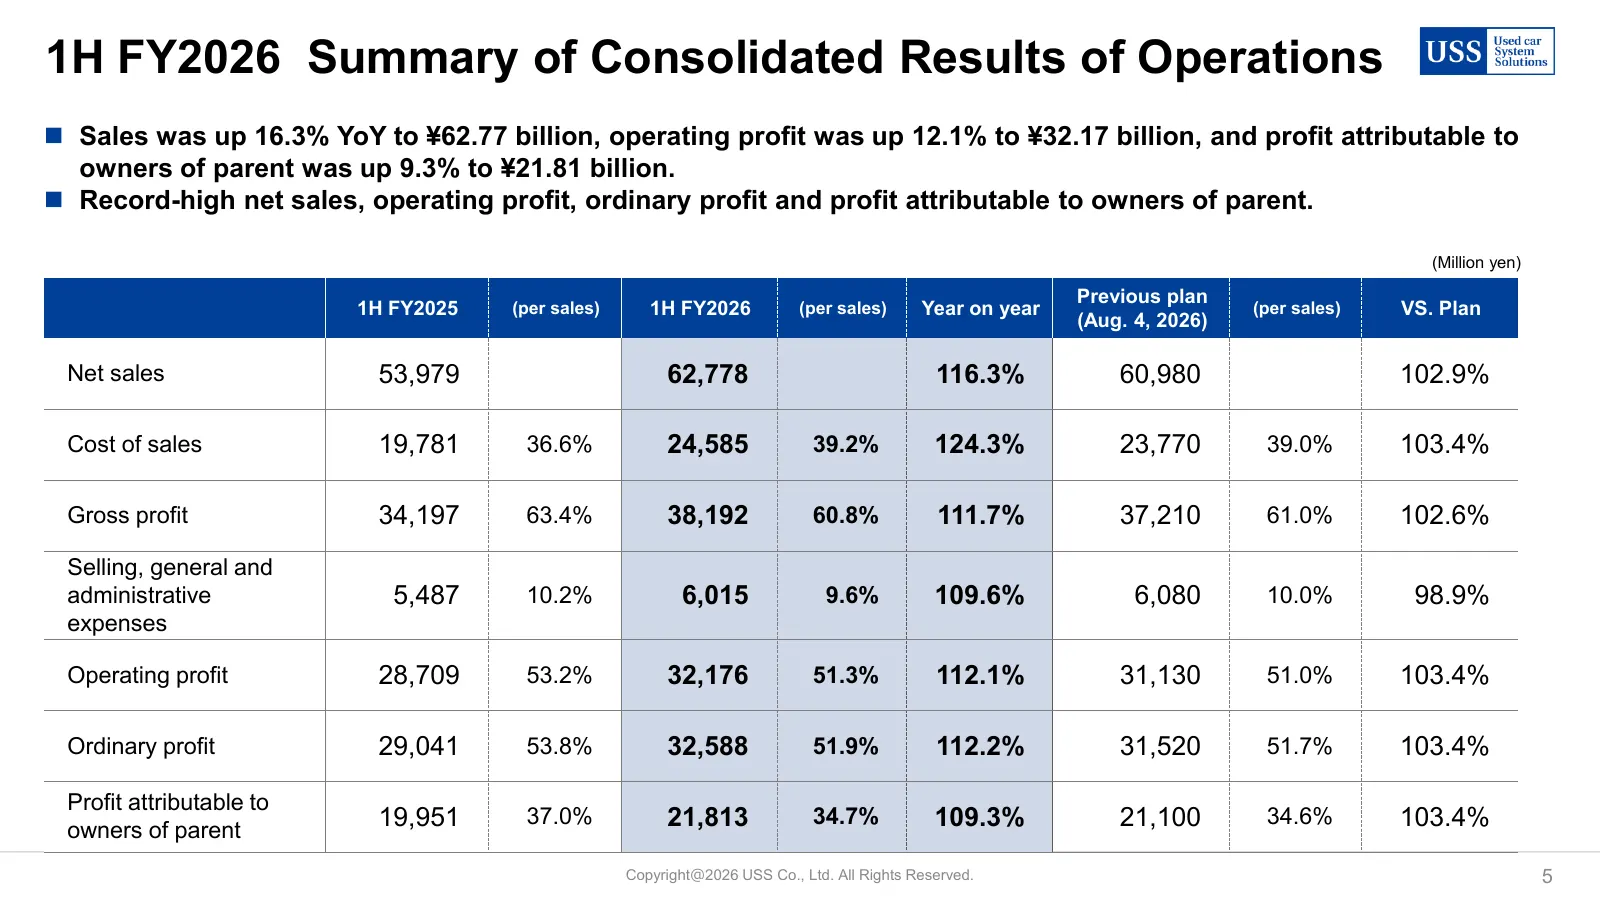
Slide 5: 1H FY2026 Summary of Consolidated Results of Operations
1H FY2026 Summary of Consolidated Results of Operations ◼ Sales was up 16.3% YoY to ¥62.77 billion, operating profit was up 12.1% to ¥32.17 billion, and profit attributable to owners of parent was up 9.3% to ¥21.81 billion. ◼ Record-high net sales, operating profit, ordinary profit and profit attrib
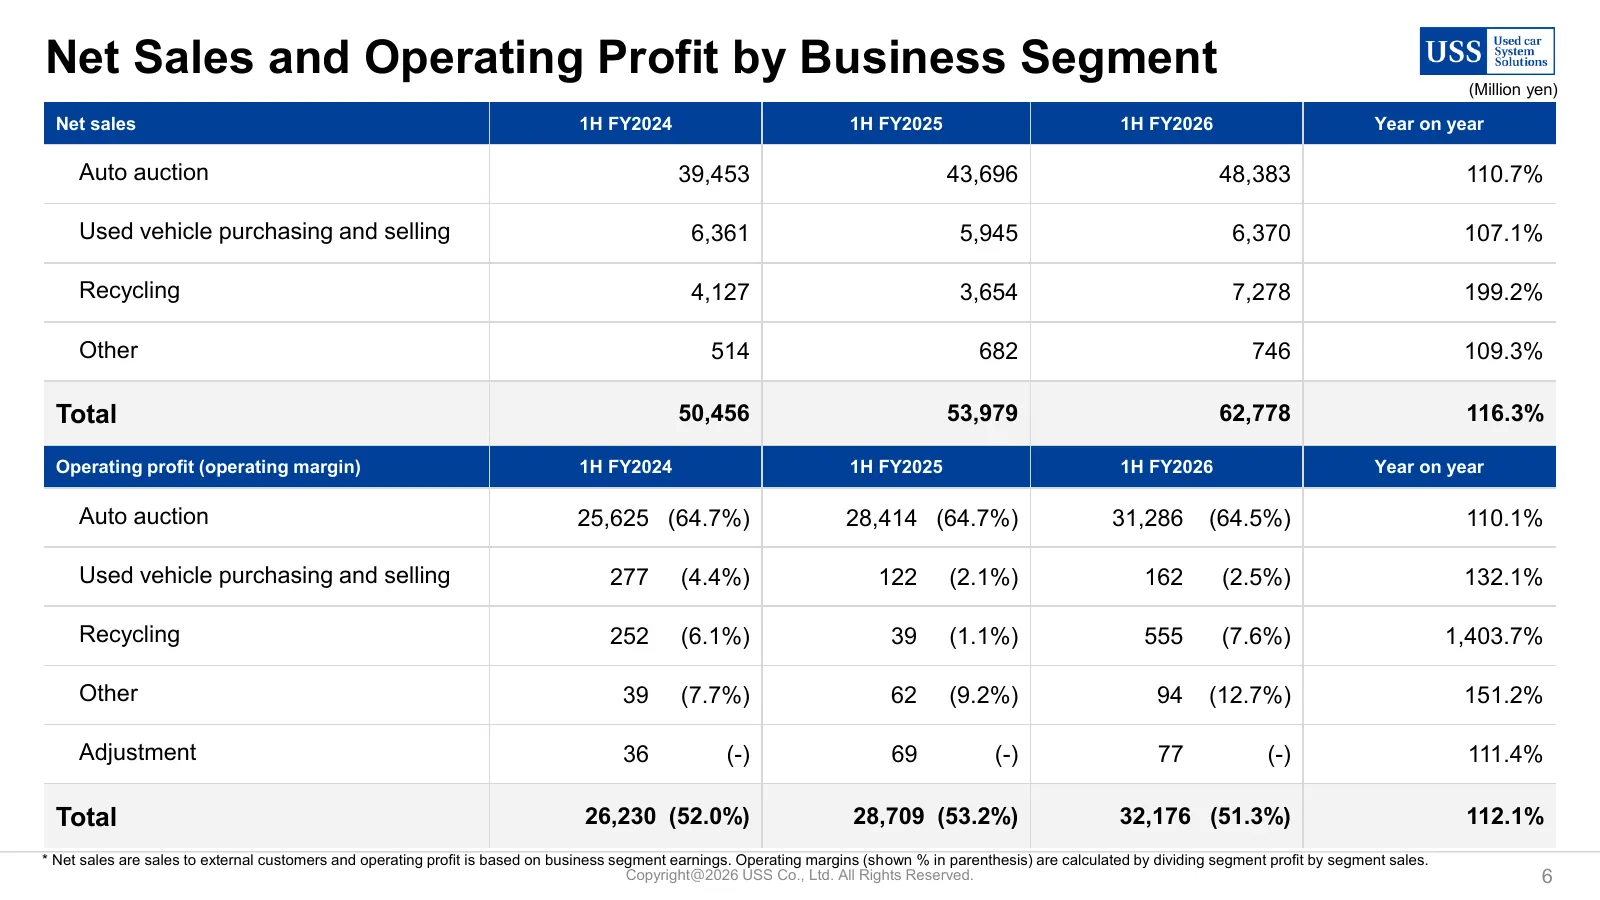
Slide 6: Net Sales and Operating Profit by Business Segment
Net Sales and Operating Profit by Business Segment (Million yen) Net sales 1H FY2024 1H FY2025 1H FY2026 Year on year Auto auction 39,453 43,696 48,383 110.7% Used vehicle purchasing and selling 6,361 5,945 6,370 107.1% Recycling 4,127 3,654 7,278 199.2% Other 514 682 746 109.3% Total 50,456 53,979
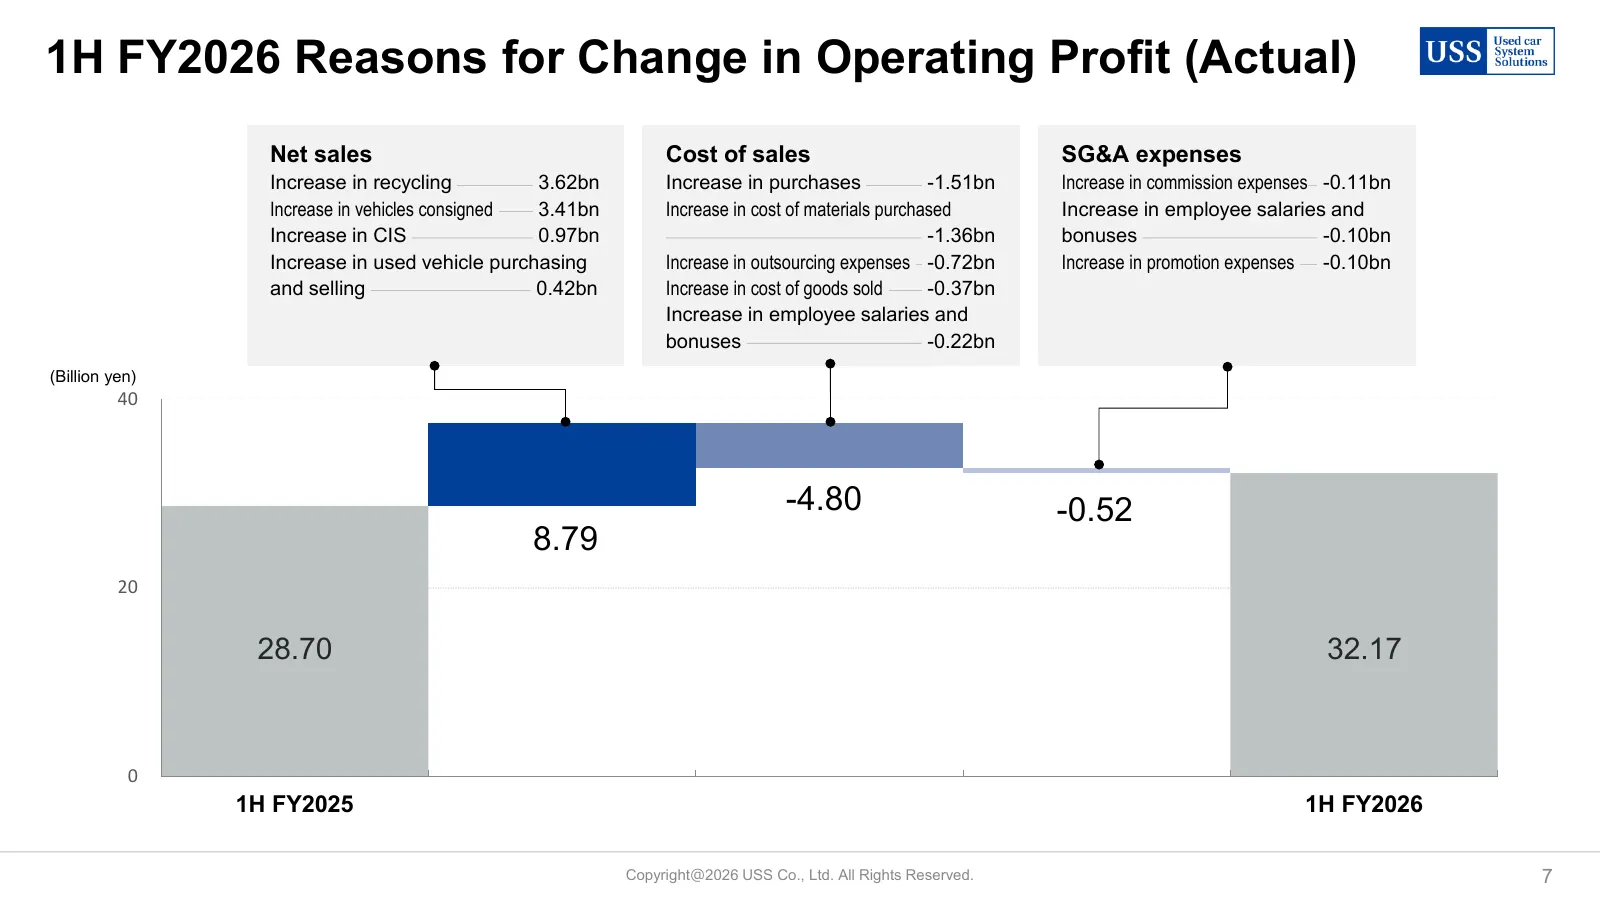
Slide 7: 1H FY2026 Reasons for Change in Operating Profit (Actual)
1H FY2026 Reasons for Change in Operating Profit (Actual) Net sales Cost of sales SG&A expenses Increase in recycling 3.62bn Increase in purchases -1.51bn Increase in commission expenses -0.11bn Increase in vehicles consigned 3.41bn Increase in cost of materials purchased Increase in employee salari
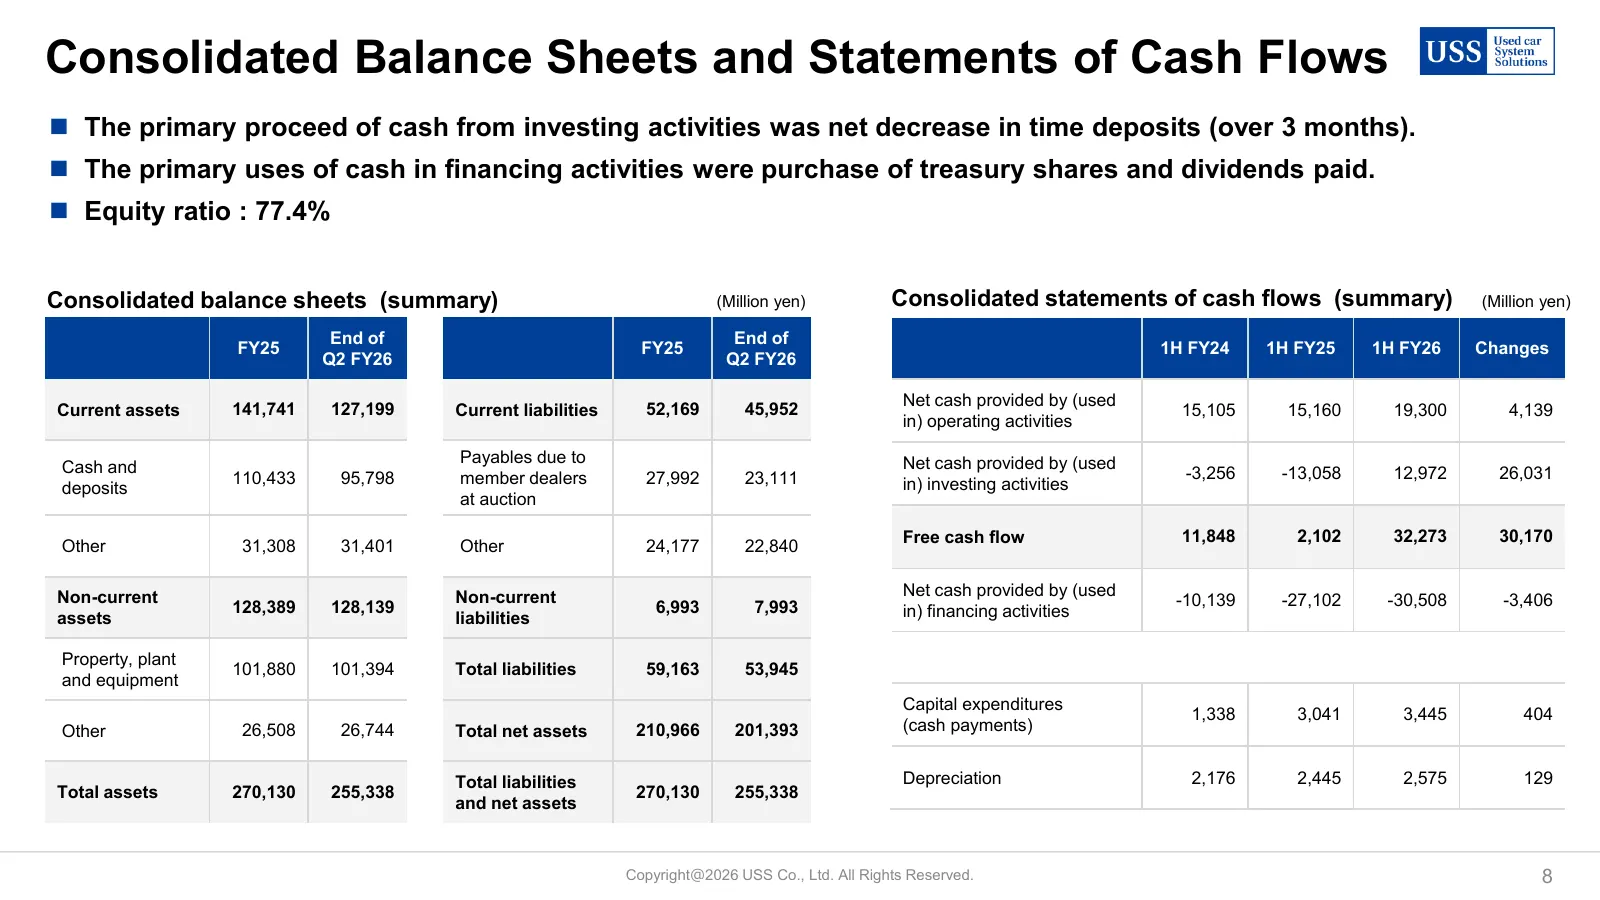
Slide 8: Consolidated Balance Sheets and Statements of Cash Flows
Consolidated Balance Sheets and Statements of Cash Flows ◼ The primary proceed of cash from investing activities was net decrease in time deposits (over 3 months). ◼ The primary uses of cash in financing activities were purchase of treasury shares and dividends paid. ◼ Equity ratio : 77.4% Consolida
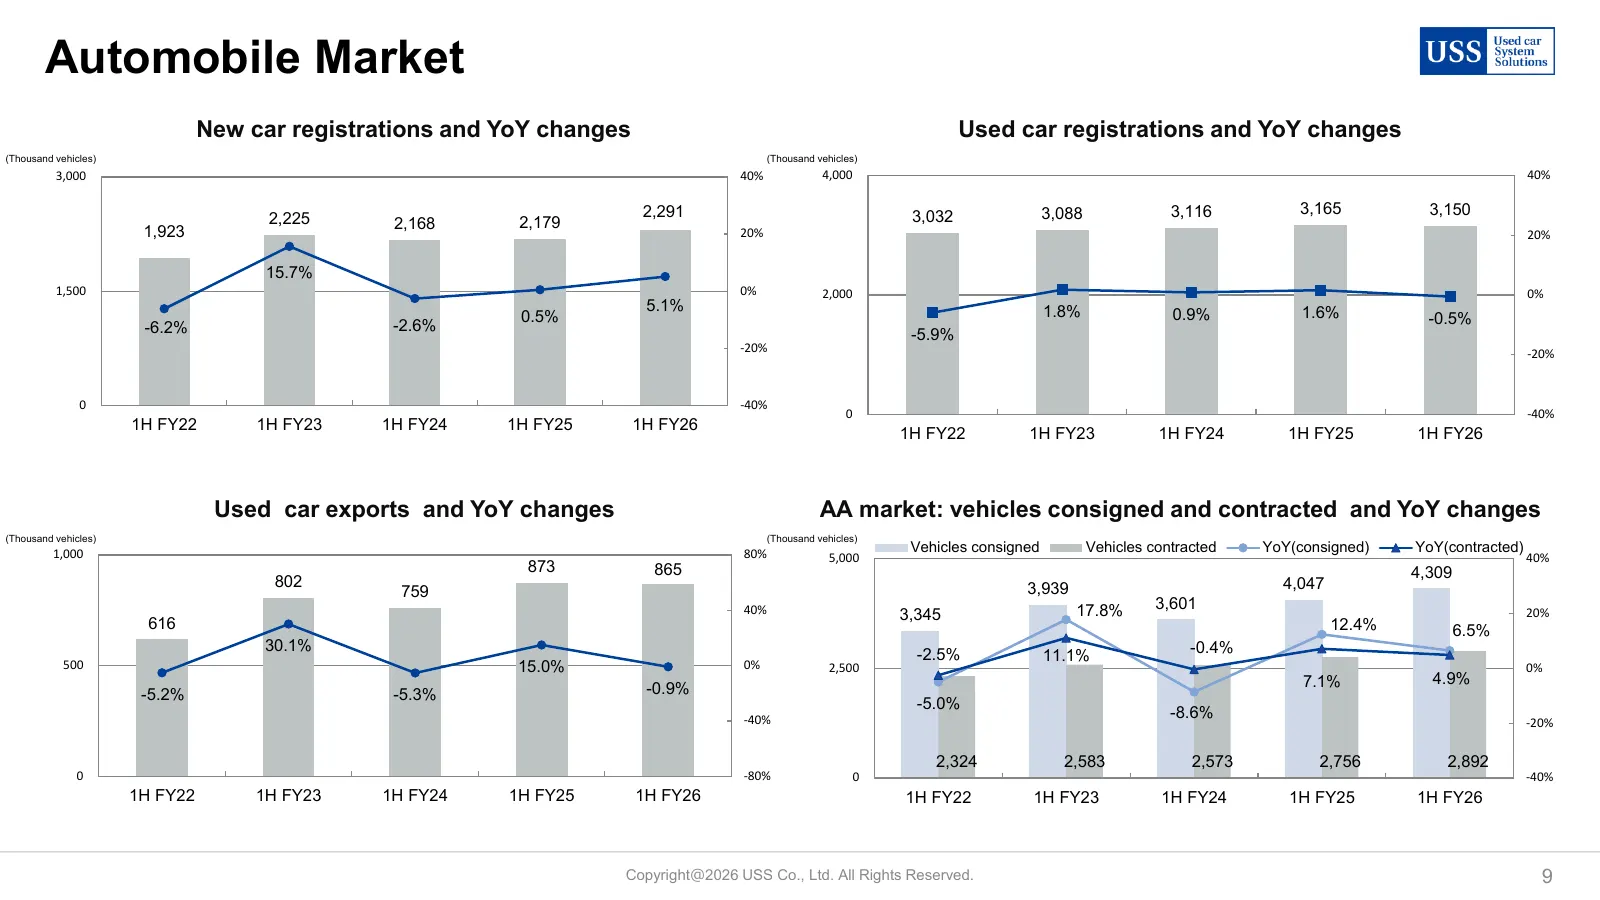
Slide 9: Automobile Market
Automobile Market New car registrations and YoY changes Used car registrations and YoY changes (Thousand vehicles) (Thousand vehicles) 3,000 40% 4,000 40% 2,291 3,032 3,088 3,116 3,165 3,150 2,225 2,168 2,179 1,923 20% 20% 15.7% 1,500 0% 2,000 0% 5.1% 1.8% 1.6% 0.5% 0.9% -0.5% -6.2% -2.6% -5.9% -20%
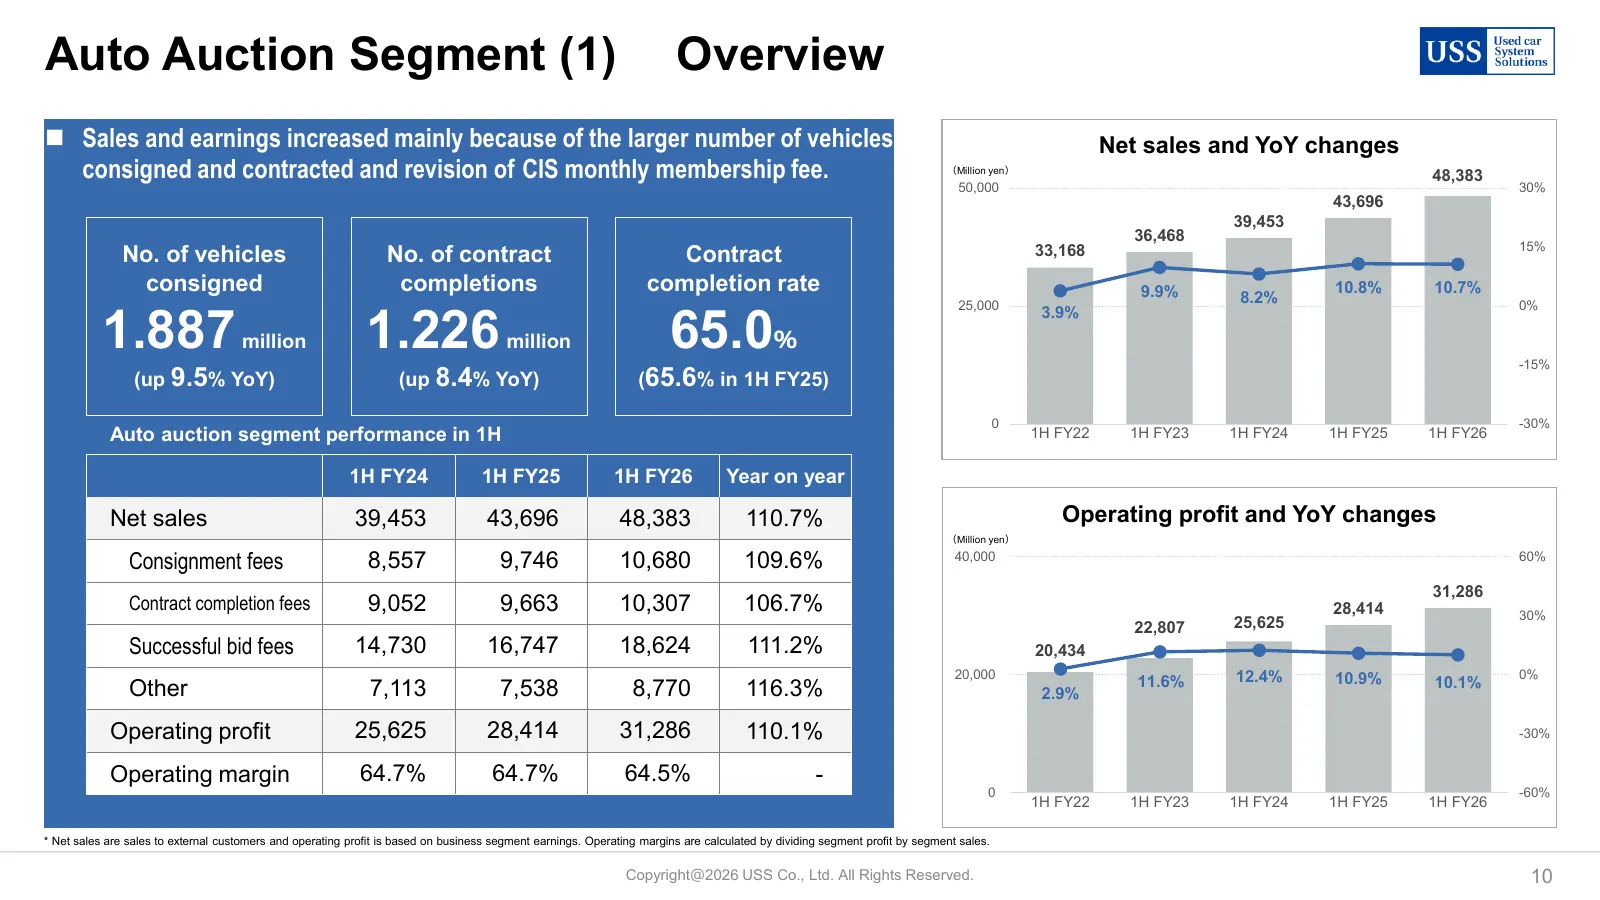
Slide 10: Auto Auction Segment (1) Overview
Auto Auction Segment (1) Overview ◼ Sales and earnings increased mainly because of the larger number of vehicles Net sales and YoY changes consigned and contracted and revision of CIS monthly membership fee. (Million yen) 48,383 50,000 30% 43,696 39,453 36,468 33,168 15% No. of vehicles No. of contr
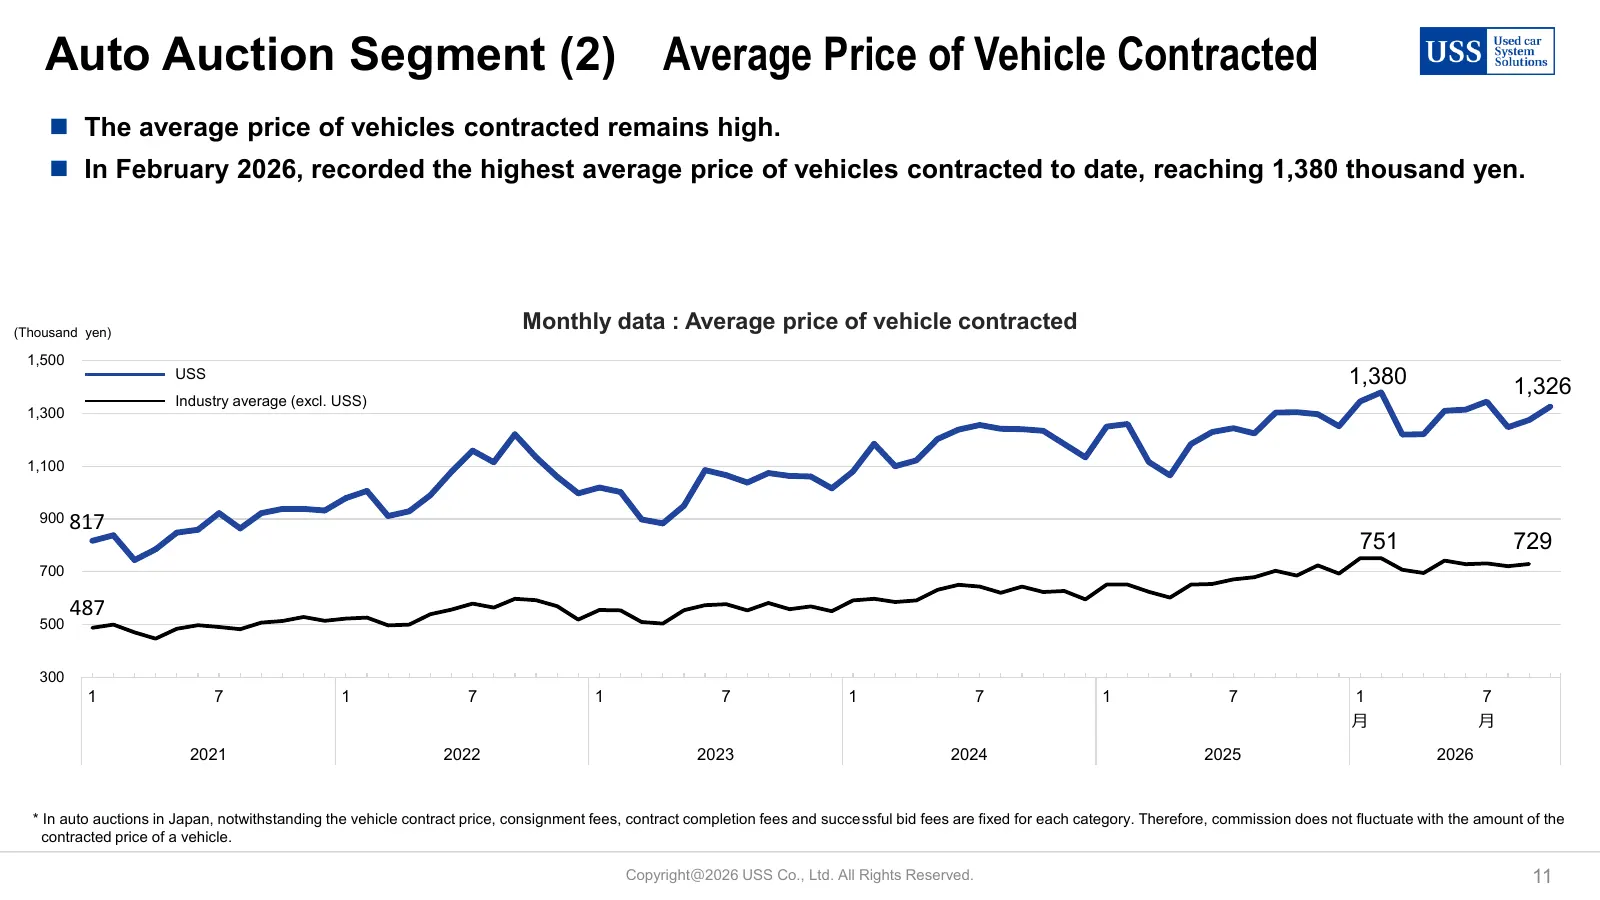
Slide 11: Auto Auction Segment (2) Average Price of Vehicle Contracted
Auto Auction Segment (2) Average Price of Vehicle Contracted ◼ The average price of vehicles contracted remains high. ◼ In February 2026, recorded the highest average price of vehicles contracted to date, reaching 1,380 thousand yen. (Thousand yen) Monthly data : Average price of vehicle contracted
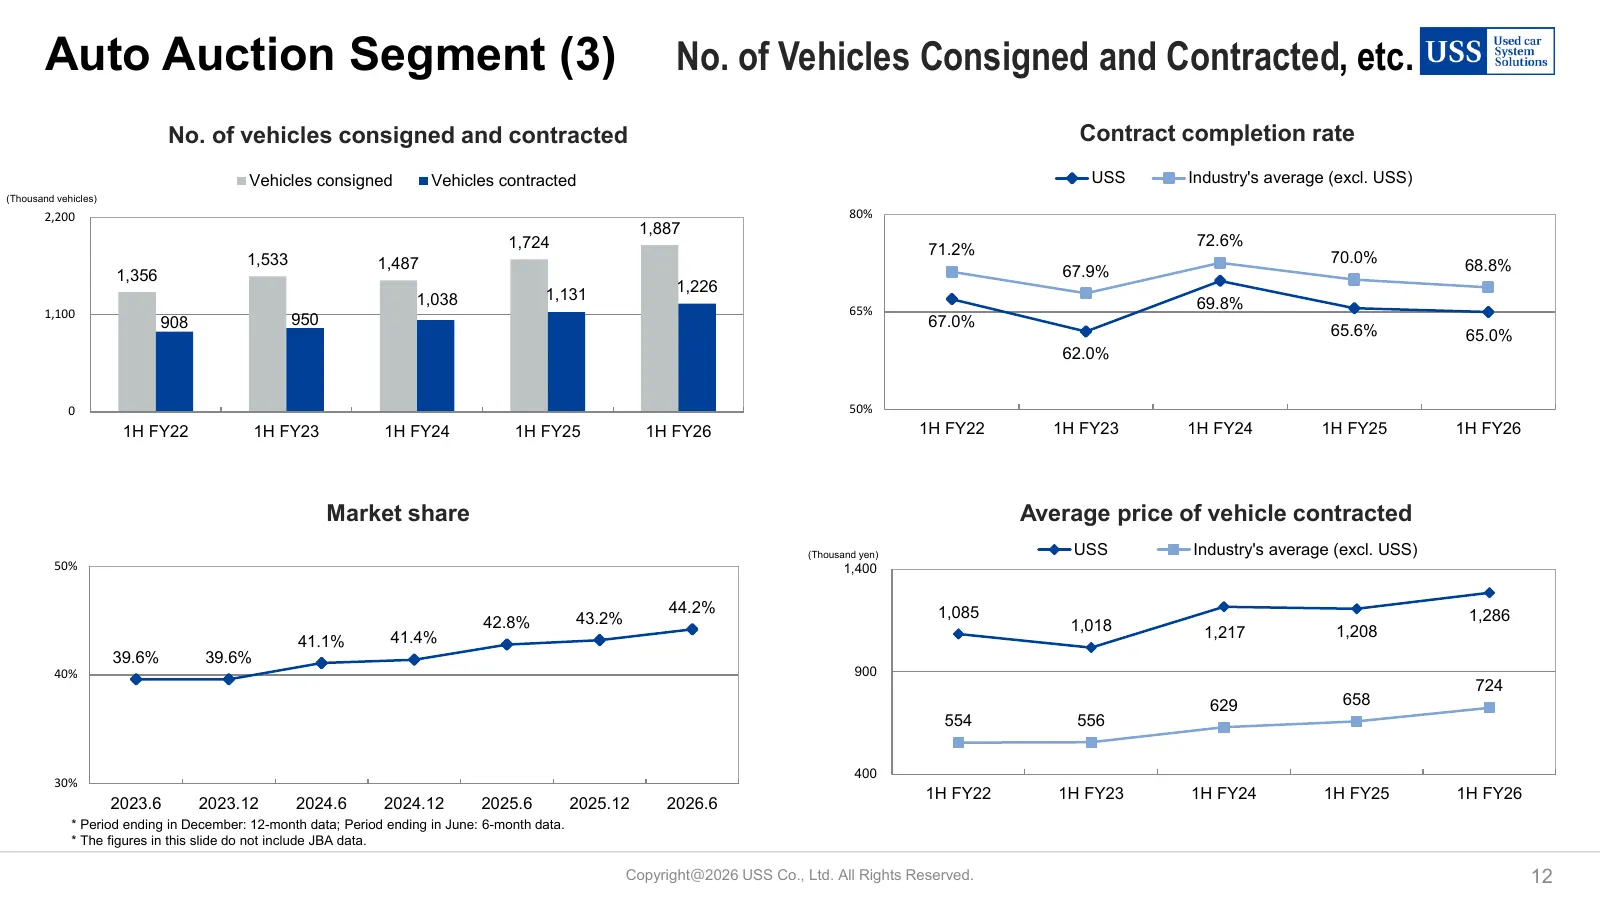
Slide 12: Auto Auction Segment (3) No. of Vehicles Consigned and Contracted
Auto Auction Segment (3) No. of Vehicles Consigned and Contracted, etc. No. of vehicles consigned and contracted Contract completion rate Vehicles consigned Vehicles contracted USS Industry's average (excl. USS) (Thousand vehicles) 2,200 80% 1,887 1,724 72.6% 71.2% 70.0% 1,533 1,487 68.8% 1,356 67.9
Slide 13: Auto Auction Segment (4) Fees, etc.
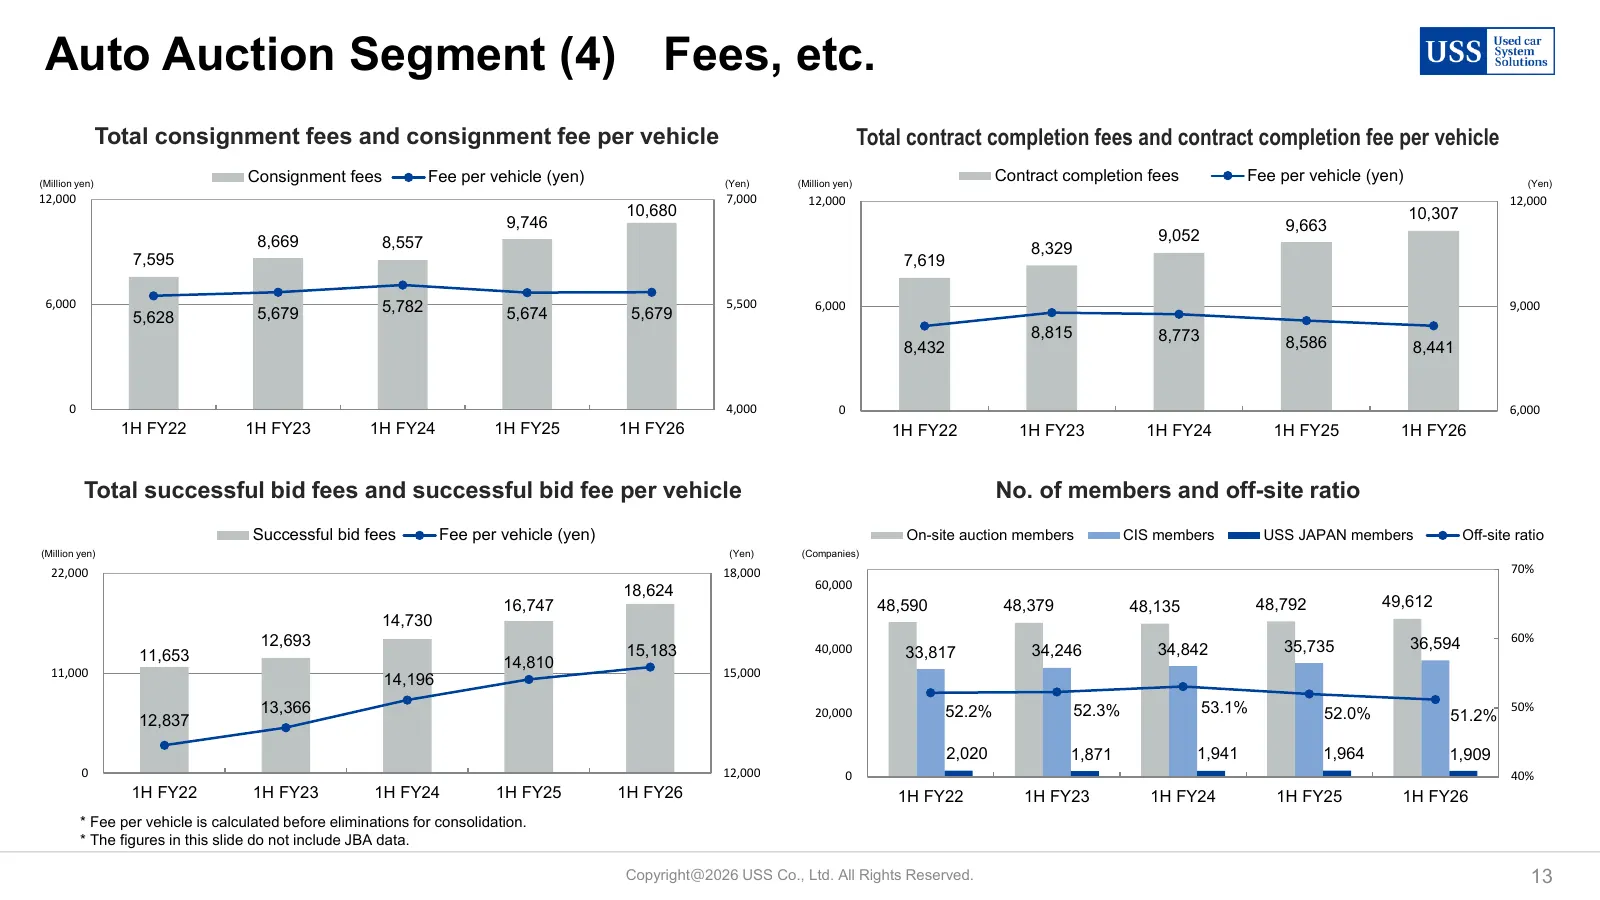
Auto Auction Segment (4) Fees, etc. Total consignment fees and consignment fee per vehicle Total contract completion fees and contract completion fee per vehicle (Million yen) Consignment fees Fee per vehicle (yen) (Yen) (Million yen) Contract completion fees Fee per vehicle (yen) (Yen) 12,000 7,000
Slide 14: Used Vehicle Purchasing and Selling Segment
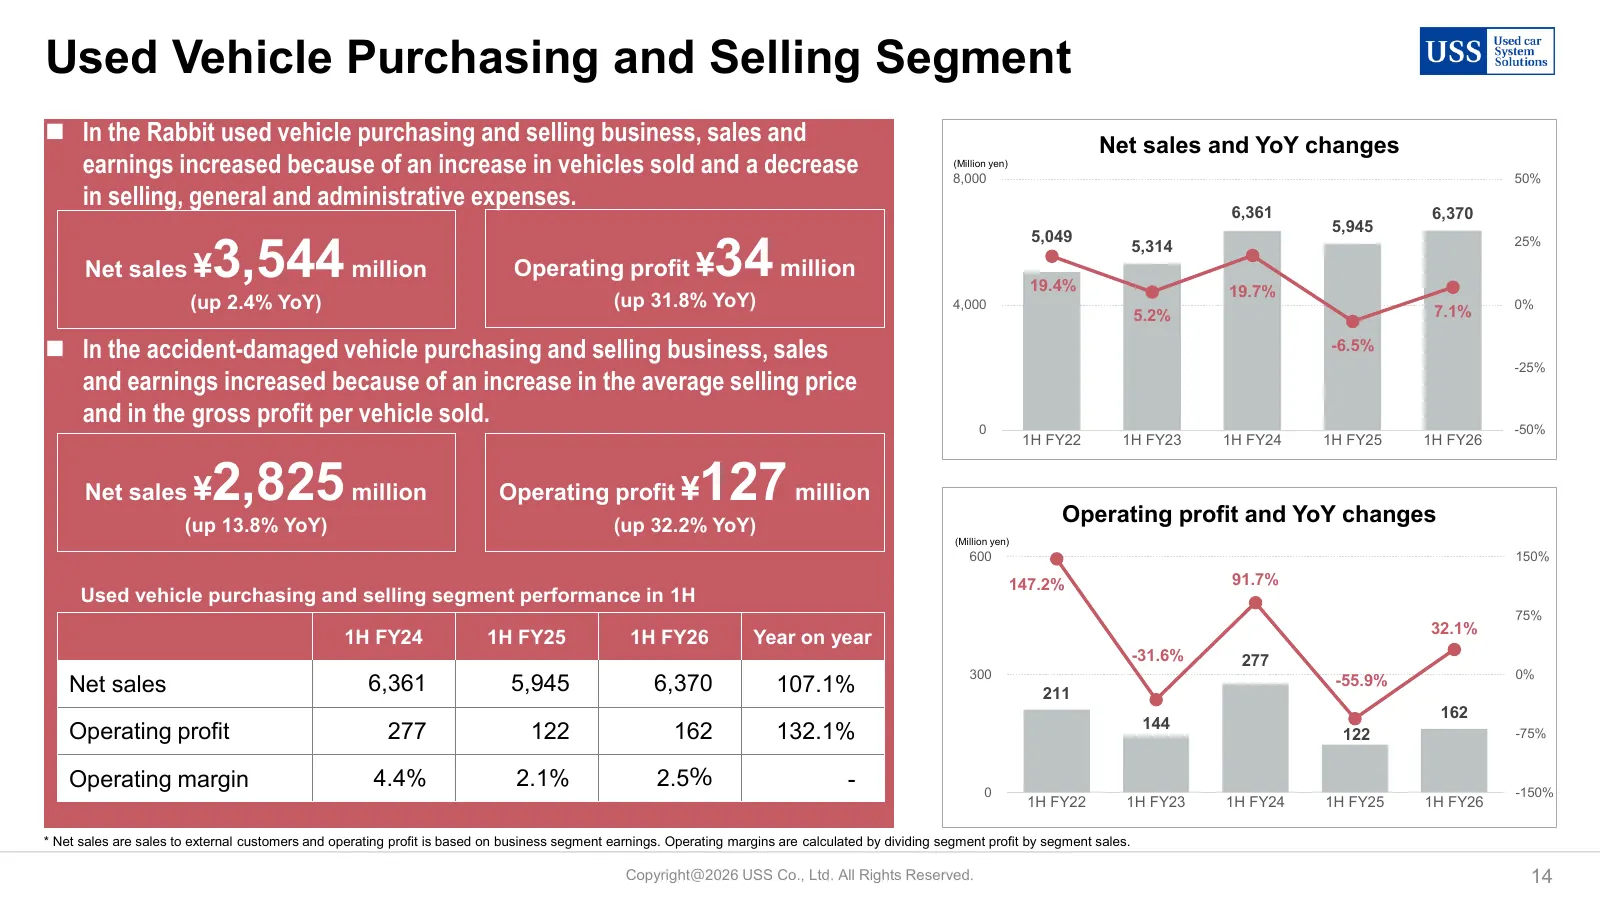
Used Vehicle Purchasing and Selling Segment ◼ In the Rabbit used vehicle purchasing and selling business, sales and Net sales and YoY changes earnings increased because of an increase in vehicles sold and a decrease (Million yen) 8,000 50% in selling, general and administrative expenses. 6,361 6,370
Slide 15: Recycling Segment
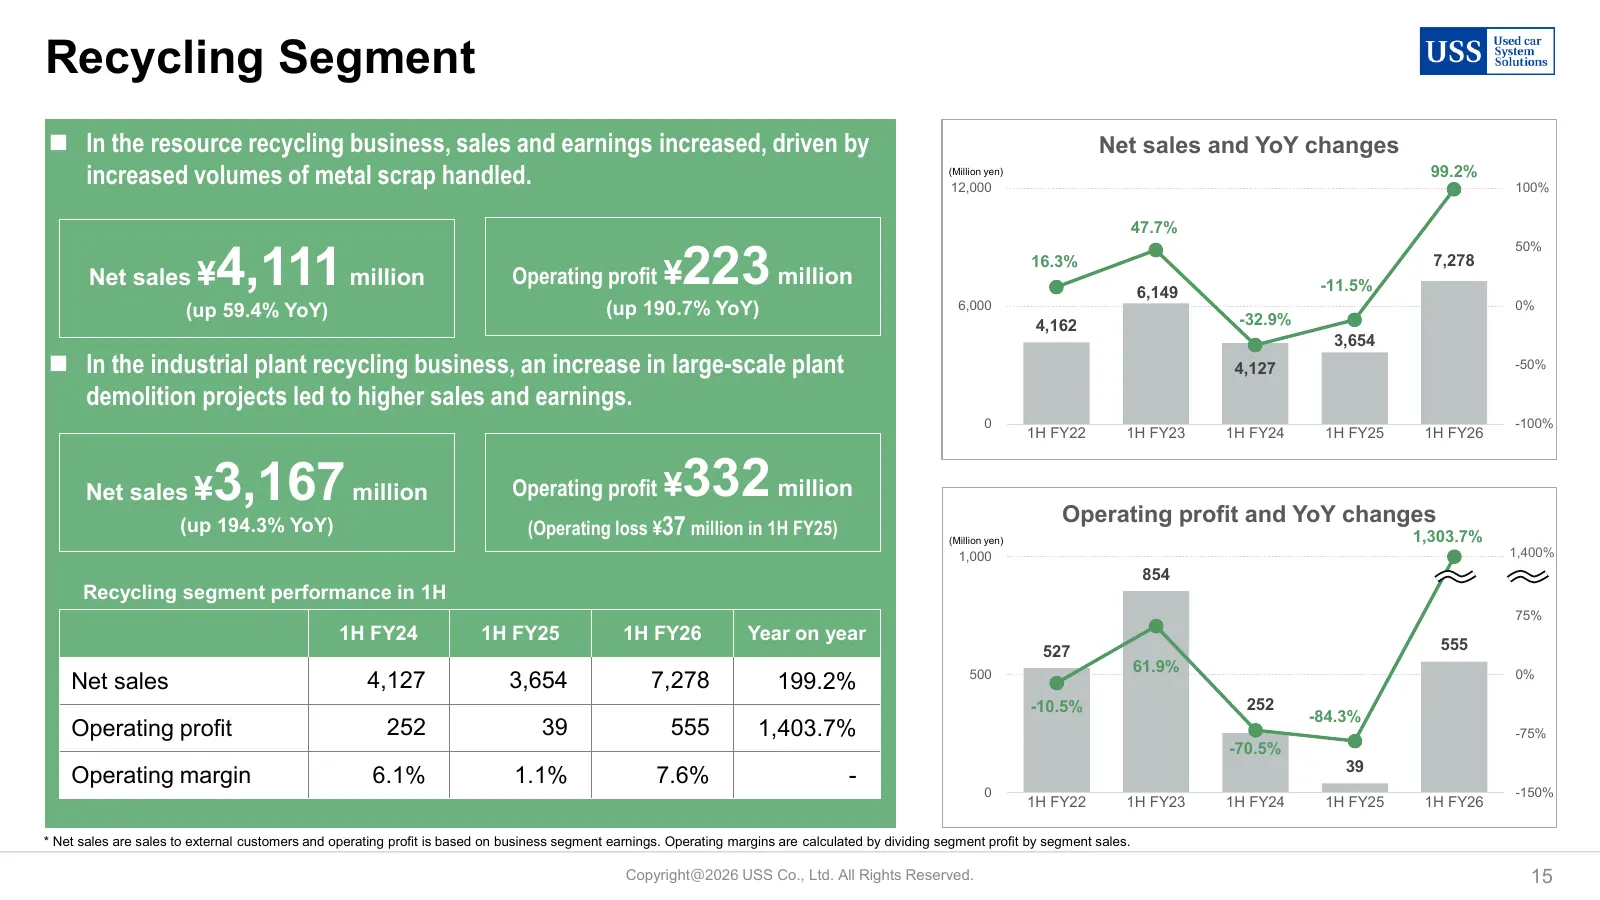
Recycling Segment ◼ In the resource recycling business, sales and earnings increased, driven by Net sales and YoY changes increased volumes of metal scrap handled. (Million yen) 12,000 99.2% 100% 47.7% 4,111 million 223 million 50% 16.3% 7,278 Net sales ¥ Operating profit ¥ -11.5% 6,149 (up 59.4% Yo
Slide 16: FY2026 Consolidated Forecast
FY2026 Consolidated Forecast Copyright@2026 USS Co., Ltd. All Rights Reserved. 16
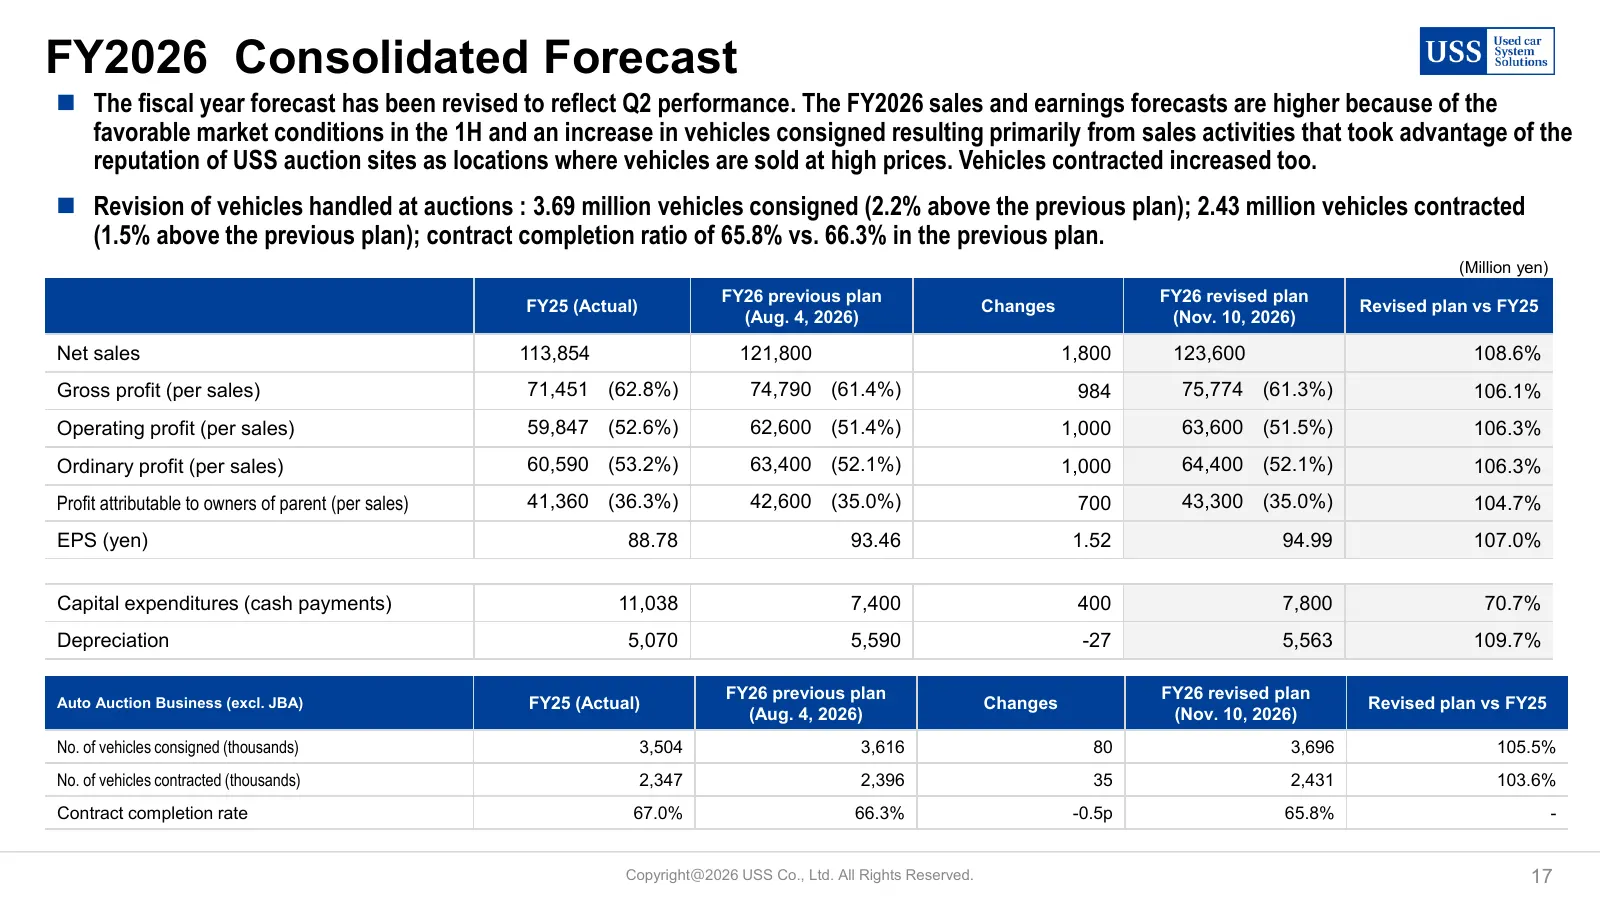
Slide 17: FY2026 Consolidated Forecast
FY2026 Consolidated Forecast ◼ The fiscal year forecast has been revised to reflect Q2 performance. The FY2026 sales and earnings forecasts are higher because of the favorable market conditions in the 1H and an increase in vehicles consigned resulting primarily from sales activities that took advant
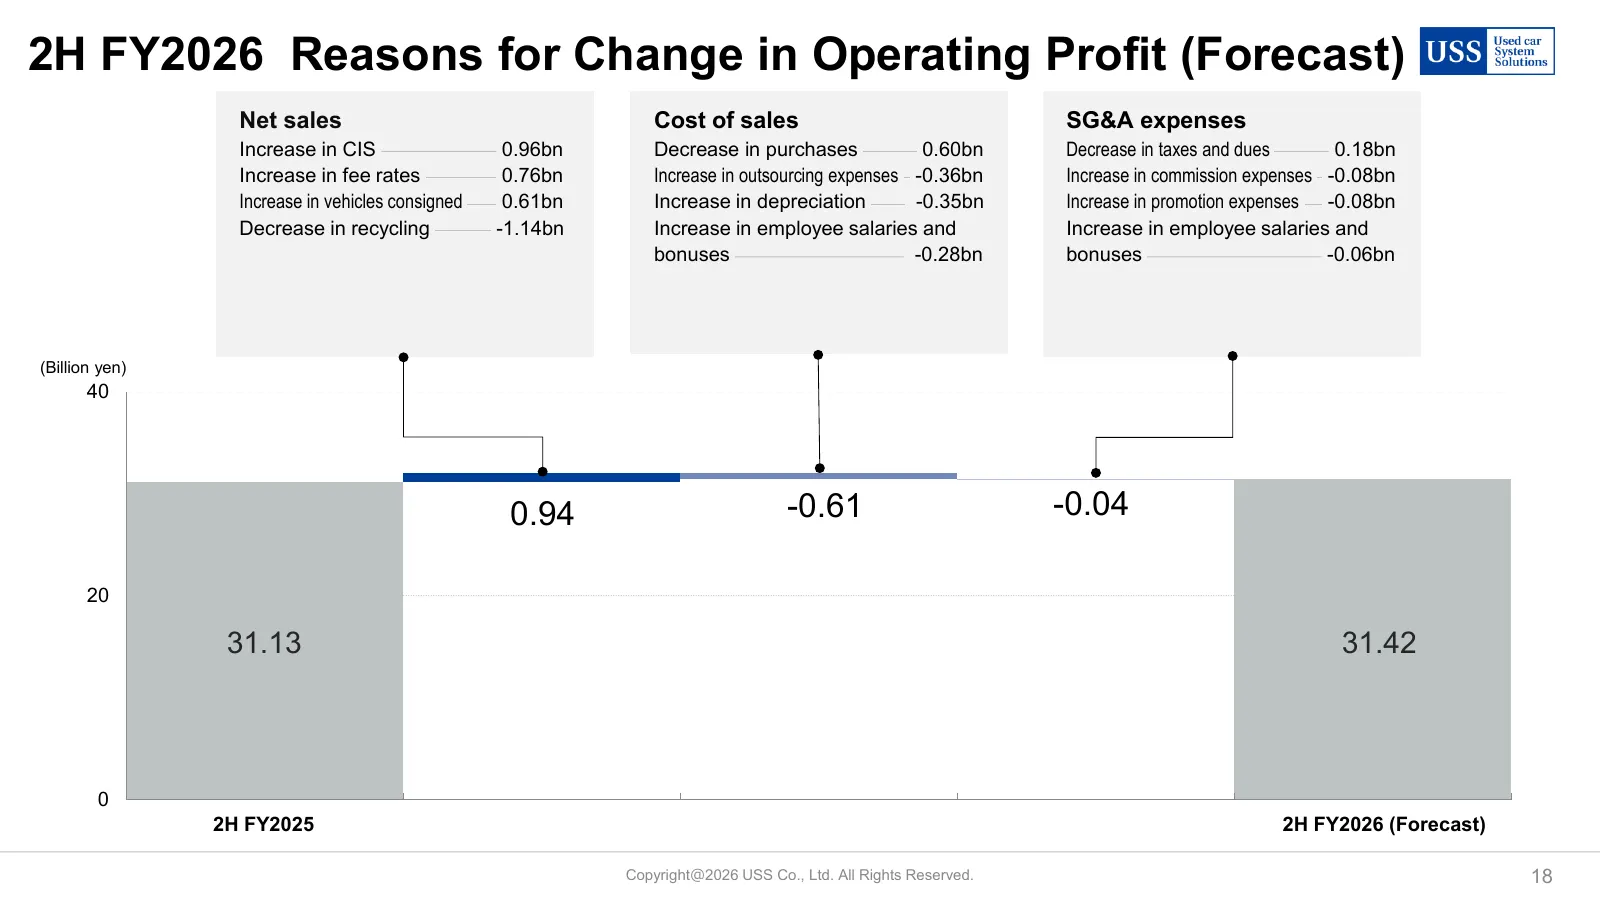
Slide 18: 2H FY2026 Reasons for Change in Operating Profit (Forecast)
2H FY2026 Reasons for Change in Operating Profit (Forecast) Net sales Cost of sales SG&A expenses Increase in CIS 0.96bn Decrease in purchases 0.60bn Decrease in taxes and dues 0.18bn Increase in fee rates 0.76bn Increase in outsourcing expenses -0.36bn Increase in commission expenses -0.08bn Increa
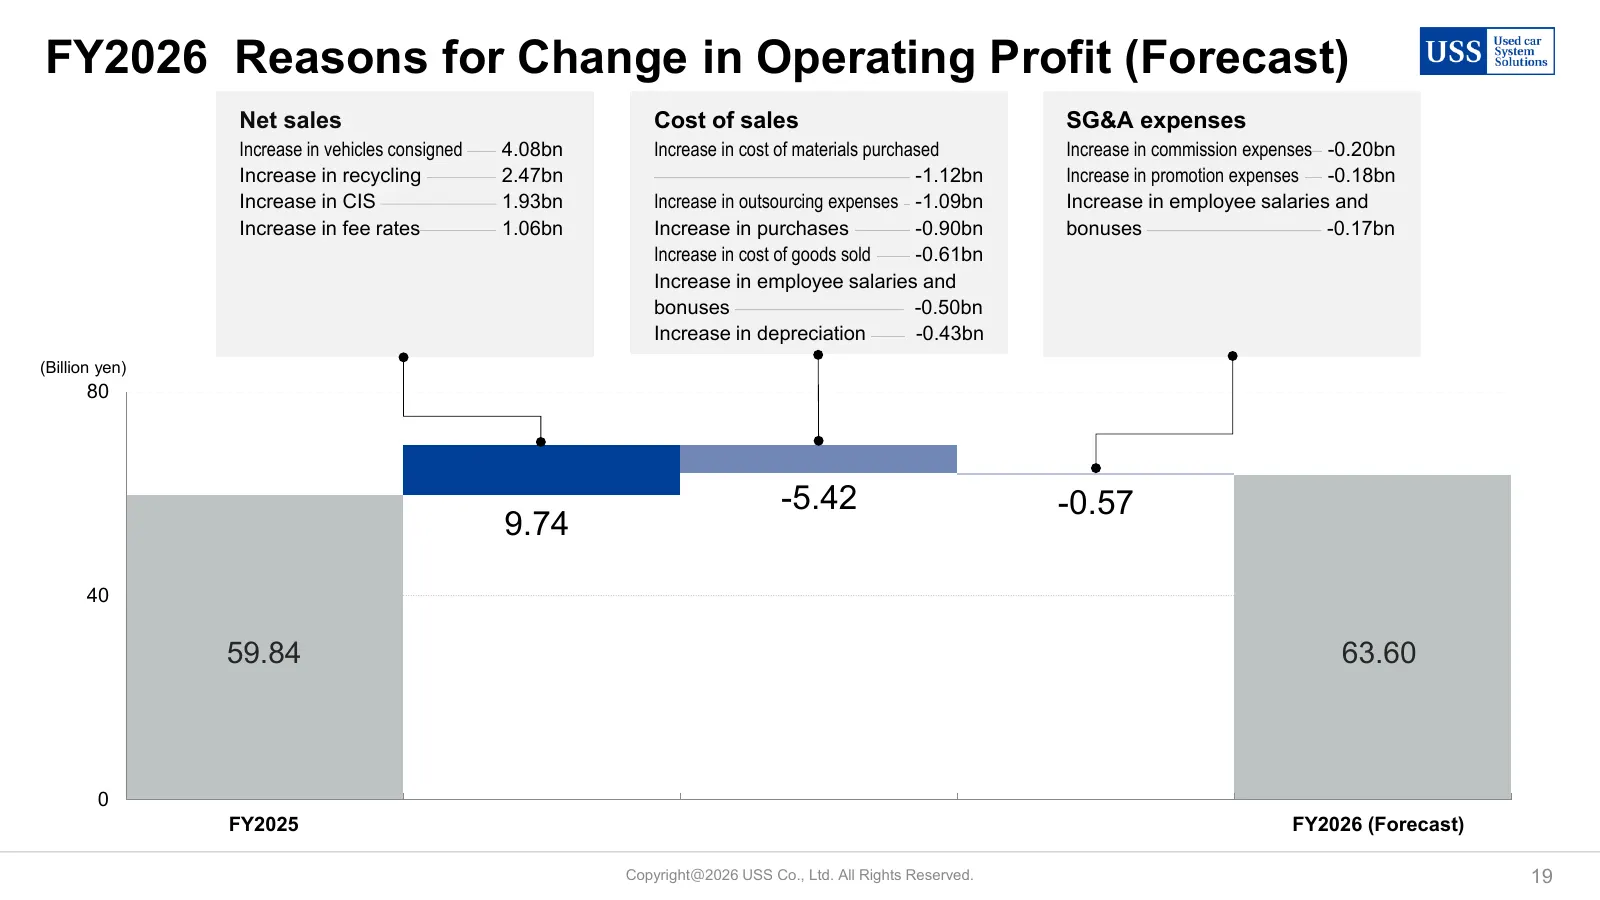
Slide 19: FY2026 Reasons for Change in Operating Profit (Forecast)
FY2026 Reasons for Change in Operating Profit (Forecast) Net sales Cost of sales SG&A expenses Increase in vehicles consigned 4.08bn Increase in cost of materials purchased Increase in commission expenses -0.20bn Increase in recycling 2.47bn -1.12bn Increase in promotion expenses -0.18bn Increase in
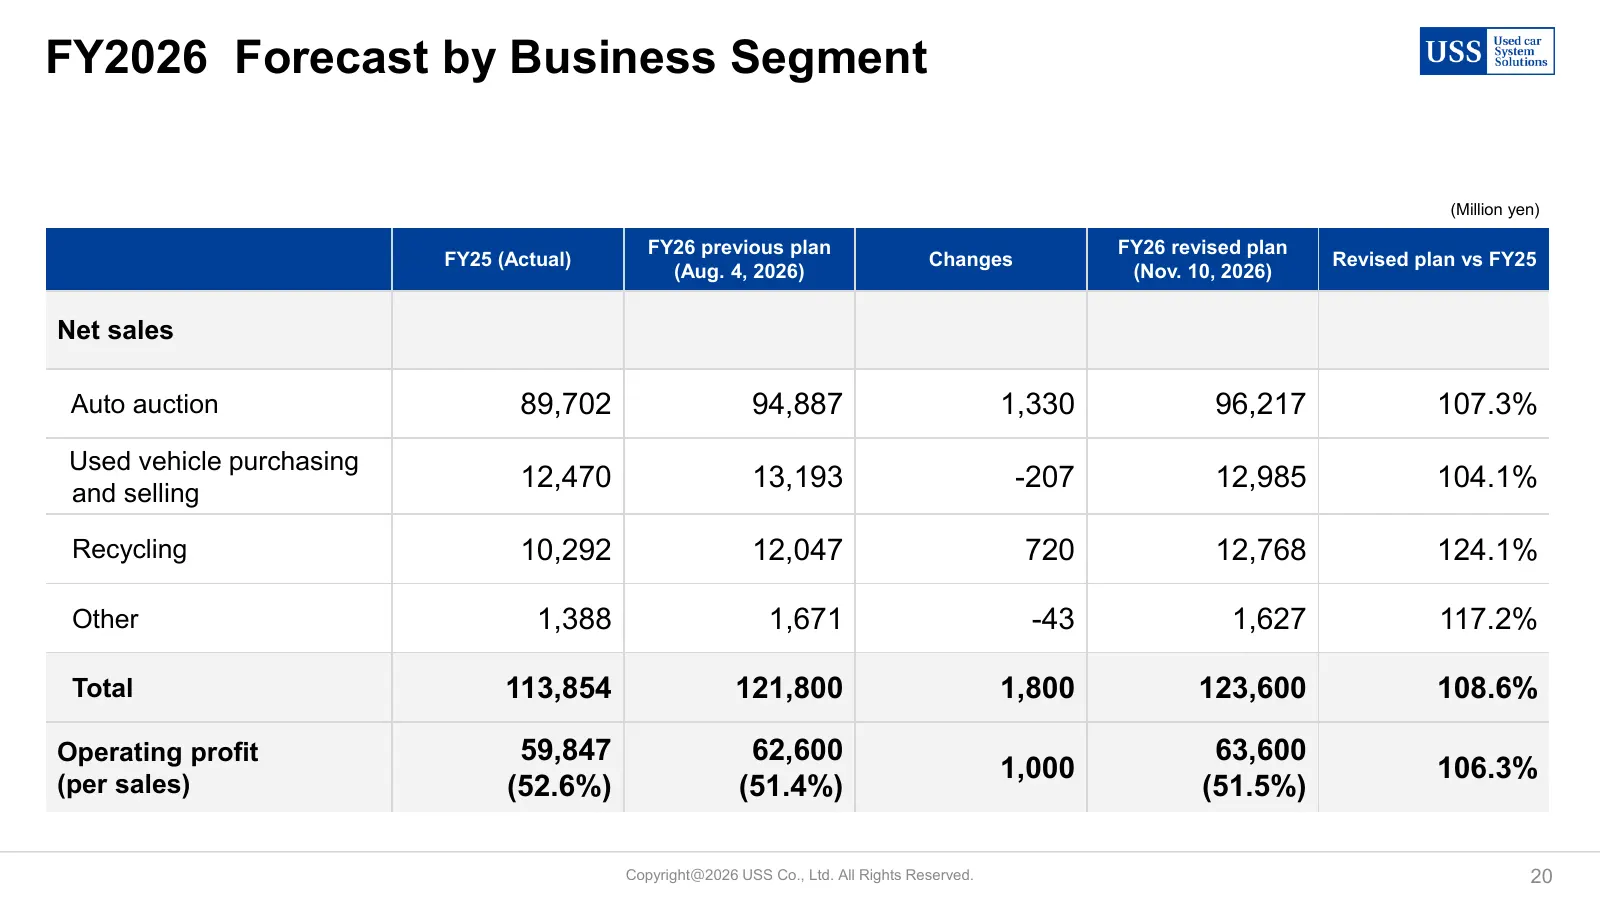
Slide 20: FY2026 Forecast by Business Segment
FY2026 Forecast by Business Segment (Million yen) FY26 previous plan FY26 revised plan FY25 (Actual) Changes Revised plan vs FY25 (Aug. 4, 2026) (Nov. 10, 2026) Net sales Auto auction 89,702 94,887 1,330 96,217 107.3% Used vehicle purchasing and selling 12,470 13,193 -207 12,985 104.1% Recycling 10,
Slide 21: Market Overview and Strategy for Creating Value Over the Medium-term
Market Overview and Strategy for Creating Value Over the Medium-term Copyright@2026 USS Co., Ltd. All Rights Reserved. 21
Slide 22: Used Car Auction Market and USS Market Share
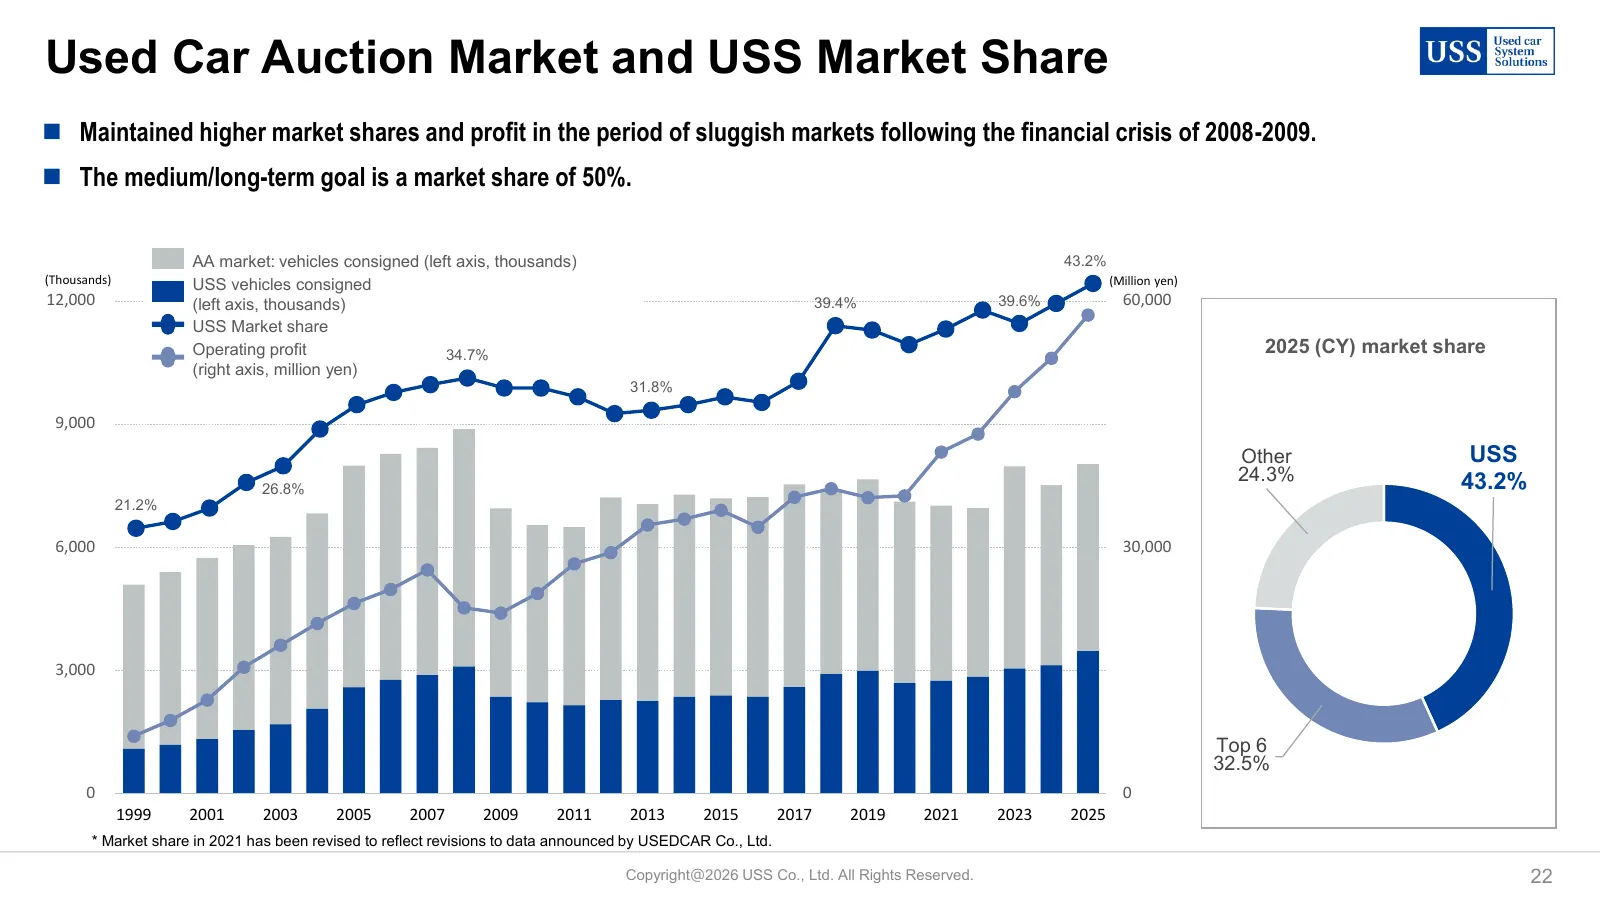
Used Car Auction Market and USS Market Share ◼ Maintained higher market shares and profit in the period of sluggish markets following the financial crisis of 2008-2009. ◼ The medium/long-term goal is a market share of 50%. AA market: vehicles consigned (left axis, thousands) 43.2% (Thousands) USS ve
Slide 23: Medium-to Long-Term Management Goal
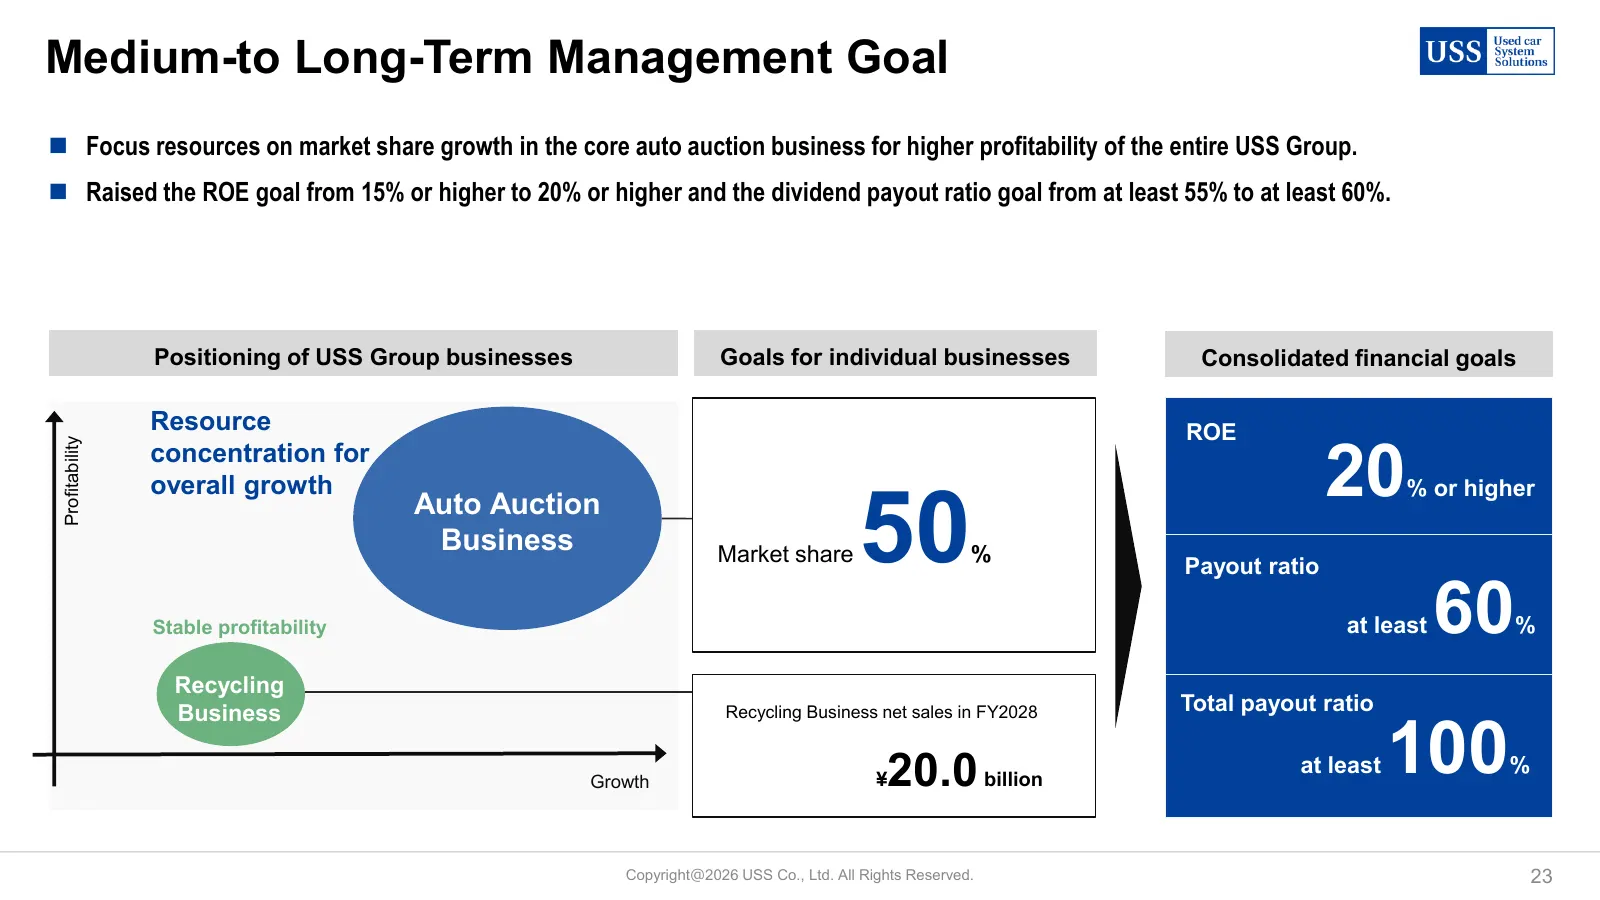
Medium-to Long-Term Management Goal ◼ Focus resources on market share growth in the core auto auction business for higher profitability of the entire USS Group. ◼ Raised the ROE goal from 15% or higher to 20% or higher and the dividend payout ratio goal from at least 55% to at least 60%. Positioning
Slide 24: Cash Allocation Policy
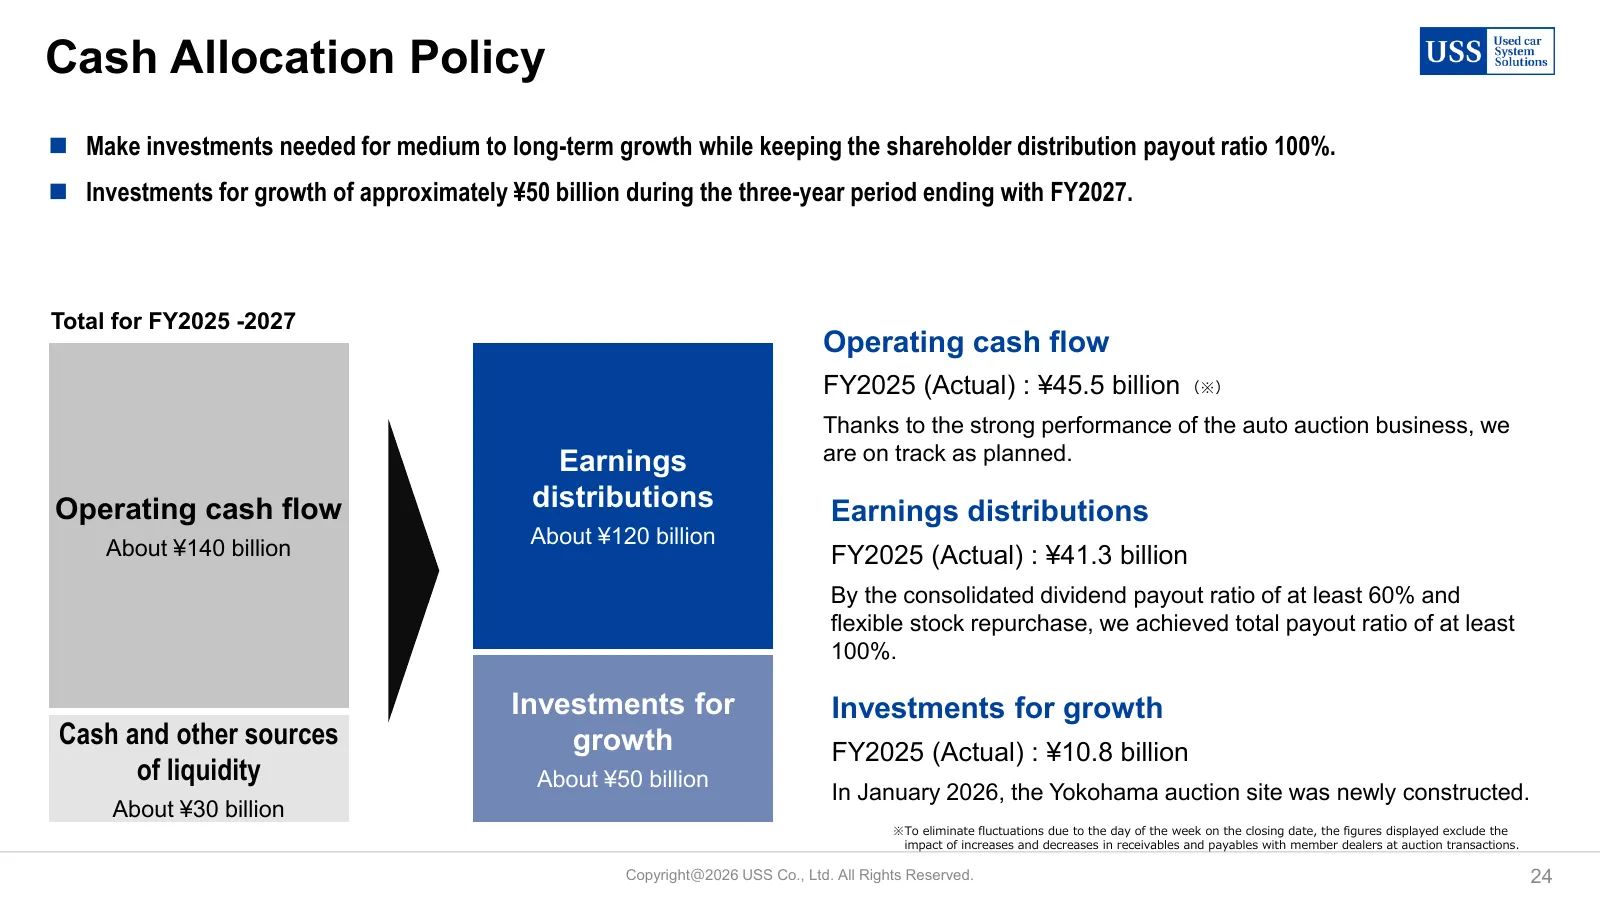
Cash Allocation Policy ◼ Make investments needed for medium to long-term growth while keeping the shareholder distribution payout ratio 100%. ◼ Investments for growth of approximately ¥50 billion during the three-year period ending with FY2027. Total for FY2025 -2027 Operating cash flow FY2025 (Actu
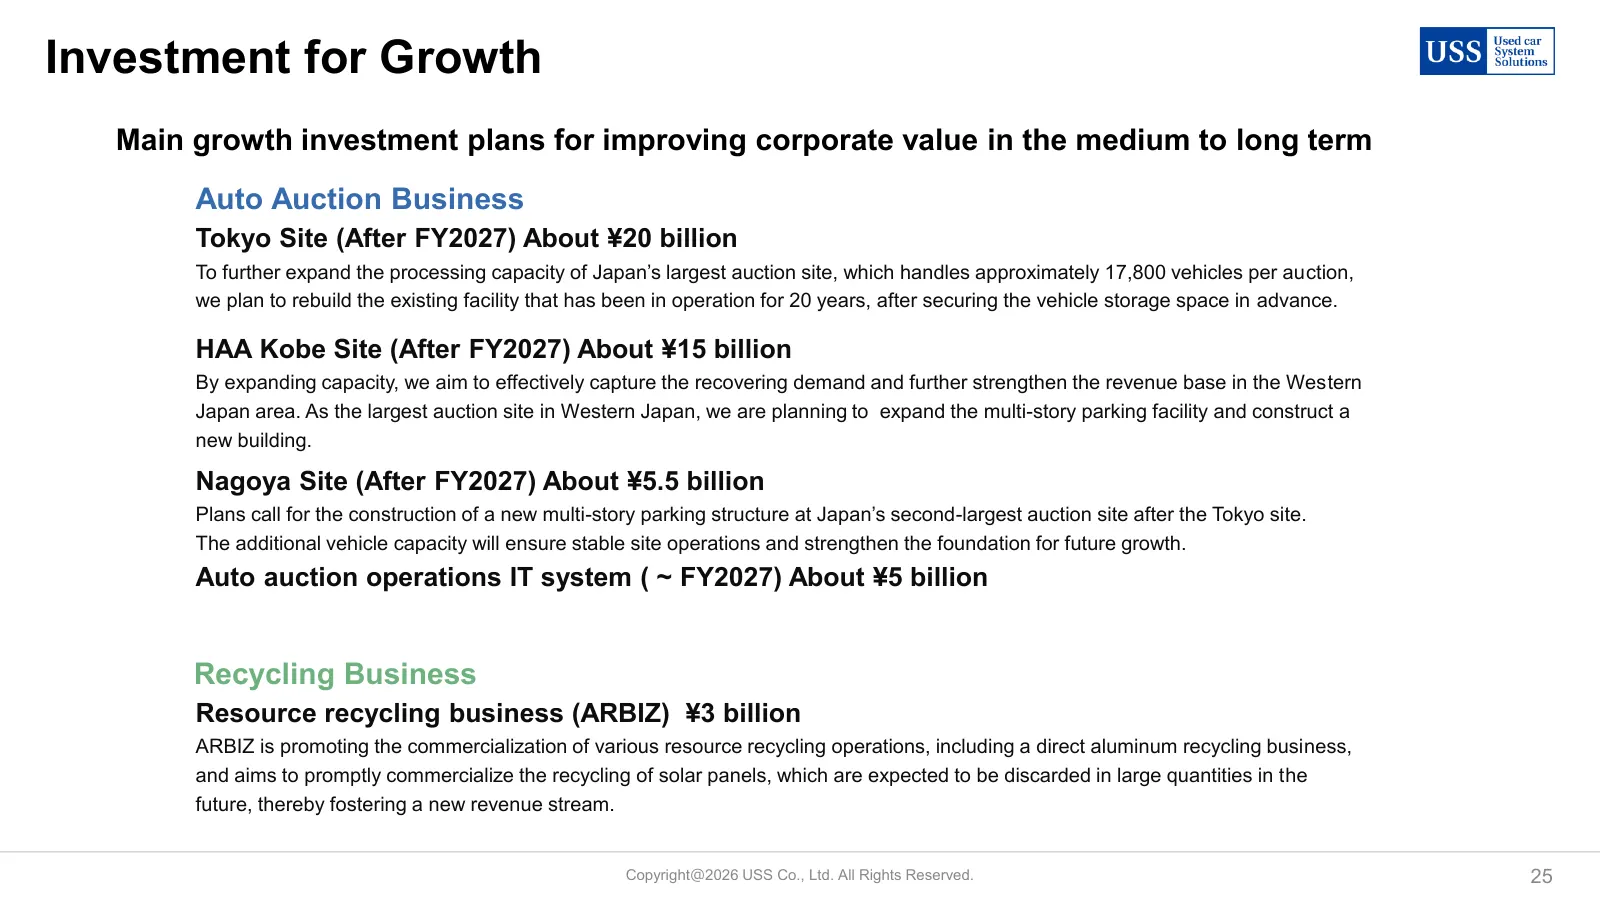
Slide 25: Investment for Growth
Investment for Growth Main growth investment plans for improving corporate value in the medium to long term Auto Auction Business Tokyo Site (After FY2027) About ¥20 billion To further expand the processing capacity of Japan’s largest auction site, which handles approximately 17,800 vehicles per auc
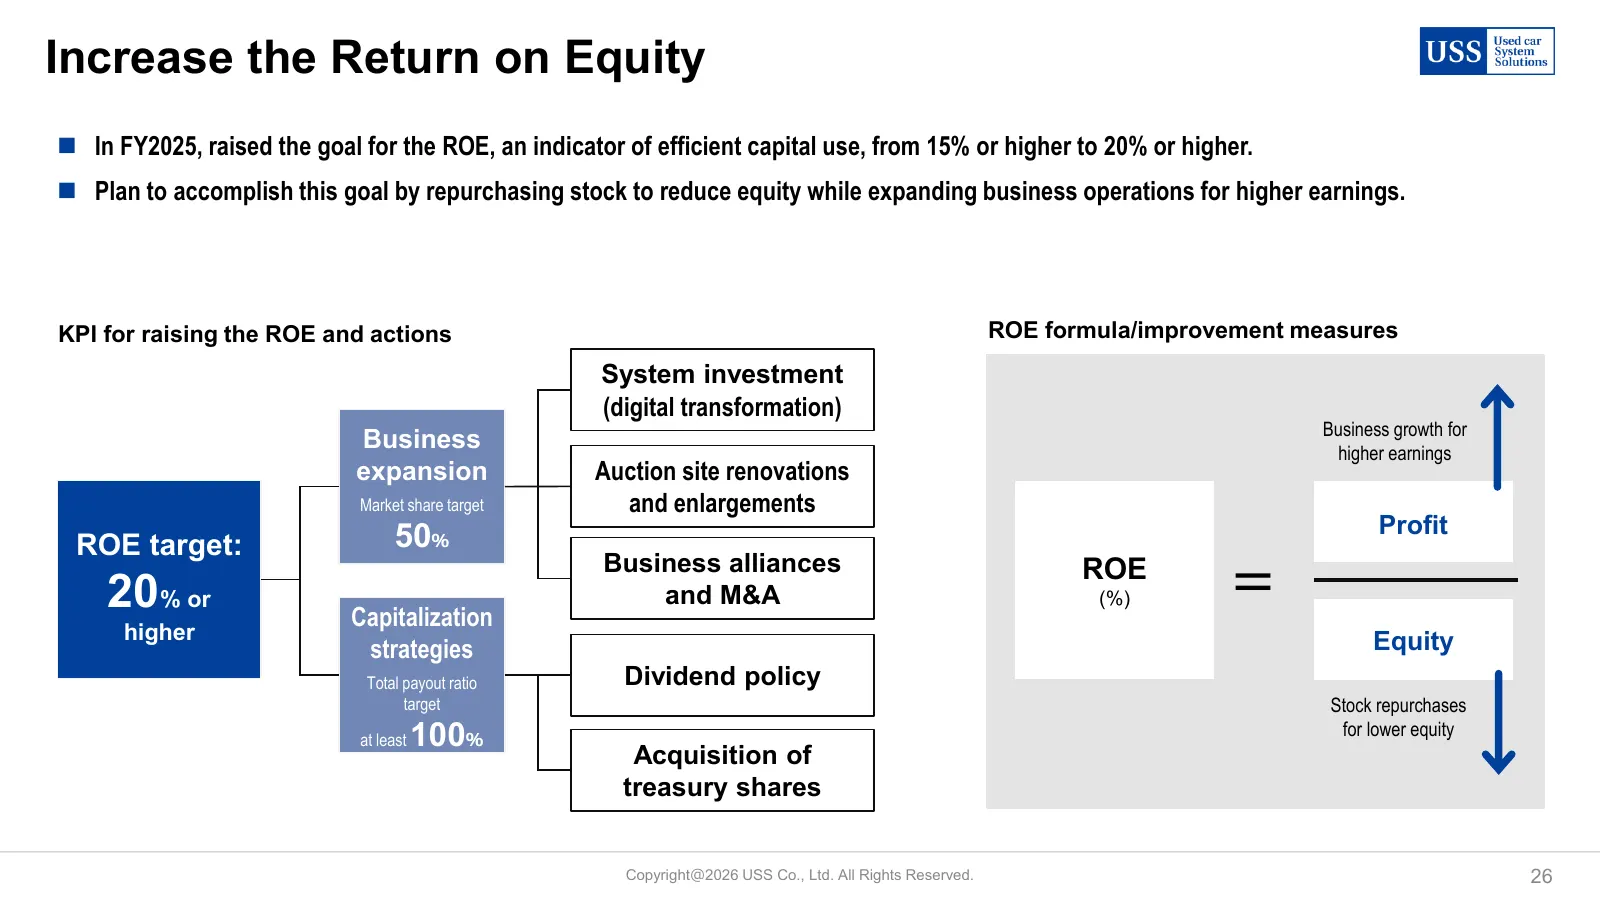
Slide 26: Increase the Return on Equity
Increase the Return on Equity ◼ In FY2025, raised the goal for the ROE, an indicator of efficient capital use, from 15% or higher to 20% or higher. ◼ Plan to accomplish this goal by repurchasing stock to reduce equity while expanding business operations for higher earnings. KPI for raising the ROE a
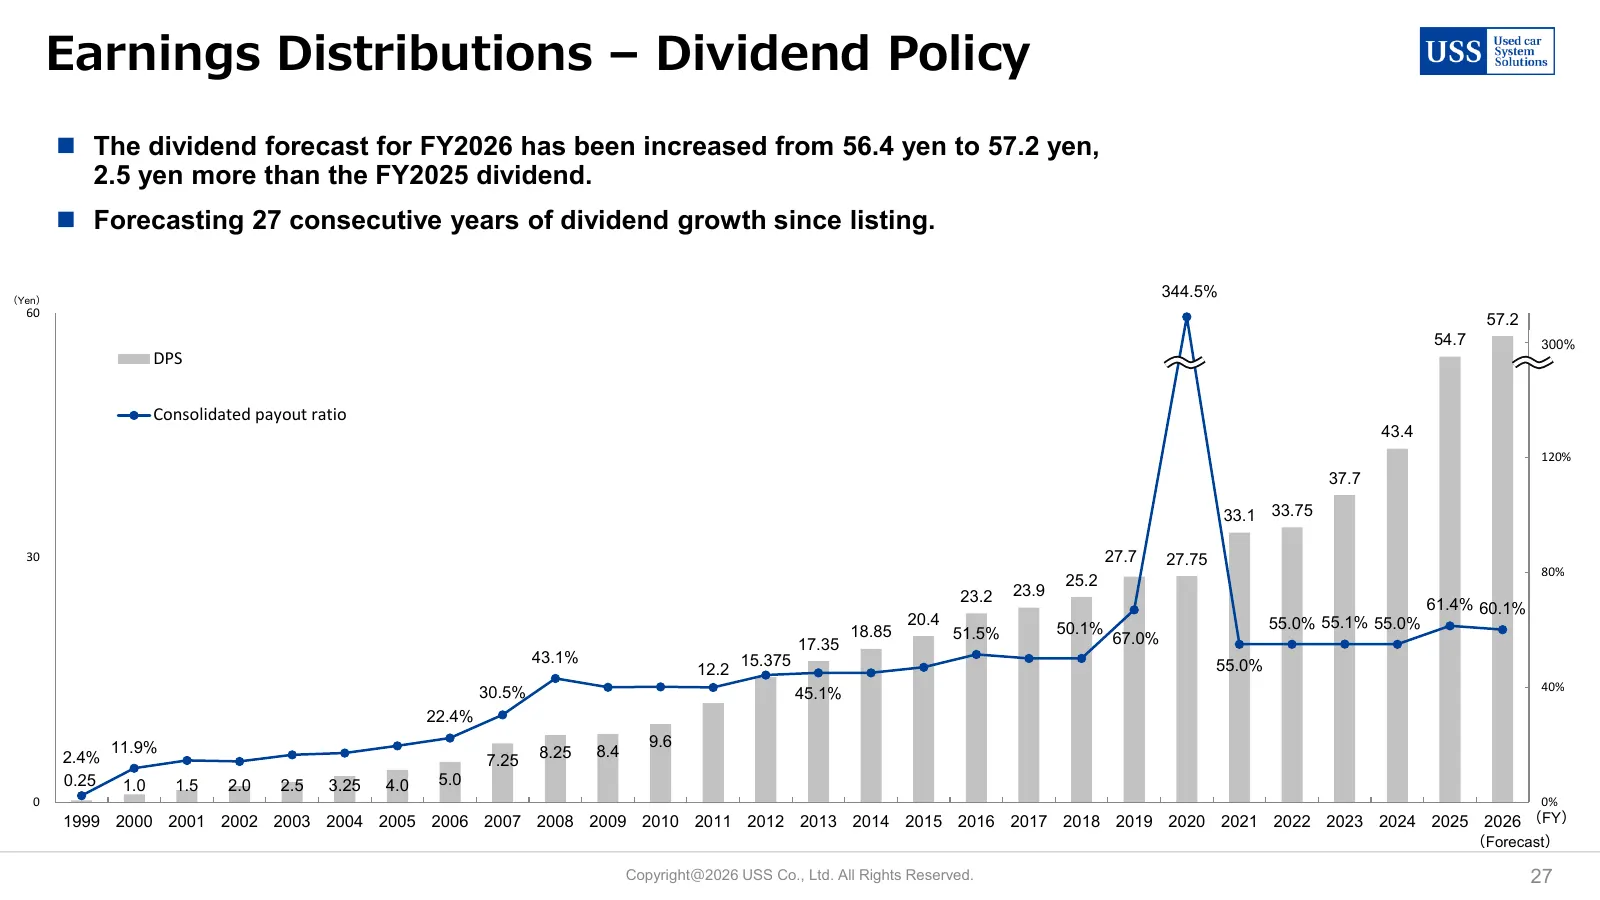
Slide 27: Earnings Distributions – Dividend Policy
Earnings Distributions – Dividend Policy ◼ The dividend forecast for FY2026 has been increased from 56.4 yen to 57.2 yen, 2.5 yen more than the FY2025 dividend. ◼ Forecasting 27 consecutive years of dividend growth since listing. (Yen) 344.5% 60 57.2 54.7 160% 300% DPS Consolidated payout ratio 43.4
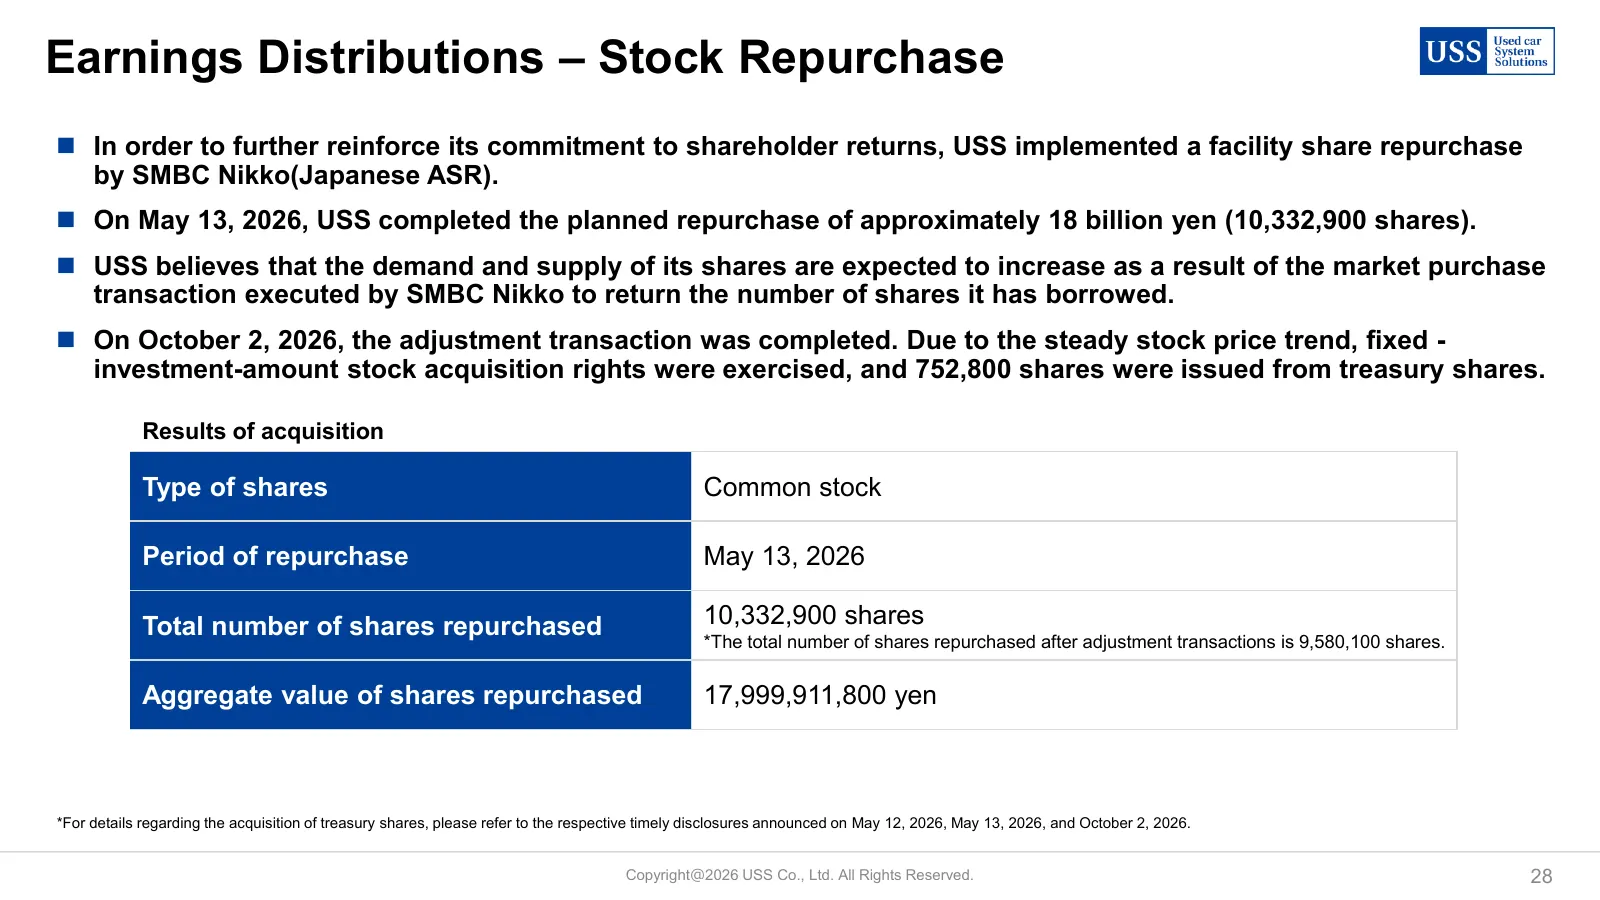
Slide 28: Earnings Distributions – Stock Repurchase
Earnings Distributions – Stock Repurchase ◼ In order to further reinforce its commitment to shareholder returns, USS implemented a facility share repurchase by SMBC Nikko(Japanese ASR). ◼ On May 13, 2026, USS completed the planned repurchase of approximately 18 billion yen (10,332,900 shares). ◼ USS
Slide 29: Earnings Distributions – Total Payout Ratio
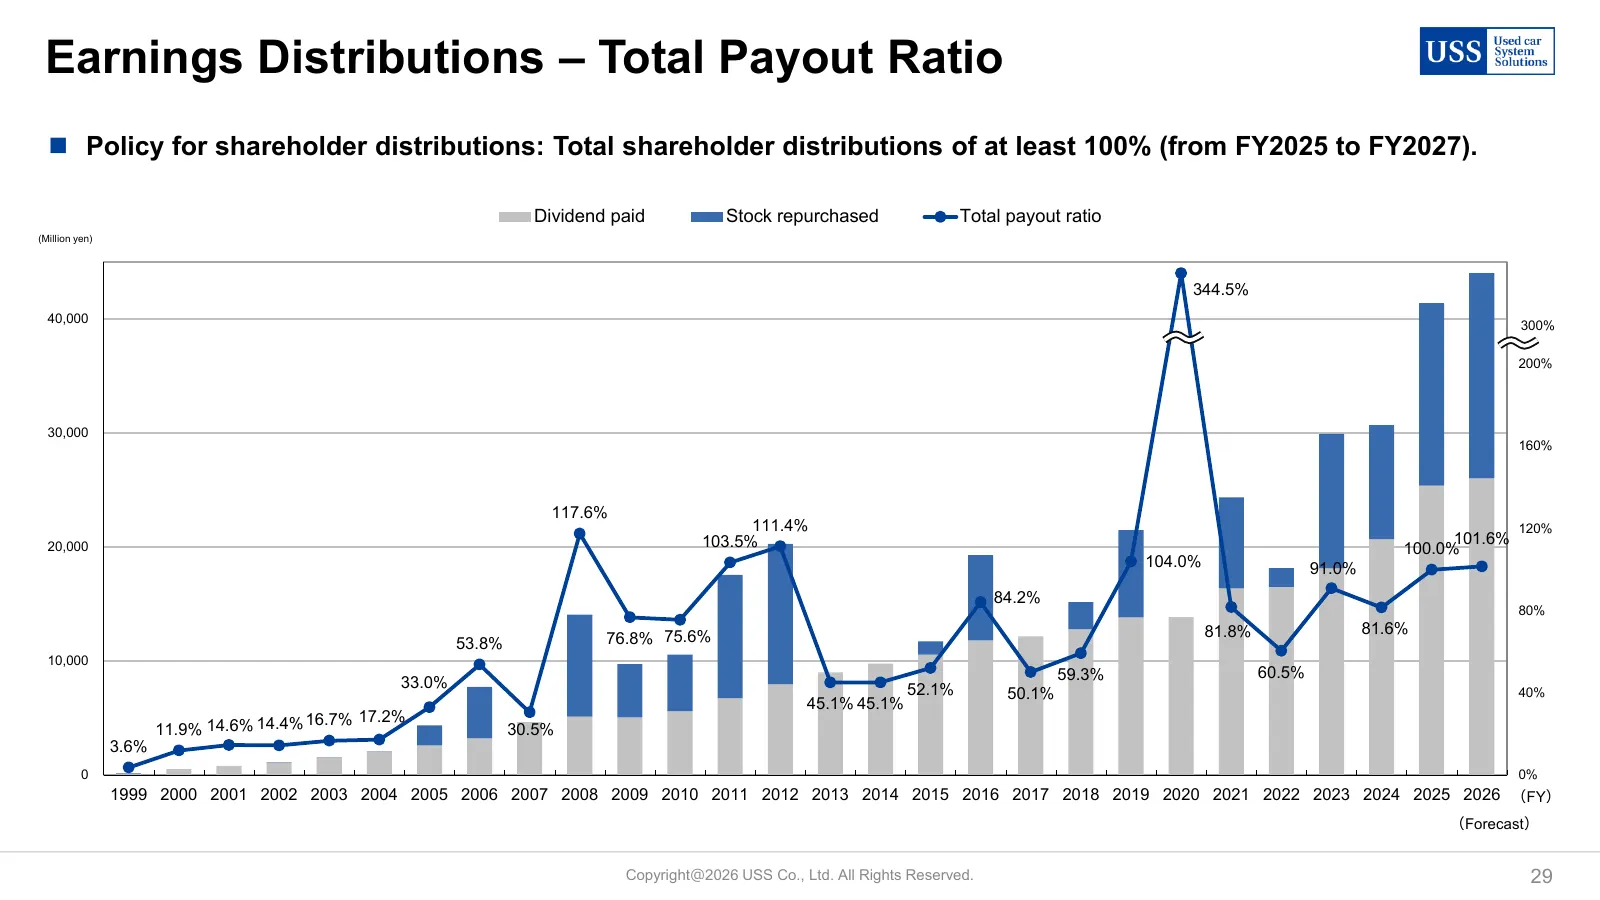
Earnings Distributions – Total Payout Ratio ◼ Policy for shareholder distributions: Total shareholder distributions of at least 100% (from FY2025 to FY2027). Dividend paid Stock repurchased Total payout ratio (Million yen) 240% 344.5% 40,000 300% 200% 30,000 160% 117.6% 111.4% 120% 20,000 103.5% 101
Slide 30: Cycle of Rising Corporate Value Driven by Business Growth and Shareholder Distributions
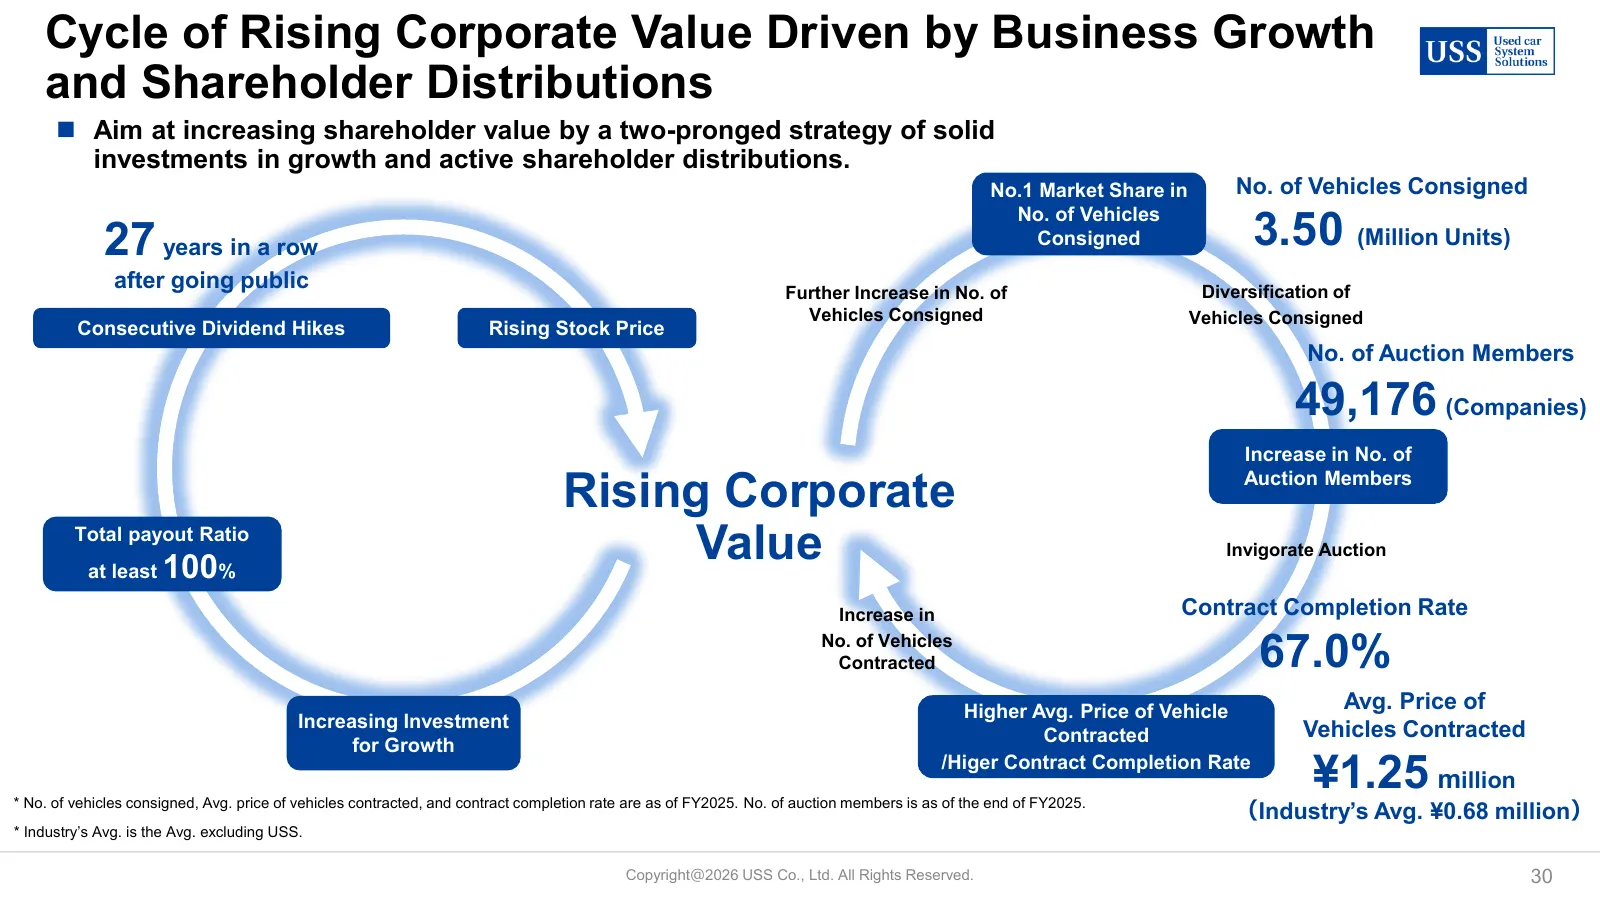
Cycle of Rising Corporate Value Driven by Business Growth and Shareholder Distributions ◼ Aim at increasing shareholder value by a two-pronged strategy of solid investments in growth and active shareholder distributions. No.1 Market Share in No. of Vehicles Consigned No. of Vehicles 27 years in a ro
Slide 31: Contact Information
Notes Contact Information • This document has been translated from the original Japanese as a guide for non-Japanese investors. Finance Department, • Forward-looking statements in this material are based Supervisory Office, on information available to management at the time this material was prepare
Slide 32: Reference
Reference Copyright@2026 USS Co., Ltd. All Rights Reserved. 32
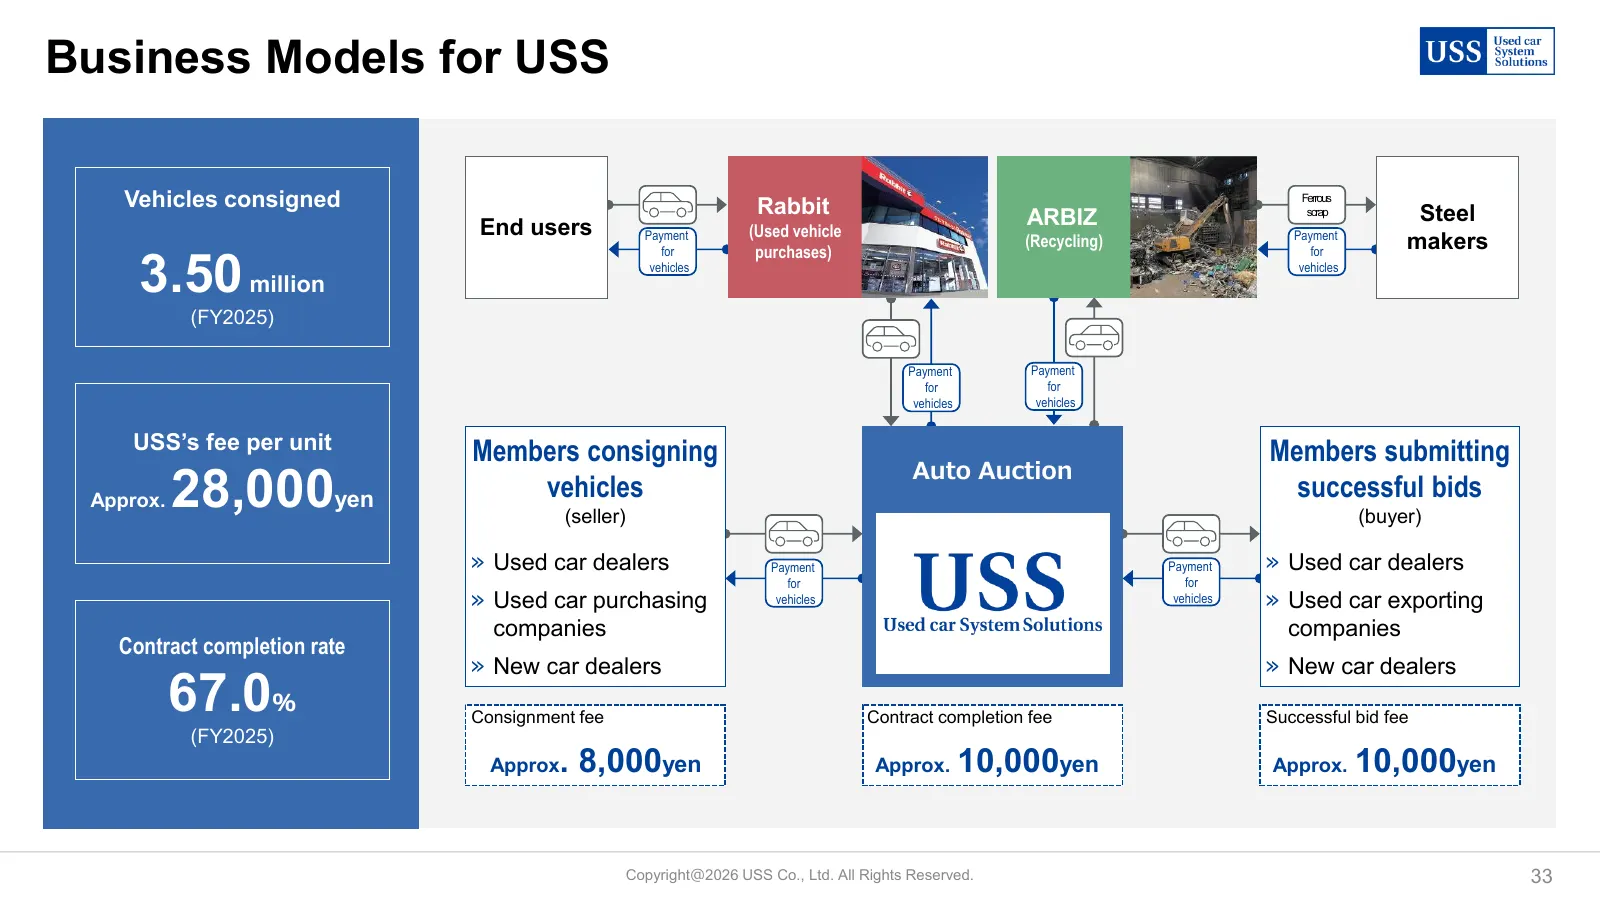
Slide 33: Business Models for USS
Business Models for USS Vehicles consigned Rabbit Ferrous ARBIZ scrap Steel End users Payment (Used vehicle Payment for purchases) (Recycling) for makers 3.50 million vehicles vehicles (FY2025) Payment Payment for for vehicles vehicles USS’s fee per unit Members consigning Members submitting Auto Au
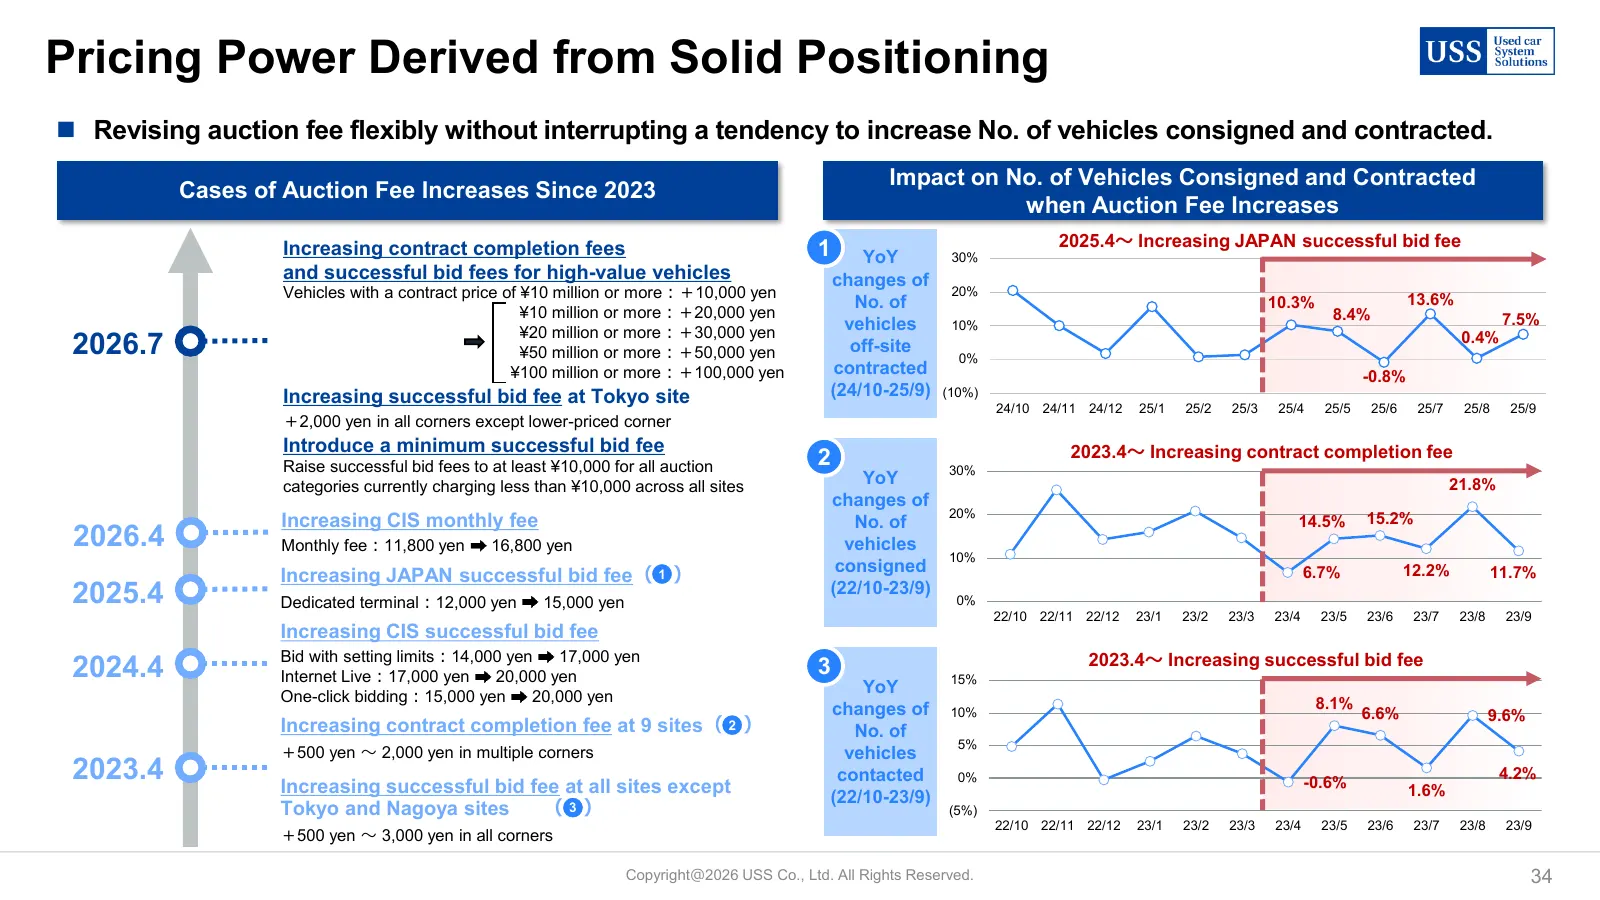
Slide 34: Pricing Power Derived from Solid Positioning
Pricing Power Derived from Solid Positioning ◼ Revising auction fee flexibly without interrupting a tendency to increase No. of vehicles consigned and contracted. Impact on No. of Vehicles Consigned and Contracted Cases of Auction Fee Increases Since 2023 when Auction Fee Increases Increasing contra
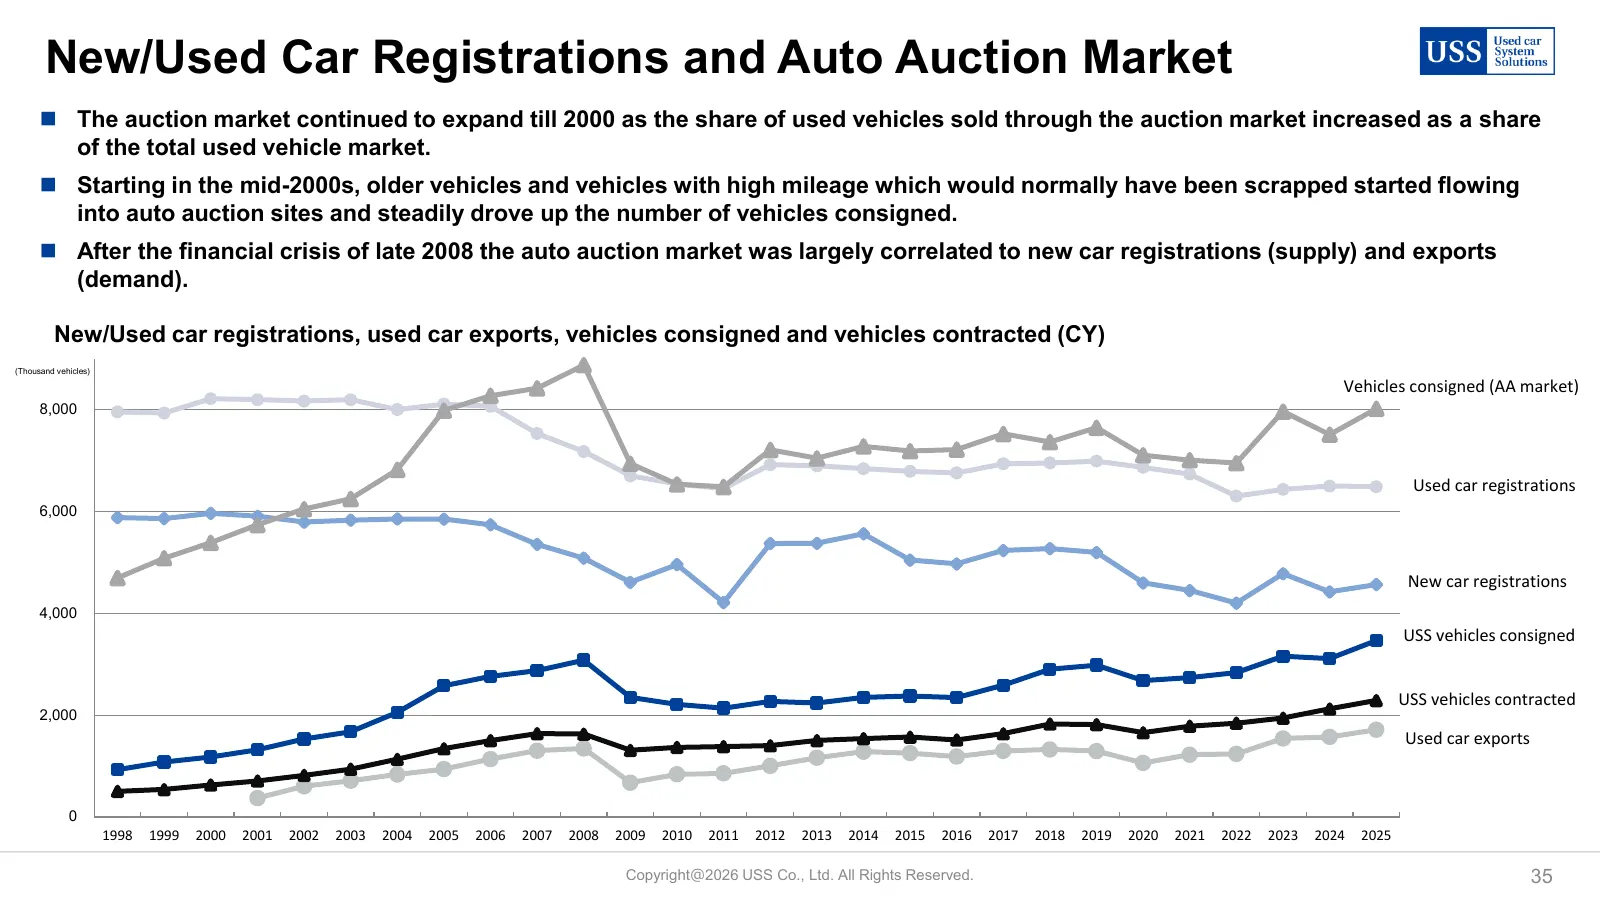
Slide 35: New/Used Car Registrations and Auto Auction Market
New/Used Car Registrations and Auto Auction Market ◼ The auction market continued to expand till 2000 as the share of used vehicles sold through the auction market increased as a share of the total used vehicle market. ◼ Starting in the mid-2000s, older vehicles and vehicles with high mileage which
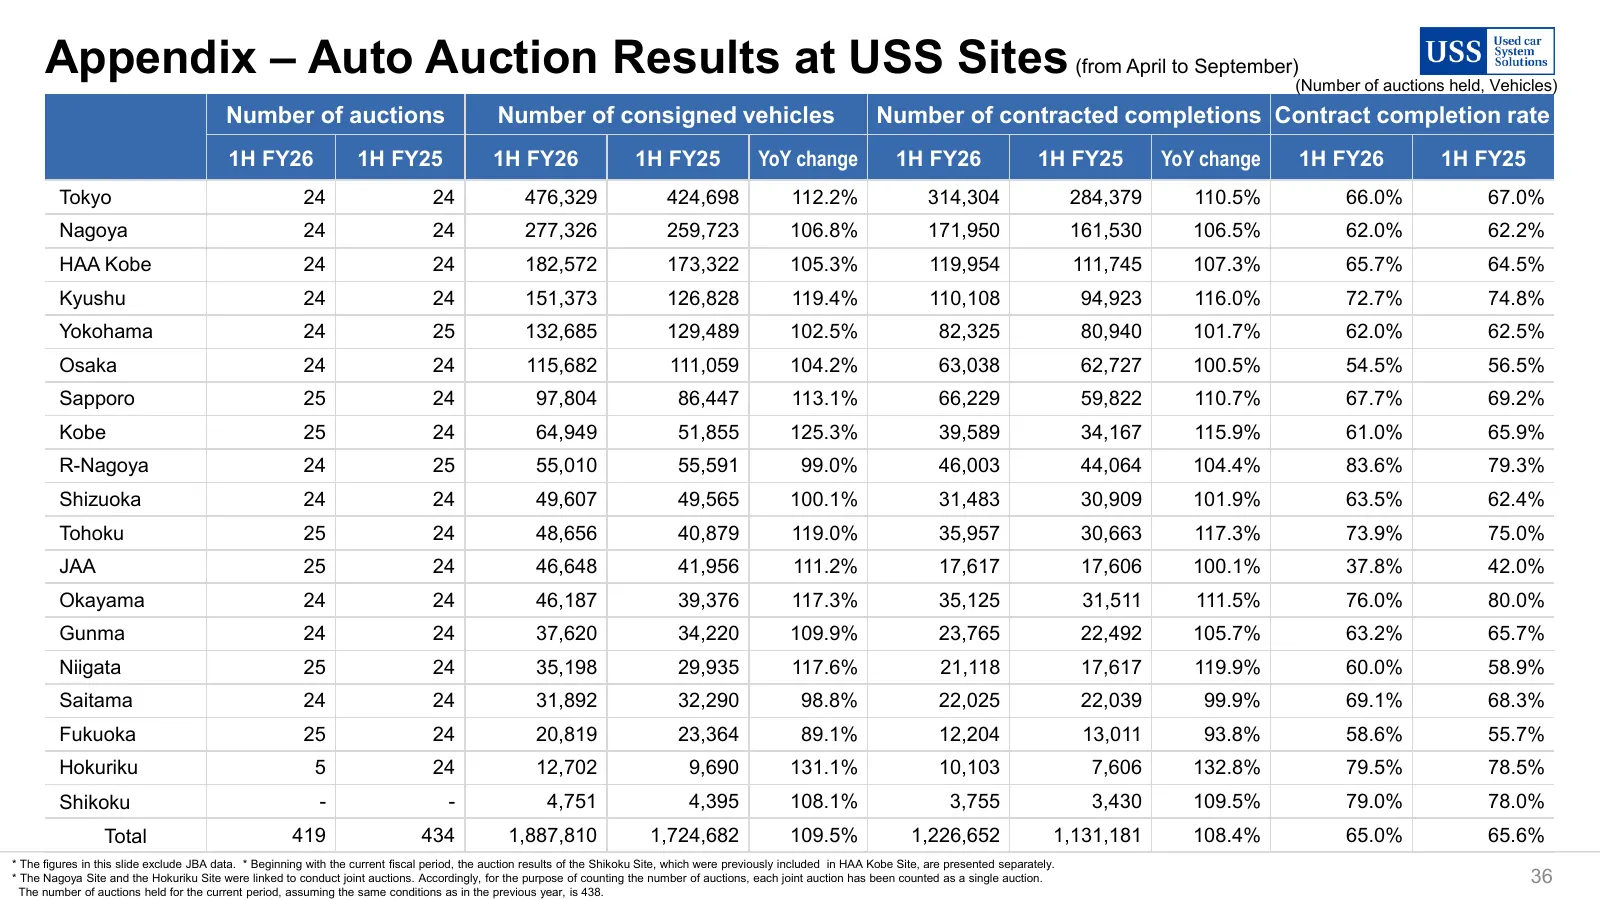
Slide 36: Appendix – Auto Auction Results at USS Sites
Appendix – Auto Auction Results at USS Sites (from April to September) (Number of auctions held, Vehicles) Number of auctions Number of consigned vehicles Number of contracted completions Contract completion rate 1H FY26 1H FY25 1H FY26 1H FY25 YoY change 1H FY26 1H FY25 YoY change 1H FY26 1H FY25 T
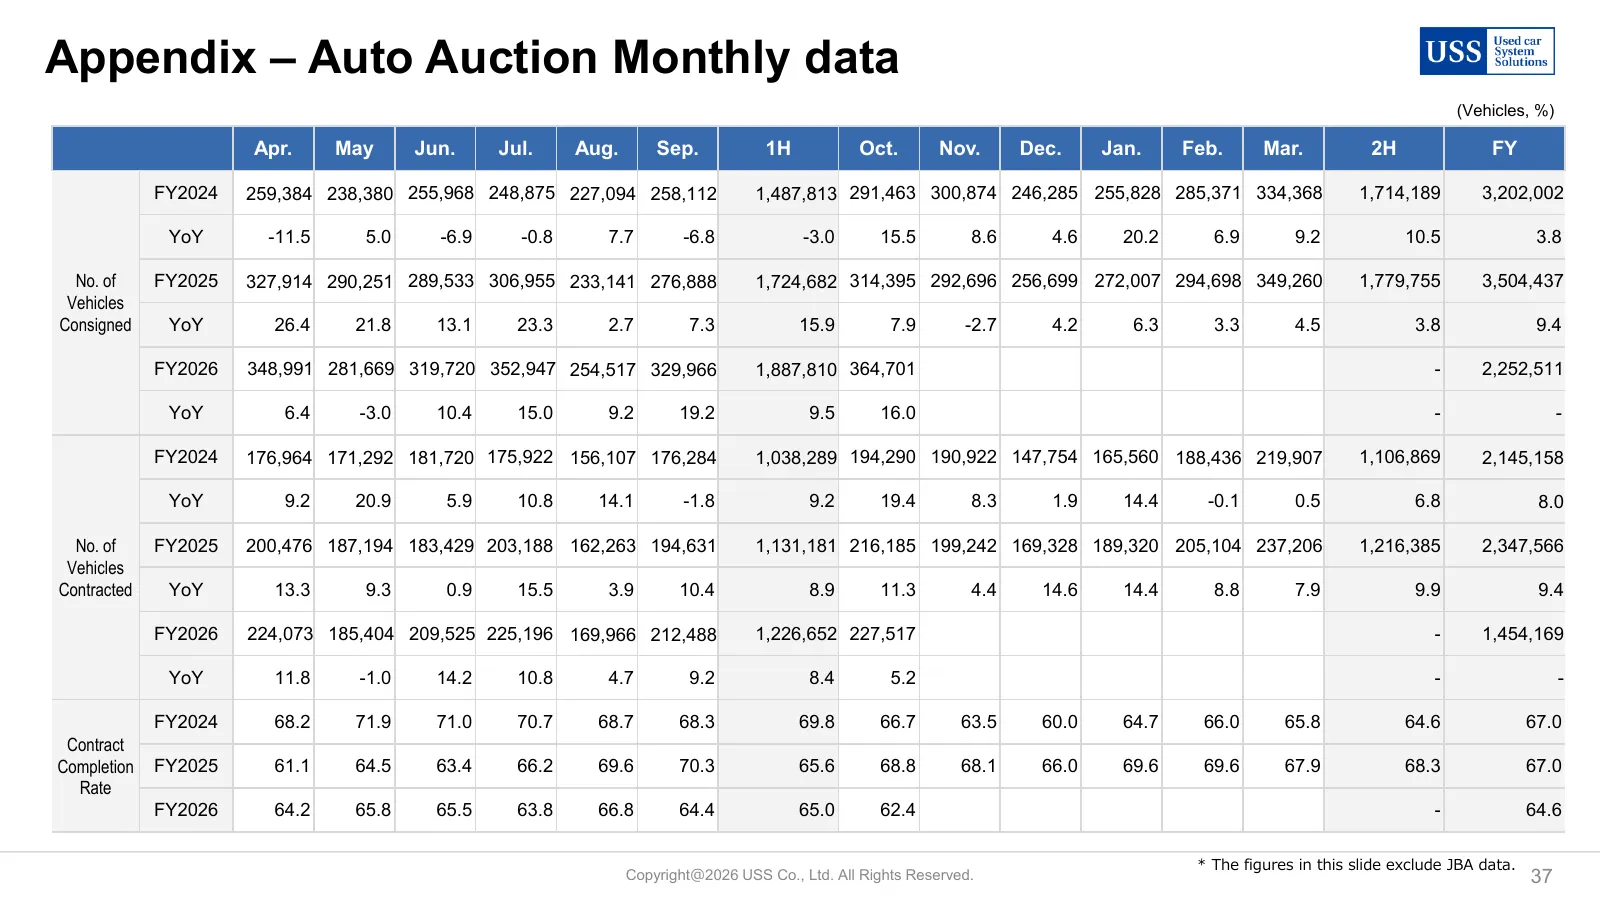
Slide 37: Appendix – Auto Auction Monthly data
Appendix – Auto Auction Monthly data (Vehicles, %) Apr. May Jun. Jul. Aug. Sep. 1H Oct. Nov. Dec. Jan. Feb. Mar. 2H FY FY2024 259,384 238,380 255,968 248,875 227,094 258,112 1,487,813 291,463 300,874 246,285 255,828 285,371 334,368 1,714,189 3,202,002 YoY -11.5 5.0 -6.9 -0.8 7.7 -6.8 -3.0 15.5 8.6 4
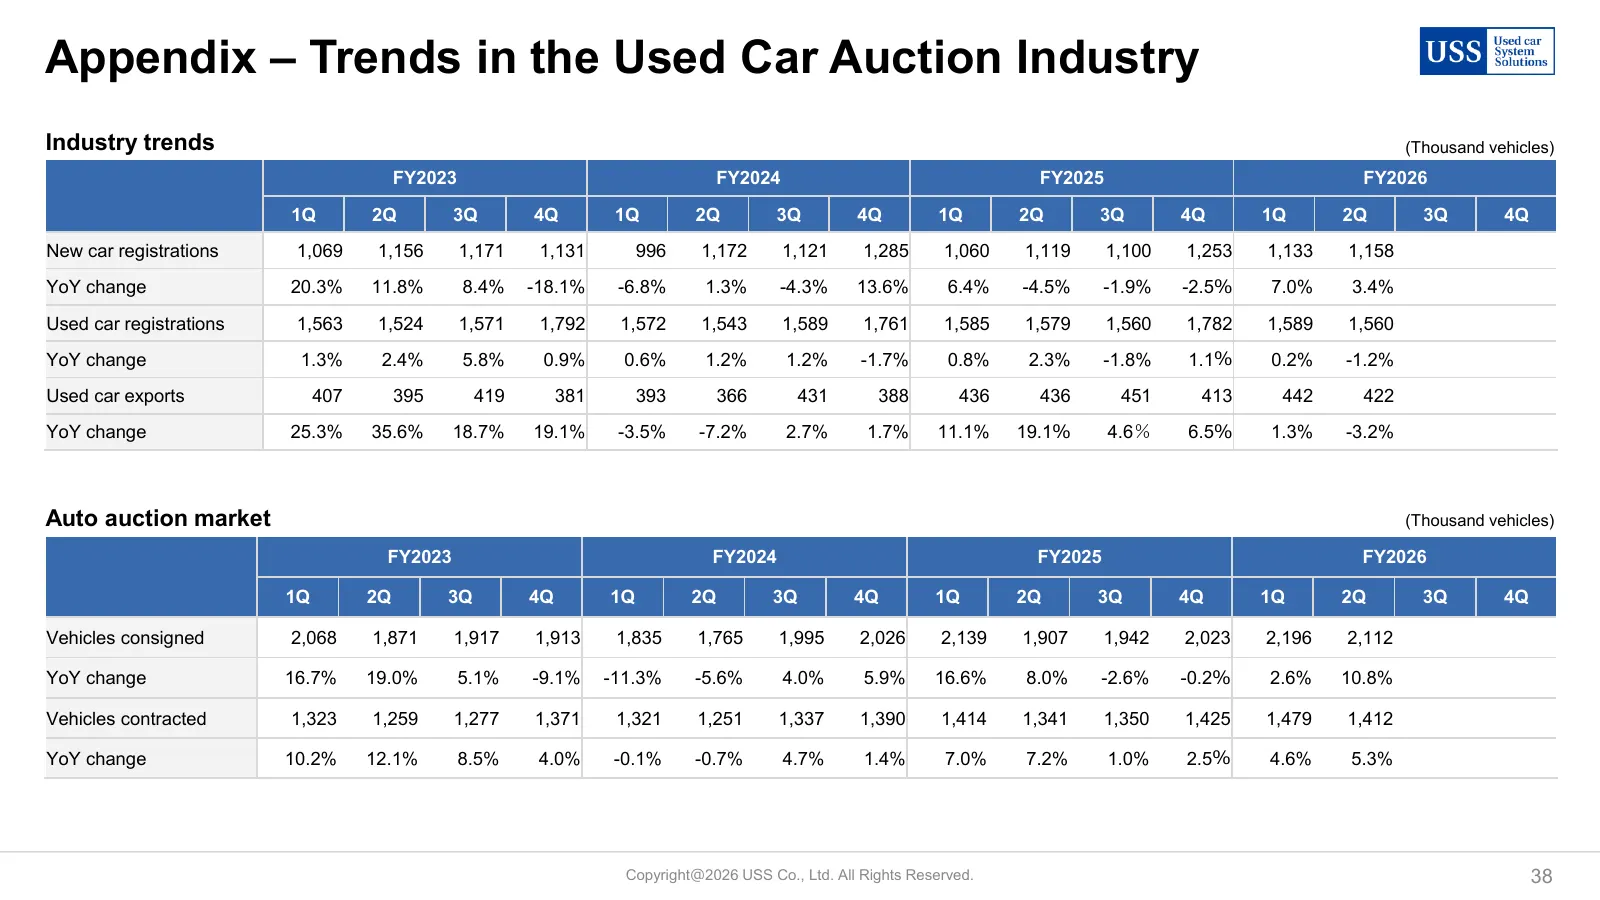
Slide 38: Appendix – Trends in the Used Car Auction Industry
Appendix – Trends in the Used Car Auction Industry Industry trends (Thousand vehicles) FY2023 FY2024 FY2025 FY2026 1Q 2Q 3Q 4Q 1Q 2Q 3Q 4Q 1Q 2Q 3Q 4Q 1Q 2Q 3Q 4Q New car registrations 1,069 1,156 1,171 1,131 996 1,172 1,121 1,285 1,060 1,119 1,100 1,253 1,133 1,158 YoY change 20.3% 11.8% 8.4% -18.1
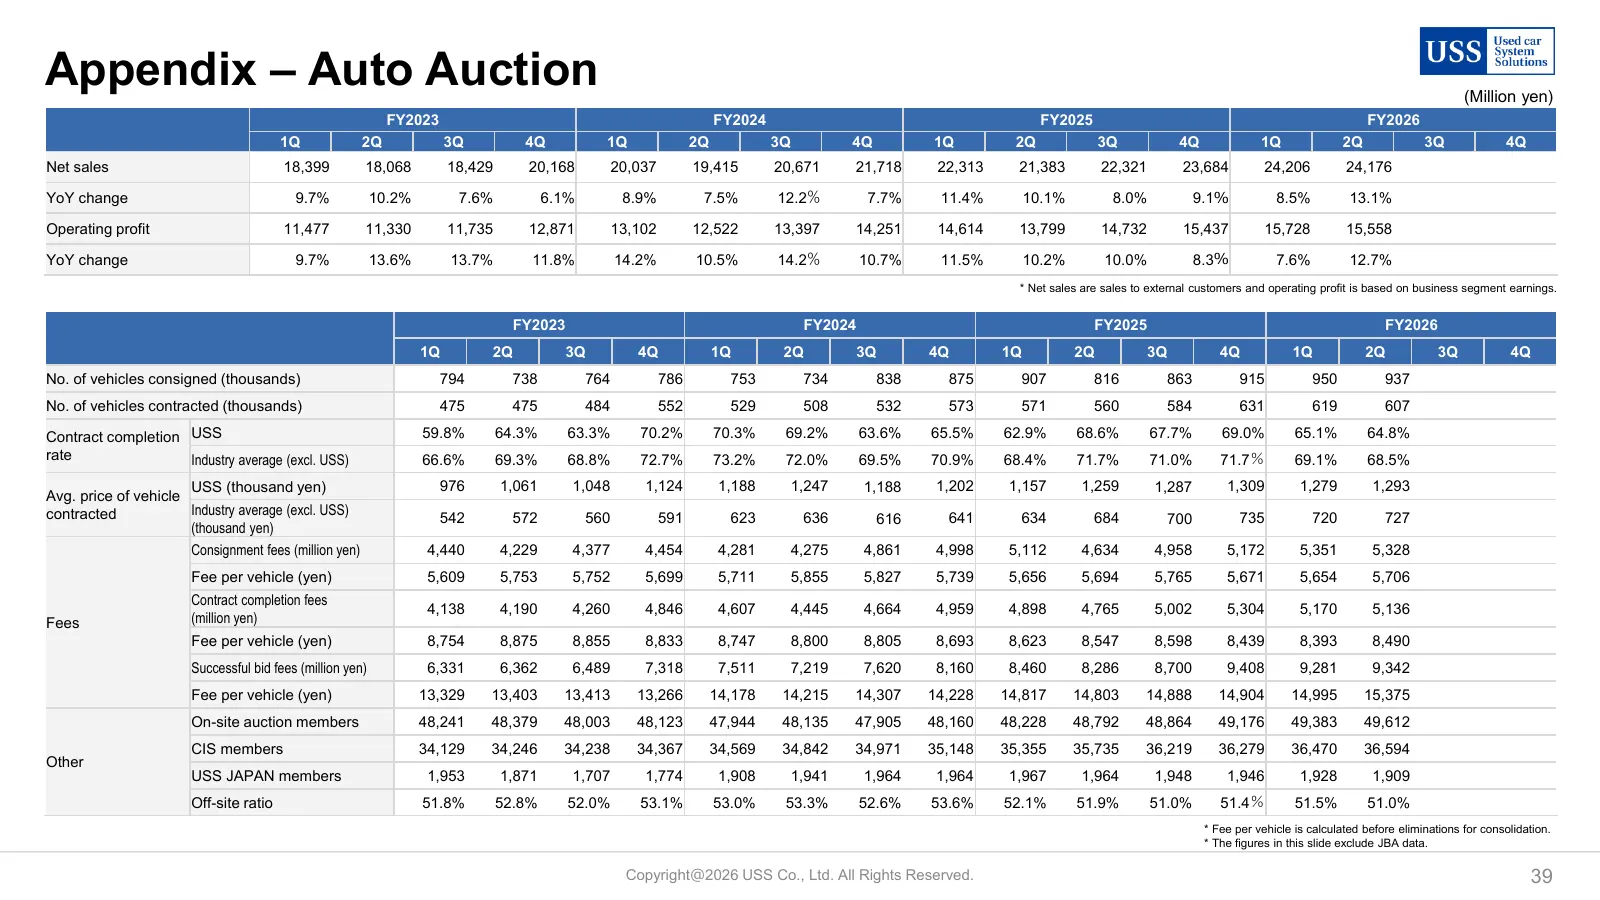
Slide 39: Appendix – Auto Auction
Appendix – Auto Auction (Million yen) FY2023 FY2024 FY2025 FY2026 1Q 2Q 3Q 4Q 1Q 2Q 3Q 4Q 1Q 2Q 3Q 4Q 1Q 2Q 3Q 4Q Net sales 18,399 18,068 18,429 20,168 20,037 19,415 20,671 21,718 22,313 21,383 22,321 23,684 24,206 24,176 YoY change 9.7% 10.2% 7.6% 6.1% 8.9% 7.5% 12.2% 7.7% 11.4% 10.1% 8.0% 9.1% 8.5
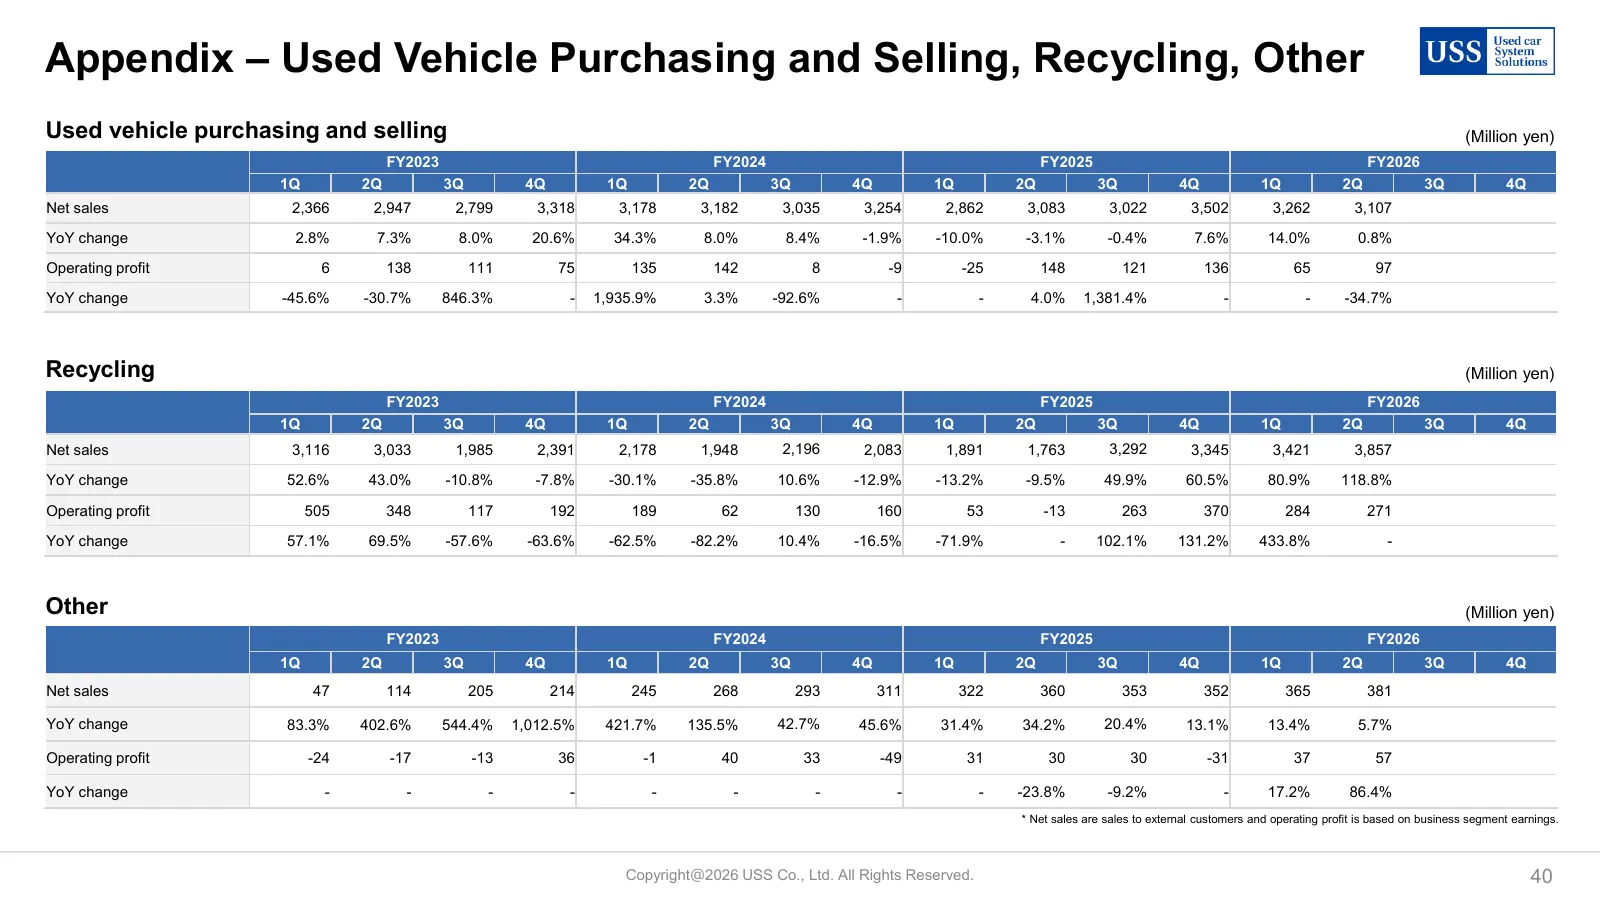
Slide 40: Appendix – Used Vehicle Purchasing and Selling, Recycling, Other
Appendix – Used Vehicle Purchasing and Selling, Recycling, Other Used vehicle purchasing and selling (Million yen) FY2023 FY2024 FY2025 FY2026 1Q 2Q 3Q 4Q 1Q 2Q 3Q 4Q 1Q 2Q 3Q 4Q 1Q 2Q 3Q 4Q Net sales 2,366 2,947 2,799 3,318 3,178 3,182 3,035 3,254 2,862 3,083 3,022 3,502 3,262 3,107 YoY change 2.8%
Source: 6ix earnings call
More decks from USS Co., Ltd.
 Q2 FY2026 Earnings Presentation40 slides · November 2026
 Q1 FY2026 Earnings Presentation39 slides · August 2026
 FY2025 Earnings Presentation42 slides · May 2026
 Q3 FY2025 Earnings Presentation40 slides · February 2026
 2Q FY2025 Earnings Presentation40 slides · November 2025
 Q1 FY2025 Earnings Presentation40 slides · August 2025