Alliance Bankshares — Investor Presentation (December 2006)
36 slides from Alliance Bankshares's investor presentation, Dec 7, 2006
Slide 1: Alliance Bank
"Alliance ess 3 re banking is today. And tom:
Slide 2: Who We Are
WHO WE ARE Diversified banking organization in one of the most desirable, affluent markets in the country $643.7 million in total assets as of September 30, 2006; opened for business in November 1998 Five banking offices, an LPO, three mortgage origination offices, a wealth management team and a ful
Slide 3: Who We Are
Emphasis on small to medium sized businesses with complementary, full service consumer services Broad array of financial services products Stable, steady performer with responsive and experienced management Strong credit culture and discipline WHO WE ARE
Slide 4: Our Mission
To build long-term relationships by listening to our clients, understanding their needs and providing customized financial solutions that exceed their expectations. OUR MISSION
Slide 5: Who We Are
WHO WE ARE Thomas A. Young, Jr., President and Chief Executive Officer 37 years of banking experience Paul M. Harbolick, Jr., CPA Executive Vice President and Chief Financial Officer 25 years of financial experience John B. McKenney, III, Senior Vice President, Chief Credit Officer 28 years of banki
Slide 6: Who We Are
WHO WE ARE Frank H. Grace, III President, Alliance Home Funding Head of the Private Client division 28 years of banking experience Thomas Patrick Danaher, President, Alliance Insurance Agency 20 years of insurance experience
Slide 7: Who We Are
WHO WE ARE Craig W. Sacknoff, Senior Vice President, Director Residential Real Estate Finance 35 years of banking experience Michael C. O'Grady, Senior Vice President, Director of Commercial Banking 32 years of banking experience
Slide 8: Board of Directors
Comprised of regional business leaders including CPAs, Insurance, Association and Construction Professionals, Alliance's Board of Directors represents a distinguished collection of innovative, yet fiscally conservative individuals. BOARD OF DIRECTORS
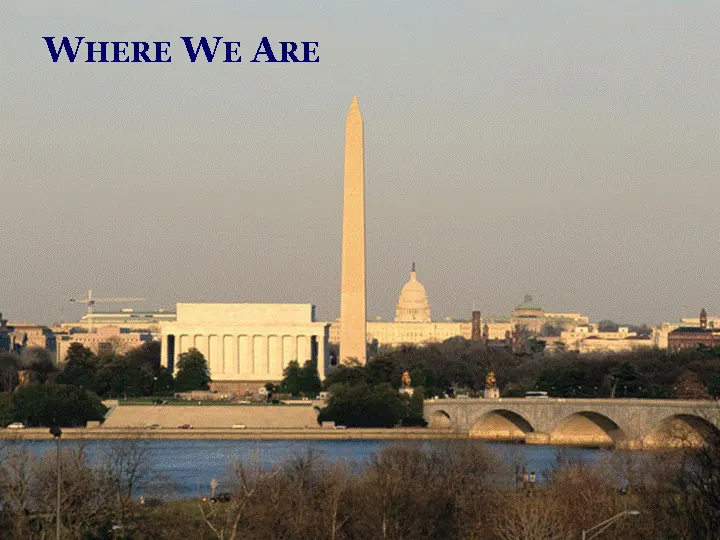
Slide 9: Where We Are
‘WHERE WE ARE
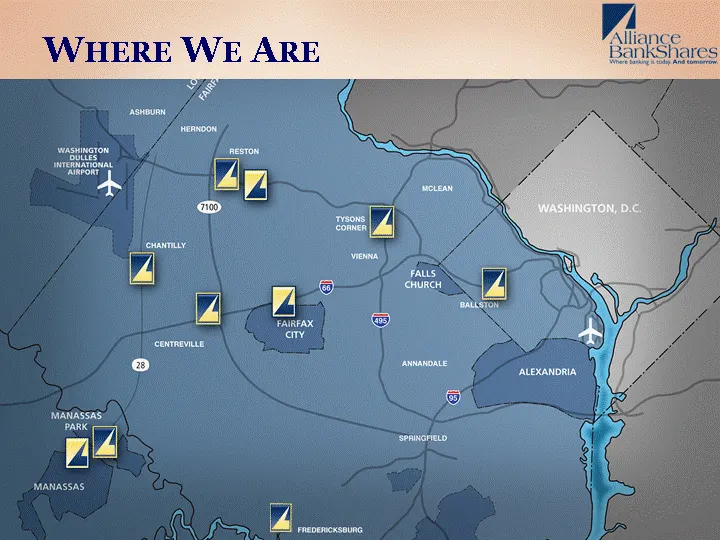
Slide 10: Manassas branch map
MANASSAS PARK MANASSAS Vi
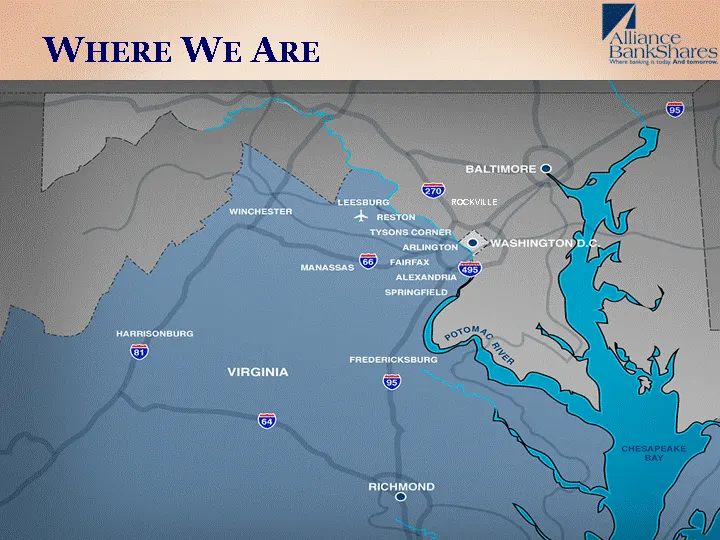
Slide 11: Harrisonburg and Richmond locations
(| ‘Alliance. HaRRIsoNBuRG VIRGINIA RICHMOND te)
Slide 12: Our Market Area
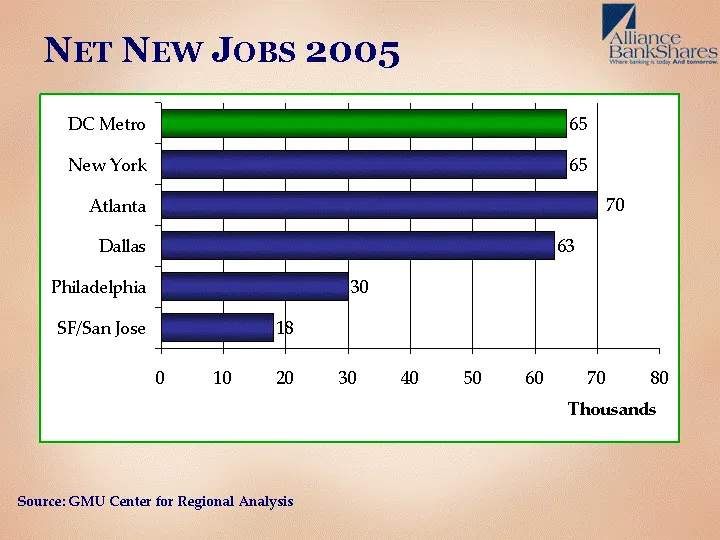
OUR MARKET AREA The region is one of the wealthiest in the nation with a median household income of $71,059 The area has added 72,400 new jobs since September 2005 At 3.2%, the area is tied with Phoenix with the lowest unemployment rate in the country Over the next four years, the Washington area ec
Slide 13: Net New Jobs 2005
Source: GMU Center for Regional Analysis NET NEW JOBS 2005
Slide 14: Net Job Growth 2001-2005
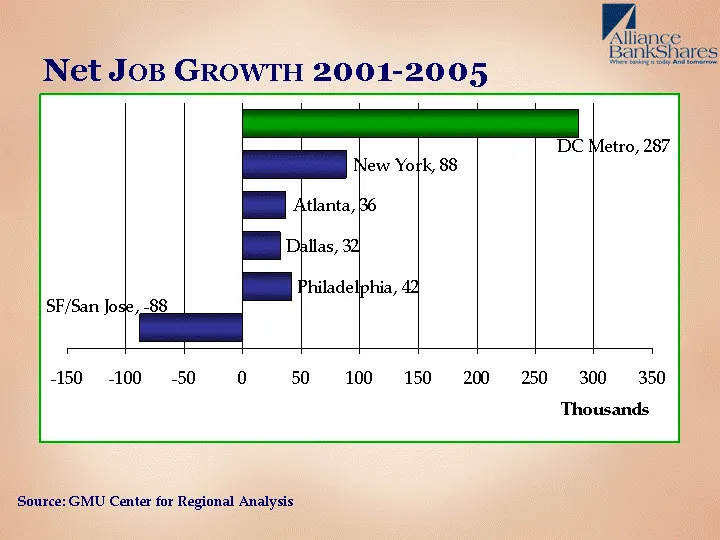
Net JOB GROWTH 2001-2005 Source: GMU Center for Regional Analysis
Slide 15: Our Market Area
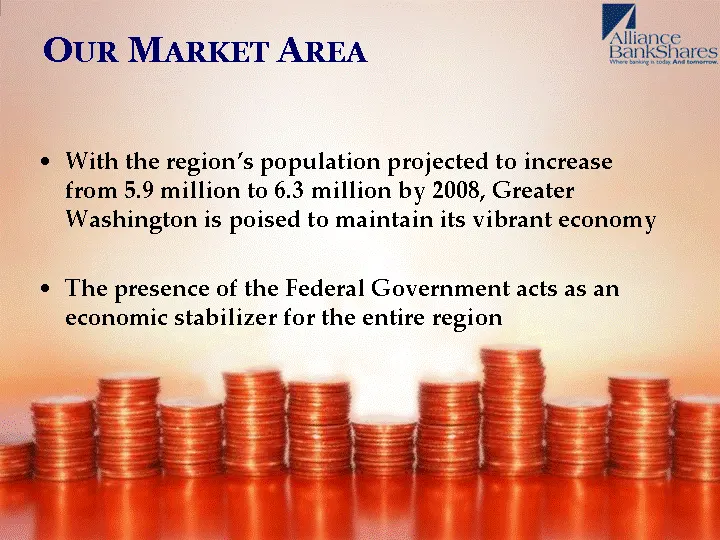
OUR MARKET AREA With the region's population projected to increase from 5.9 million to 6.3 million by 2008, Greater Washington is poised to maintain its vibrant economy The presence of the Federal Government acts as an economic stabilizer for the entire region
Slide 16: Employment by Sector
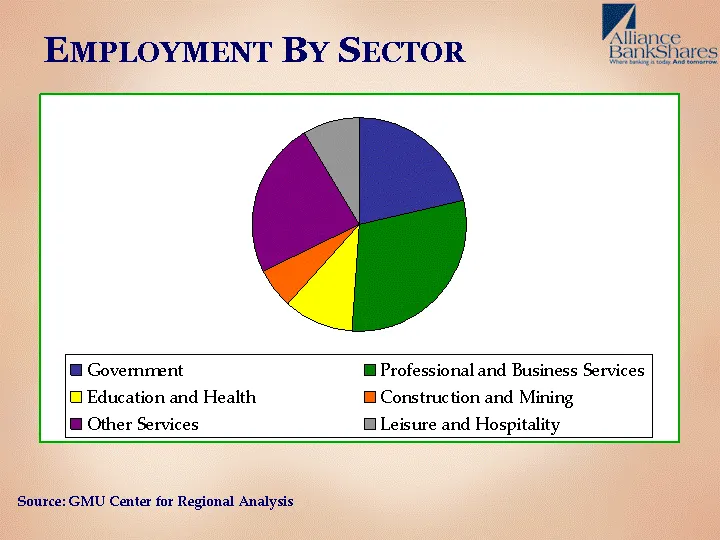
EMPLOYMENT BY SECTOR Source: GMU Center for Regional Analysis
Slide 17: Local Housing Market
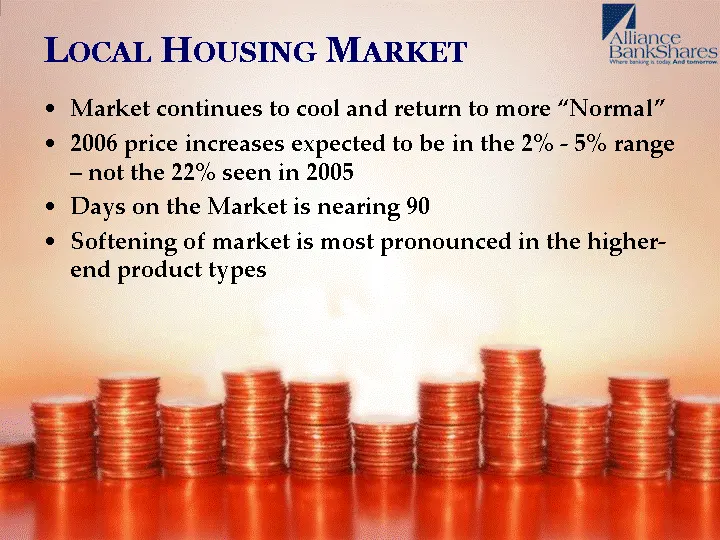
LOCAL HOUSING MARKET Market continues to cool and return to more "Normal" 2006 price increases expected to be in the 2% - 5% range - - not the 22% seen in 2005 Days on the Market is nearing 90 Softening of market is most pronounced in the higher- end product types
Slide 18: Our Performance
Vi “Alliance Bank Gus, OUR PERFORMANCE
Slide 19: Total Assets
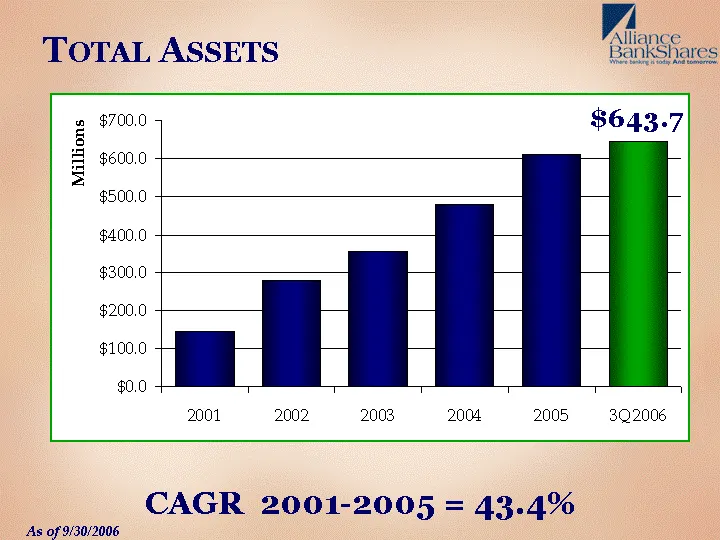
TOTAL ASSETS CAGR 2001-2005 = 43.4% As of 9/30/2006
Slide 20: Total Loans
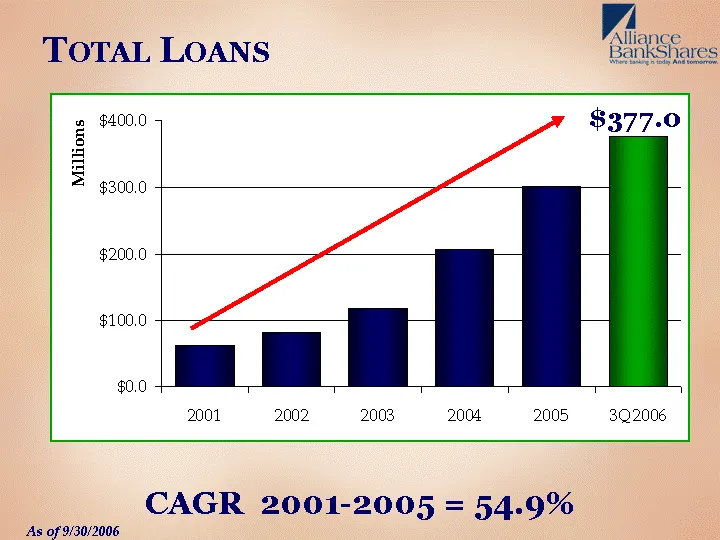
TOTAL LOANS CAGR 2001-2005 = 54.9% As of 9/30/2006
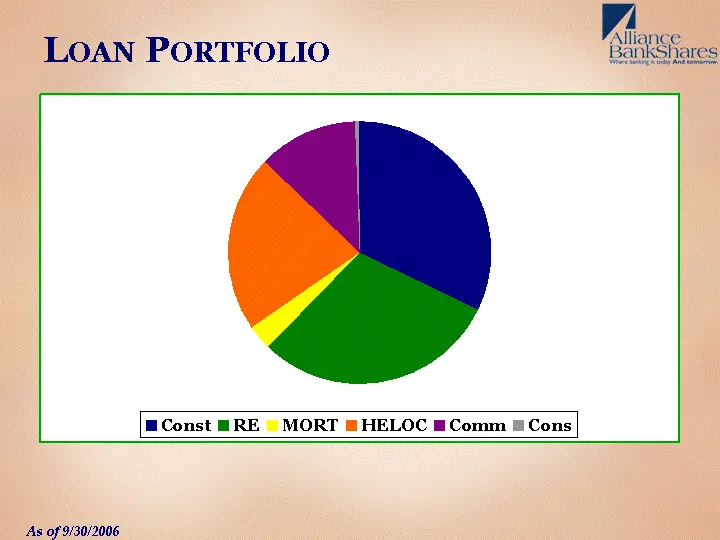
Slide 21: Loan Portfolio
LOAN PORTFOLIO As of 9/30/2006
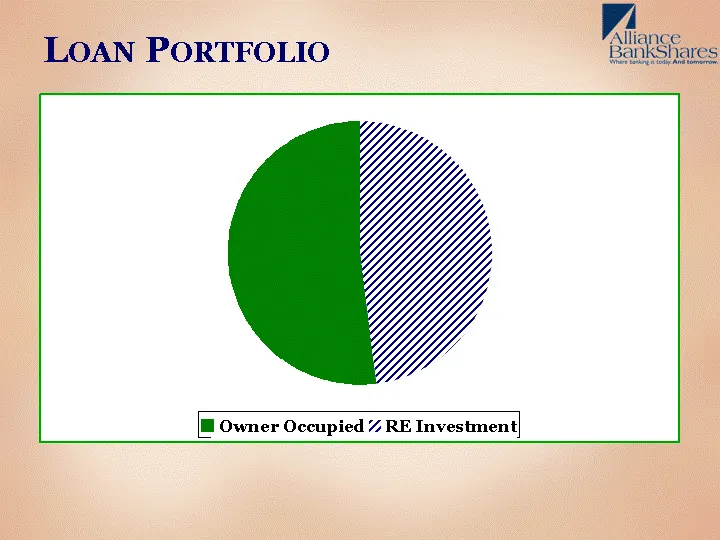
Slide 22: Loan Portfolio
LOAN PORTFOLIO Owner Occupied RE Investment
Slide 23: Credit Quality
CREDIT QUALITY Strong credit culture; minimal net chargeoffs since inception. Allowance for loan losses as of 9/30/2006 1.15% No nonaccrual loans or OREO $3.3 million of loans with a specific allocation of the allowance as of 9/30/2006
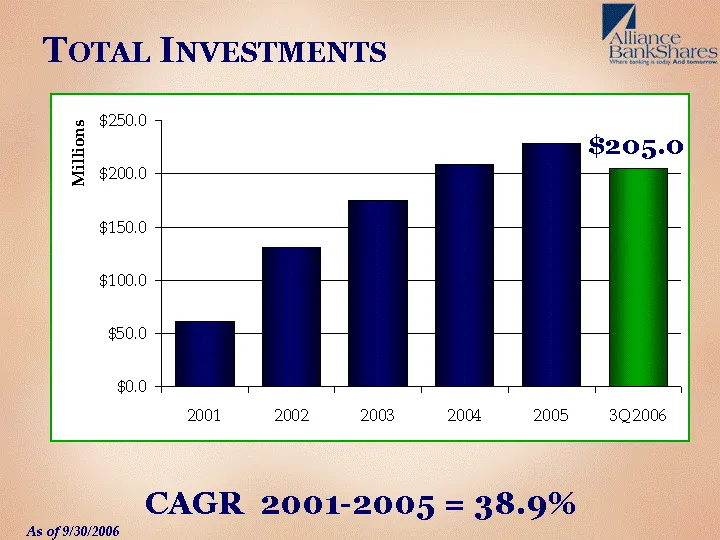
Slide 24: Total Investments
TOTAL INVESTMENTS CAGR 2001-2005 = 38.9% As of 9/30/2006 As of 9/30/2006
Slide 25: Investment Portfolio
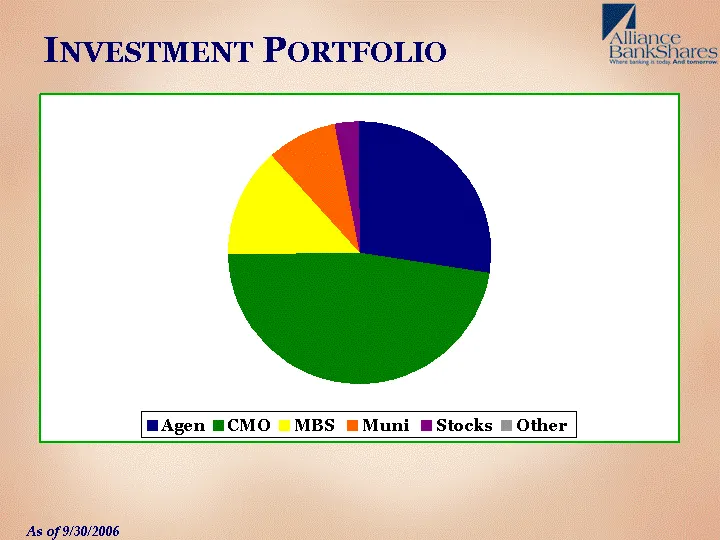
INVESTMENT PORTFOLIO As of 9/30/2006
Slide 26: Total Deposits
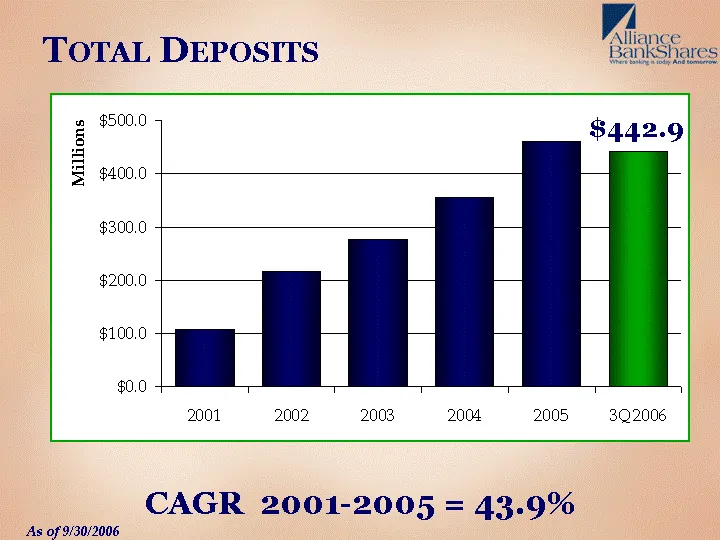
TOTAL DEPOSITS CAGR 2001-2005 = 43.9% As of 9/30/2006 As of 9/30/2006
Slide 27: Deposit Composition
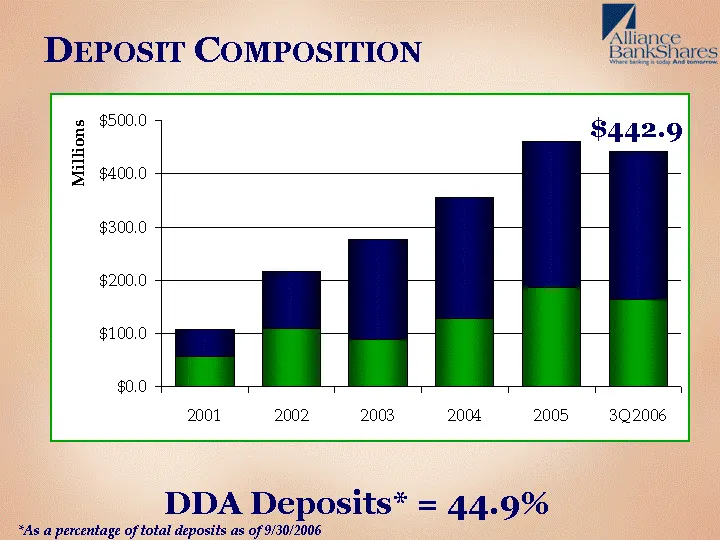
DEPOSIT COMPOSITION DDA Deposits* = 44.9% *As a percentage of total deposits as of 9/30/2006 $442.9
Slide 28: Net Income
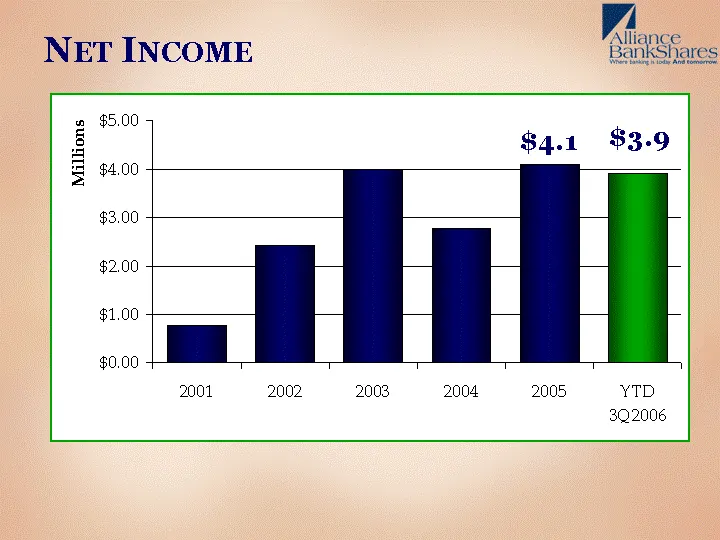
NET INCOME wo $5.00 5 2 EB $4.1 $3.9 3 $4.00 $3.00. $2.00 $1.00 6 2001 2002, 2003 2004 2005, YT! sqa0ve
Slide 29: Core Earnings
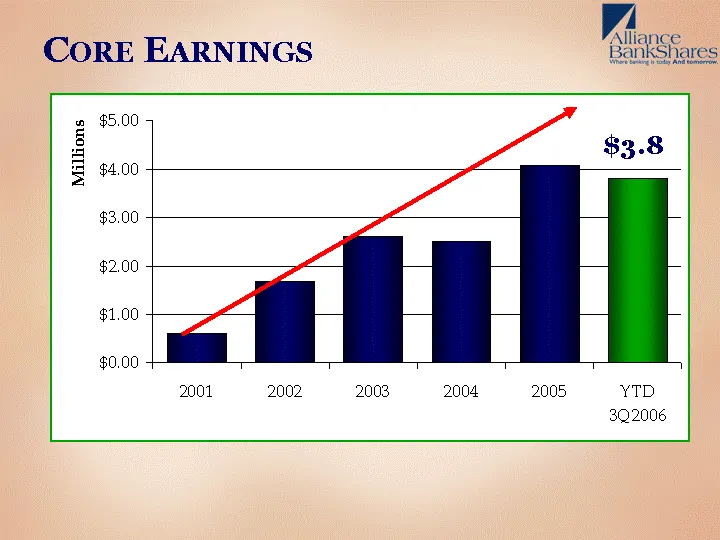
CORE EARNINGS $5.00 9 $4.00 Millions $3.00 $2.00 $1.00 $0.00 2001 2002 2003 2004 2005, YTD 3Q2006
Slide 30: Earnings Per Share, Diluted
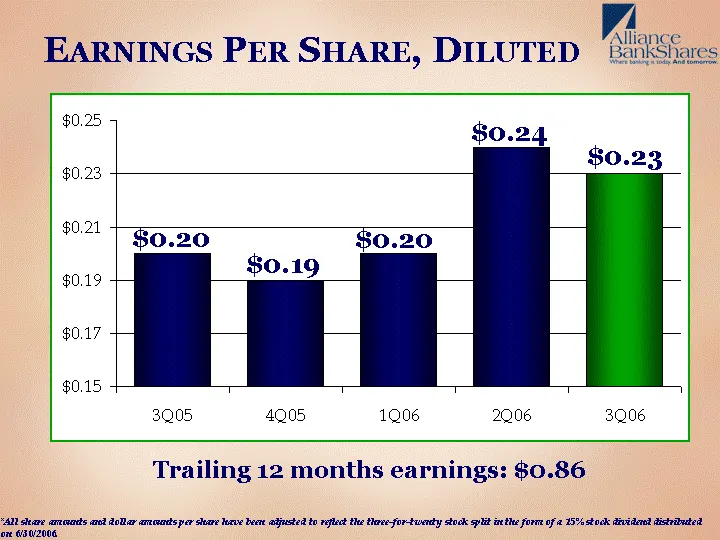
EARNINGS PER SHARE, DILUTED $0.19 $0.20 $0.20 $0.24 *All share amounts and dollar amounts per share have been adjusted to reflect the three-for-twenty stock split in the form of a 15% stock dividend distributed on 6/30/2006. Trailing 12 months earnings: $0.86 $0.23
Slide 31: Looking Ahead
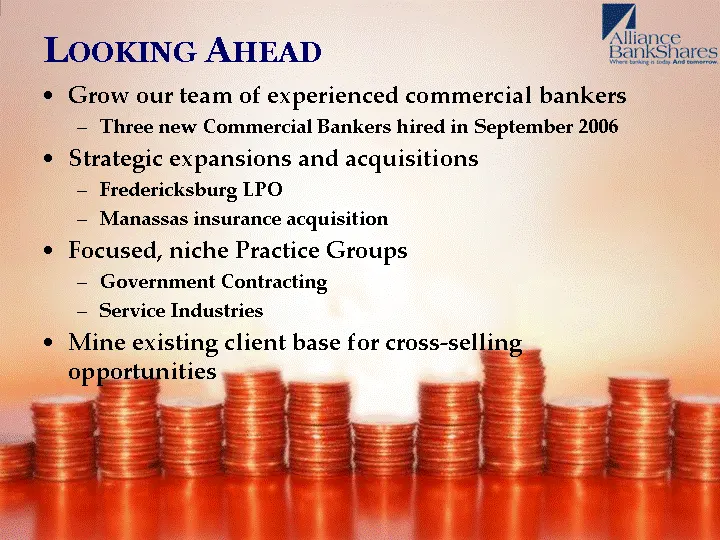
LOOKING AHEAD Grow our team of experienced commercial bankers Three new Commercial Bankers hired in September 2006 Strategic expansions and acquisitions Fredericksburg LPO Manassas insurance acquisition Focused, niche Practice Groups Government Contracting Service Industries Mine existing client bas
Slide 32: Looking Ahead
LOOKING AHEAD Remain committed to improving financial performance Improve ROE and ROA Enhance EPS Increase Net Interest Margin
Slide 33: Why Alliance
WHY ALLIANCE Exceptional marketplace Proven track record of success Stable, growing earnings Strong management team Focused and consistent expansion Strong emphasis on credit quality
Slide 34: Attractive Growth Stock Valuation
ATTRACTIVE GROWTH STOCK VALUATION November 17, 2006 Closing Price $15.90 Price to Book Multiple 1.65X Price to Trailing Earnings Multiple 18.5X
Slide 35: Forward Looking Statement
FORWARD LOOKING STATEMENT This presentation and other communications and statements by the Company and its management may contain "forward-looking statements," including statements about our beliefs, plans, objectives, goals, expectations, estimations and intentions. These statements are subject to

Slide 36: Thank you
Visit us on-line at: www.alliancebankva.com Thank you for your time and interest in our company.
Source: SEC EDGAR · 8-K filed Dec 7, 2006
More decks from Alliance Bankshares Corp
 FBR Fall Investor Conference 201146 slides · Nov 29, 2011
 Stifel Nicolaus Bank Conference (November 2011)51 slides · Nov 2, 2011
 Merger or Acquisition (September 2011)48 slides · Sep 19, 2011
 Q1 2009 Earnings Presentation13 slides · May 8, 2009
 Investor Presentation (August 2007)34 slides · Aug 13, 2007
 Q1 2007 Earnings Presentation31 slides · May 17, 2007