Alliance Bankshares — Investor Presentation (August 2007)
34 slides from Alliance Bankshares's investor presentation, Aug 13, 2007
Slide 1: Where banking is today.
Where banking is today. /
Slide 2: Who We Are
WHO WE ARE Diversified banking organization in one of the most desirable, affluent markets in the country $581.1 million in total assets as of June 30, 2007; opened for business in November 1998 Five banking branches, a wealth management team, a Loan Processing Office and a three- location full serv
Slide 3: Who We Are
WHO WE ARE Emphasis on small to medium sized businesses with complementary, full service consumer services Broad array of financial services products Insurance lines include P&C, Life, Health, Homeowners, Auto, etc... Responsive and experienced management Strong credit culture and discipline
Slide 4: Why We Are Different
WHY WE ARE DIFFERENT Competitive Approach Speed & Responsiveness We meet or exceed customer timelines Execution & Reliability We deliver on our commitments Customization & Flexibility We adjust our products to meet customer needs while meeting our own financial objectives
Slide 5: Our Mission
OUR MISSION To build long-term relationships by listening to our clients, understanding their needs and providing customized financial solutions that exceed their expectations.
Slide 6: Who We Are
WHO WE ARE Thomas A. Young, Jr., President and Chief Executive Officer 37 years of banking experience Paul M. Harbolick, Jr., CPA Executive Vice President and Chief Financial Officer 25 years of financial experience Frank H. Grace, III, Executive Vice President 27 years of banking experience Craig W
Slide 7: Who We Are
WHO WE ARE Thomas Patrick Danaher, President, Alliance Insurance Agency 25 years of insurance experience John B. McKenney, III, Senior Vice President, Chief Credit Officer 28 years of banking experience Michael C. O'Grady, Senior Vice President, Director of Commercial Banking 32 years of banking exp
Slide 8: Board of Directors
BOARD OF DIRECTORS Comprised of regional business leaders including CPAs, Insurance, Association, Construction Professionals and Commercial Real Estate Executives, Alliance's Board of Directors represents a distinguished collection of innovative, yet fiscally conservative individuals.
Slide 9: Our Market Area
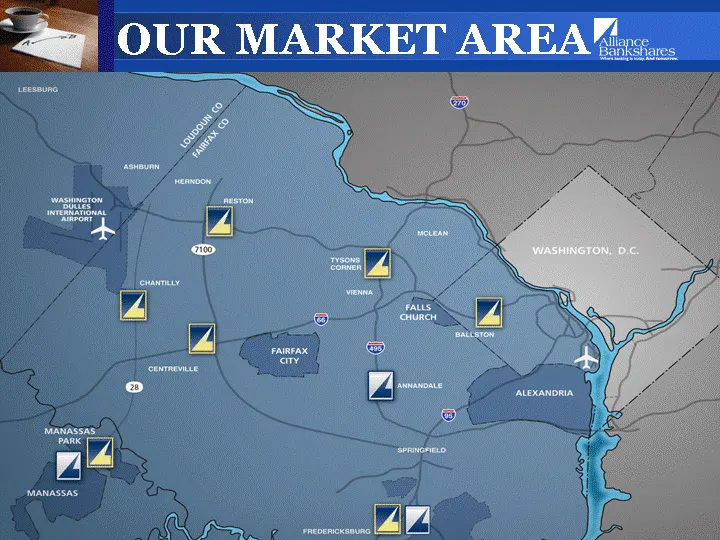
‘@gj) OUR MARKET AREA
Slide 10: Regional Housing
REGIONAL HOUSING Inventories hit record levels in 2006 Month-over-the-year price changes turned negative in July 2006 Price changes are likely to remain in negative territory Center for Regional Analysis Current Market Challenges
Slide 11: Housing Market - Nationally
HOUSING MARKET - NATIONALLY Higher mortgage rates, in conjunction with tighter lending standards are reducing the demand for homes. Pullback in the housing market, combined with volatile energy prices pose serious risks to the economy. Drag on growth from the downturn in the housing market should ea
Slide 12: Local Housing Market Challenges
LOCAL HOUSING MARKET CHALLENGES While stronger than many markets across the country, DC metro is also experiencing a significant lag in sales activity Inventories of homes available for sale have increased 50% from one year ago The average days on the market has increased to 83, up from 57 one year
Slide 13: Our Performance
OUR PERFORMANCE
Slide 14: Total Assets
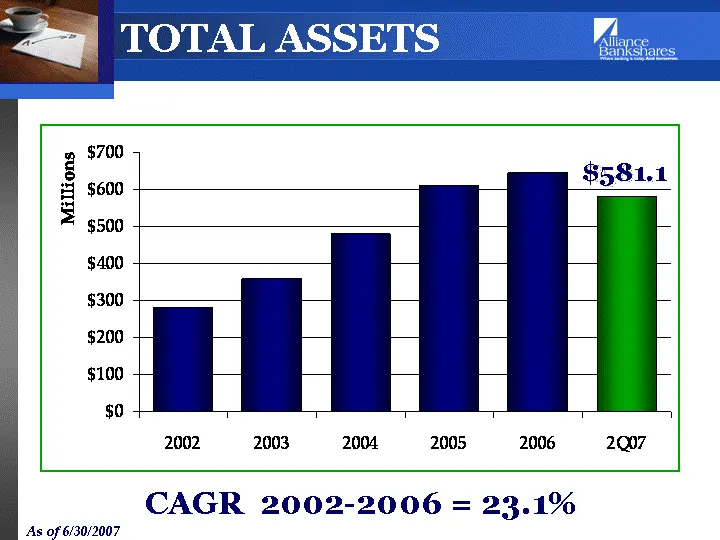
CAGR 2002-2006 = 23.1% As of 6/30/2007 TOTAL ASSETS $581.1
Slide 15: Total Loans
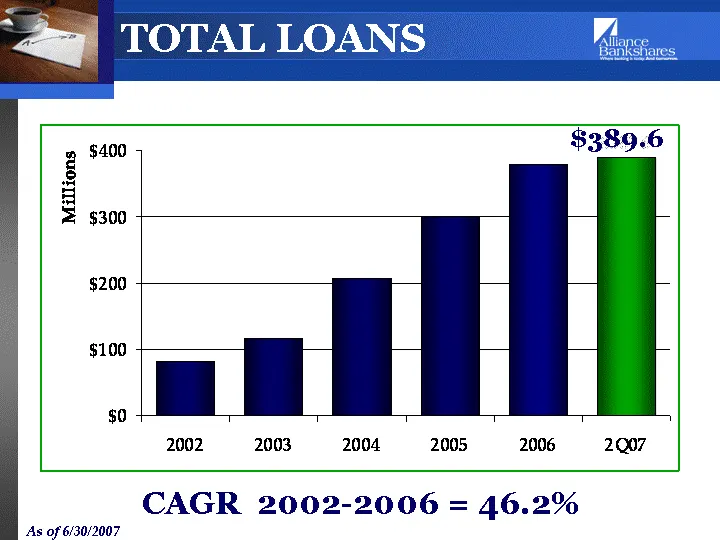
CAGR 2002-2006 = 46.2% TOTAL LOANS As of 6/30/2007 $389.6
Slide 16: Loan Portfolio
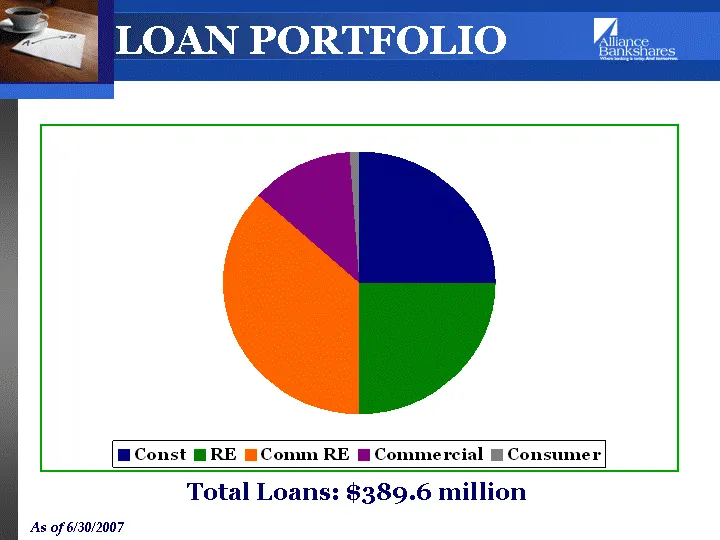
LOAN PORTFOLIO Total Loans: $389.6 million As of 6/30/2007
Slide 17: AFS Investments
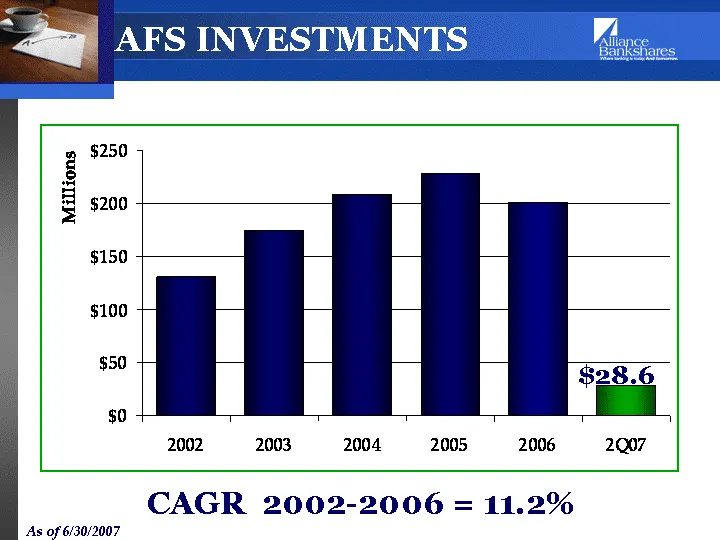
AFS INVESTMENTS CAGR 2002-2006 = 11.2% As of 6/30/2007 $28.6
Slide 18: AFS Investments
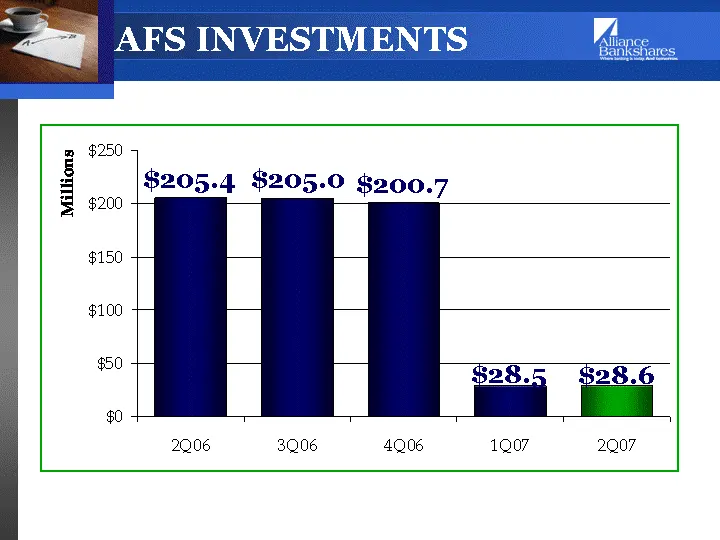
AFS INVESTMENTS $28.6 $205.4 $205.0 $200.7 $28.5
Slide 19: Trading Assets
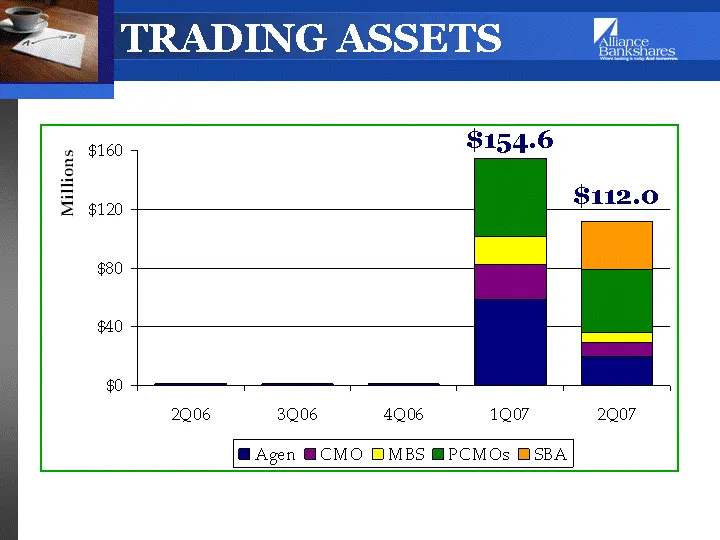
TRADING ASSETS $112.0 $154.6
Slide 20: Trading Assets
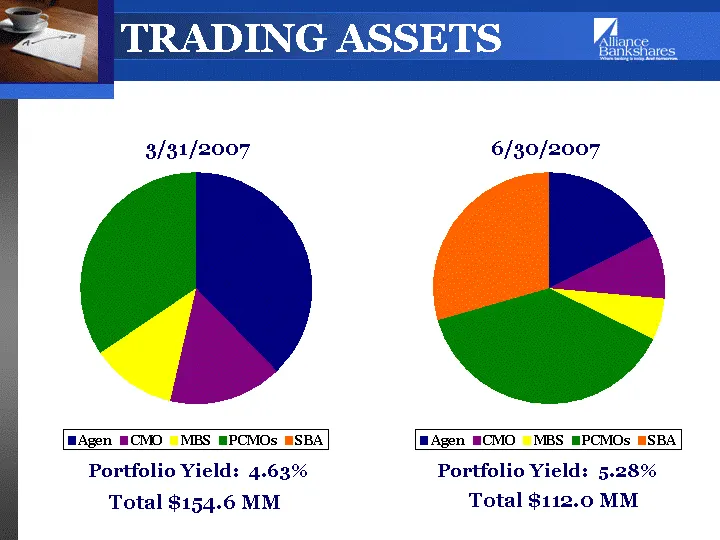
TRADING ASSETS Portfolio Yield: 4.63% Portfolio Yield: 5.28% 3/31/2007 6/30/2007 Total $154.6 MM Total $112.0 MM
Slide 21: Total Deposits
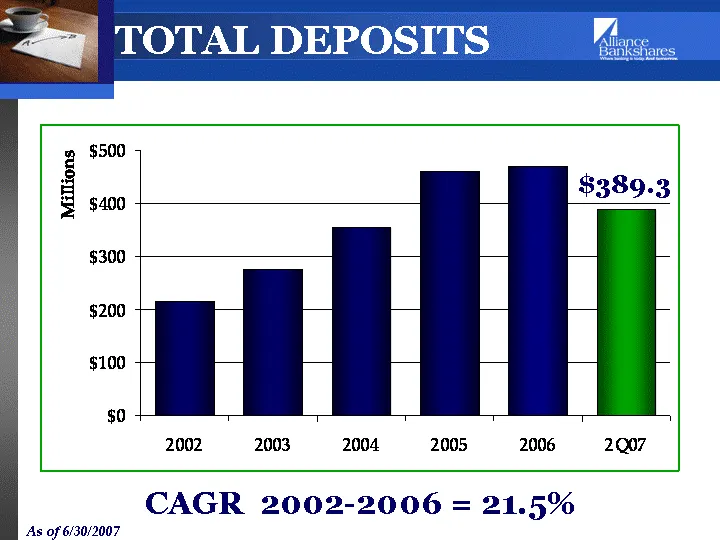
TOTAL DEPOSITS CAGR 2002-2006 = 21.5% As of 6/30/2007 $389.3
Slide 22: Deposit Composition
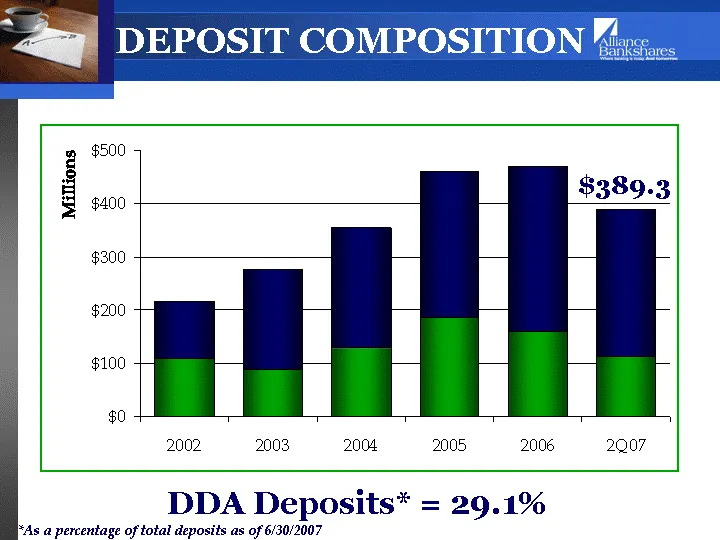
DEPOSIT COMPOSITION DDA Deposits* = 29.1% *As a percentage of total deposits as of 6/30/2007 $389.3
Slide 23: DDA Deposits
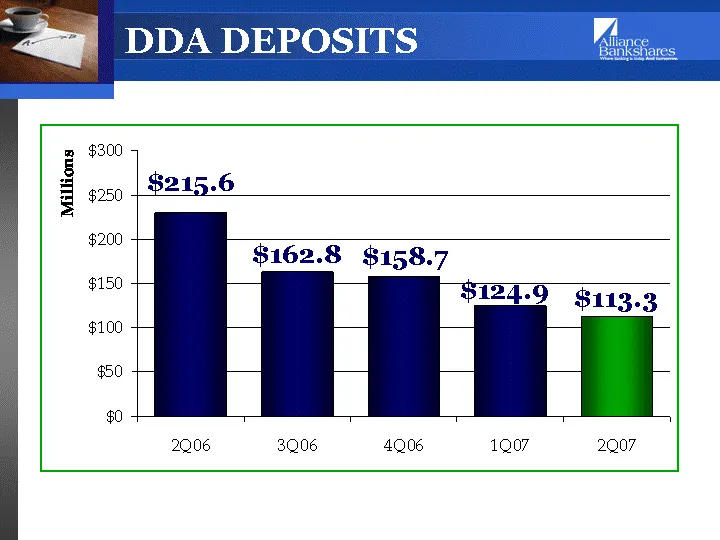
DDA DEPOSITS $113.3 $215.6 $162.8 $158.7 $124.9
Slide 24: Credit Quality
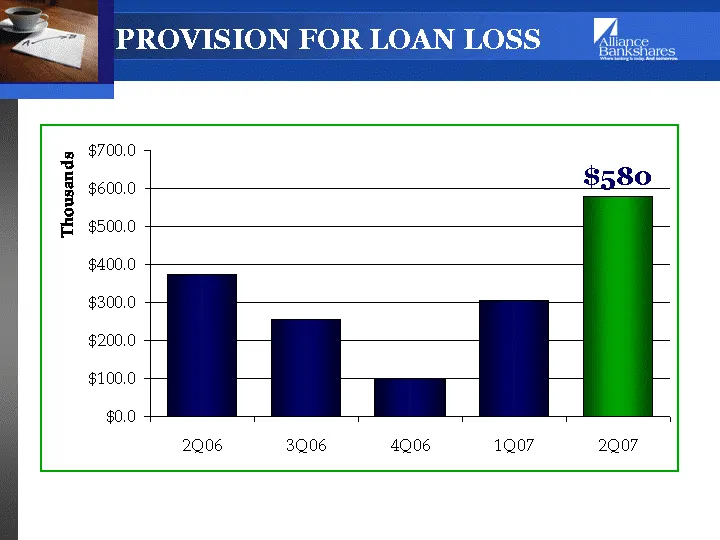
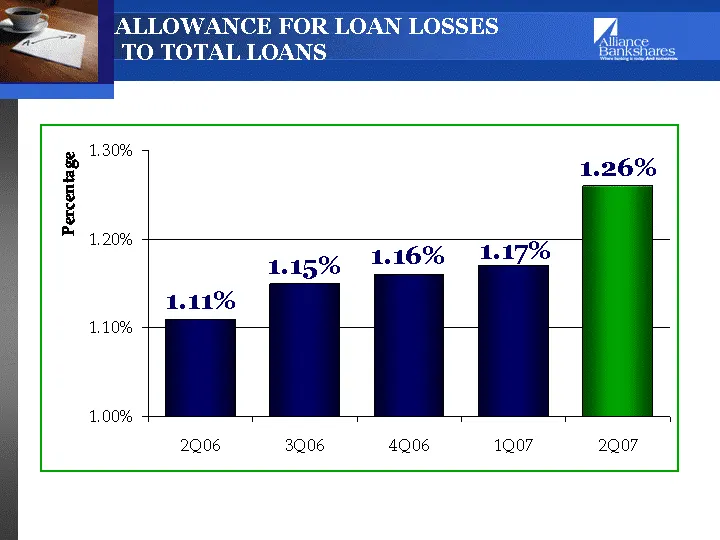
CREDIT QUALITY Challenging Period Increase in secured non-performing assets Allowance for loan losses to total loans as of 6/30/2007 was 1.26% Net Charge Offs for the first six months of 2007 were $363,000
Slide 25: Thousands
Thousands $580 2Q06 3Q06 4Q06 1Q07 2Q07
Slide 26: Allowance for Loan Losses to Total Loans
ALLOWANCE FOR LOAN LOSSES TO TOTAL LOANS 1.26% 1.11% 1.15% 1.16% 1.17%
Slide 27: Non-Accrual Loans
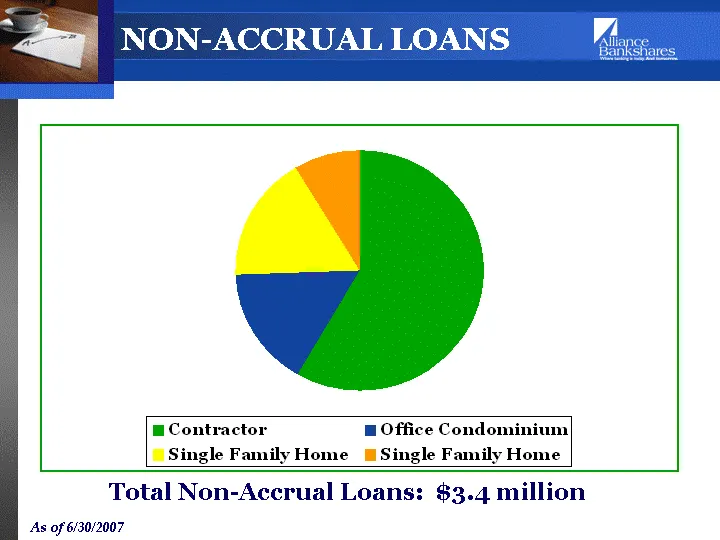
NON-ACCRUAL LOANS NON-ACCRUAL LOANS Total Non-Accrual Loans: $3.4 million As of 6/30/2007
Slide 28: Impaired Loans
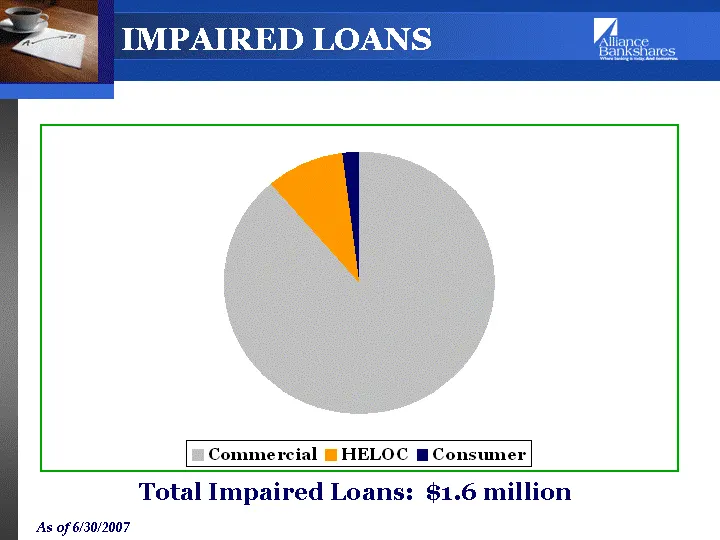
IMPAIRED LOANS Total Impaired Loans: $1.6 million As of 6/30/2007
Slide 29: Total Nonperforming Assets
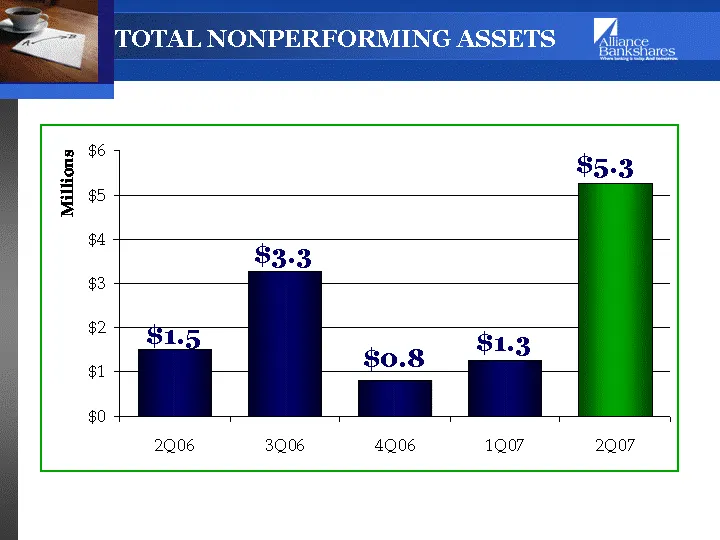
TOTAL NONPERFORMING ASSETS $3.3 $1.5 $0.8 $1.3 $5.3
Slide 30: Earnings Per Share, Diluted
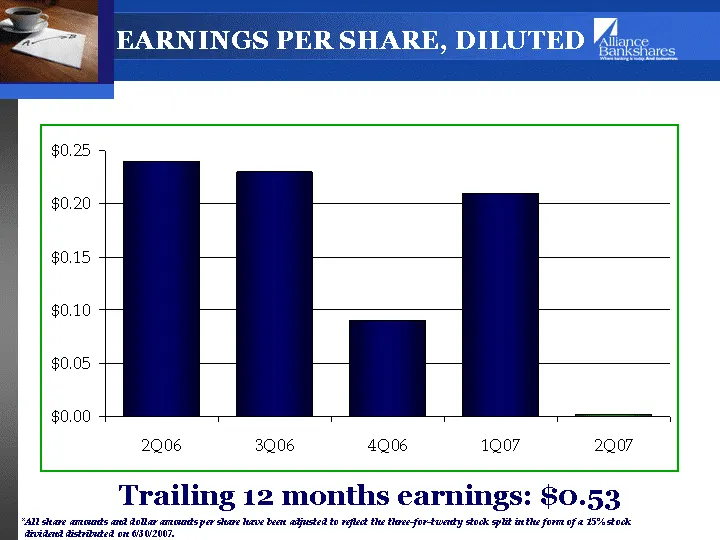
EARNINGS PER SHARE, DILUTED *All share amounts and dollar amounts per share have been adjusted to reflect the three-for-twenty stock split in the form of a 15% stock dividend distributed on 6/30/2007. Trailing 12 months earnings: $0.53
Slide 31: Looking Ahead
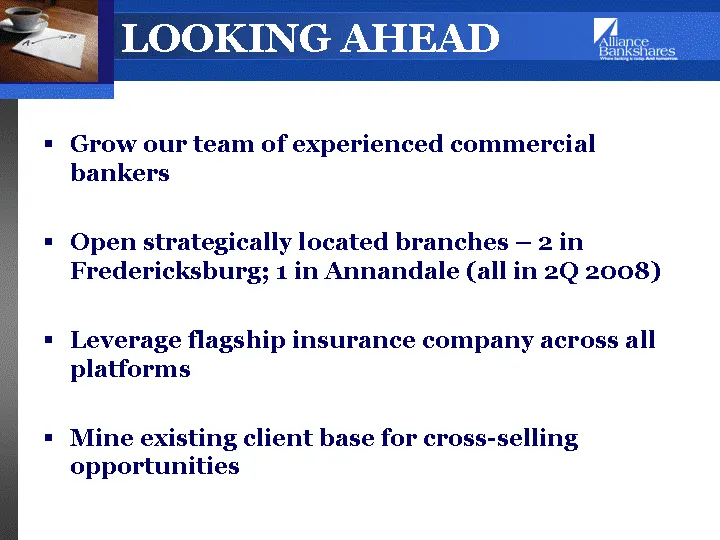
LOOKING AHEAD Grow our team of experienced commercial bankers Open strategically located branches - 2 in Fredericksburg; 1 in Annandale (all in 2Q 2008) Leverage flagship insurance company across all platforms Mine existing client base for cross-selling opportunities
Slide 32: Why Alliance????
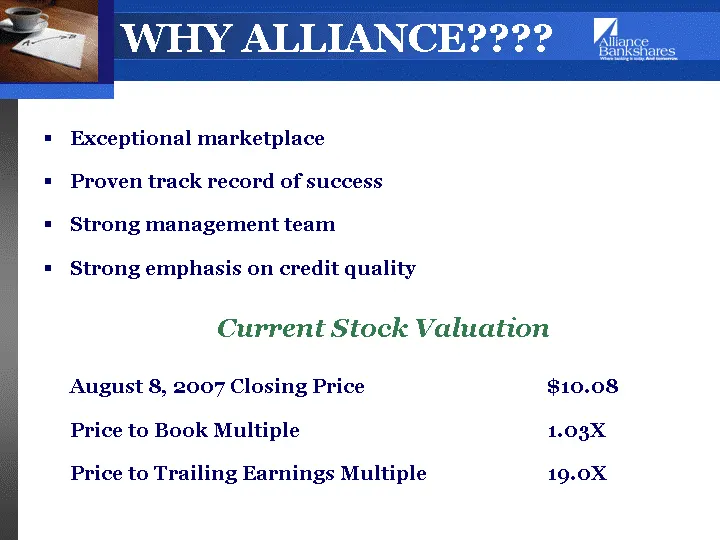
WHY ALLIANCE???? Exceptional marketplace Proven track record of success Strong management team Strong emphasis on credit quality Current Stock Valuation August 8, 2007 Closing Price $10.08 Price to Book Multiple 1.03X Price to Trailing Earnings Multiple 19.0X
Slide 33: Attractive Growth Stock Valuation
ATTRACTIVE GROWTH STOCK VALUATION This presentation and other communications and statements by the Company and its management may contain "forward-looking statements," including statements about our beliefs, plans, objectives, goals, expectations, estimations and intentions. These statements are sub

Slide 34: Thank you for your interest in our company
Thank you for your interest in our company. Visit us on-line at www.alliancebankva.com
Source: SEC EDGAR · 8-K filed Aug 13, 2007
More decks from Alliance Bankshares Corp
 FBR Fall Investor Conference 201146 slides · Nov 29, 2011
 Stifel Nicolaus Bank Conference (November 2011)51 slides · Nov 2, 2011
 Merger or Acquisition (September 2011)48 slides · Sep 19, 2011
 Q1 2009 Earnings Presentation13 slides · May 8, 2009
 Q1 2007 Earnings Presentation31 slides · May 17, 2007
 Investor Presentation (December 2006)36 slides · Dec 7, 2006