Inland Real Estate — Investor Presentation (March 2011)
31 slides from Inland Real Estate's investor presentation, Mar 14, 2011

Slide 1: Investor Presentation Fourth Quarter 2010
Investor Presentation Fourth Quarter 2010 www.inlandrealestate.com NYSE: IRC March 2011
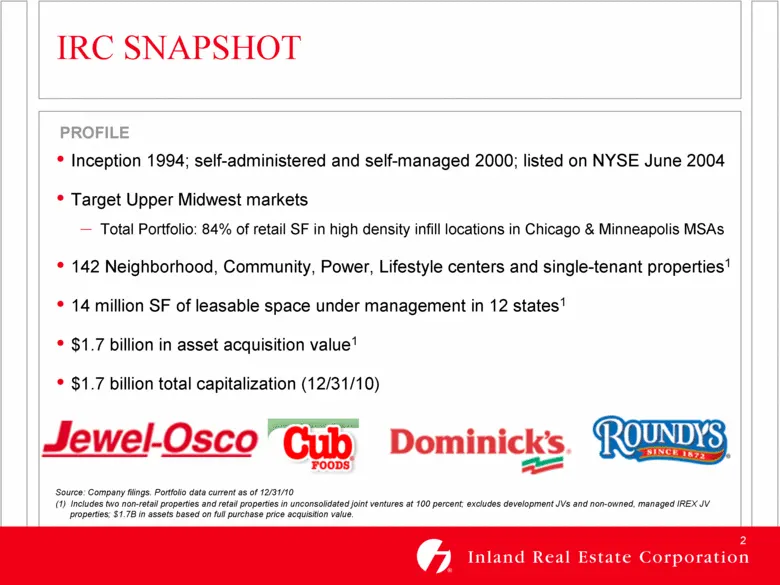
Slide 2: IRC Snapshot Profile
2 IRC SNAPSHOT PROFILE • Inception 1994; self-administered and self-managed 2000; listed on NYSE June 2004 • Target Upper Midwest markets – Total Portfolio: 84% of retail SF in high density infill locations in Chicago & Minneapolis MSAs • 142 Neighborhood, Community, Power, Lifestyle centers and sin
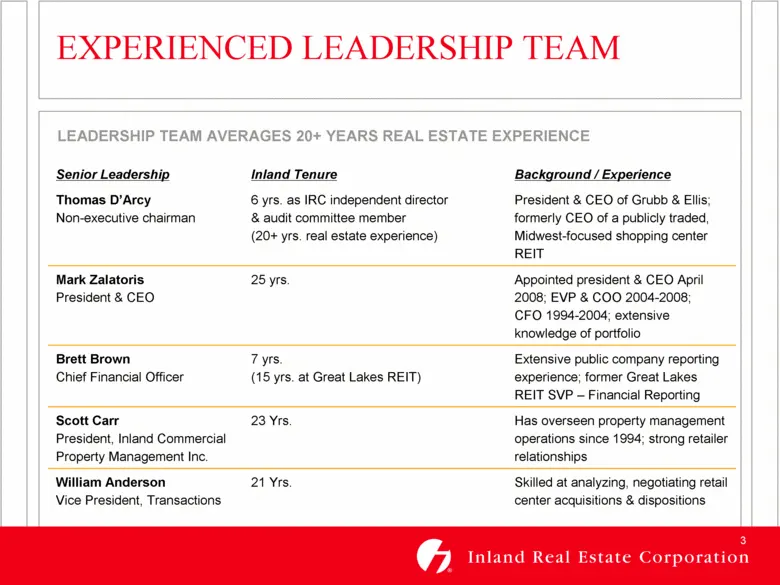
Slide 3: Experienced Leadership Team
3 EXPERIENCED LEADERSHIP TEAM Senior Leadership Inland Tenure Background / Experience Thomas D’Arcy Non-executive chairman 6 yrs. as IRC independent director & audit committee member (20+ yrs. real estate experience) President & CEO of Grubb & Ellis; formerly CEO of a publicly traded, Midwest-focuse
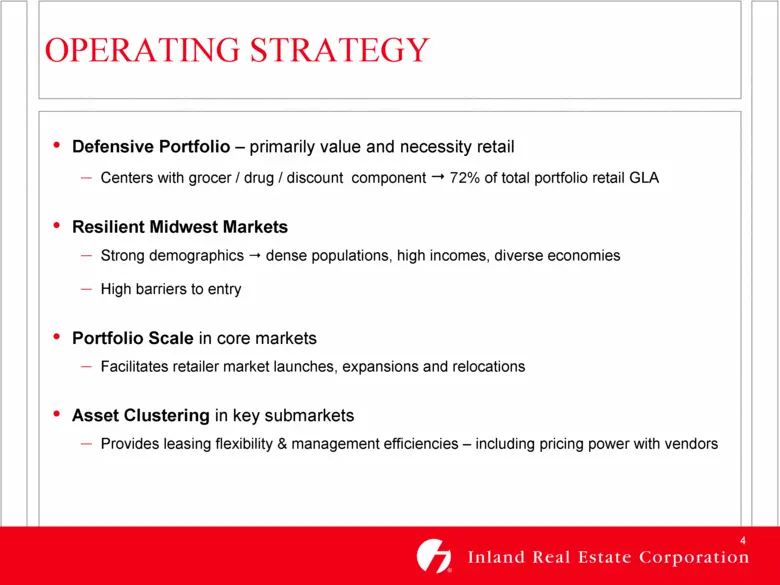
Slide 4: Operating Strategy
4 OPERATING STRATEGY • Defensive Portfolio – primarily value and necessity retail – Centers with grocer / drug / discount component 72% of total portfolio retail GLA • Resilient Midwest Markets – Strong demographics dense populations, high incomes, diverse economies – High barriers to entry • Portfo
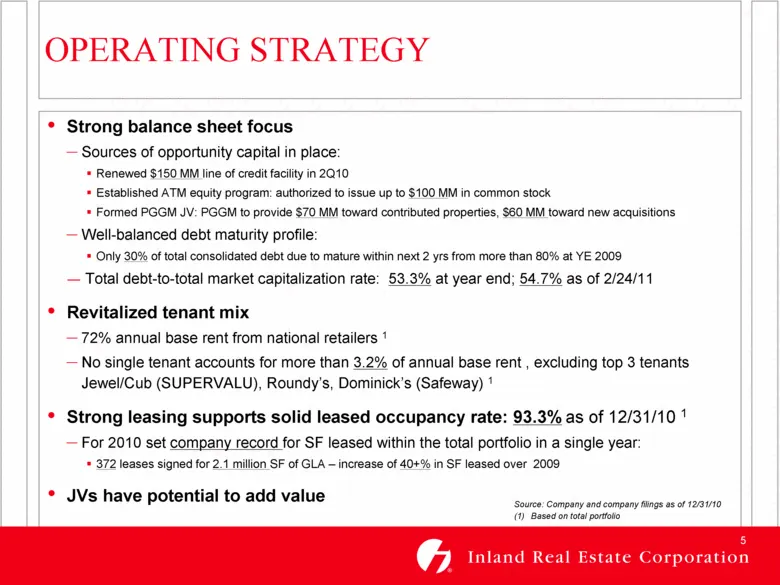
Slide 5: Operating Strategy
5 OPERATING STRATEGY • Strong balance sheet focus – Sources of opportunity capital in place: Renewed $150 MM line of credit facility in 2Q10 Established ATM equity program: authorized to issue up to $100 MM in common stock Formed PGGM JV: PGGM to provide $70 MM toward contributed properties, $60 MM
Slide 6: Core Markets: Chicago and Minneapolis
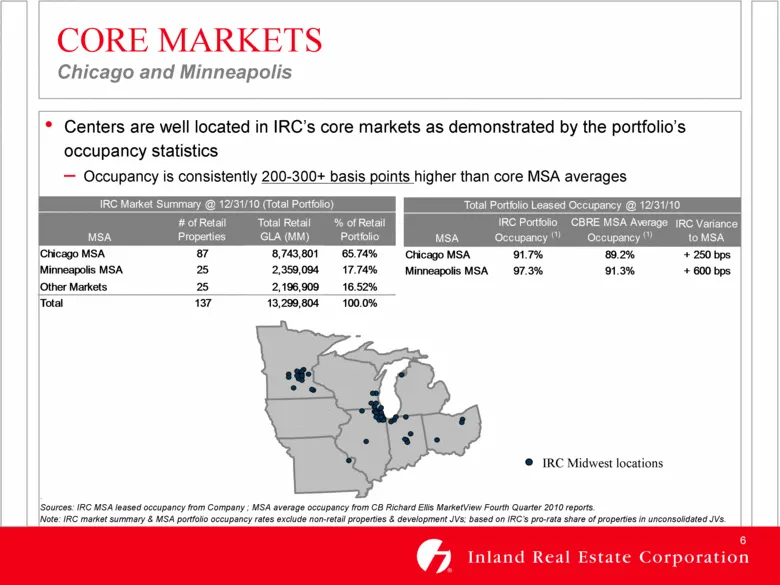
6 CORE MARKETS Chicago and Minneapolis Sources: IRC MSA leased occupancy from Company ; MSA average occupancy from CB Richard Ellis MarketView Fourth Quarter 2010 reports . Note: IRC market summary & MSA portfolio occupancy rates exclude non-retail properties & development JVs; based on IRC’s pro-ra
Slide 7: Chicago Market Snapshot
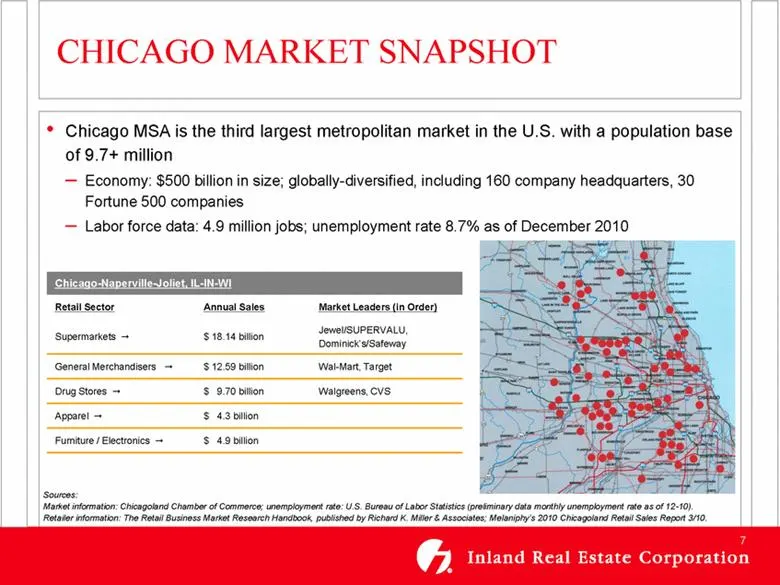
7 • Chicago MSA is the third largest metropolitan market in the U.S. with a population base of 9.7+ million – Economy: $500 billion in size; globally-diversified, including 160 company headquarters, 30 Fortune 500 companies – Labor force data: 4.9 million jobs; unemployment rate 8.7% as of December
Slide 8: Chicago Market Shopping Center REIT Ownership
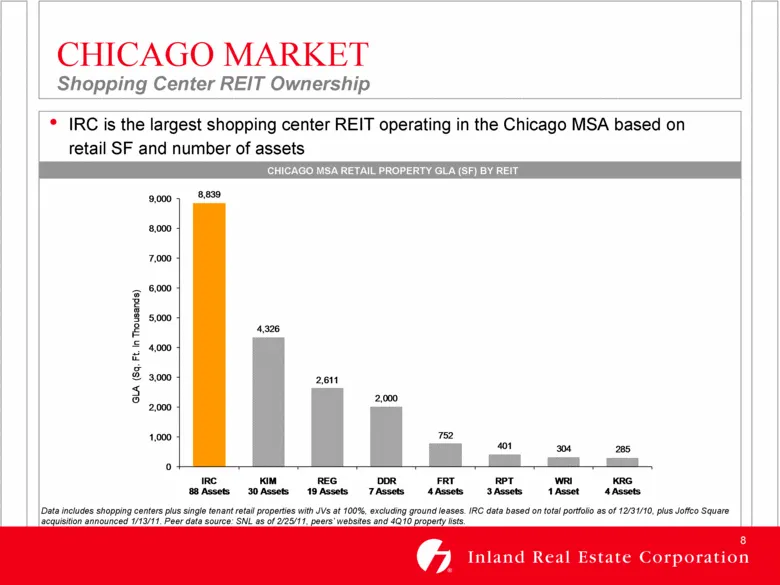
8 CHICAGO MARKET Shopping Center REIT Ownership Data includes shopping centers plus single tenant retail properties with JVs at 100%, excluding ground leases . IRC data based on total portfolio as of 12/31/10, plus Joffco Square acquisition announced 1/13/11. Peer data source: SNL as of 2/25/11, pee
Slide 9: Minneapolis Market Snapshot
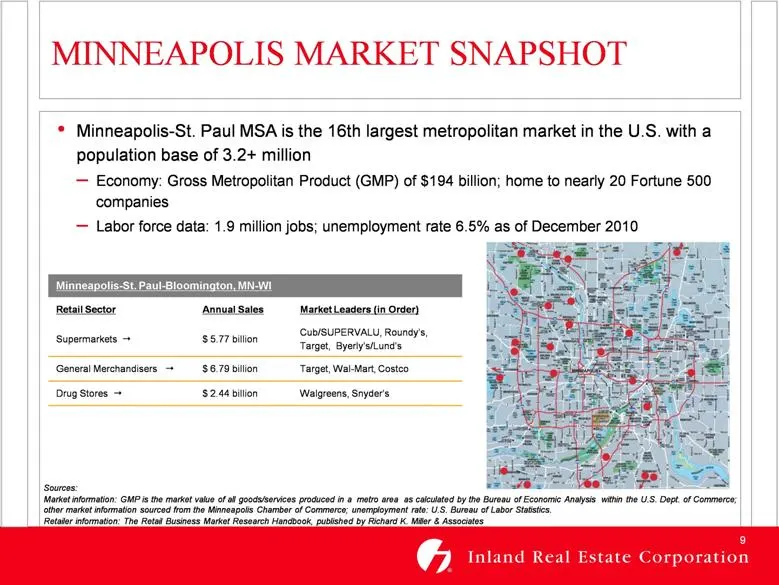
9 MINNEAPOLIS MARKET SNAPSHOT Sources: Market information: GMP is the market value of all goods/services produced in a metro area as calculated by the Bureau of Economic Analysis within the U.S. Dept. of Commerce; other market information sourced from the Minneapolis Chamber of Commerce; unemploymen
Slide 10: Minneapolis Market Shopping Center REIT Ownership
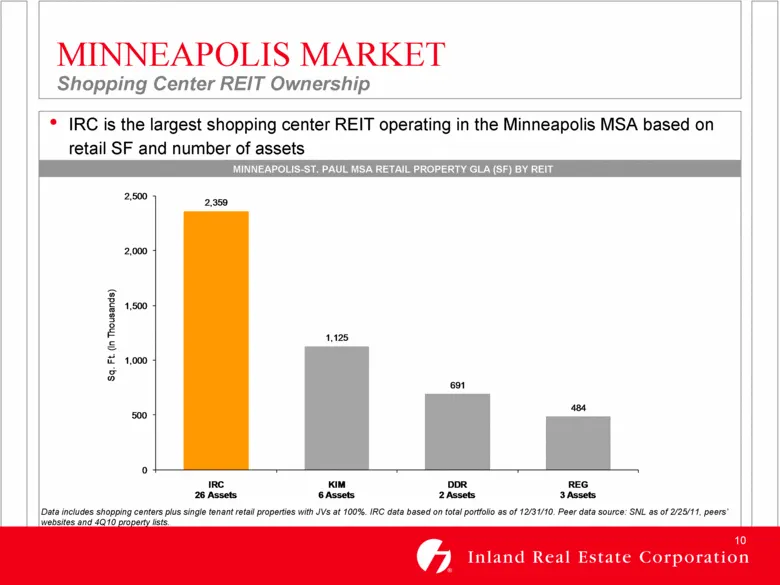
10 MINNEAPOLIS MARKET Shopping Center REIT Ownership • IRC is the largest shopping center REIT operating in the Minneapolis MSA based on retail SF and number of assets MINNEAPOLIS-ST. PAUL MSA RETAIL PROPERTY GLA (SF) BY REIT Data includes shopping centers plus single tenant retail properties with J
Slide 11: Strong Market Demographics
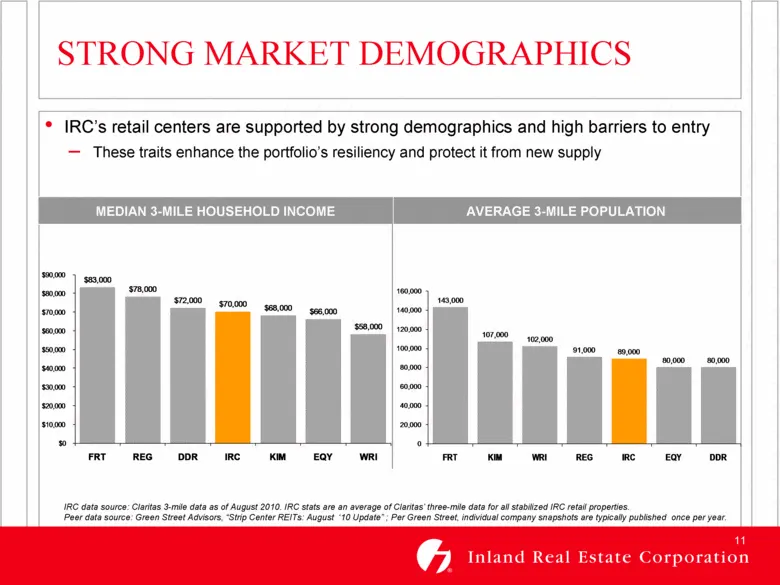
11 STRONG MARKET DEMOGRAPHICS IRC data source: Claritas 3-mile data as of August 2010. IRC stats ar e an average of Claritas’ three-mile data for all stabilized IRC retail properties . Peer data s ource: Green Street Advisors, “Strip Center REITs: August ‘10 Update” ; Per Green Street, individual co
Slide 12: Total Portfolio Composition
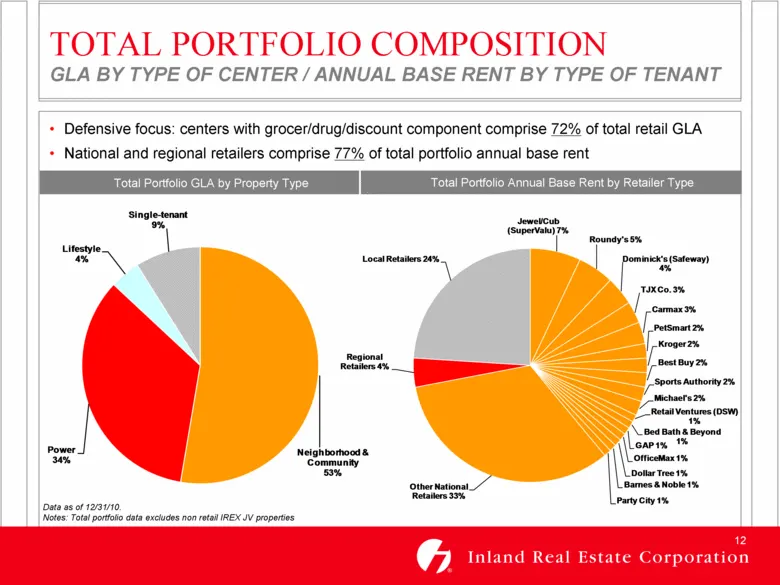
12 TOTAL PORTFOLIO COMPOSITION GLA BY TYPE OF CENTER / ANNUAL BASE RENT BY TYPE OF TENANT (1) Data as of 12/31/10. Notes: Total portfolio data excludes non retail IREX JV properties Total Portfolio GLA by Property Type Total Portfolio Annual Base Rent by Retailer Type Neighborhood & Community 53% Po
Slide 13: Diversified Tenant Base
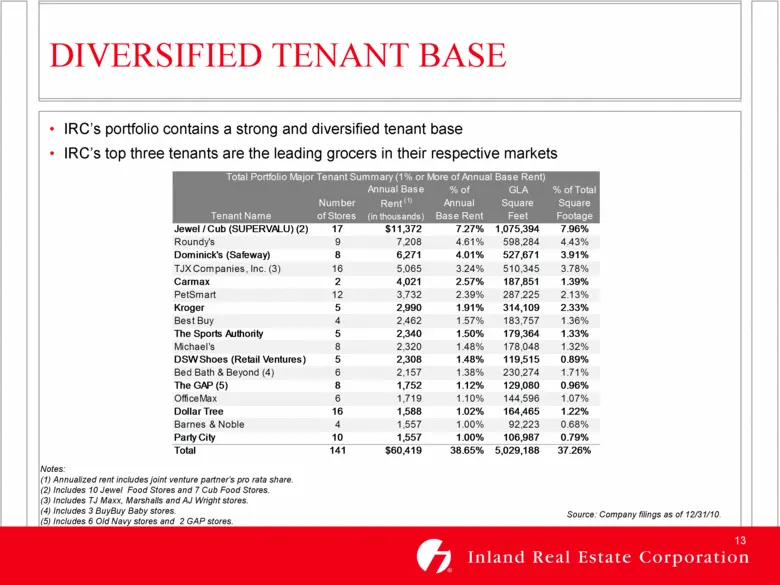
13 DIVERSIFIED TENANT BASE • IRC’s portfolio contains a strong and diversified tenant base • IRC’s top three tenants are the leading grocers in their respective markets Notes: (1) Annualized rent includes joint venture partner’s pro rata share. (2) Includes 10 Jewel Food Stores and 7 Cub Food Stores
Slide 14: Total Portfolio Rent Spreads: Releasing and Retenanting
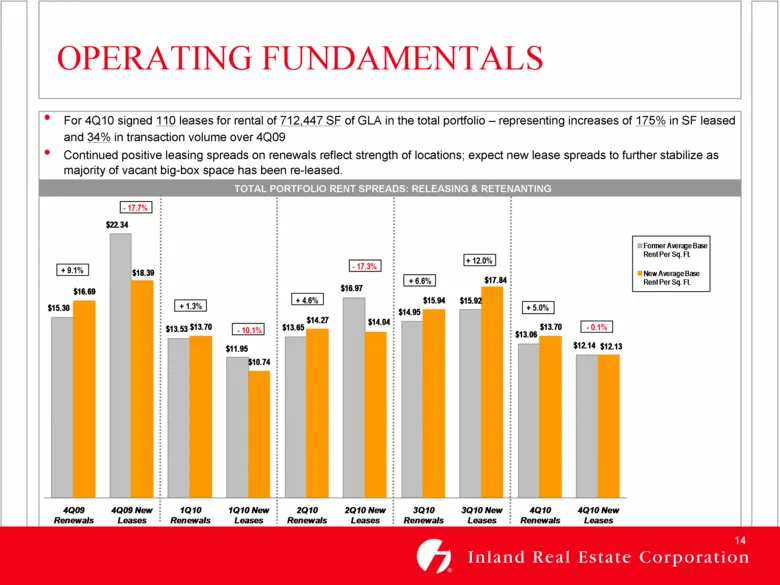
14 $15.30 $22.34 $13.53 $11.95 $13.65 $16.97 $14. 95 $15.92 $13.06 $12.14 $16.69 $18.39 $13.70 $10.74 $14.27 $14.04 $15.94 $17.84 $13.70 $12.13 4Q09 Renewals 4Q09 New Leases 1Q10 Renewals 1Q10 New Leases 2Q10 Renewals 2Q10 New Leases 3Q10 Renewals 3Q10 New Leases 4Q10 Renewals 4Q10 New Leases Former
Slide 15: Well Staggered Lease Expirations
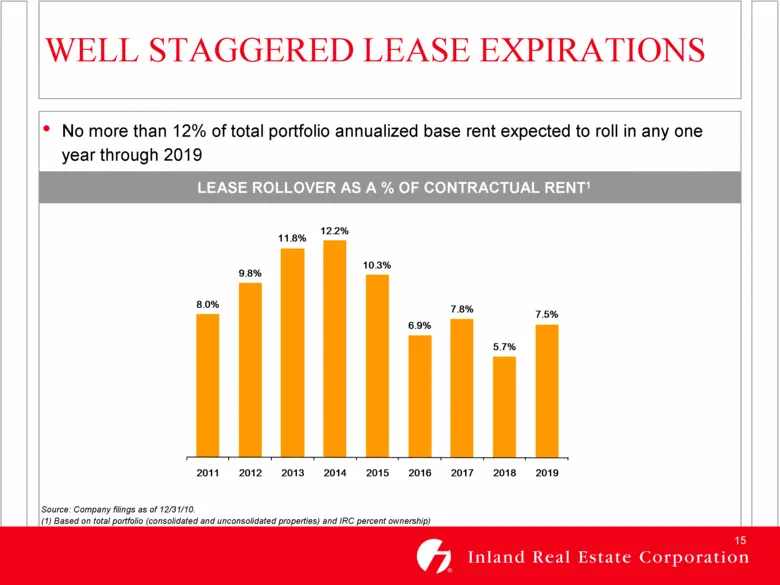
15 WELL STAGGERED LEASE EXPIRATIONS • No more than 12% of total portfolio annualized base rent expected to roll in any one year through 2019 Source: Company filings as of 12/31/10. (1) Based on total portfolio (consolidated and unconsolidated properties) and IRC percent ownership) LEASE ROLLOVER AS
Slide 16: Leasing Efficiencies
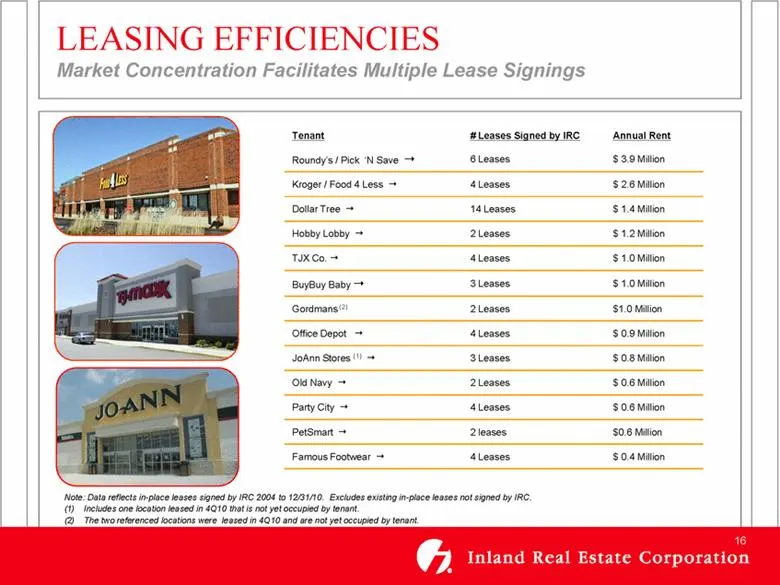
16 Tenant # Leases Signed by IRC Annual Rent Roundy’s / Pick ‘N Save 6 Leases $ 3.9 Million Kroger / Food 4 Less 4 Leases $ 2.6 Million Dollar Tree 14 Leases $ 1.4 Million Hobby Lobby 2 Leases $ 1.2 Million TJX Co. 4 Leases $ 1.0 Million BuyBuy Baby 3 Leases $ 1.0 Million Gordmans (2) 2 Leases $1.0
Slide 17: Growth from Existing Portfolio: Completed Initiatives
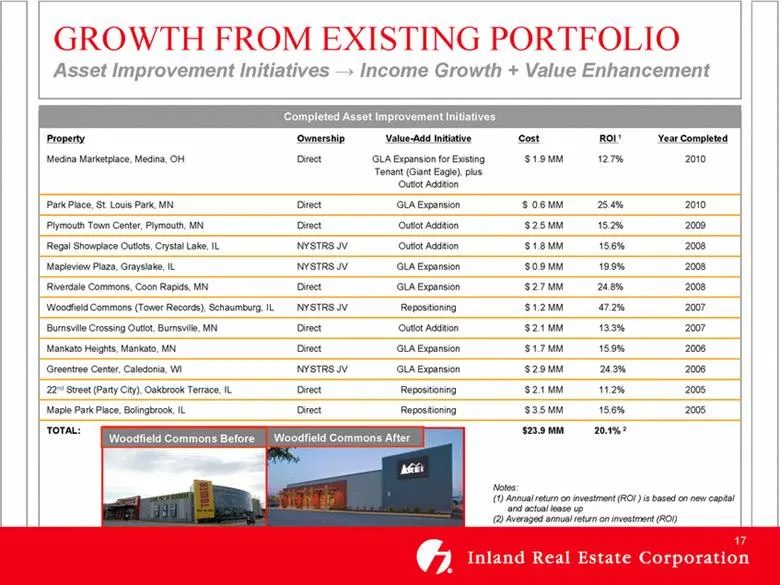
17 GROWTH FROM EXISTING PORTFOLIO Asset Improvement Initiatives Income Growth + Value Enhancement Completed Asset Improvement Initiatives Property Ownership Value-Add Initiative Cost ROI 1 Year Completed Medina Marketplace, Medina, OH Direct GLA Expansion for Existing Tenant (Giant Eagle), plus Outl
Slide 18: Growth from Existing Portfolio: In-Process Initiatives
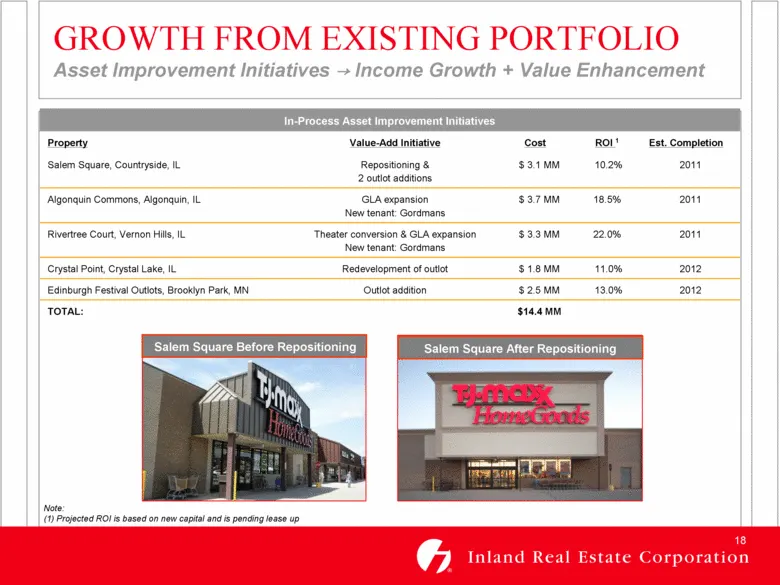
18 GROWTH FROM EXISTING PORTFOLIO Asset Improvement Initiatives Income Growth + Value Enhancement In-Process Asset Improvement Initiatives Property Value-Add Initiative Cost ROI 1 Est. Completion Salem Square, Countryside, IL Repositioning & 2 outlot additions $ 3.1 MM 10.2% 2011 Algonquin Commons,
Slide 19: Development Projects
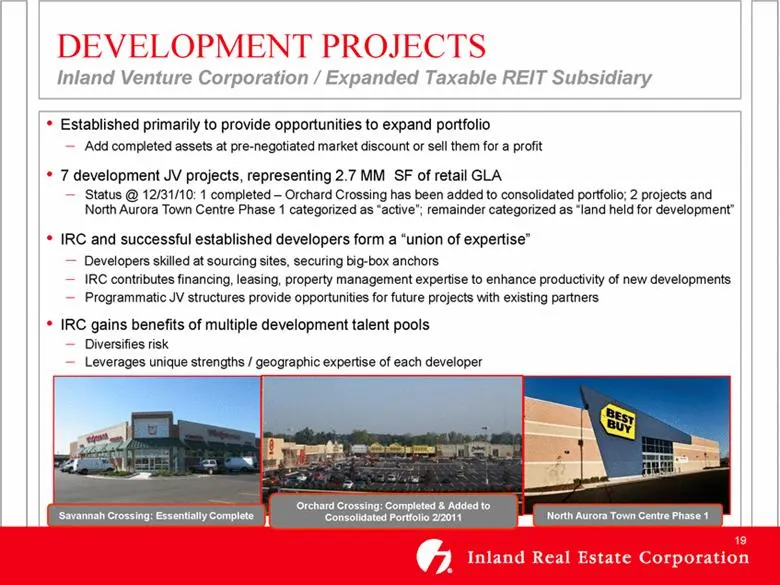
19 North Aurora Town Centre Phase 1 Savannah Crossing: Essentially Complete DEVELOPMENT PROJECTS Inland Venture Corporation / Expanded Taxable REIT Subsidiary • Established primarily to provide opportunities to expand portfolio – Add completed assets at pre-negotiated market discount or sell them fo
Slide 20: Acquisition History
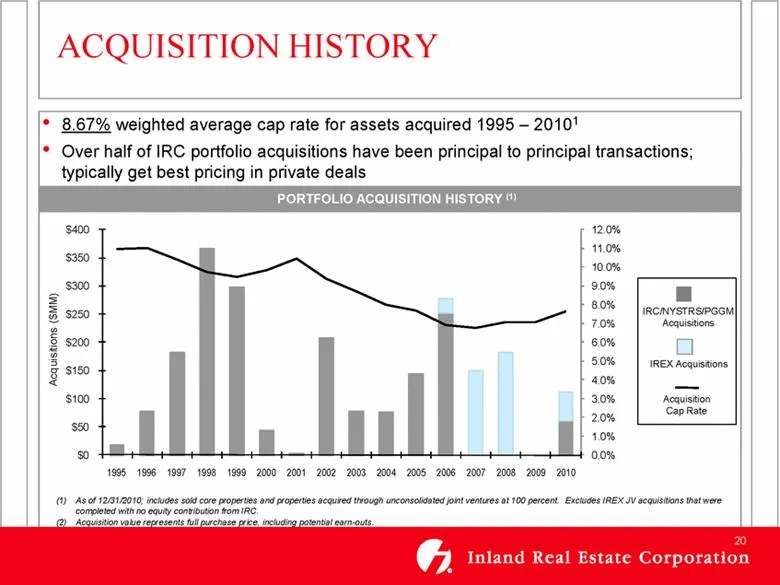
20 0.0% 1.0% 2.0% 3.0% 4.0% 5.0% 6.0% 7.0% 8.0% 9.0% 10.0% 11.0% 12.0% $0 $50 $100 $150 $200 $250 $300 $350 $400 1995 1996 1997 1998 1999 2000 2001 2002 2003 2004 2005 2006 2007 2008 2009 2010 A c q u i s i ti o n s ($MM ) (1) As of 12/31/2010; includes sold core properties and properties acquired t
Slide 21: Maintaining a Strong Balance Sheet
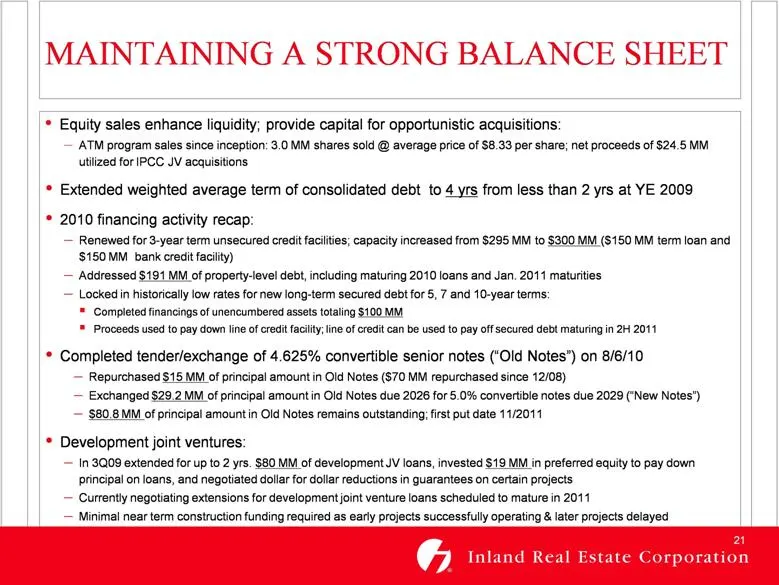
21 MAINTAINING A STRONG BALANCE SHEET • Equity sales enhance liquidity; provide capital for opportunistic acquisitions: – ATM program sales since inception: 3.0 MM shares sold @ average price of $8.33 per share; net proceeds of $24.5 MM utilized for IPCC JV acquisitions • Extended weighted average t
Slide 22: Consolidated Debt Maturities
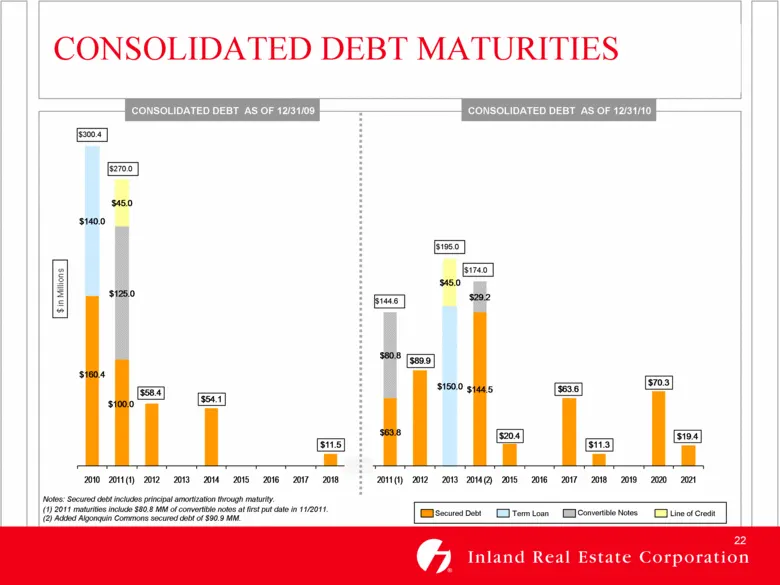
22 $160.4 $100.0 $58.4 $54.1 $11.5 $63.8 $89.9 $144.5 $20.4 $63.6 $11.3 $70.3 $19.4 $140.0 $150.0 $125.0 $80.8 $29.2 $45.0 $45.0 2010 2011 (1) 2012 2013 2014 2015 2016 2017 2018 2011 (1) 2012 2013 2014 (2) 2015 2016 2017 2018 2019 2020 2021 CONSOLIDATED DEBT AS OF 12/31/10 CONSOLIDATED DEBT AS OF 12
Slide 23: Joint Venture Strategies
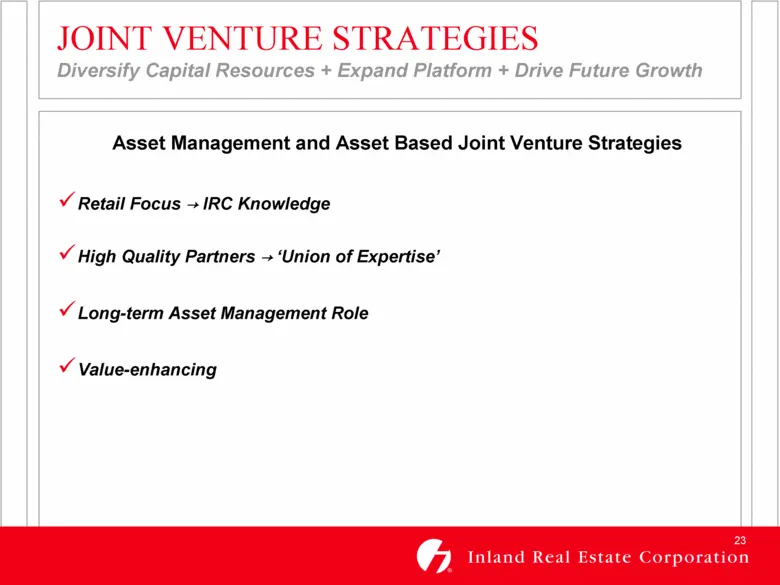
23 JOINT VENTURE STRATEGIES Diversify Capital Resources + Expand Platform + Drive Future Growth Asset Management and Asset Based Joint Venture Strategies Retail Focus IRC Knowledge High Quality Partners ‘Union of Expertise’ Long-term Asset Management Role Value-enhancing
Slide 24: Asset Management Joint Venture: IPCC
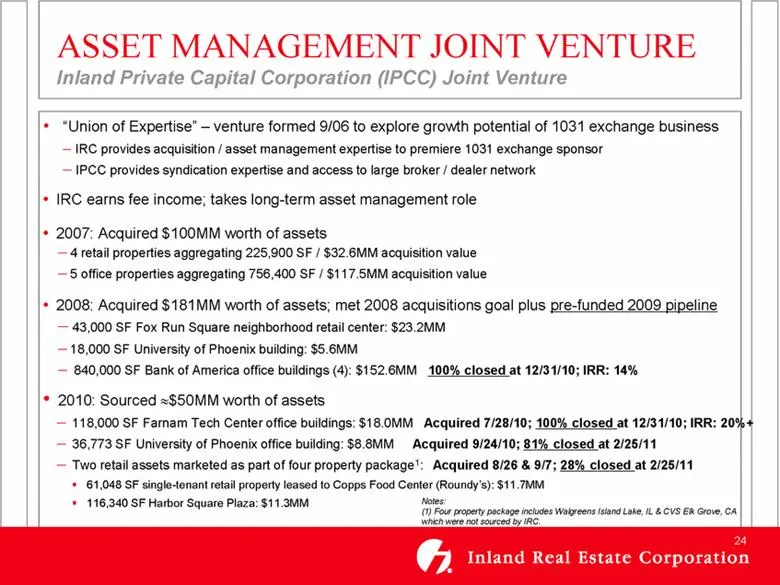
24 ASSET MANAGEMENT JOINT VENTURE Inland Private Capital Corporation (IPCC) Joint Venture • “Union of Expertise” – venture formed 9/06 to explore growth potential of 1031 exchange business – IRC provides acquisition / asset management expertise to premiere 1031 exchange sponsor – IPCC provides syndi
Slide 25: Asset-Based Joint Venture: NYSTRS
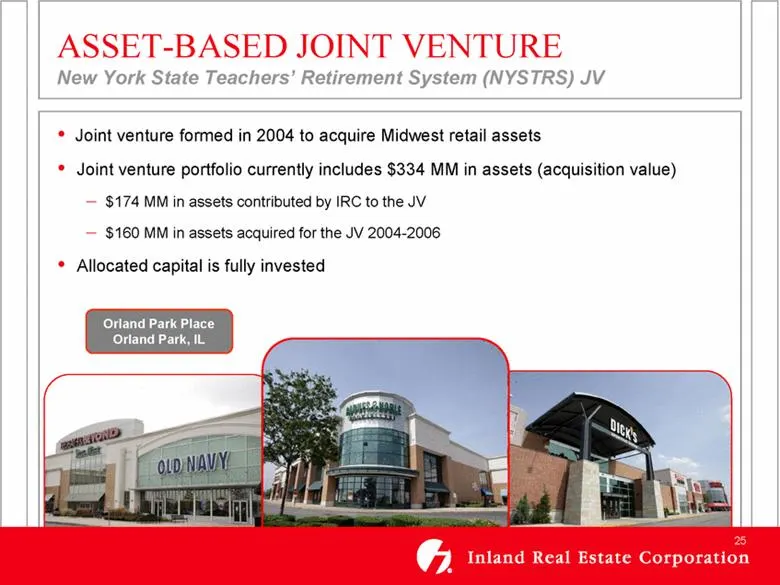
25 ASSET-BASED JOINT VENTURE New York State Teachers’ Retirement System (NYSTRS) JV • Joint venture formed in 2004 to acquire Midwest retail assets • Joint venture portfolio currently includes $334 MM in assets (acquisition value) – $174 MM in assets contributed by IRC to the JV – $160 MM in assets
Slide 26: Strategic Joint Venture with PGGM
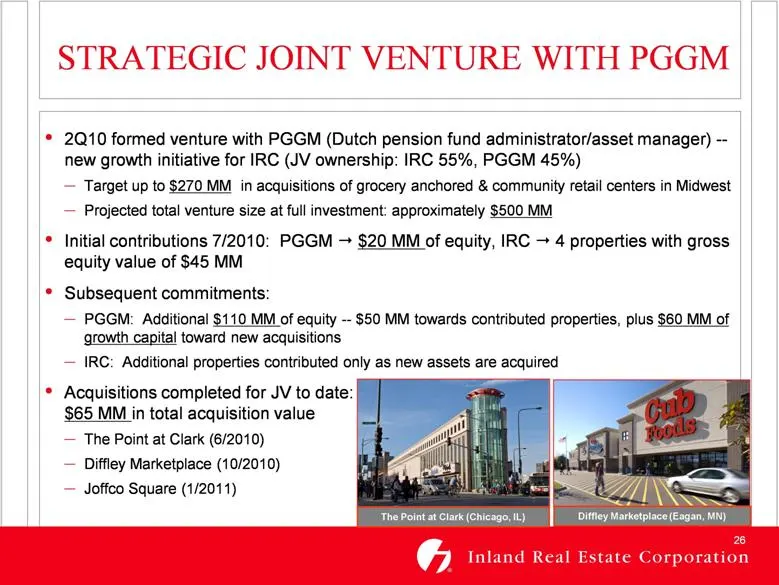
26 STRATEGIC JOINT VENTURE WITH PGGM • 2Q10 formed venture with PGGM (Dutch pension fund administrator/asset manager) -- new growth initiative for IRC (JV ownership: IRC 55%, PGGM 45%) – Target up to $270 MM in acquisitions of grocery anchored & community retail centers in Midwest – Projected total
Slide 27: Strategic Joint Venture with PGGM: Structure
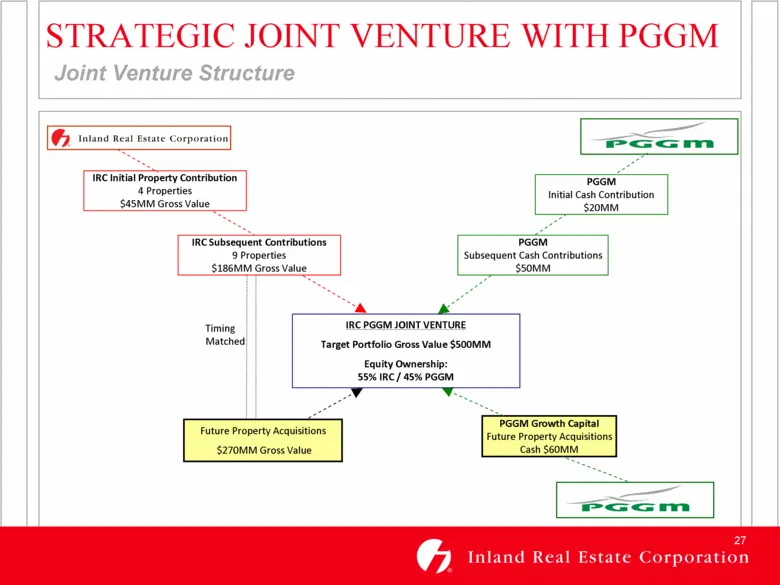
27 STRATEGIC JOINT VENTURE WITH PGGM Joint Venture Structure IRC Subsequent Contributions 9 Properties $186MM Gross Value PGGM Subsequent Cash Contributions $50MM PGGM Growth Capital Future Property Acquisitions Cash $60MM Future Property Acquisitions $270MM Gross Value IRC PGGM JOINT VENTURE Target
Slide 28: Strategic Joint Venture with PGGM: Benefits
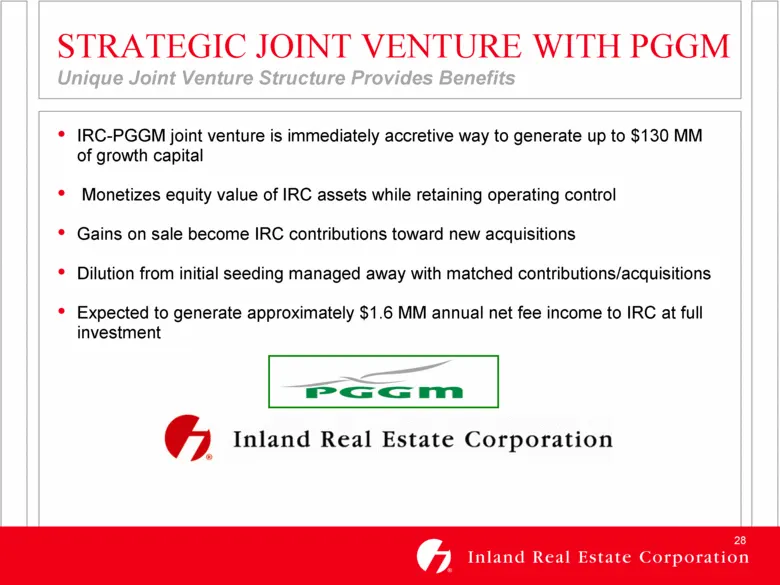
28 STRATEGIC JOINT VENTURE WITH PGGM Unique Joint Venture Structure Provides Benefits • IRC-PGGM joint venture is immediately accretive way to generate up to $130 MM of growth capital • Monetizes equity value of IRC assets while retaining operating control • Gains on sale become IRC contributions to
Slide 29: Joint Venture Fee Income
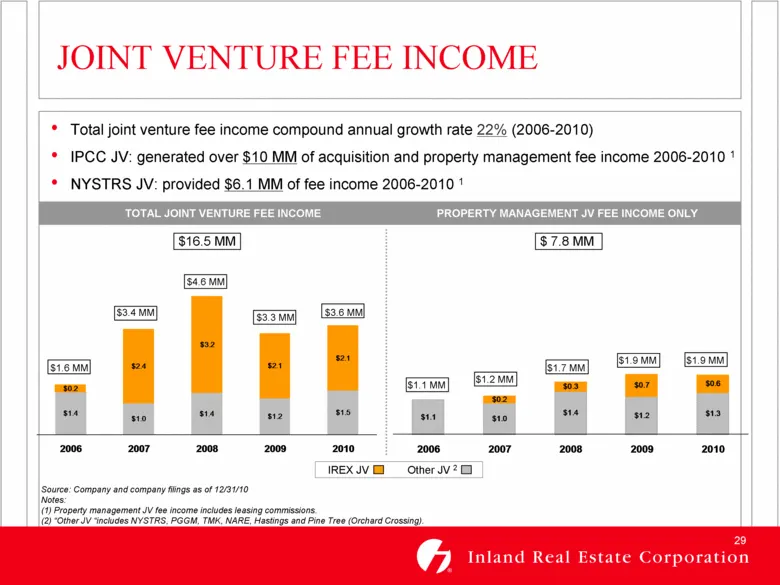
29 $1.1 $1.0 $1.4 $1.2 $1.3 $0.2 $0.3 $0.7 $0.6 2006 2007 2008 2009 2010 $1.4 $1.0 $1.4 $1.2 $1.5 $0.2 $2.4 $3.2 $2.1 $2.1 2006 2007 2008 2009 2010 $1.6 MM $4.6 MM $3.6 MM $3.4 MM $3.3 MM JOINT VENTURE FEE INCOME • Total joint venture fee income compound annual growth rate 22% (2006-2010) • IPCC JV:
Slide 30: Solid Foundation for Future Growth
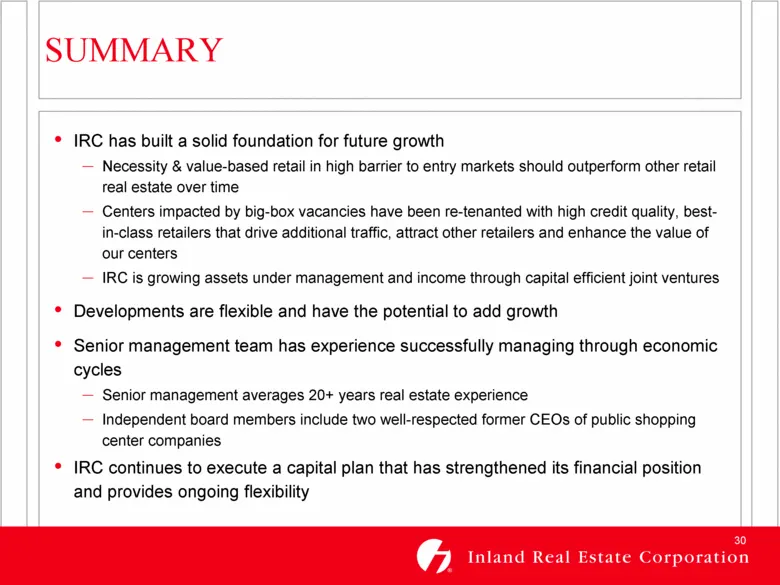
30 • IRC has built a solid foundation for future growth – Necessity & value-based retail in high barrier to entry markets should outperform other retail real estate over time – Centers impacted by big-box vacancies have been re-tenanted with high credit quality, bestin- class retailers that drive ad
Slide 31: Forward-Looking Statements
31 FORWARD-LOOKING STATEMENTS Certain statements in this presentation constitute "forward-looking statements" within the meaning of the Federal Private Securities Litigation Reform Act of 1995. These forward-looking statements are not historical facts but are the intent, belief or current expectatio
Source: SEC EDGAR · 8-K filed Mar 14, 2011
More decks from Inland Real Estate Corp
 Investor Presentation (November 2015)30 slides · Nov 17, 2015
 Investor Presentation (September 2015)29 slides · Sep 16, 2015
 Investor Presentation (June 2015)29 slides · Jun 9, 2015
 Investor Presentation (May 2015)26 slides · May 15, 2015
 Investor Presentation (February 2015)26 slides · Feb 24, 2015
 Investor Presentation (November 2014)26 slides · Nov 5, 2014