Nnit A/S · OMXCOP:NNIT
Nnit A/S — Fact Sheet (February 2024)
4 slides from Nnit A/S's fact sheet, Feb 19, 2024
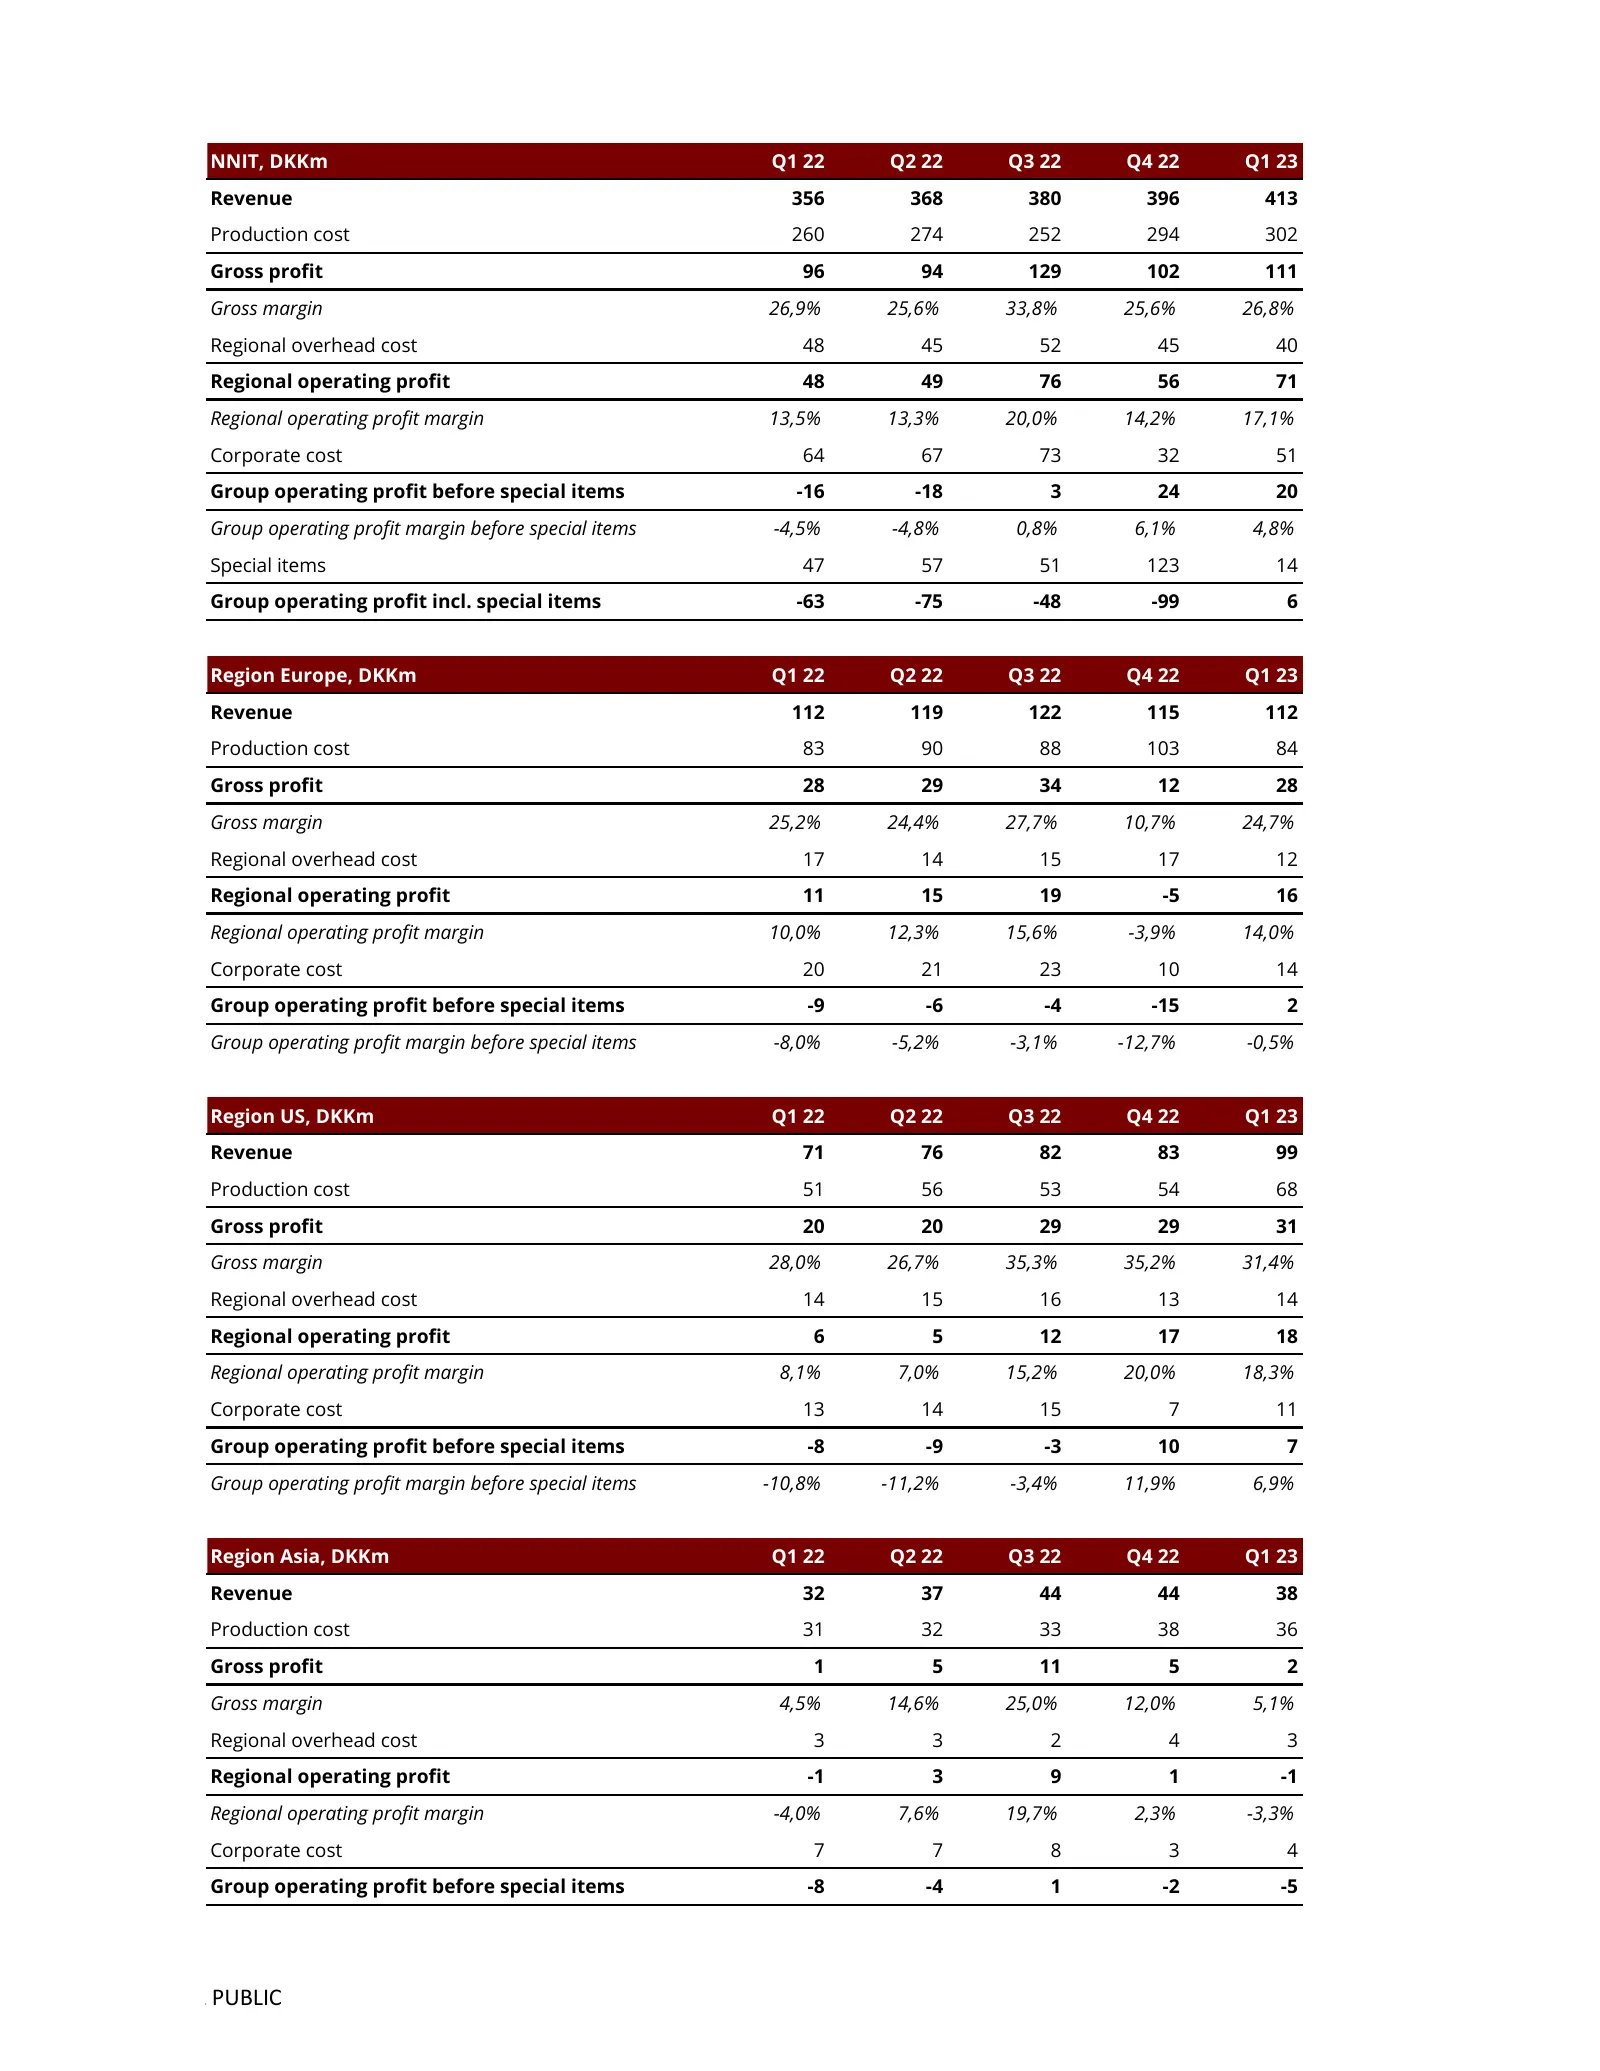
Slide 1: NNIT group and regional quarterly financials, Q1 22 to Q1 23
NNIT, DKKm Q1 22 Q2 22 Q3 22 Q4 22 Q1 23 Revenue 356 368 380 396 413 Production cost 260 274 252 294 302 Gross profit 96 94 129 102 111 Gross margin 26,9% 25,6% 33,8% 25,6% 26,8% Regional overhead cost 48 45 52 45 40 Regional operating profit 48 49 76 56 71 Regional operating profit margin 13,5% 13,
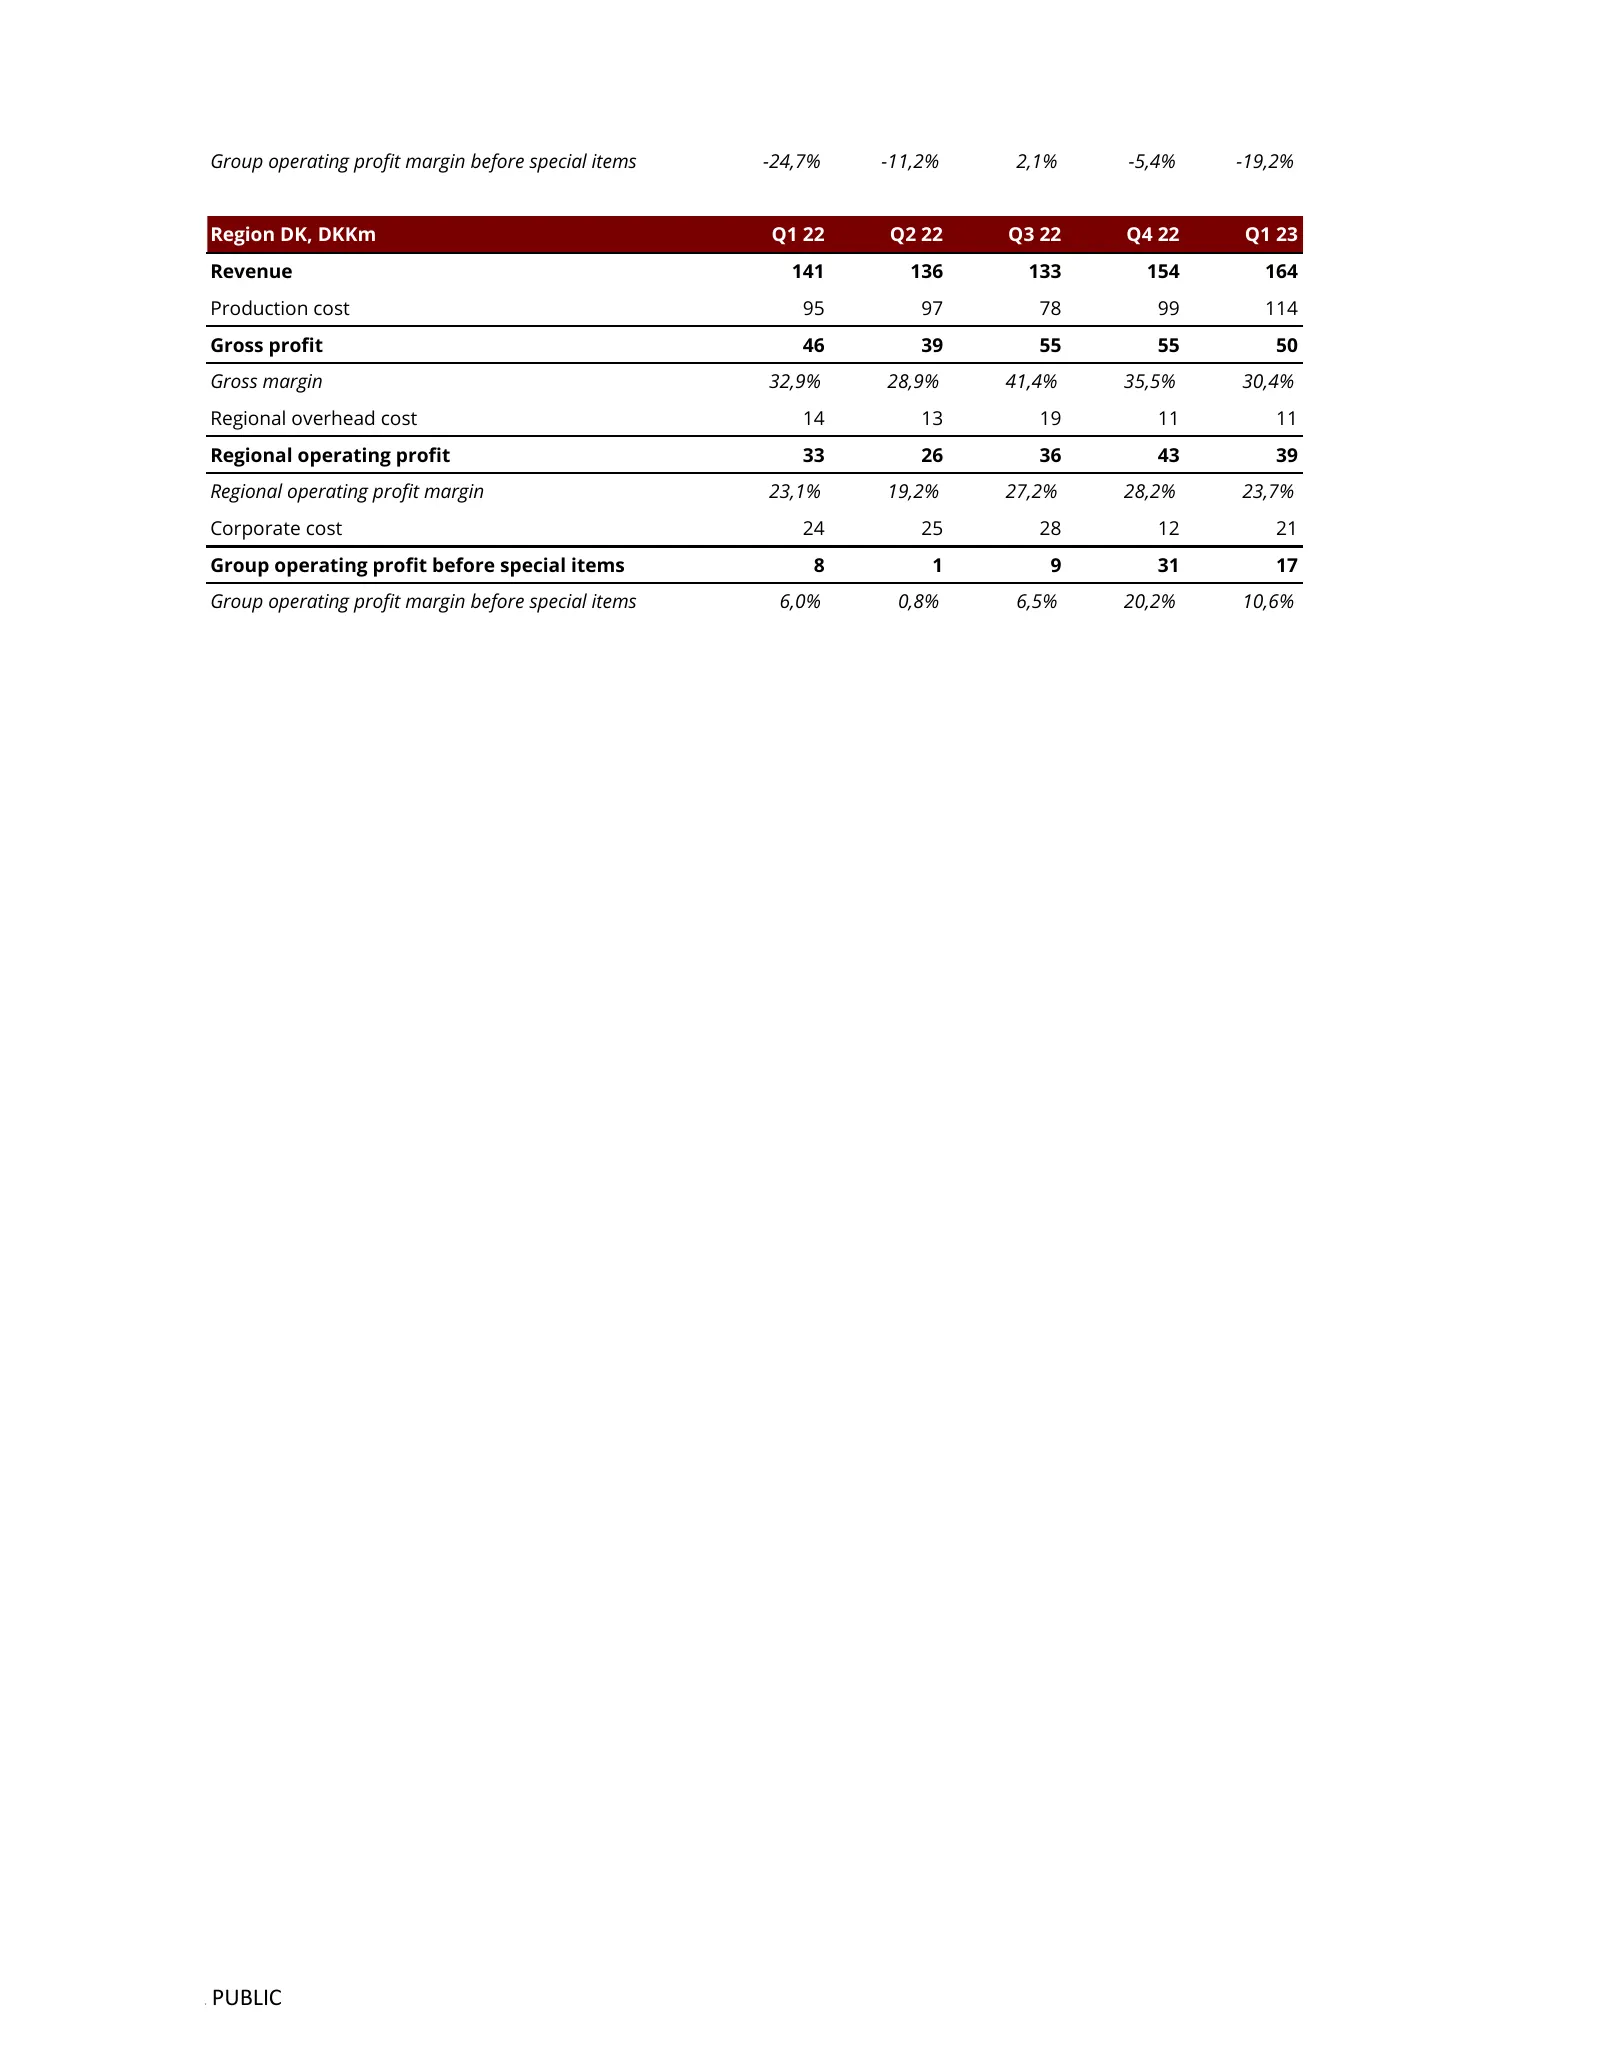
Slide 2: Region DK quarterly financials
Group operating profit margin before special items -24,7% -11,2% 2,1% -5,4% -19,2% Region DK, DKKm Q1 22 Q2 22 Q3 22 Q4 22 Q1 23 Revenue 141 136 133 154 164 Production cost 95 97 78 99 114 Gross profit 46 39 55 55 50 Gross margin 32,9% 28,9% 41,4% 35,5% 30,4% Regional overhead cost 14 13 19 11 11 Re
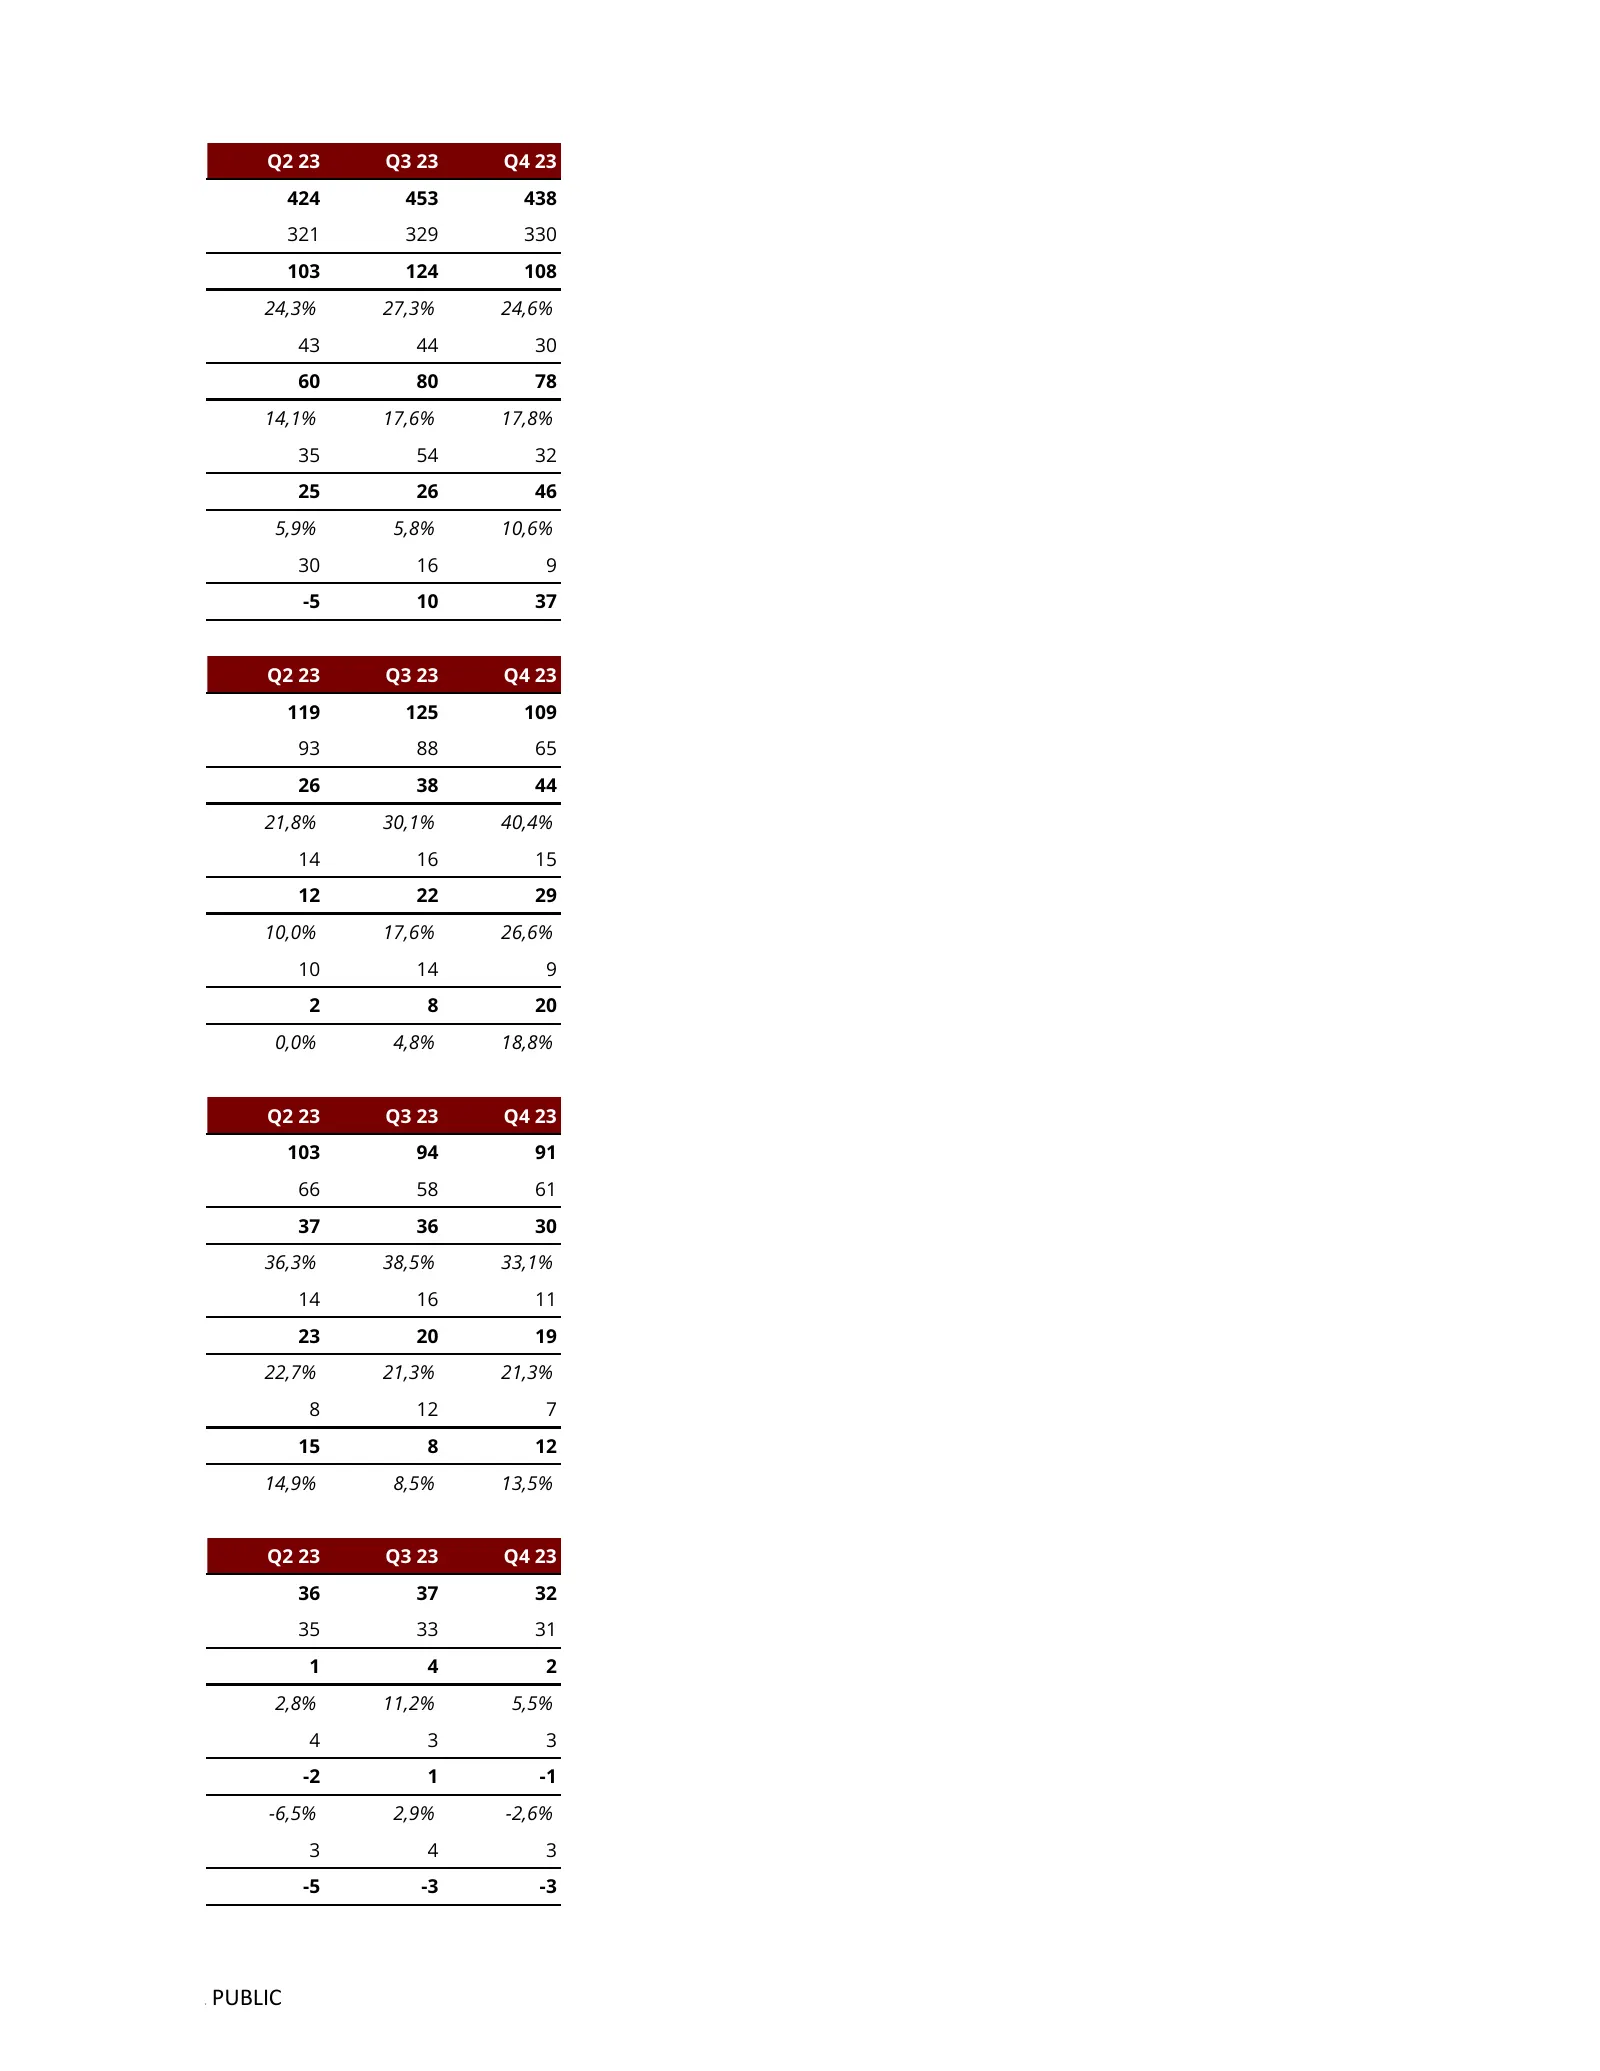
Slide 3: Quarterly financials, Q2 23 to Q4 23
Q2 23 Q3 23 Q4 23 424 453 438 321 329 330 103 124 108 24,3% 27,3% 24,6% 43 44 30 60 80 78 14,1% 17,6% 17,8% 35 54 32 25 26 46 5,9% 5,8% 10,6% 30 16 9 -5 10 37 Q2 23 Q3 23 Q4 23 119 125 109 93 88 65 26 38 44 21,8% 30,1% 40,4% 14 16 15 12 22 29 10,0% 17,6% 26,6% 10 14 9 2 8 20 0,0% 4,8% 18,8% Q2 23 Q3
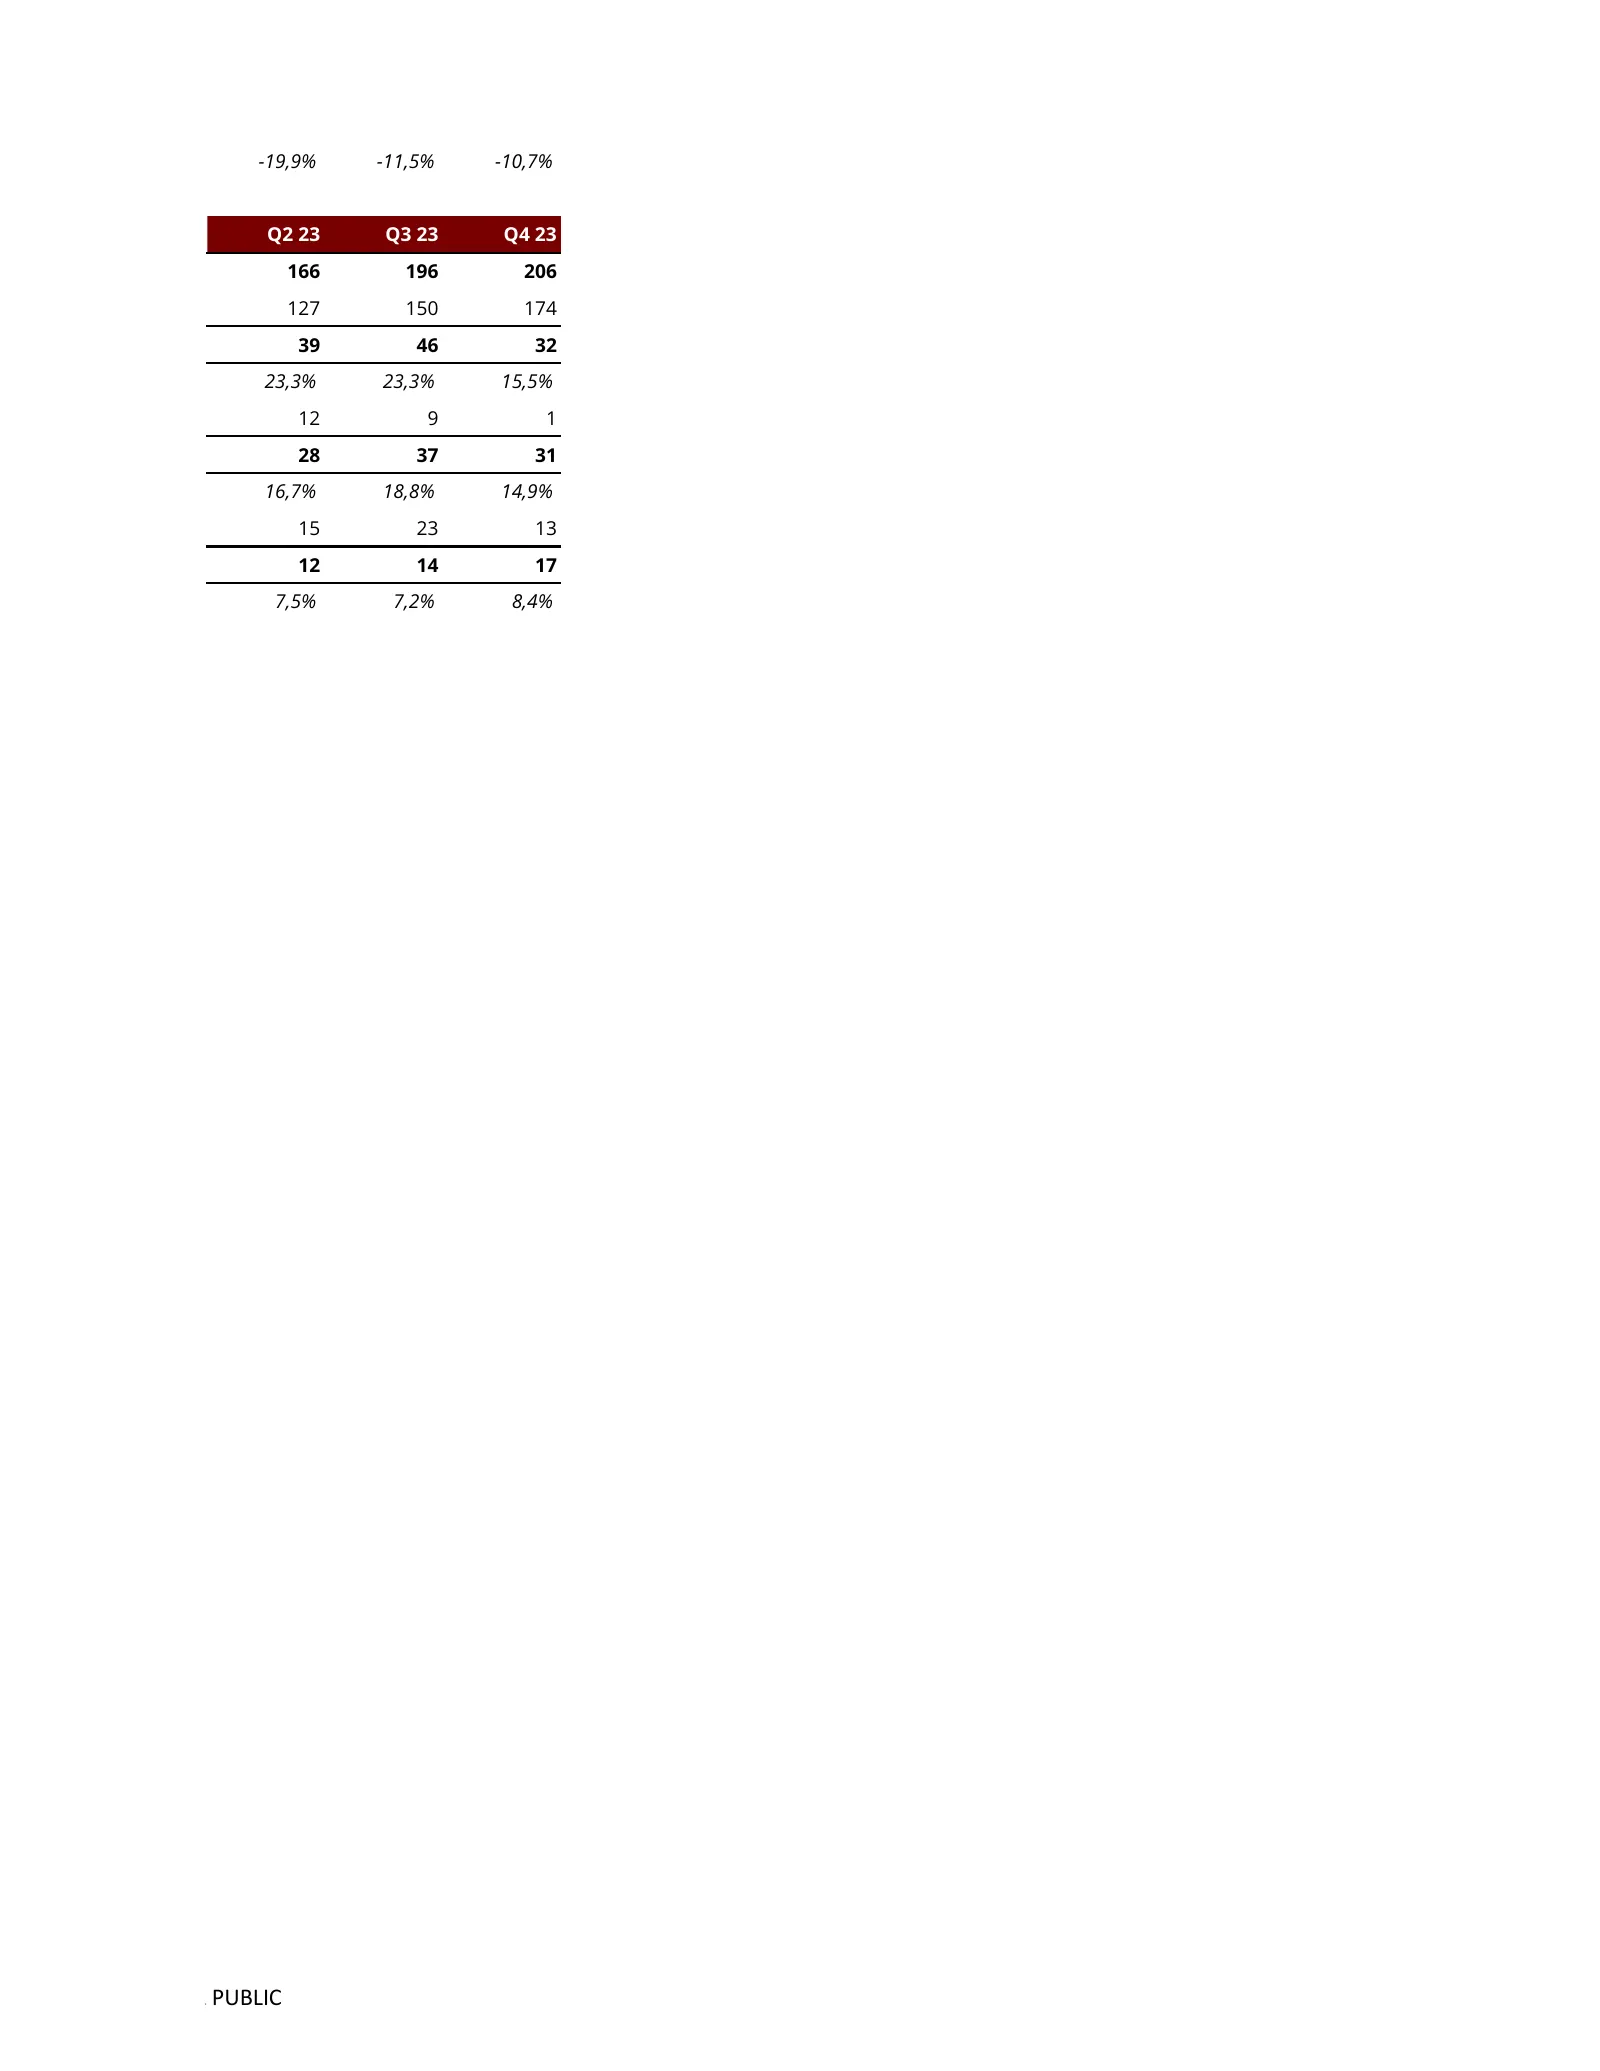
Slide 4: Quarterly financials, Q2 23 to Q4 23 (continued)
-19,9% -11,5% -10,7% Q2 23 Q3 23 Q4 23 166 196 206 127 150 174 39 46 32 23,3% 23,3% 15,5% 12 9 1 28 37 31 16,7% 18,8% 14,9% 15 23 13 12 14 17 7,5% 7,2% 8,4% # PUBLIC
Source: Internet Archive copy of nnit.com
More decks from Nnit A/S
 Q3 2026 Earnings Presentation26 slides · November 2026
 Q2 2026 Earnings Presentation22 slides · August 2026
 Q1 2026 Earnings Presentation24 slides · May 2026
 FY2025 Earnings Presentation30 slides · February 2026
 Q3 2025 Earnings Presentation26 slides · November 2025
 Q2 2025 Earnings Presentation26 slides · September 2025