Franklin Financial Network Inc
Franklin Financial Network — Q4 2015 Earnings Presentation
43 slides from Franklin Financial Network's earnings presentation, Jan 27, 2016
Slide 1: Fourth Quarter 2015 Investor Call
Franklin Financial Network, Inc. (NYSE:FSB) Fourth Quarter 2015 Investor Call January 27, 2016 Exhibit 99.1
Slide 2: Forward-Looking Statements
Forward-Looking Statements Except for the historical information contained herein, this presentation contains forward-looking statements within the meaning of Section 27A of the Securities Act of 1933, as amended, and Section 21E of the Securities Exchange Act of 1934, as amended. The forward-lookin
Slide 3: Franklin Financial Network overview and recent news
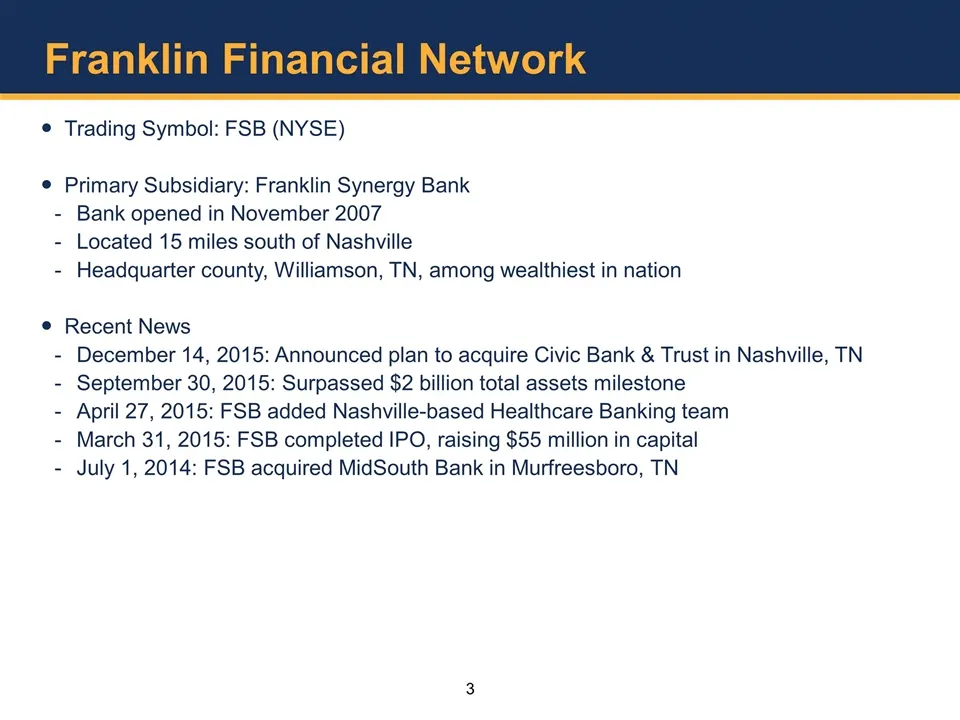
Franklin Financial Network Trading Symbol: FSB (NYSE) Primary Subsidiary: Franklin Synergy Bank Bank opened in November 2007 Located 15 miles south of Nashville Headquarter county, Williamson, TN, among wealthiest in nation Recent News December 14, 2015: Announced plan to acquire Civic Bank & Trust
Slide 4: 2015 Financial Highlights
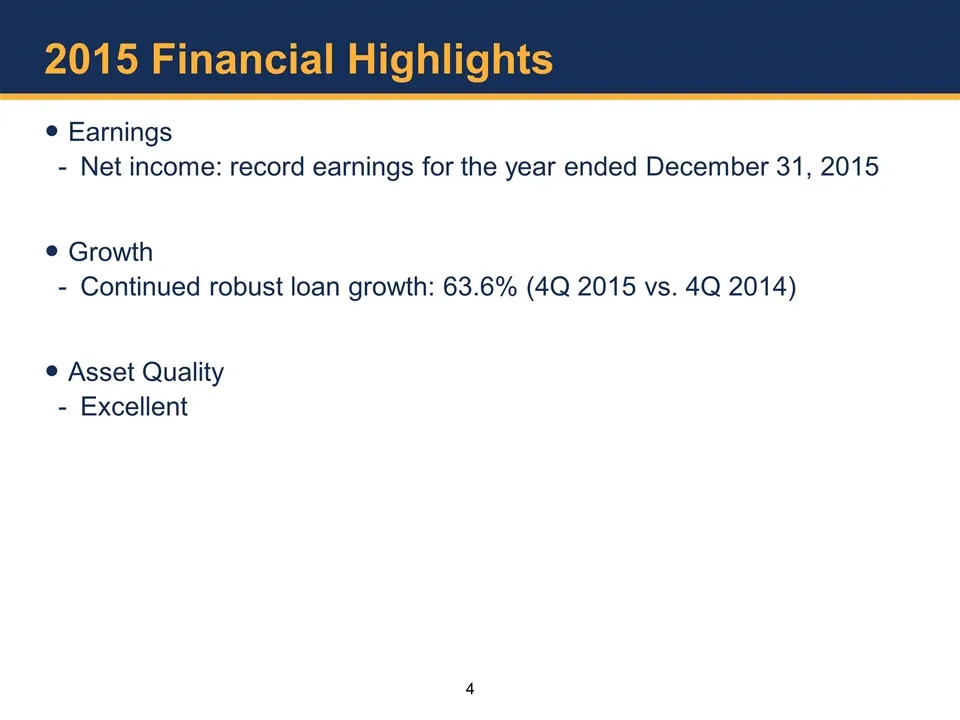
2015 Financial Highlights Earnings Net income: record earnings for the year ended December 31, 2015 Growth Continued robust loan growth: 63.6% (4Q 2015 vs. 4Q 2014) Asset Quality Excellent
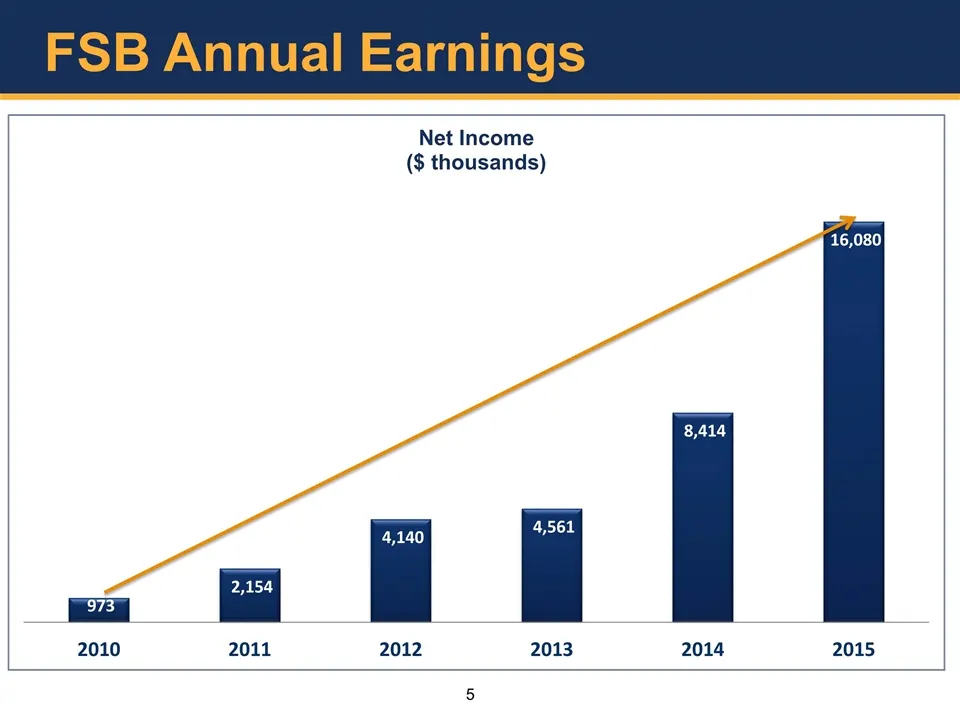
Slide 5: Net Income
Net Income ($ thousands) 2010 2011 2012 2013 2014 2015
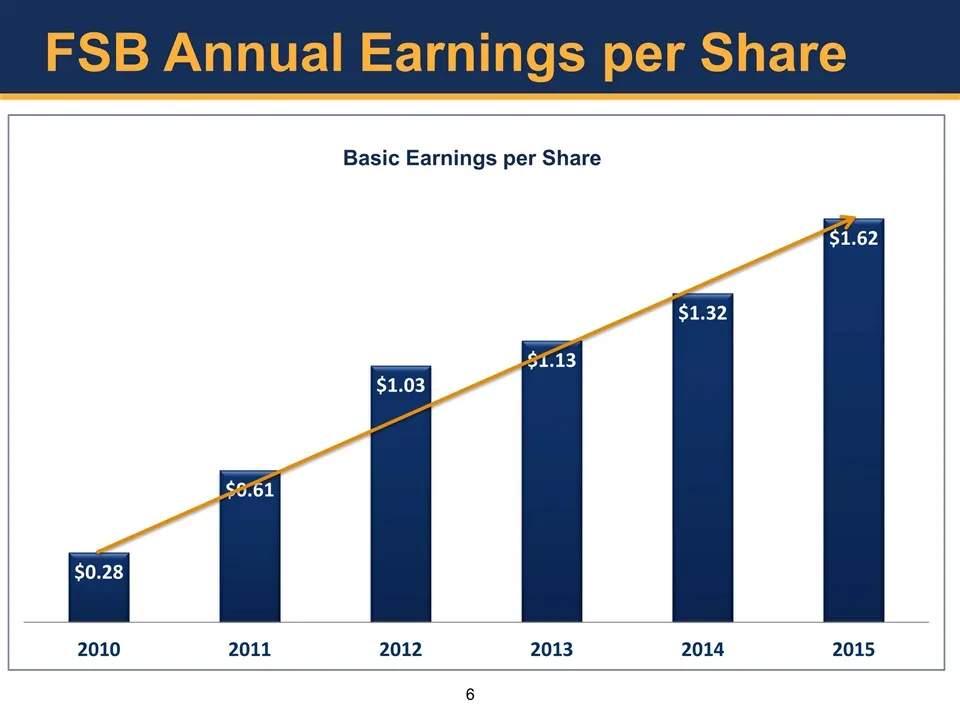
Slide 6: FSB Annual Earnings per Share
FSB Annual Earnings per Share
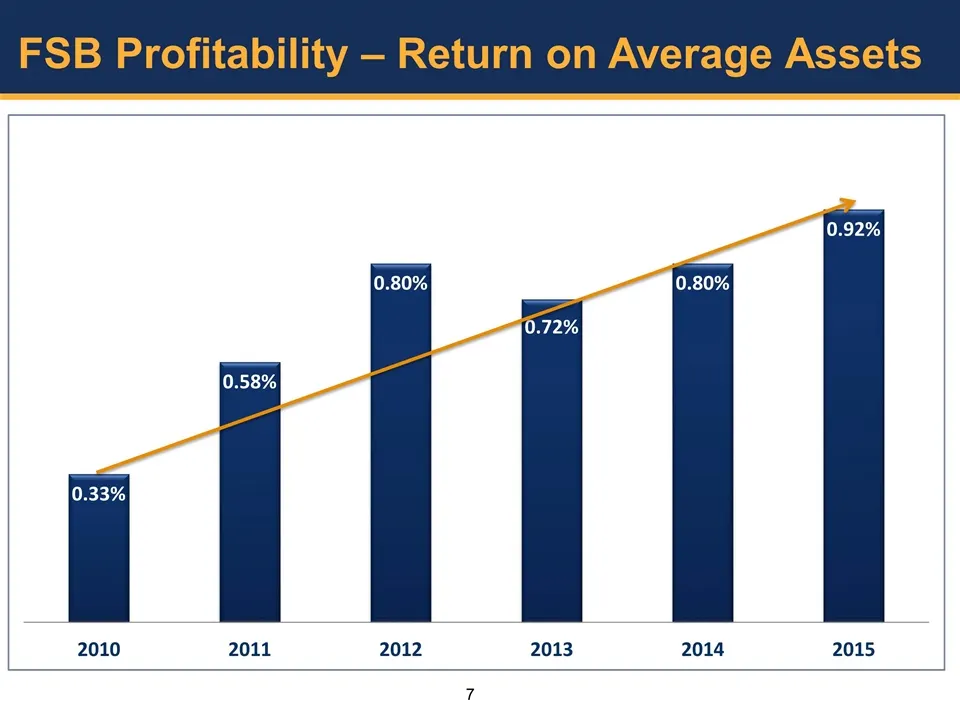
Slide 7: FSB Profitability – Return on Average Assets
FSB Profitability – Return on Average Assets
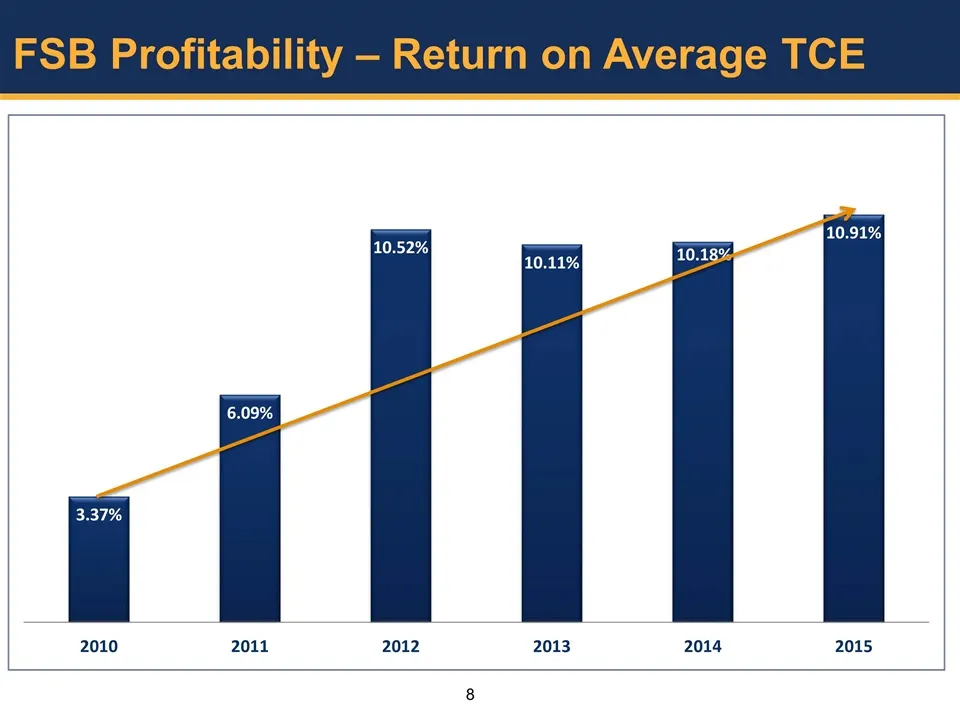
Slide 8: FSB Profitability – Return on Average TCE
FSB Profitability – Return on Average TCE
Slide 9: Factors Supporting Record 2015 Earnings
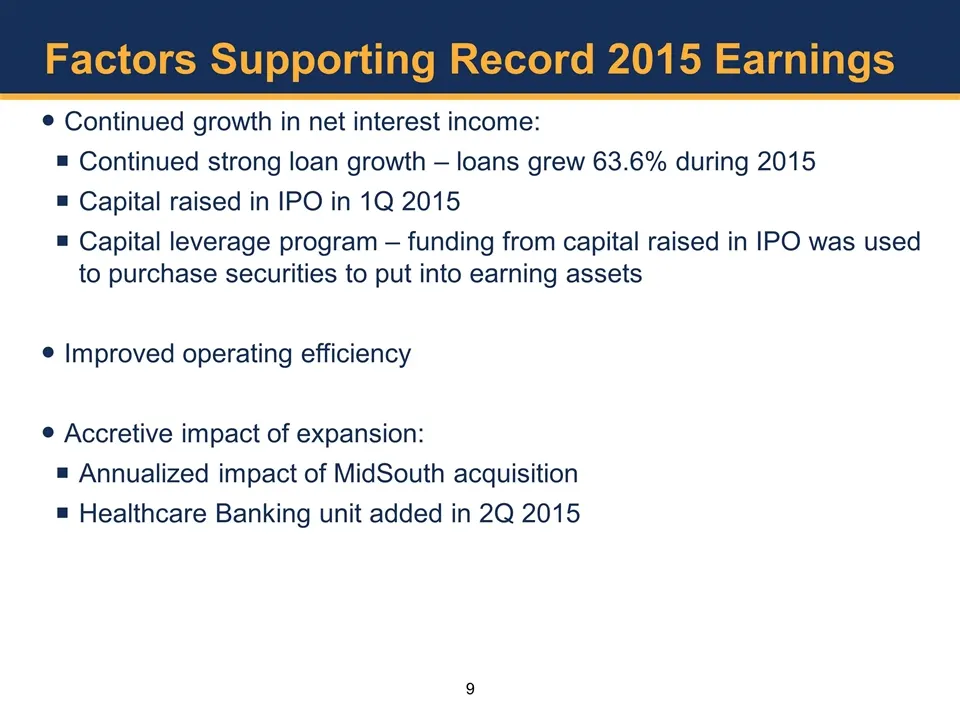
Factors Supporting Record 2015 Earnings Continued growth in net interest income: Continued strong loan growth – loans grew 63.6% during 2015 Capital raised in IPO in 1Q 2015 Capital leverage program – funding from capital raised in IPO was used to purchase securities to put into earning assets Impro
Slide 10: FSB Quarterly Earnings: Impacted by One-Time Items
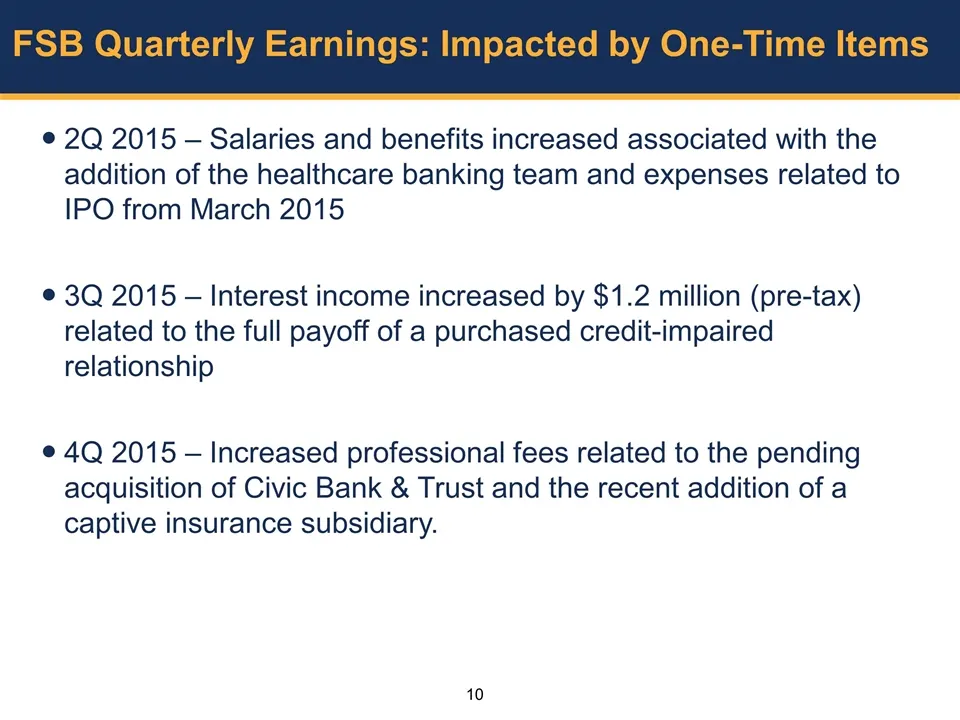
FSB Quarterly Earnings: Impacted by One-Time Items 2Q 2015 – Salaries and benefits increased associated with the addition of the healthcare banking team and expenses related to IPO from March 2015 3Q 2015 – Interest income increased by $1.2 million (pre-tax) related to the full payoff of a purchased
Slide 11: FSB Earnings – Quarterly Net Income
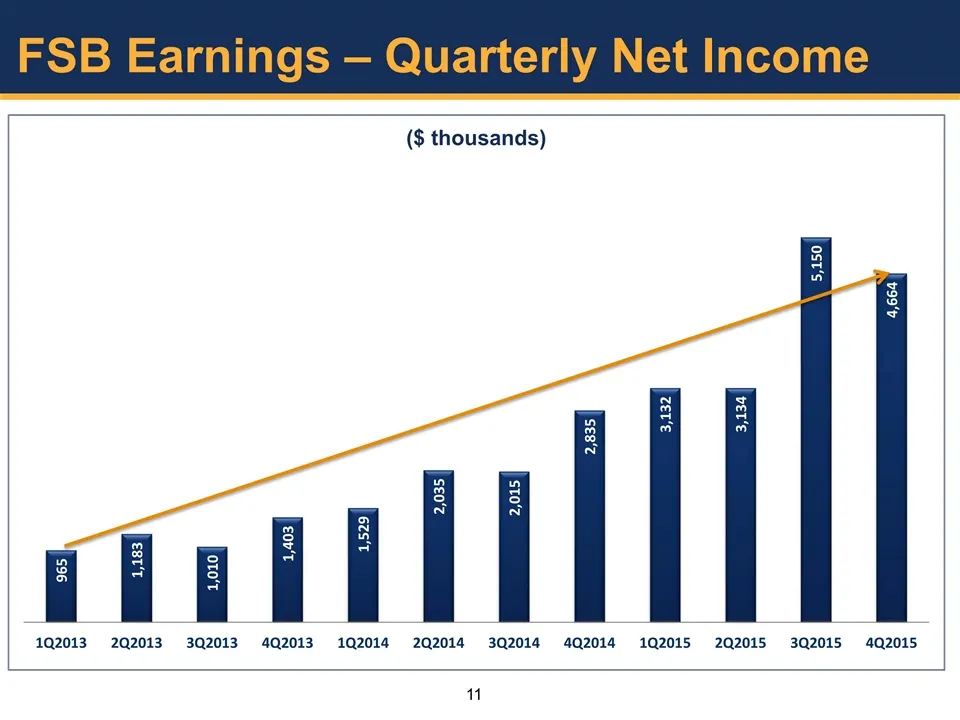
FSB Earnings – Quarterly Net Income
Slide 12: FSB Net Income – Quarterly and Year-to-Date
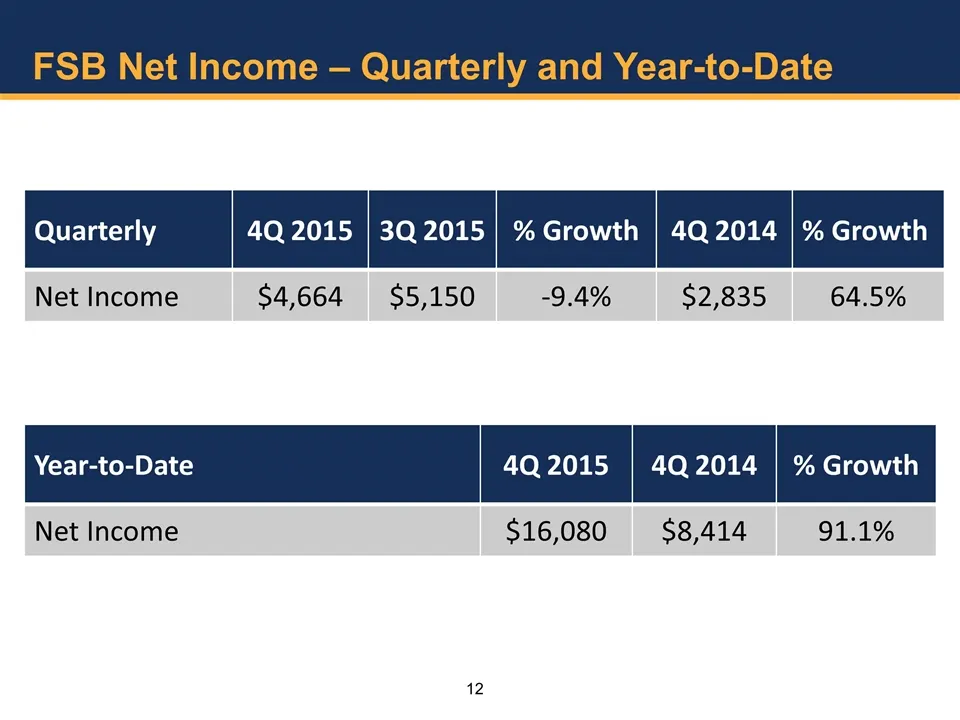
FSB Net Income – Quarterly and Year-to-Date Quarterly 4Q 2015 3Q 2015 % Growth 4Q 2014 % Growth Net Income $4,664 $5,150 -9.4% $2,835 64.5% Year-to-Date 4Q 2015 4Q 2014 % Growth Net Income $16,080 $8,414 91.1%
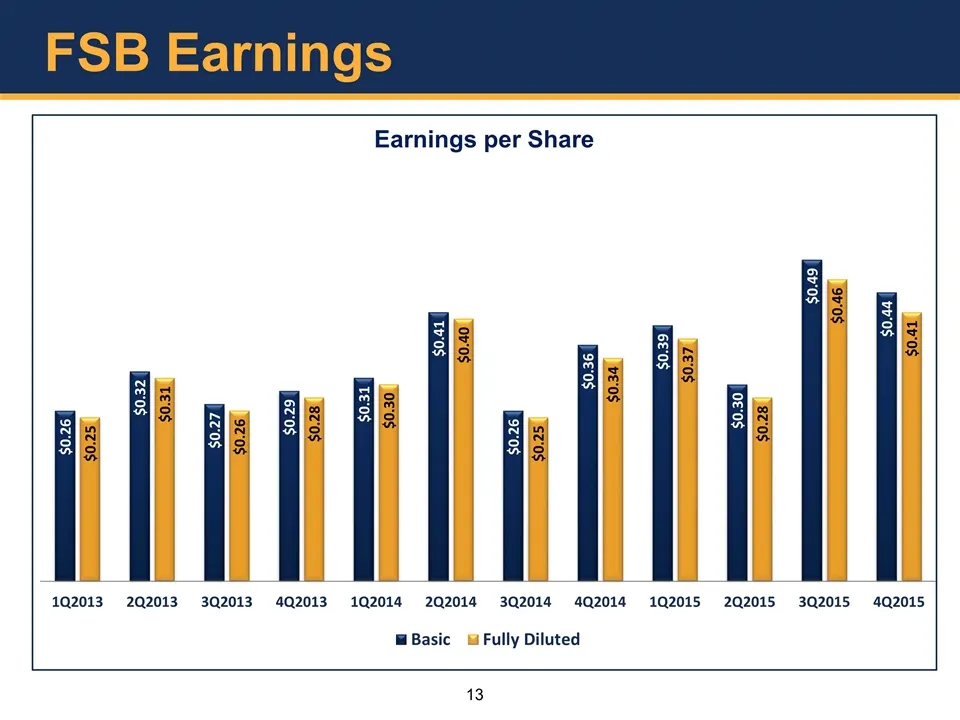
Slide 13: FSB Earnings per Share
FSB Earnings Earnings per Share s & = o § ba |S Py | ae a Of 8 FA 1 ae | A Fs g Fy a 8 a By Ie FA fn 8 se FA ig 8 3 & si 1Q2013 2Q2013 3Q2013 4Q2013 1Q2014 2Q2014 3Q2014 4Q2014 1Q2015 2Q2015 3Q2015 4Q2015 Basic Fully Diluted 13
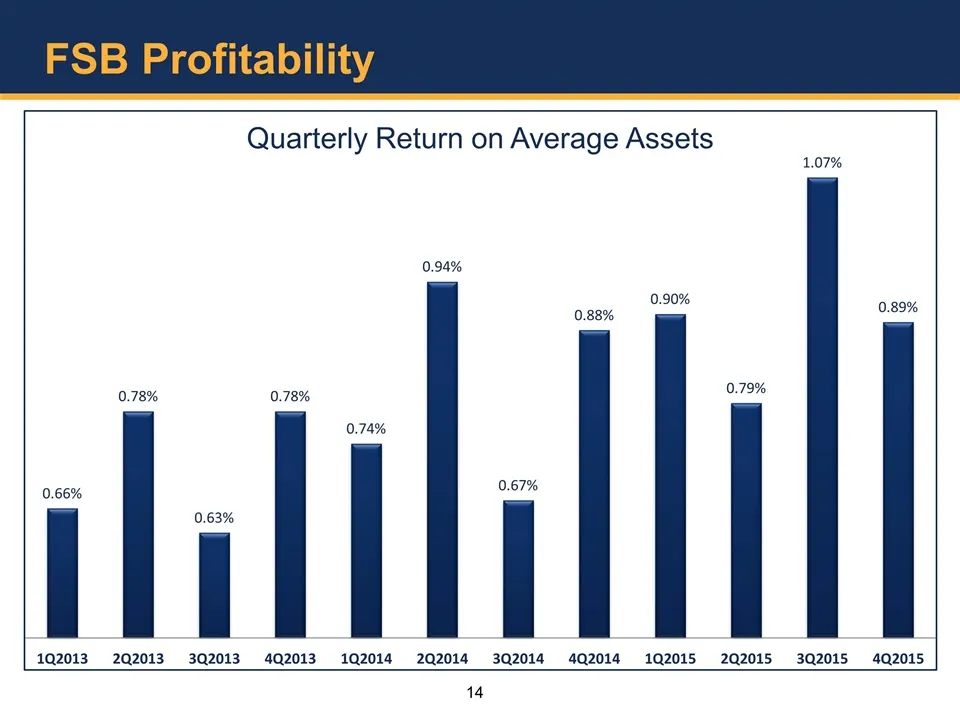
Slide 14: FSB Profitability – Quarterly Return on Average Assets
FSB Profitability Quarterly Return on Average Assets 0.78% 0.78% 0.74% 0.66% | 0.63% 1Q2013 202013 3Q2013 402013102014 0.94% 0.90% 0.88% 0.79% 0.67% 2Q2014 3Q20144Q2014_1Q2015 202015 1.07% 3Q2015 0.89% 4Q2015 14
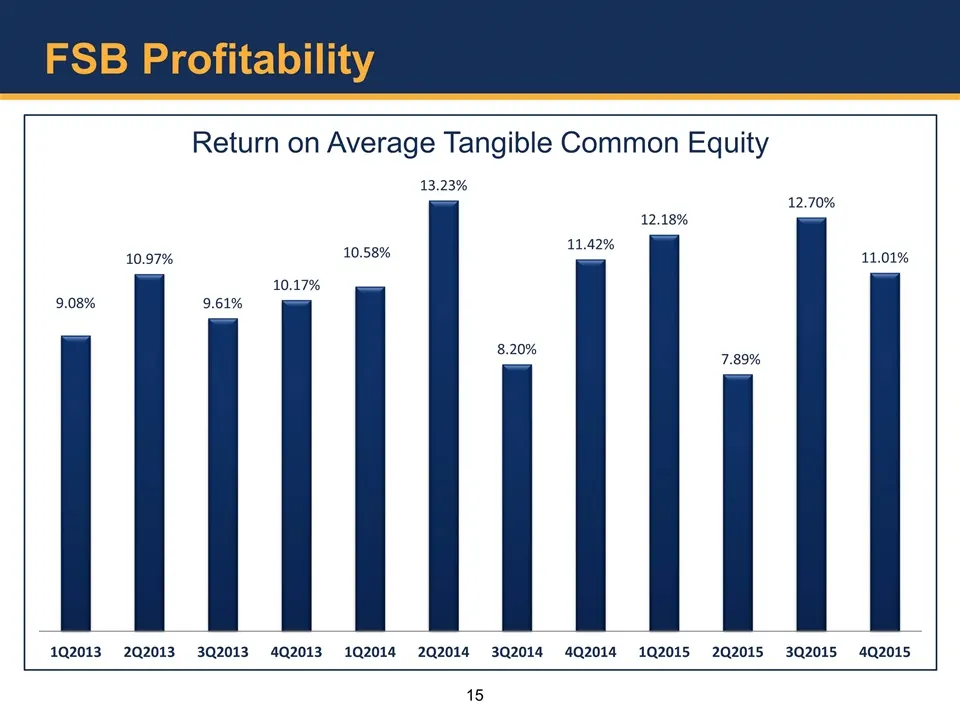
Slide 15: FSB Profitability – Return on Average Tangible Common Equity
FSB Profitability Return on Average Tangible Common Equity 13.23% 12.70% 12.18% 11.42% 10.97% 10.58% 11.01% 10.17% 9.08% 9.61% | | | | 1Q2013 202013 3Q2013 402013 1Q2014 202014 3Q2014 402014 1Q2015 202015 3Q2015 4Q2015 15
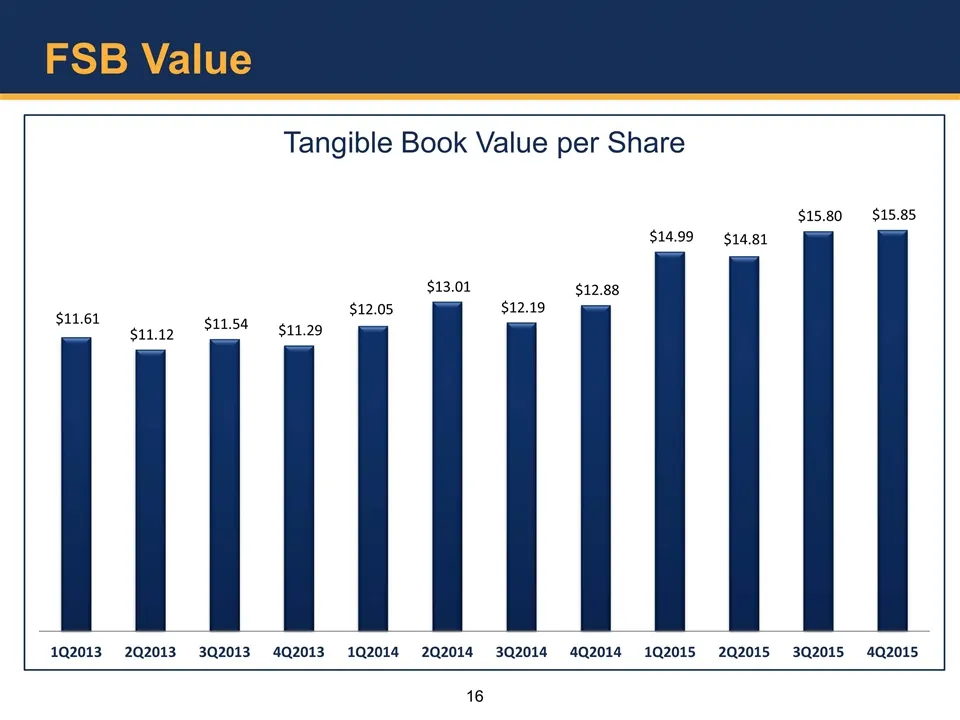
Slide 16: FSB Value – Tangible Book Value per Share
FSB Value Tangible Book Value per Share $15.80 $15.85 $14.99 $14.81 $13.01 $12.88 61 $12.05 $12.19 | | | | | | | 02013 202013 3Q2013 4Q2013 1Q2014 202014 302014 4Q2014 1Q2015 2Q2015 3Q2015 402015 16

Slide 17: Growth
Growth
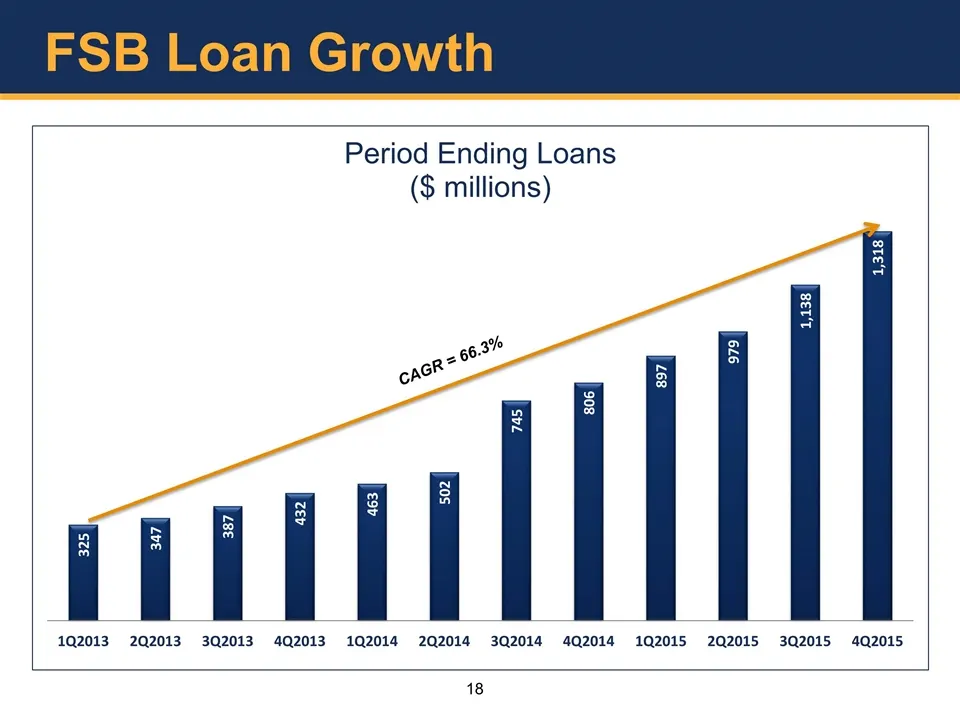
Slide 18: FSB Loan Growth
FSB Loan Growth Period Ending Loans ($ millions) 8 @ g = & 8 x o 8 8 = 5 g ms Py a 8 a 102013 202013 302013 4Q2013 1Q2014 202014 3Q2014 4Q2014 1Q2015 2Q2015 3Q2015 4Q2015 18
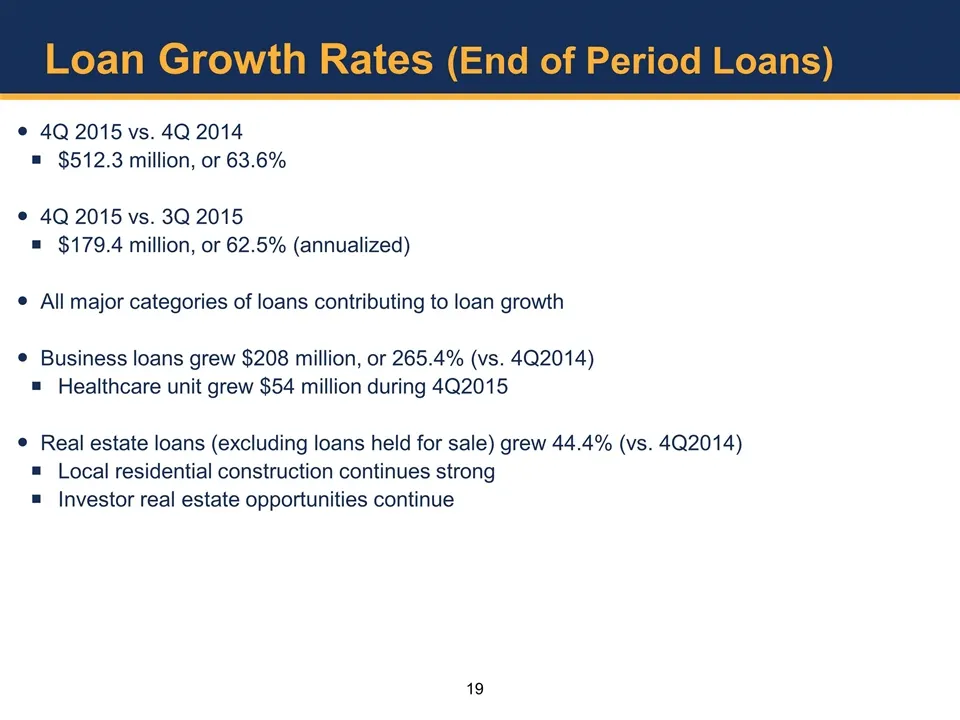
Slide 19: Loan Growth Rates
Loan Growth Rates (End of Period Loans) 4Q 2015 vs. 4Q 2014 $512.3 million, or 63.6% 4Q 2015 vs. 3Q 2015 $179.4 million, or 62.5% (annualized) All major categories of loans contributing to loan growth Business loans grew $208 million, or 265.4% (vs. 4Q2014) Healthcare unit grew $54 million during 4Q
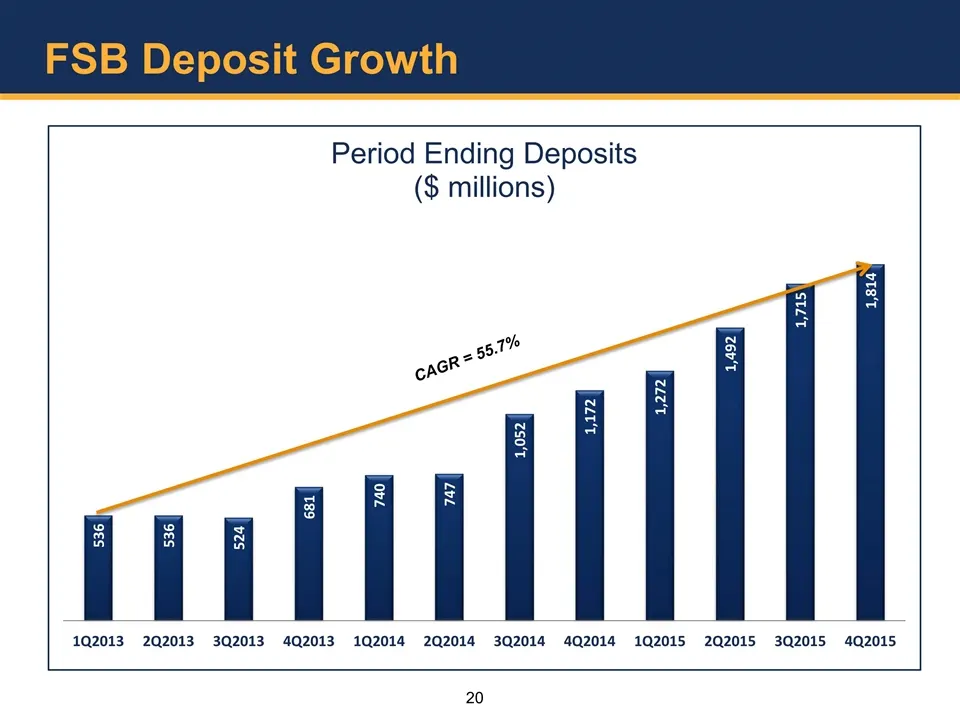
Slide 20: FSB Deposit Growth
FSB Deposit Growth CAGR = 55.7%
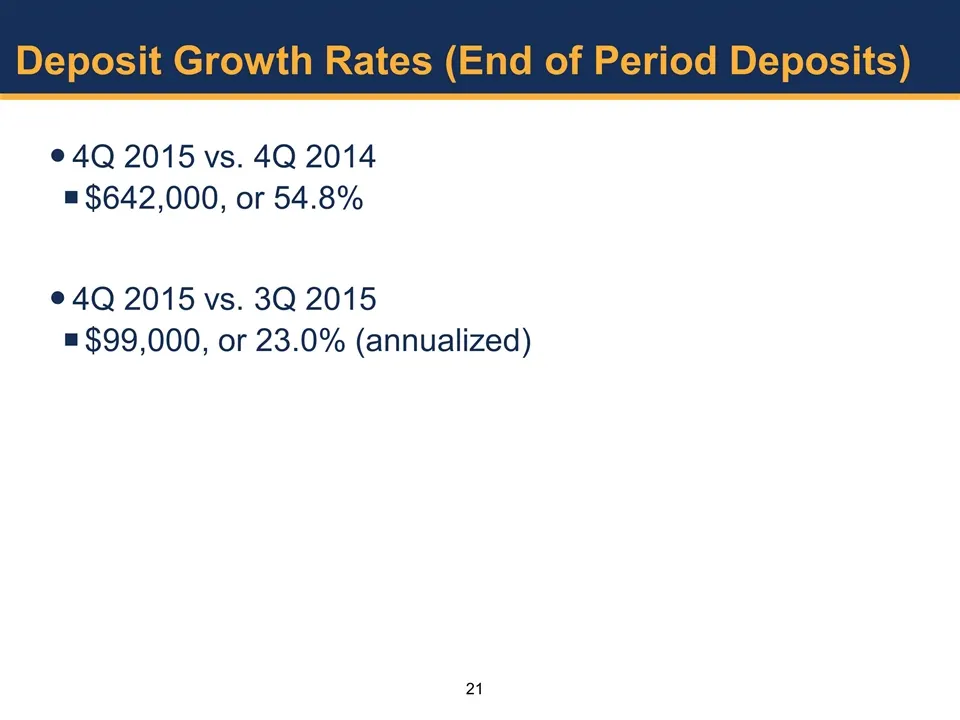
Slide 21: Deposit Growth Rates
4Q 2015 vs. 4Q 2014 $642,000, or 54.8% 4Q 2015 vs. 3Q 2015 $99,000, or 23.0% (annualized) Deposit Growth Rates (End of Period Deposits)
Slide 22: FSB Investment Portfolio Growth
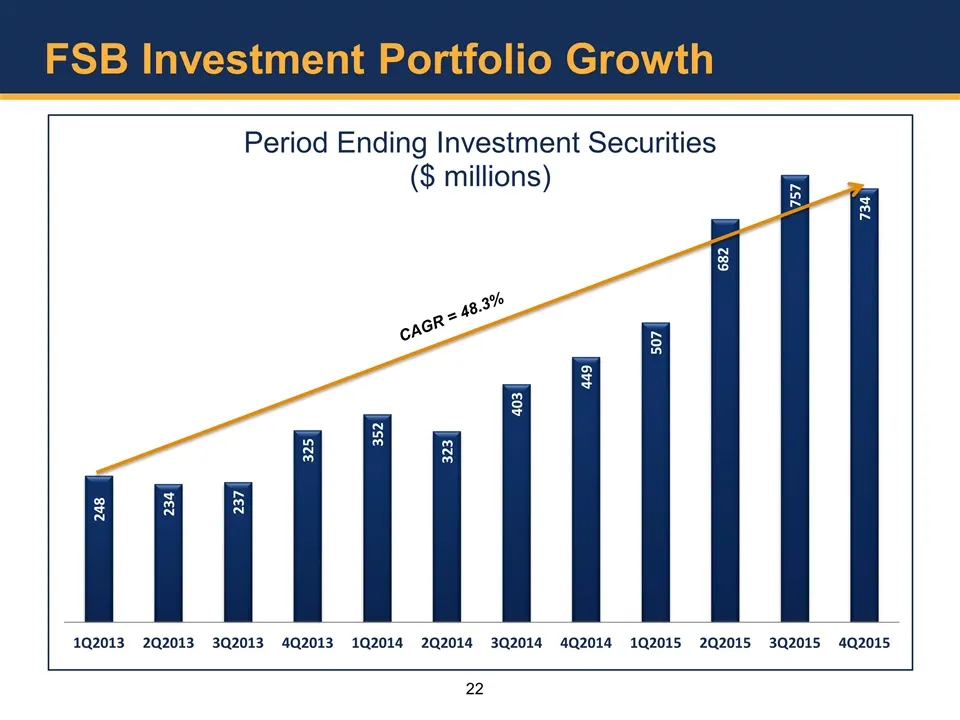
FSB Investment Portfolio Growth CAGR = 48.3%
Slide 23: Investment Portfolio Growth
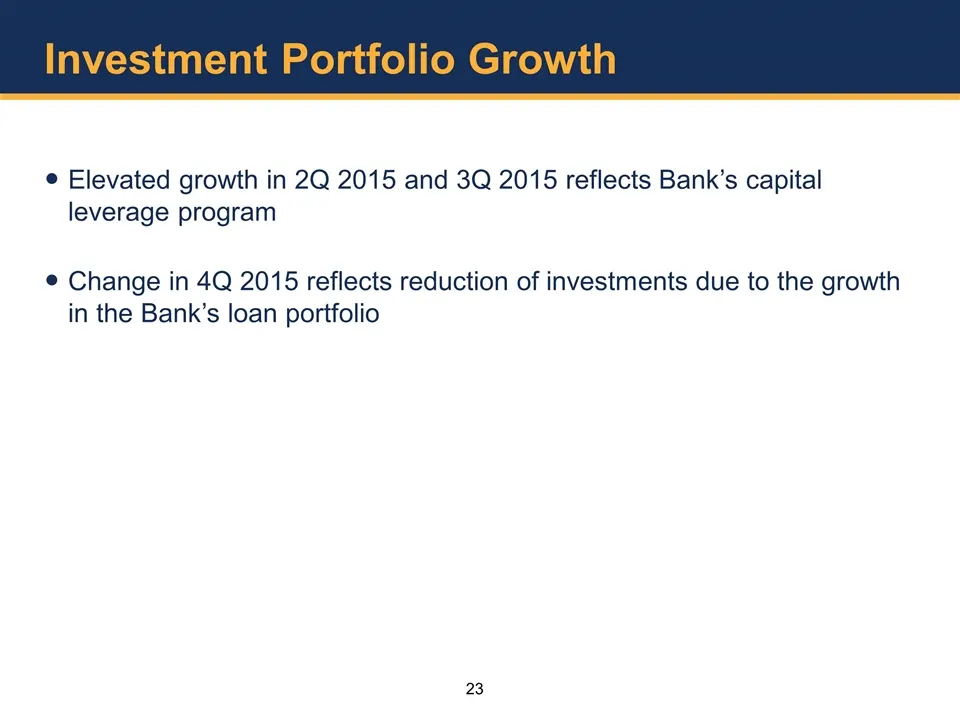
Investment Portfolio Growth Elevated growth in 2Q 2015 and 3Q 2015 reflects Bank’s capital leverage program Change in 4Q 2015 reflects reduction of investments due to the growth in the Bank’s loan portfolio
Slide 24: Asset Quality
Asset Quality
Slide 25: Nonperforming Assets to Total Assets
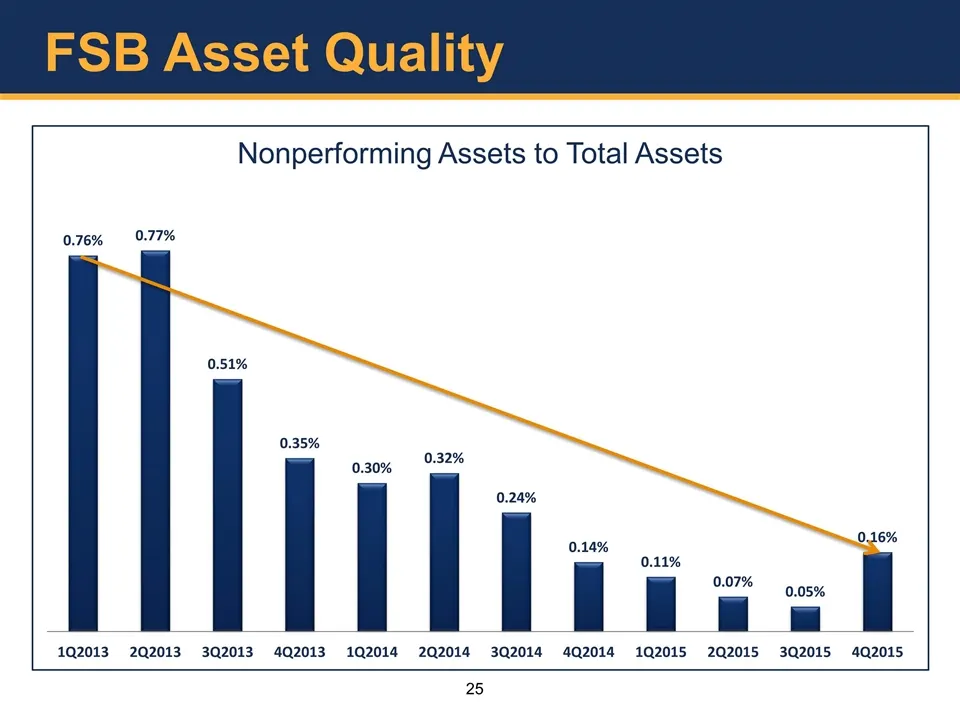
Nonperforming Assets to Total Assets 0.76% (9.77% 102013 202013 302013 4Q2013 102014 202014 3Q2014 4Q2014 1Q2015 2Q2015 3Q2015 4Q2015 25
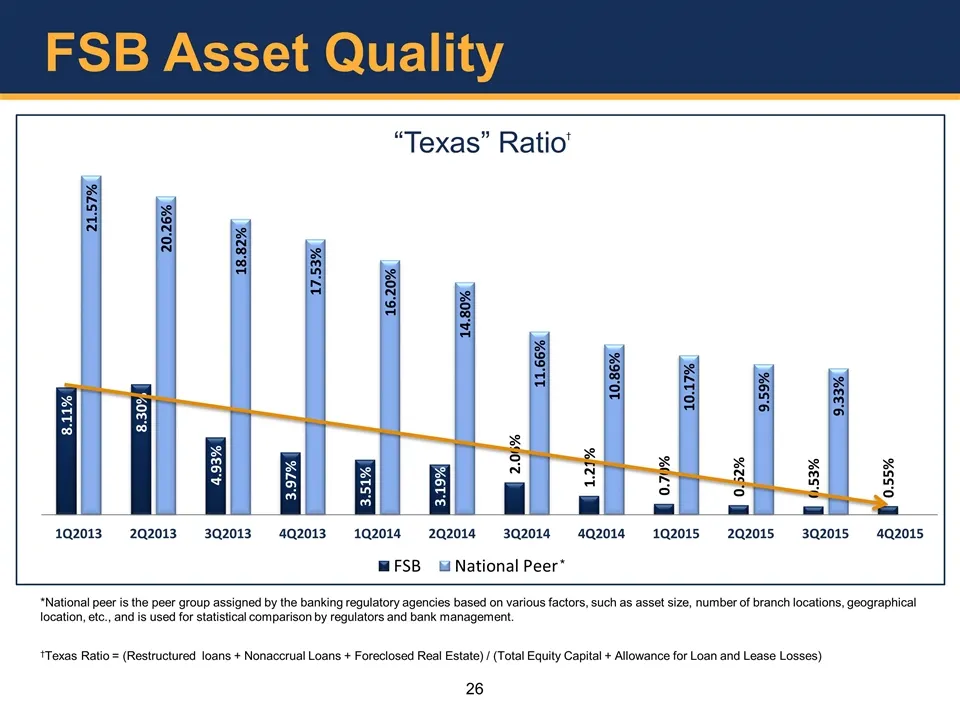
Slide 26: FSB Asset Quality
FSB Asset Quality *National peer is the peer group assigned by the banking regulatory agencies based on various factors, such as asset size, number of branch locations, geographical location, etc., and is used for statistical comparison by regulators and bank management. * †Texas Ratio = (Restructur
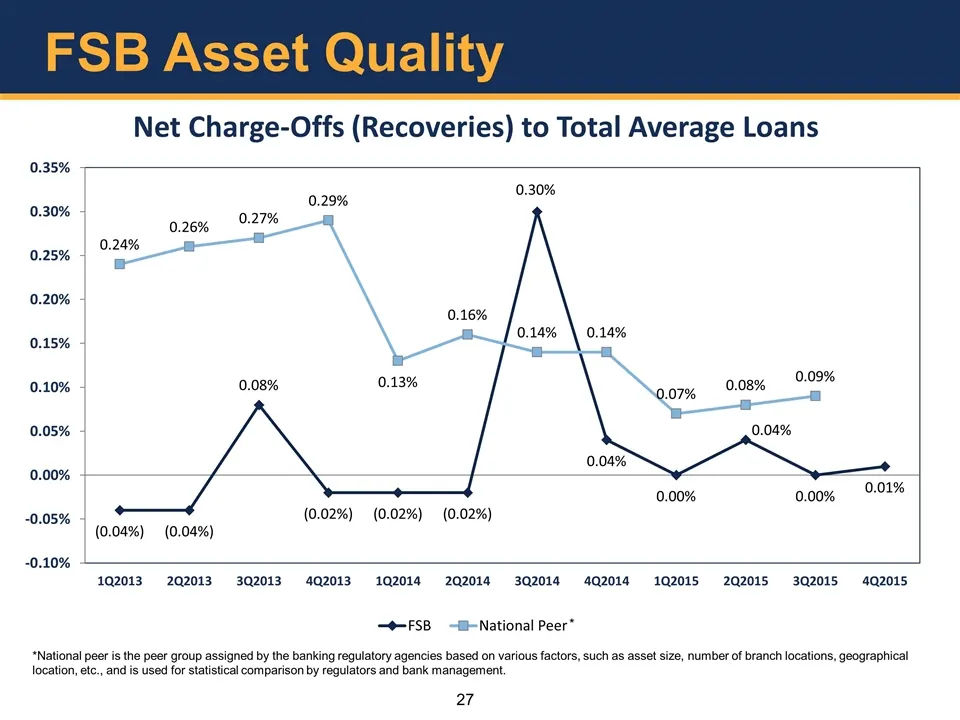
Slide 27: Net Charge-Offs (Recoveries) to Total Average Loans
Net Charge-Offs (Recoveries) to Total Average Loans 0.35% 0.30% 0.30% _ 0.25% 0.20% 0.15% - 0.10% - 0.05% - 0.00% -- -0.05% (0.02%) (0.02%) (0.02%) (0.04%) (0.04%) -0.10! 1Q2013 202013 302013 402013 102014 202014 3Q2014 «402014 102015 202015 3Q2015 4Q2015 -®FSB National Peer* *National p pe ‘geograp

Slide 28: Real Estate Lending
Real Estate Lending
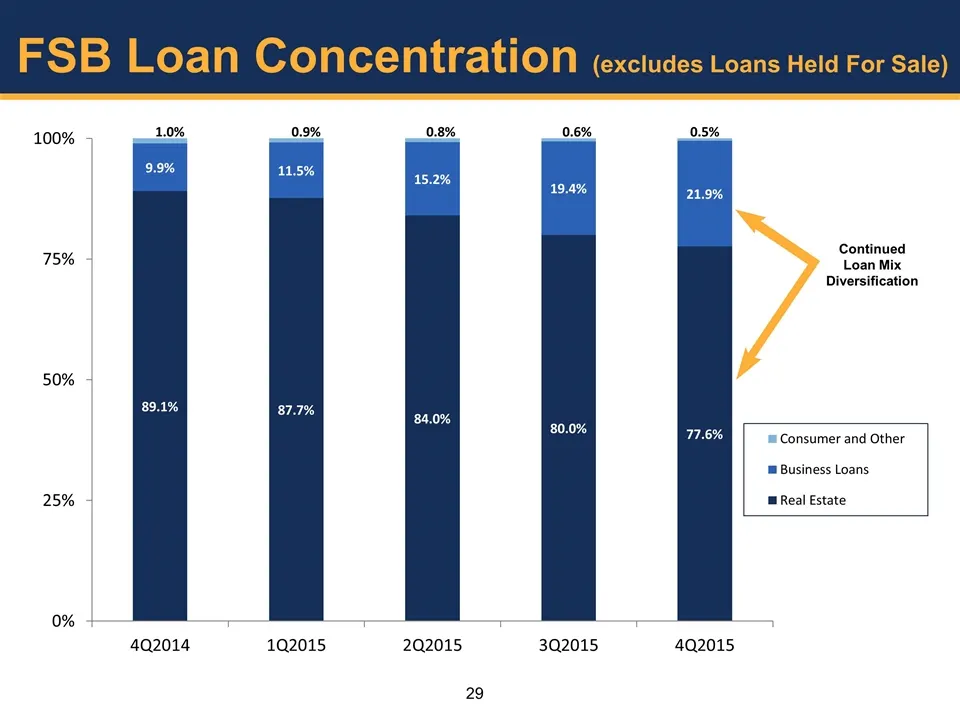
Slide 29: FSB Loan Concentration
FSB Loan Concentration (excludes Loans Held For Sale)
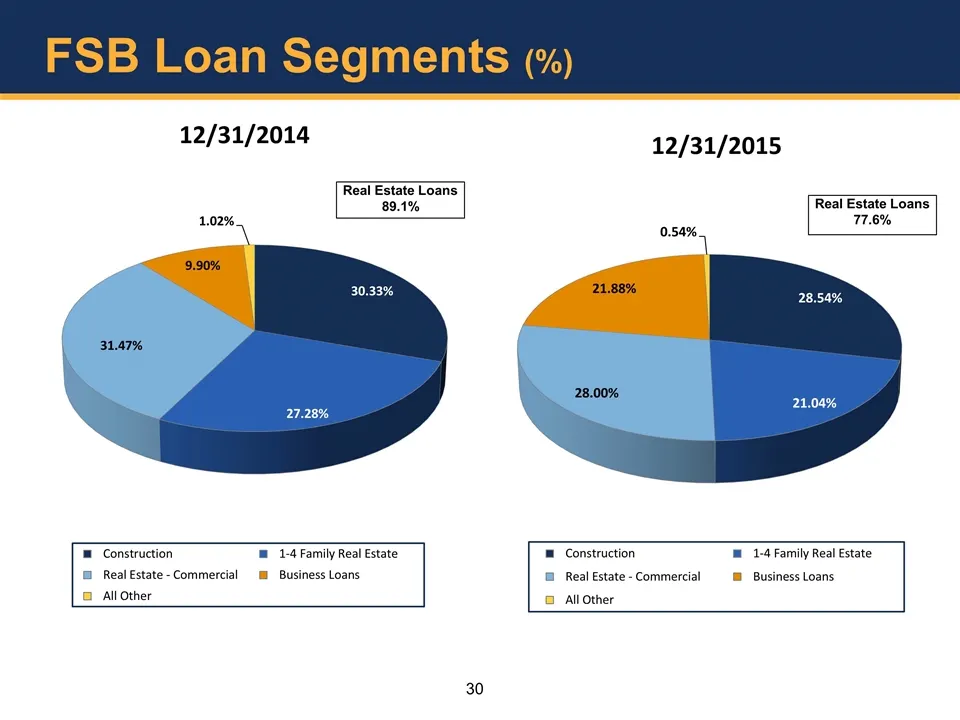
Slide 30: Real Estate Loans
12/31/2014 12/31/2015 Real Estate Loans 89.1% N 27.28% ™ Construction’ 1-4 Family Real Estate Construction 1-4 Family Real Estate © RealEstate- Commercial m@ Business Loans | RealEstate -Commercial fm _ Business Loans. @ Allother © allother
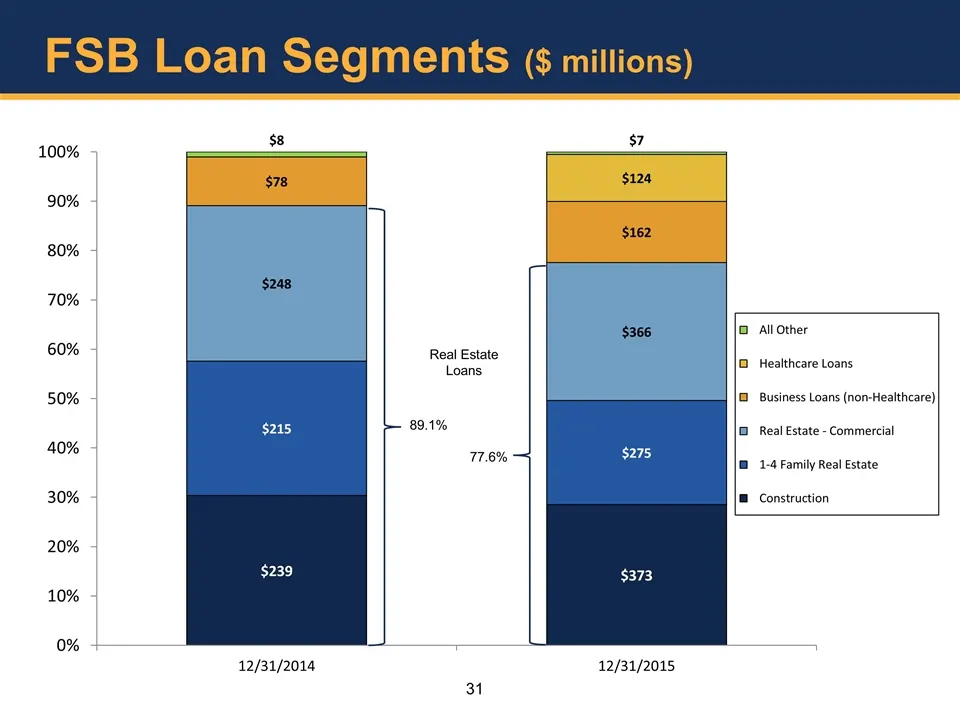
Slide 31: FSB Loan Segments
FSB Loan Segments ($ millions)
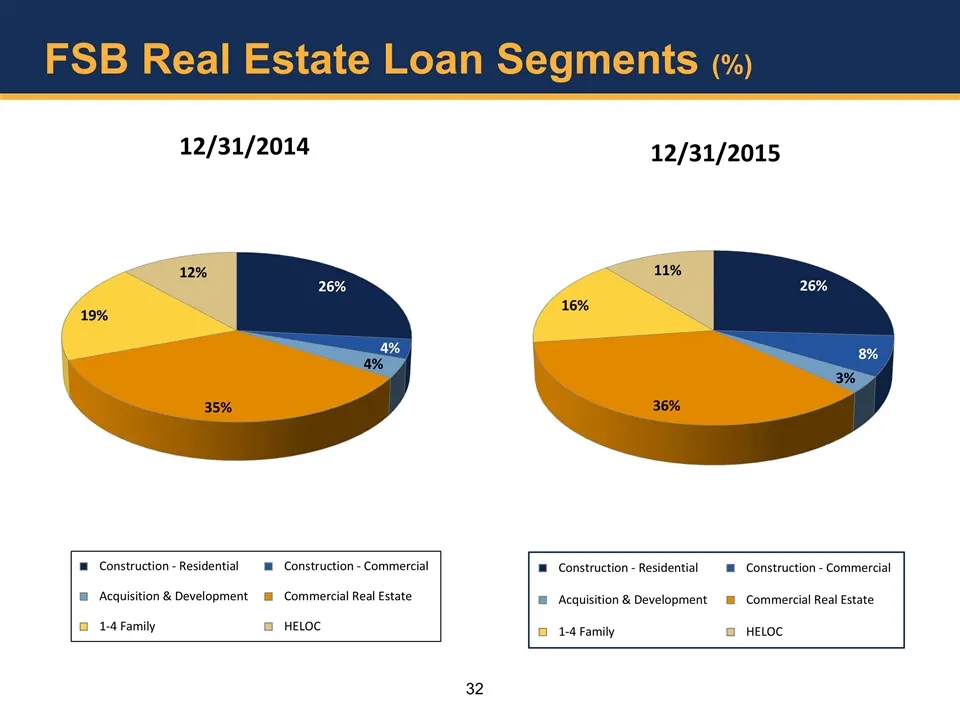
Slide 32: FSB Real Estate Loan Segments
FSB Real Estate Loan Segments (%)
Slide 33: Long Term Plan Metrics
Long Term Plan Metrics
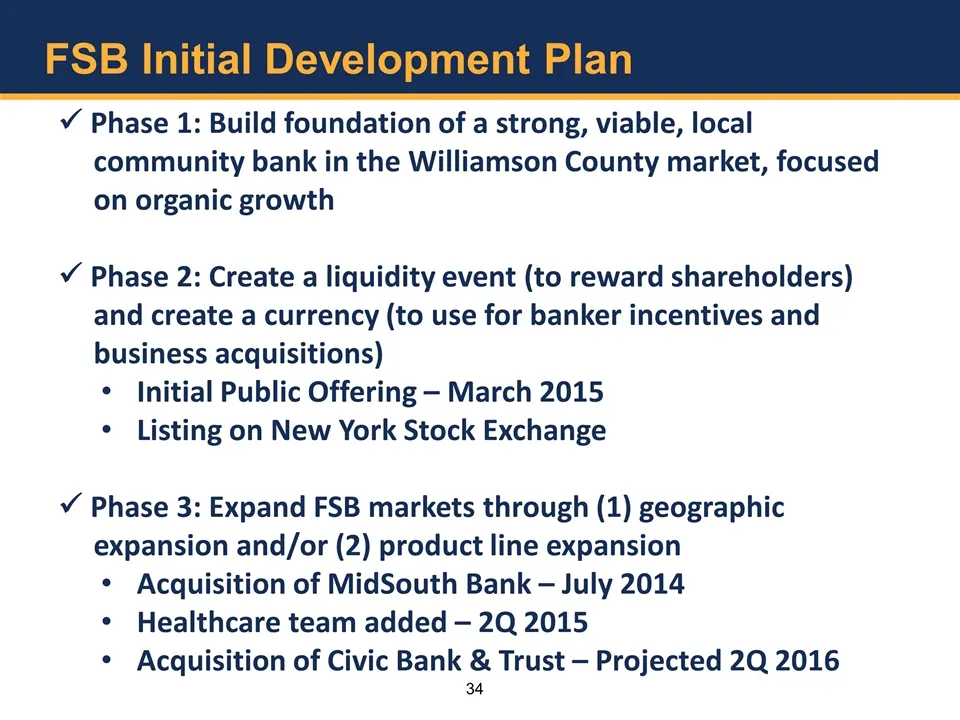
Slide 34: FSB Initial Development Plan
FSB Initial Development Plan ü Phase 1: Build foundation of a strong, viable, local community bank in the Williamson County market, focused on organic growth ü Phase 2: Create a liquidity event (to reward shareholders) and create a currency (to use for banker incentives and business acquisitions) In
Slide 35: Keys to Enhancing Continued Profitability
Keys to Enhancing Continued Profitability Improve interest margins
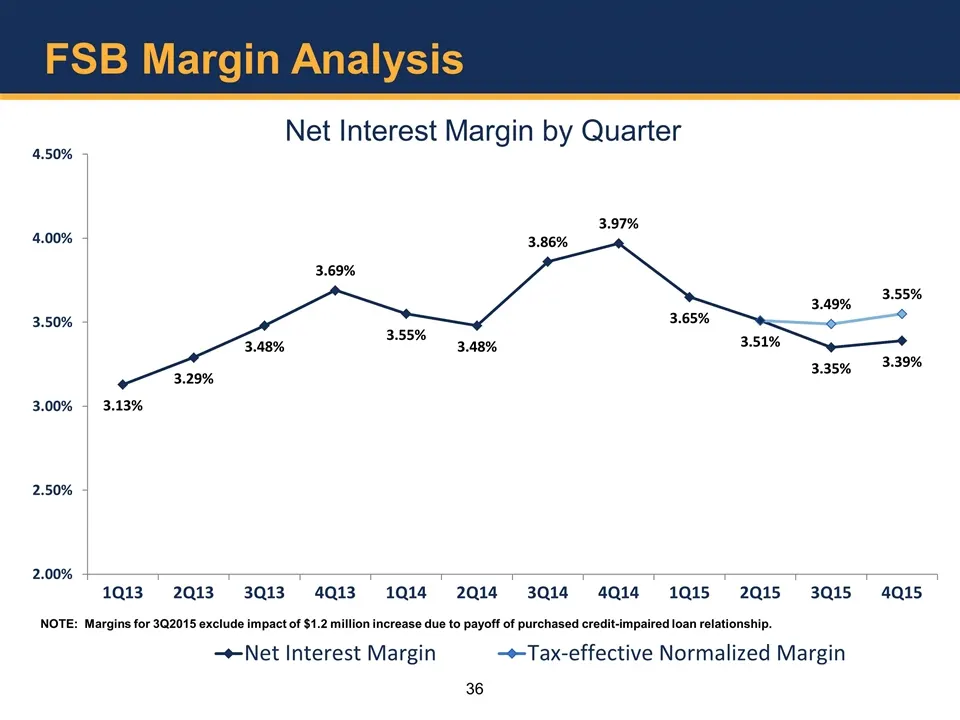
Slide 36: Net Interest Margin by Quarter
4.50% 3.50% 2.50% NOTE: Net Interest Margin by Quarter 3.13% 1Q13. 2Q13 +43Q13 44Q13 «1Q14 2Q14 3Q14 4Q14 1Q15 2Q15 3Q15 4Q15 fT Net Interest Margin —-Tax-effective Normalized Margin 36
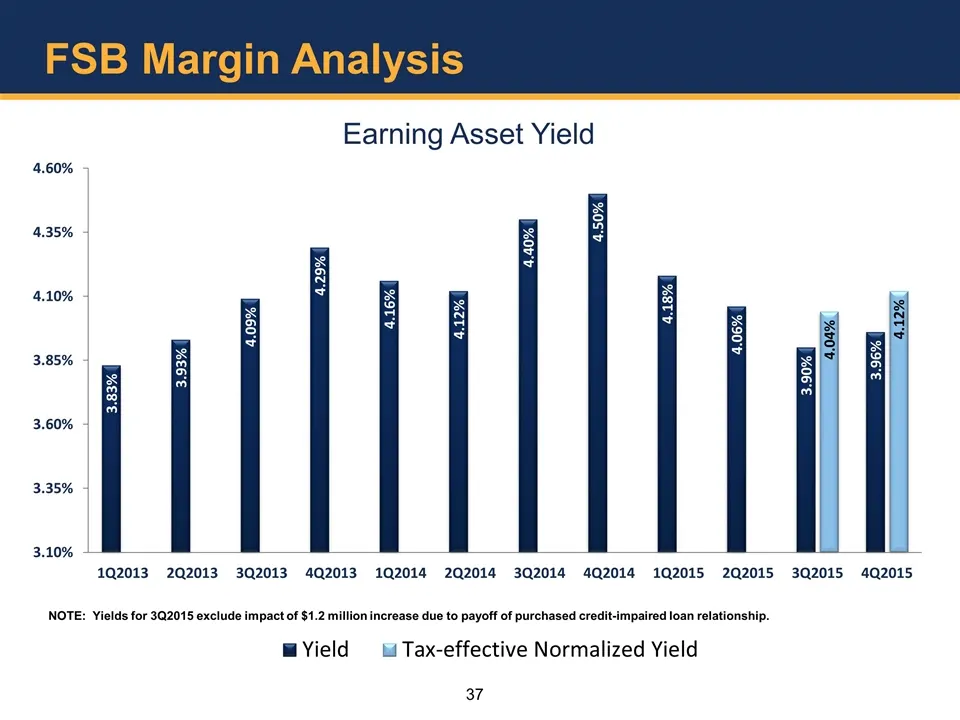
Slide 37: Earning Asset Yield
4.60% > 4.35% 4.10% 3.85% 3.60% 3.35% 3.10% NOTE: 192013 202013 Earning Asset Yield 3Q2013 402013 102014 202014 302014 4Q2014 192015 2Q2015 w Yield li Tax-effective Normalized Yield 37 3Q2015 4Q2015
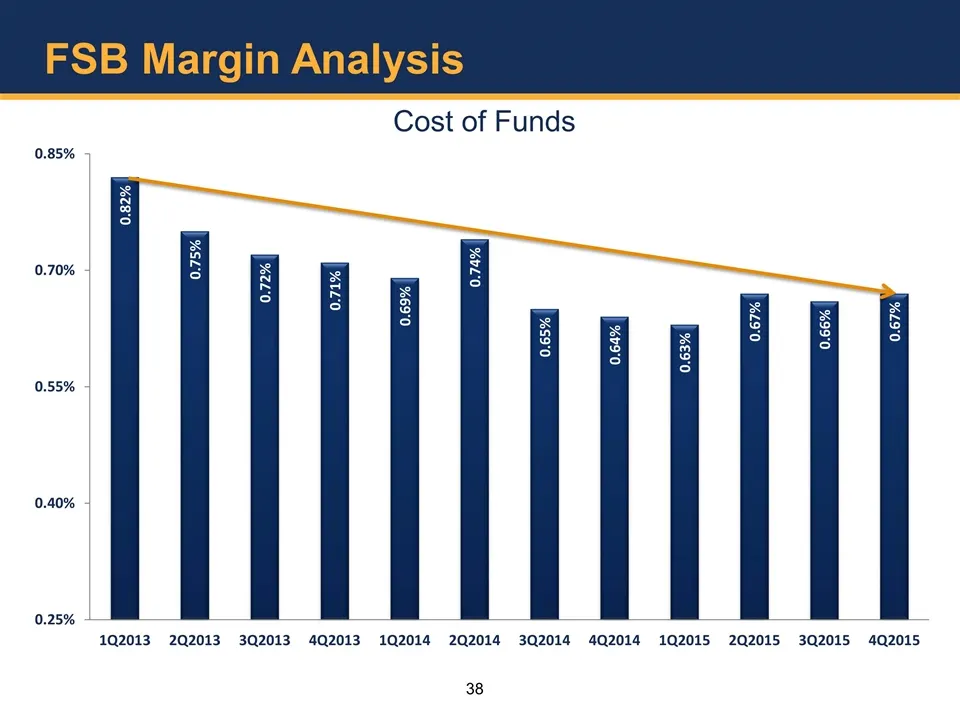
Slide 38: FSB Margin Analysis – Cost of Funds
FSB Margin Analysis Cost of Funds = 6 202014 0.85% 0.70% 0.55% 0.40% 0.25% 0.82% 192013 0.75%, 292013 0.72%, 0.71% 3Q2013 4Q2013 0.69% 192014 38 0.65% 0.64% 3Q2014 4Q2014 0.67% 0.66% 0.63%, 192015 202015 302015 0.67% 4Q2015
Slide 39: Keys to Enhancing Continued Profitability: Improve efficiency ratio
Keys to Enhancing Continued Profitability Improve interest margins Improve efficiency ratio
Slide 40: FSB Efficiency Ratio
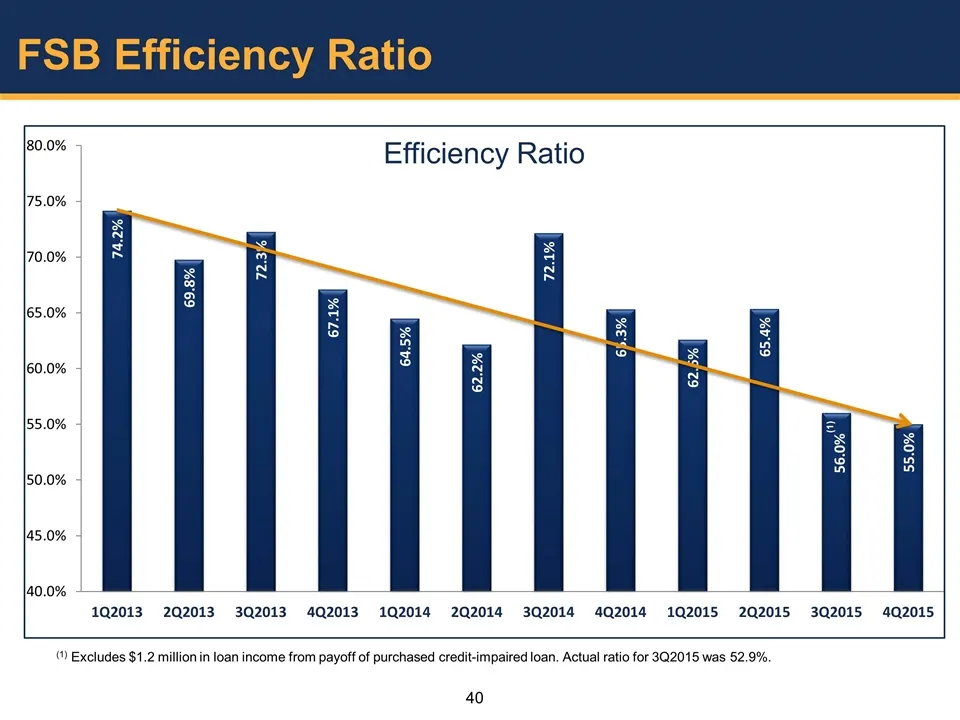
FSB Efficiency Ratio (1) Excludes $1.2 million in loan income from payoff of purchased credit-impaired loan. Actual ratio for 3Q2015 was 52.9%.
Slide 41: Keys to Enhancing Continued Profitability: Optimize non-interest income
Keys to Enhancing Continued Profitability Improve interest margins Improve efficiency ratio Optimize non-interest income
Slide 42: FSB Mortgage Production Trends
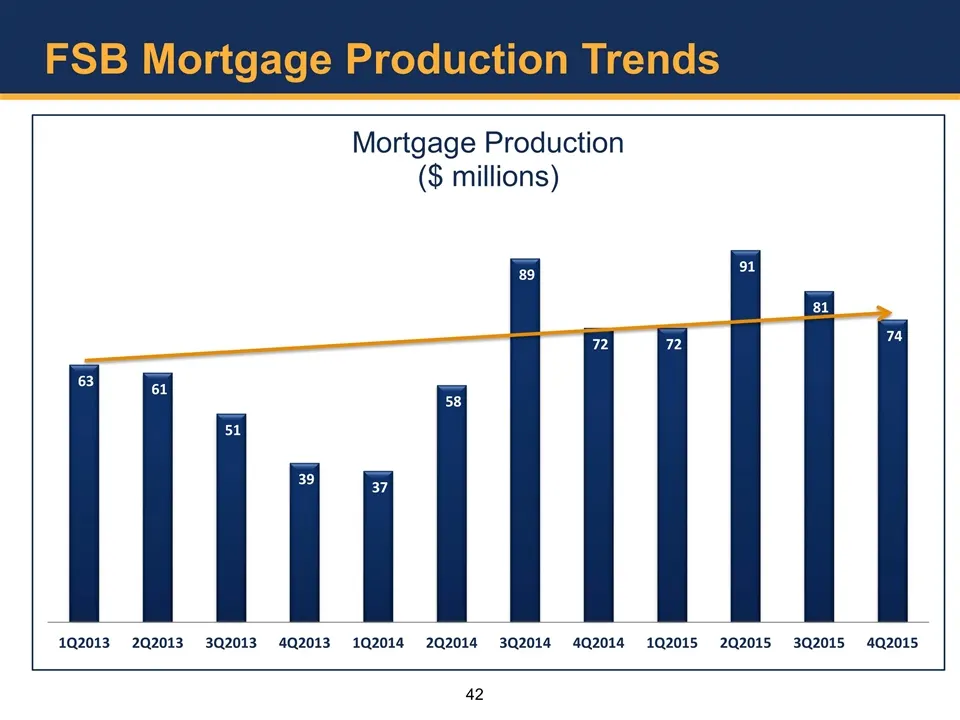
FSB Mortgage Production Trends
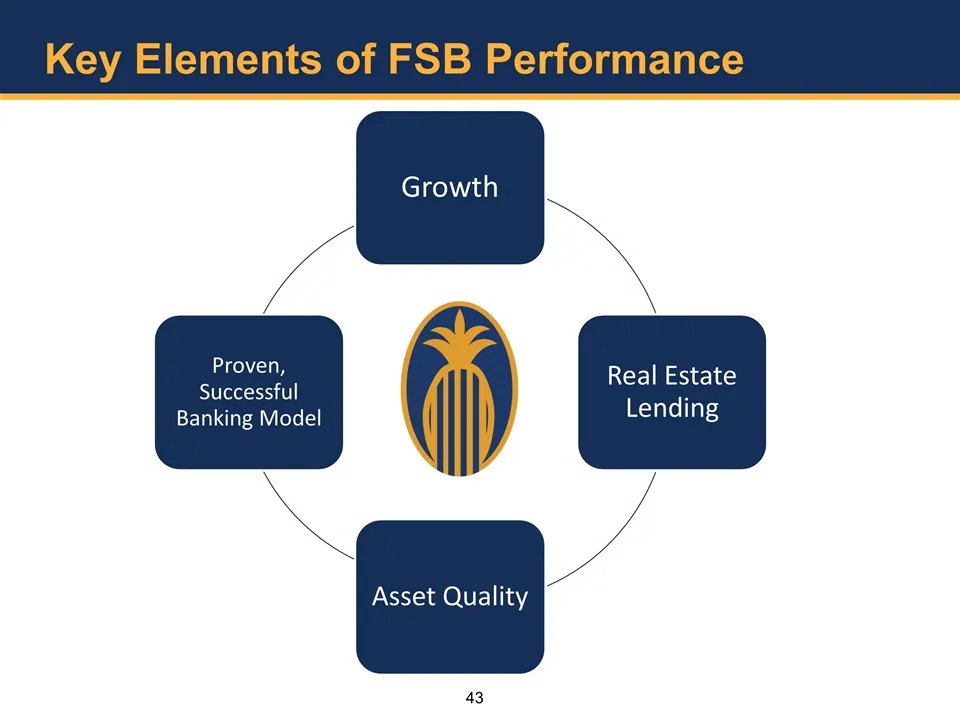
Slide 43: Key Elements of FSB Performance
Key Elements of FSB Performance Growth Real Estate Lending Asset Quality Proven, Successful Banking Model
Source: SEC EDGAR · 8-K filed Jan 27, 2016
More decks from Franklin Financial Network Inc
 Merger or Acquisition (January 2020)17 slides · Jan 21, 2020
 Q3 2019 Earnings Presentation21 slides · Nov 1, 2019
 Q3 2019 Earnings Presentation15 slides · Oct 23, 2019
 Q2 2019 Earnings Presentation19 slides · Jul 26, 2019
 Q2 2019 Earnings Presentation15 slides · Jul 24, 2019
 Q1 2019 Earnings Presentation19 slides · May 10, 2019