Pharsight — Investor Presentation (June 2005)
41 slides from Pharsight's investor presentation, Jun 28, 2005
Slide 1: Pharsight Investor Presentation June 2005
Exhibit 99.1 Pharsight Investor June Shawn President Cynthia SVP & 2005 O’Connor CFO Stephens Presentation & Corporation CEO
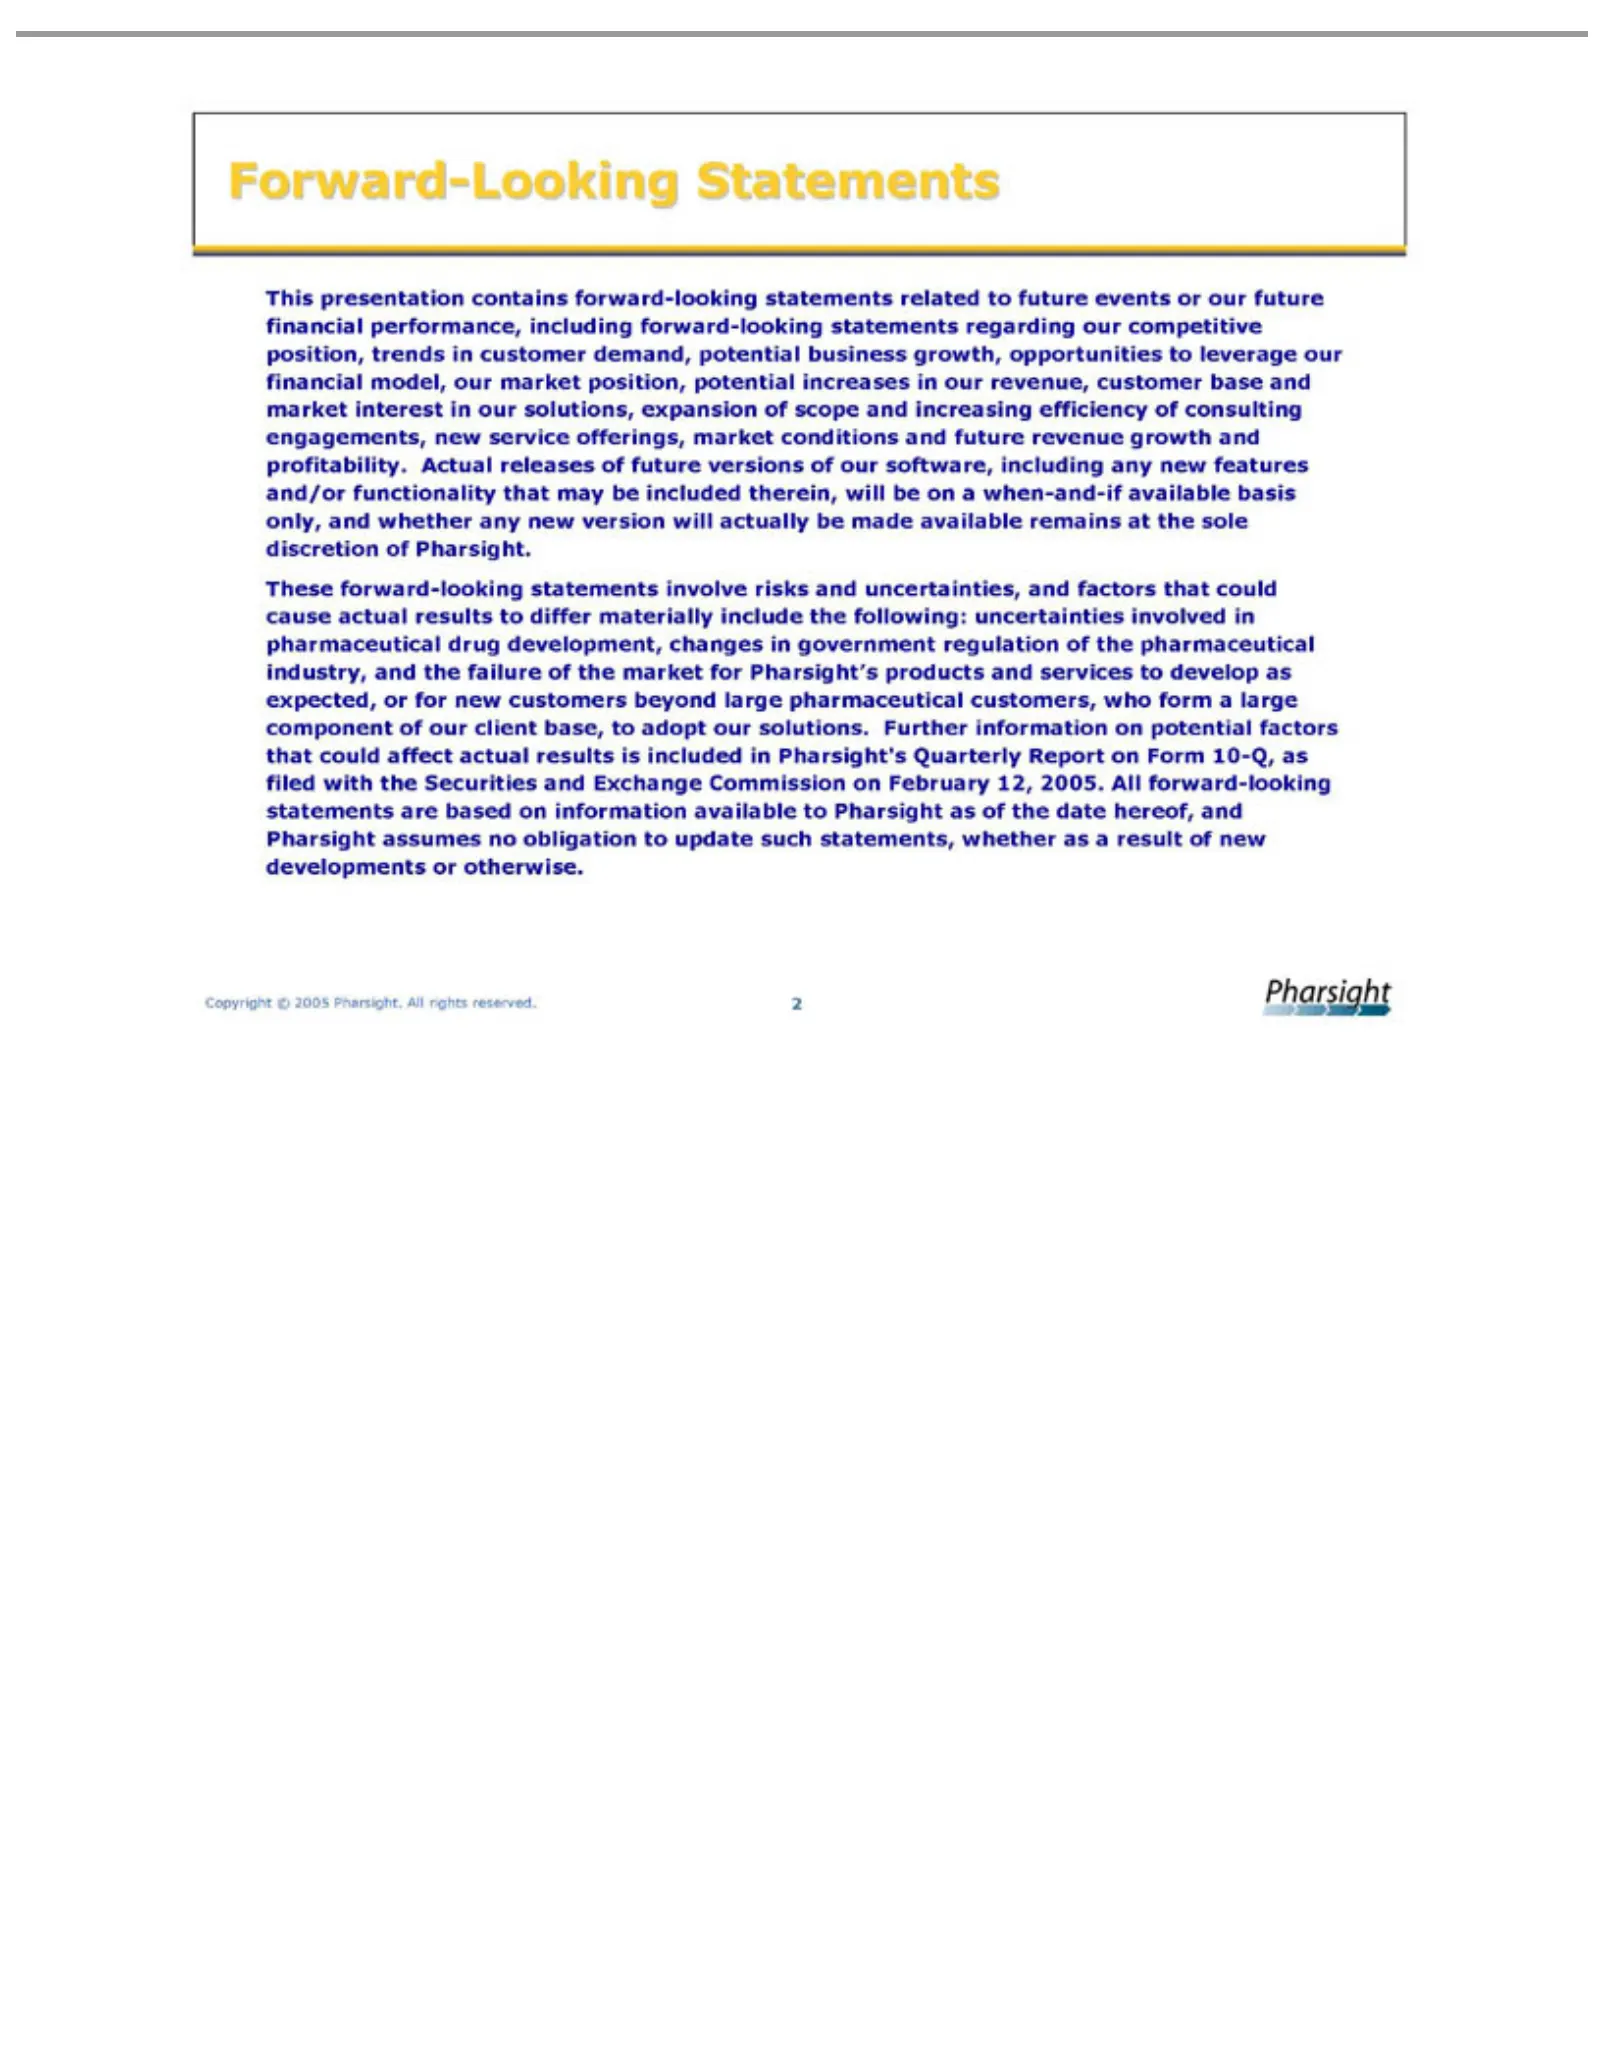
Slide 2: Forward-Looking Statements
Forward-Looking This customer expansion software, remains These development, large Quarterly date Copyright hereof, presentation pharmaceutical forward-looking atdemand, including Report of © the and 2005 scope changes sole Pharsight on contains Statements Pharsight. potential discretion and any For
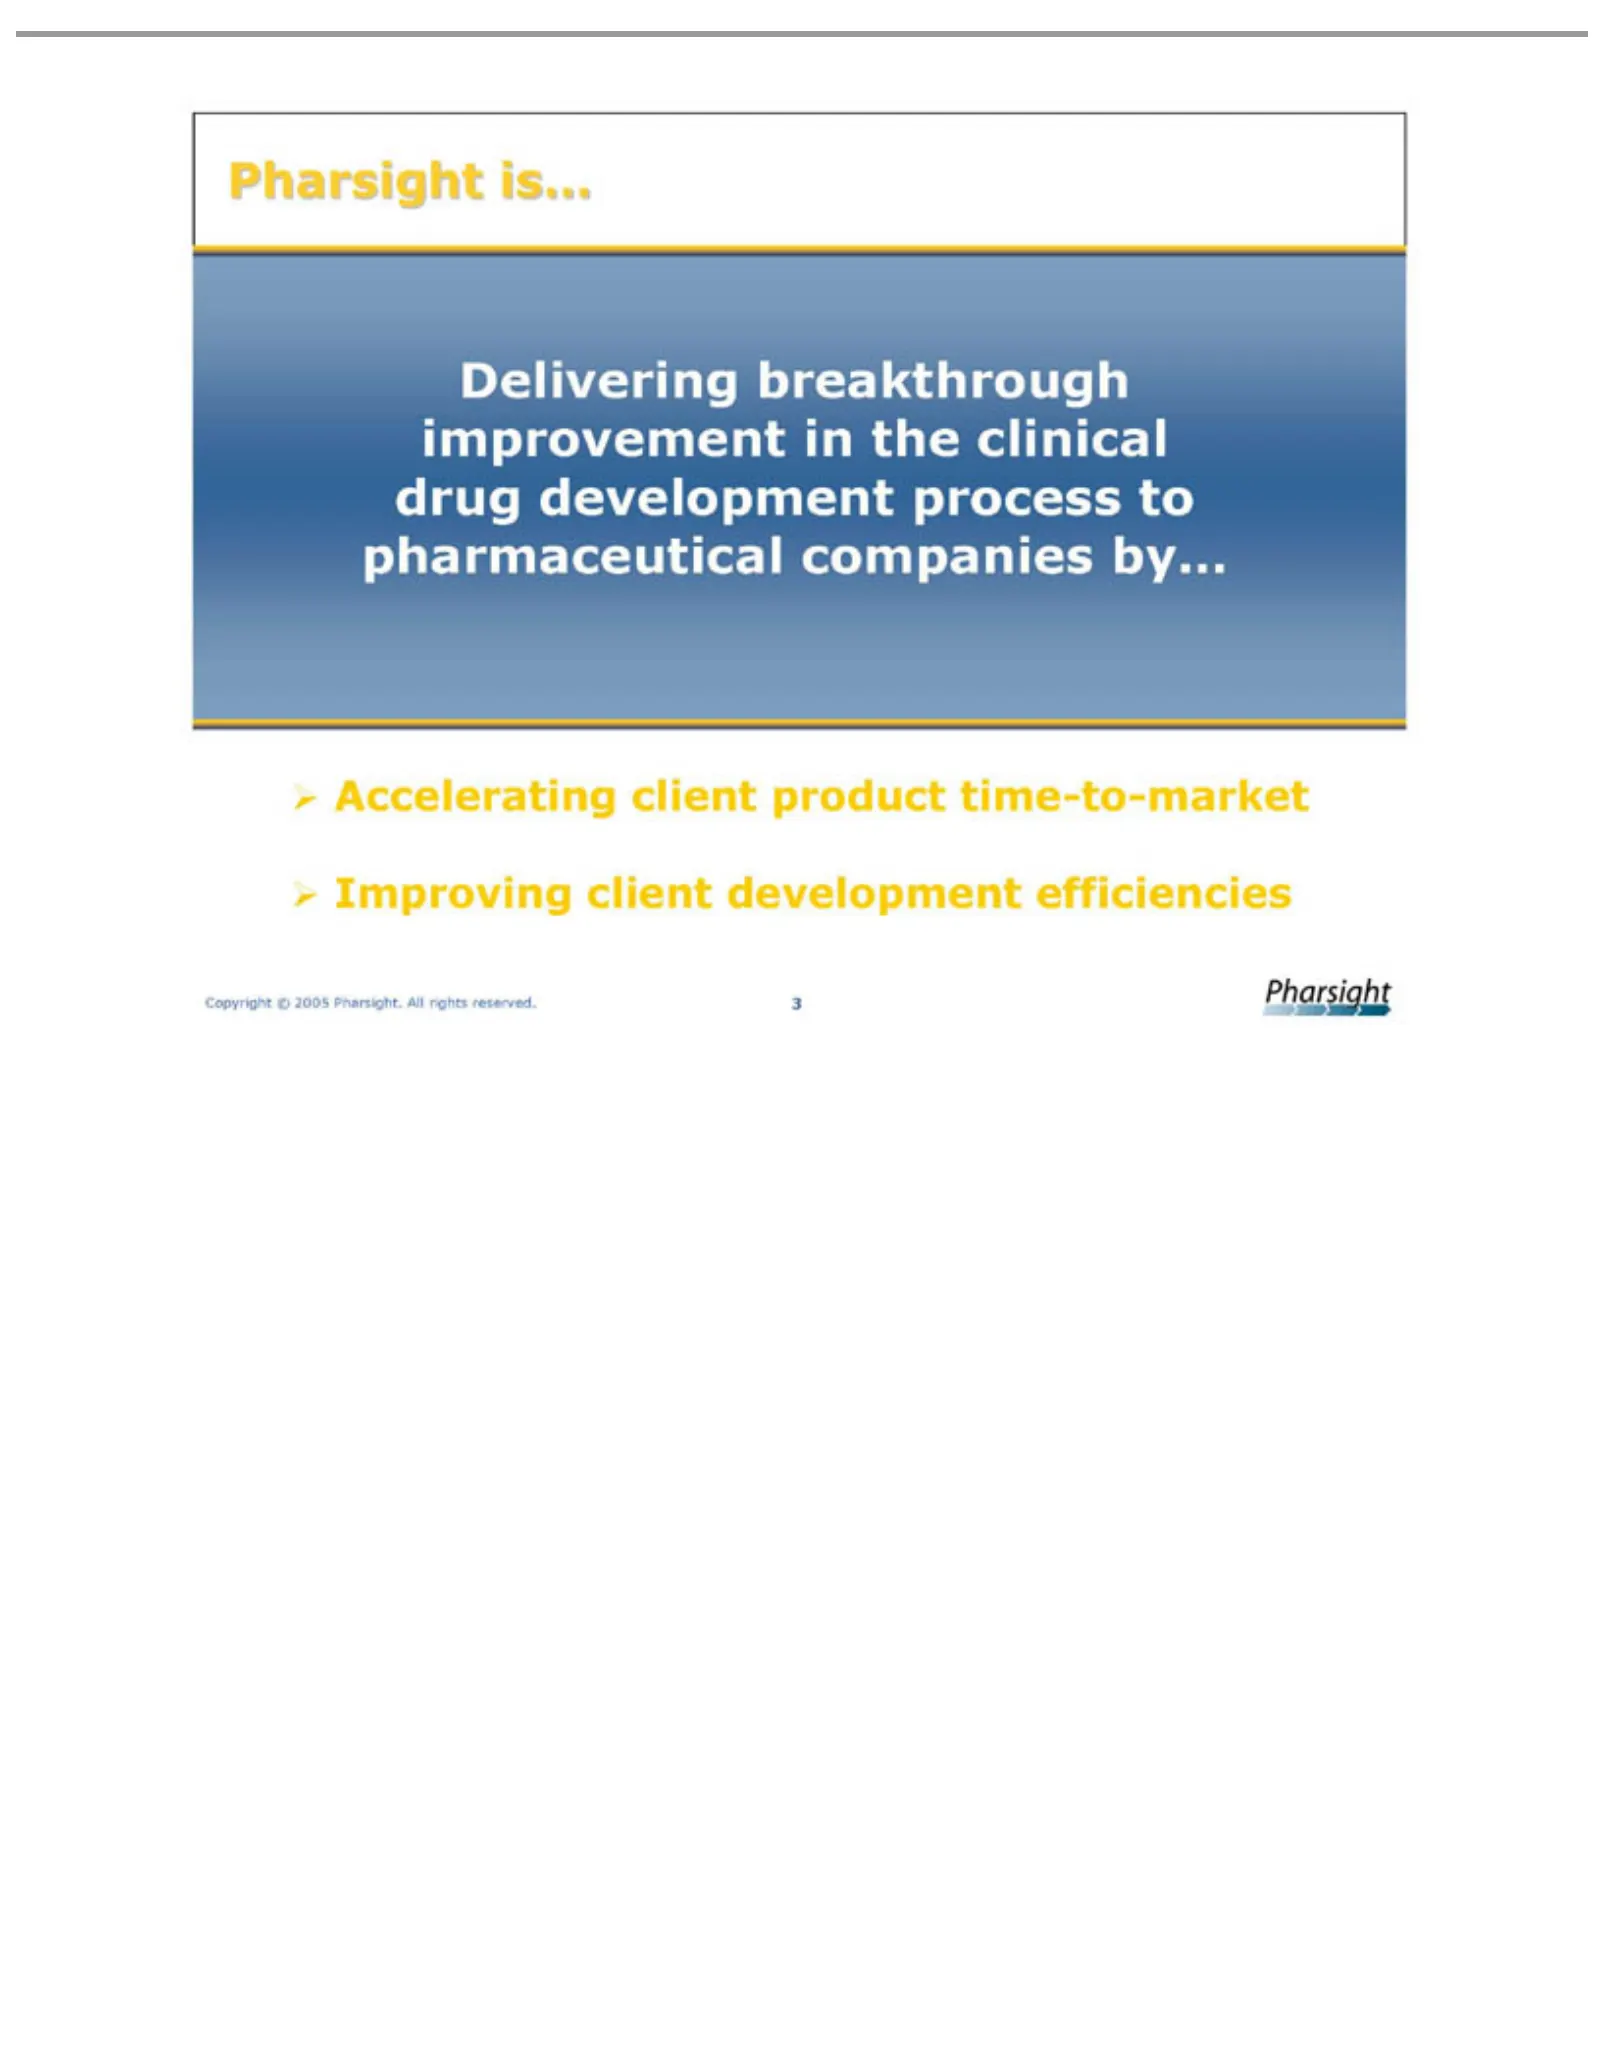
Slide 3: Pharsight is delivering breakthrough product improvement
Pharsight is… Delivering Accelerating Improving Copyright © client breakthrough 2005 client development Pharsight. product improvement time-to-market All efficiencies rights in reserved. the clinical 3 drug development process to pharmaceutical companies by…
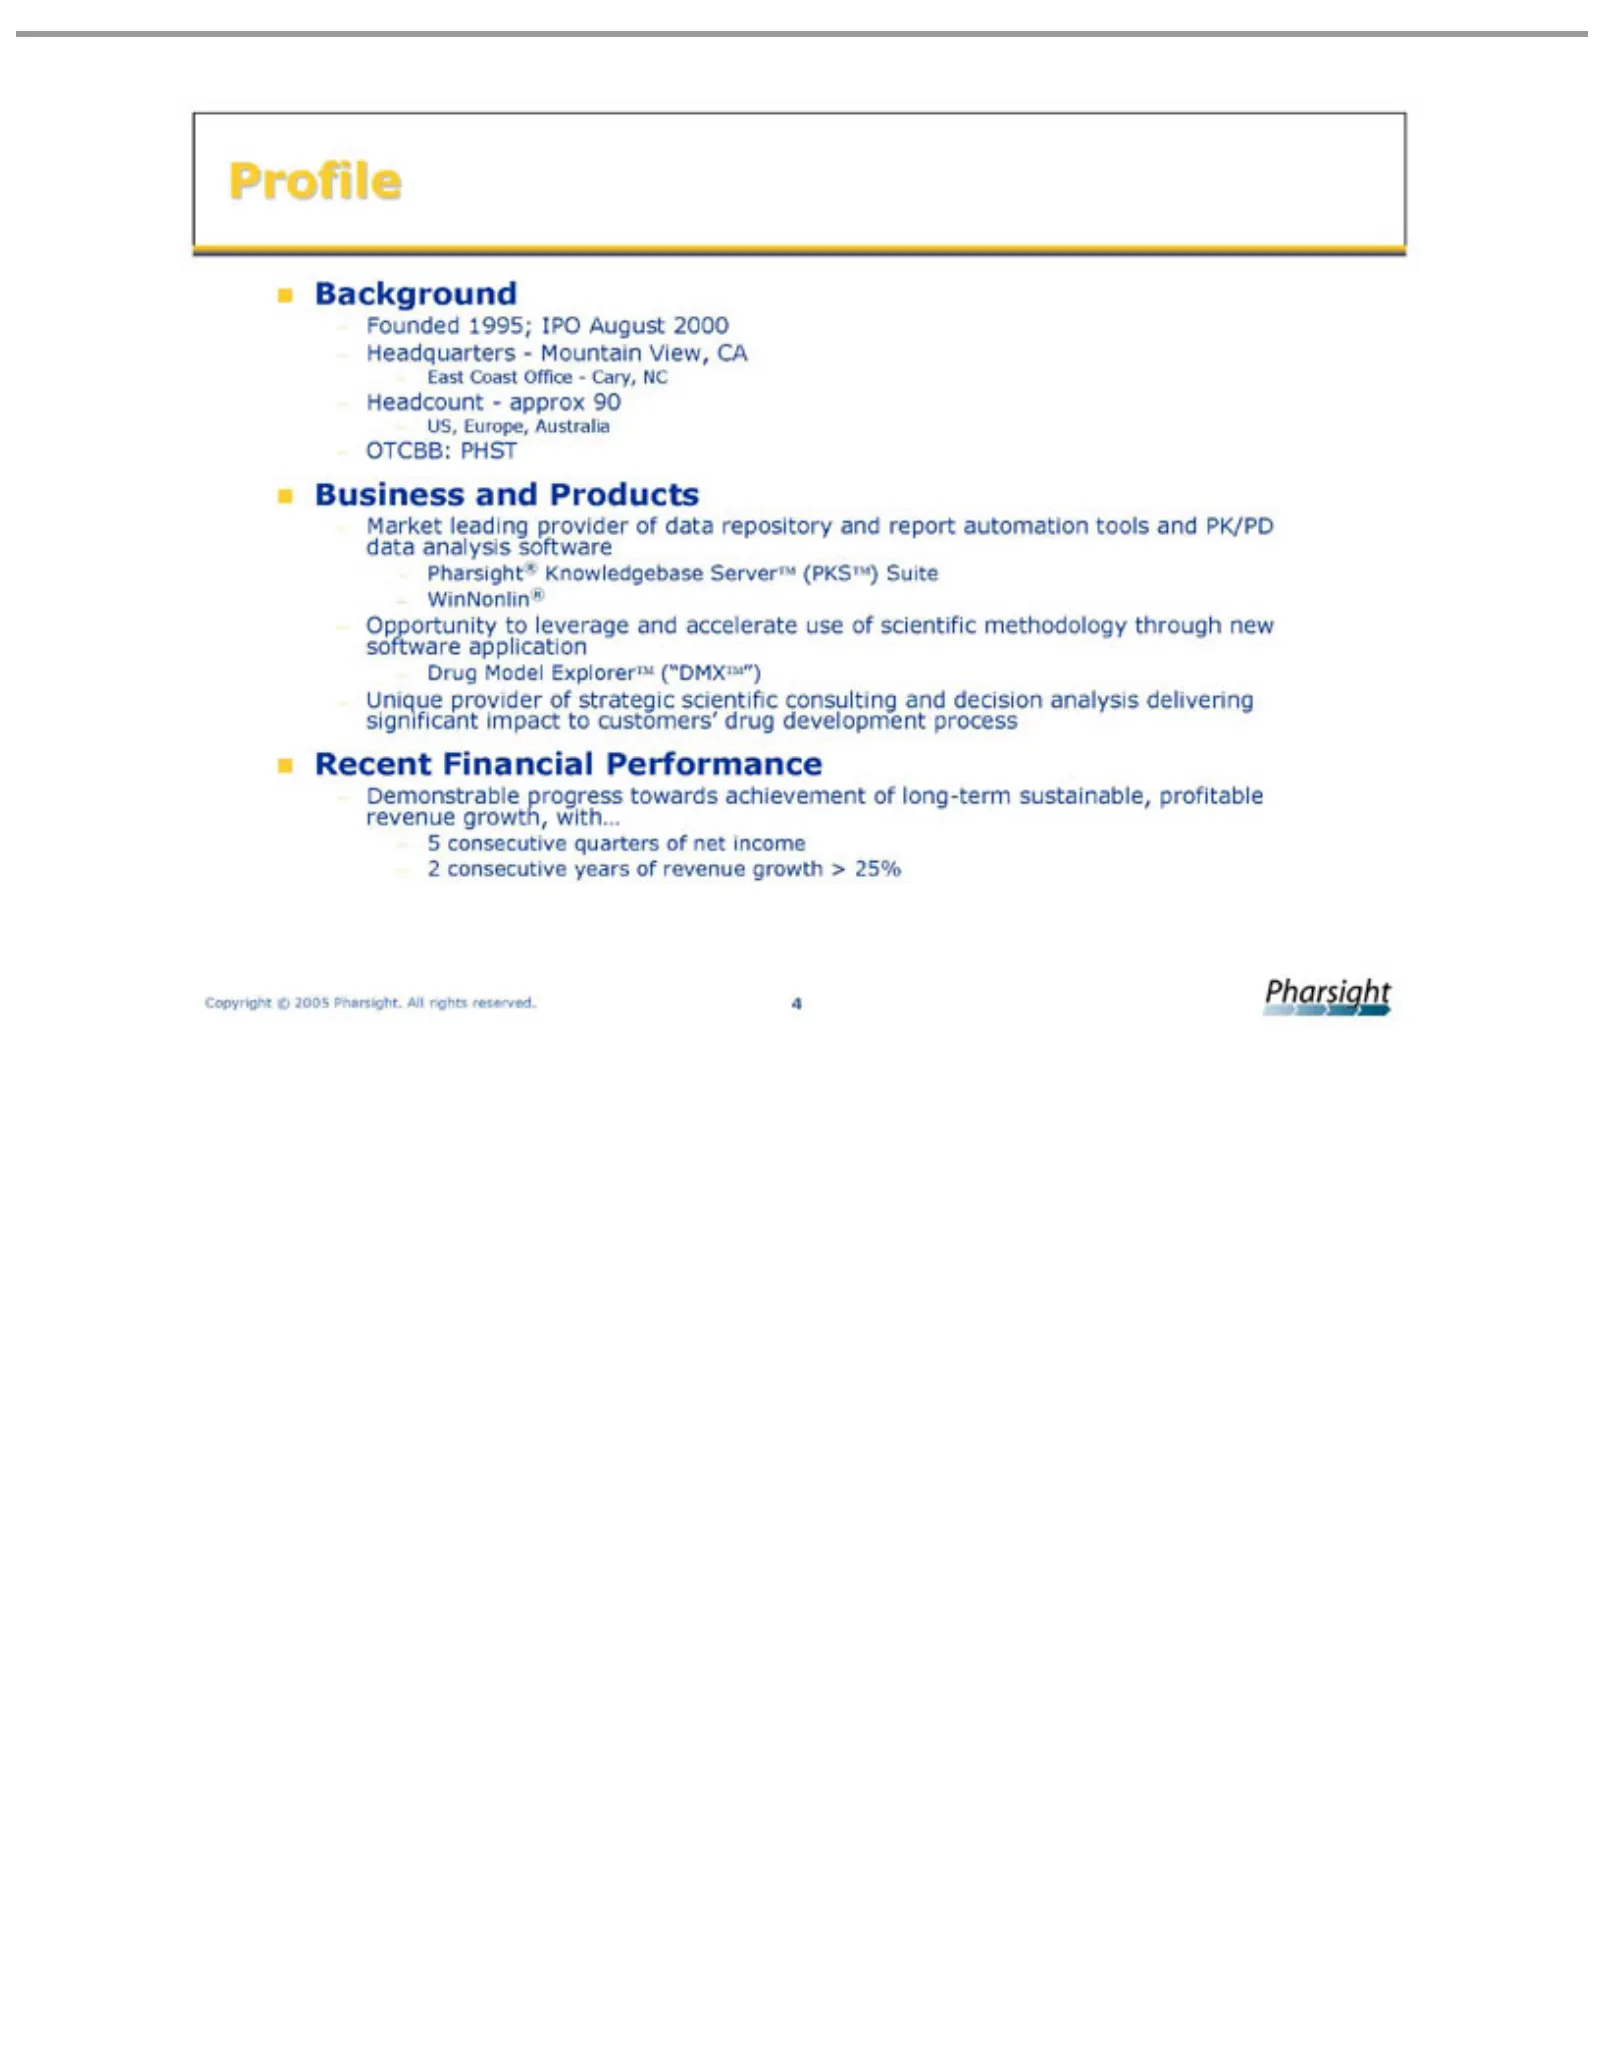
Slide 4: Company Profile
Founded Background Profile Headquarters East Headcount US, OTCBB: Business Market Pharsight® Opportunity WinNonlin® Drug Unique Recent Demonstrable 5 2 Copyright consecutive Europe, Coast Model Financial leading provider 1995; and PHST © Office -Knowledgebase Australia to approx ExplorerTM 2005 Prod
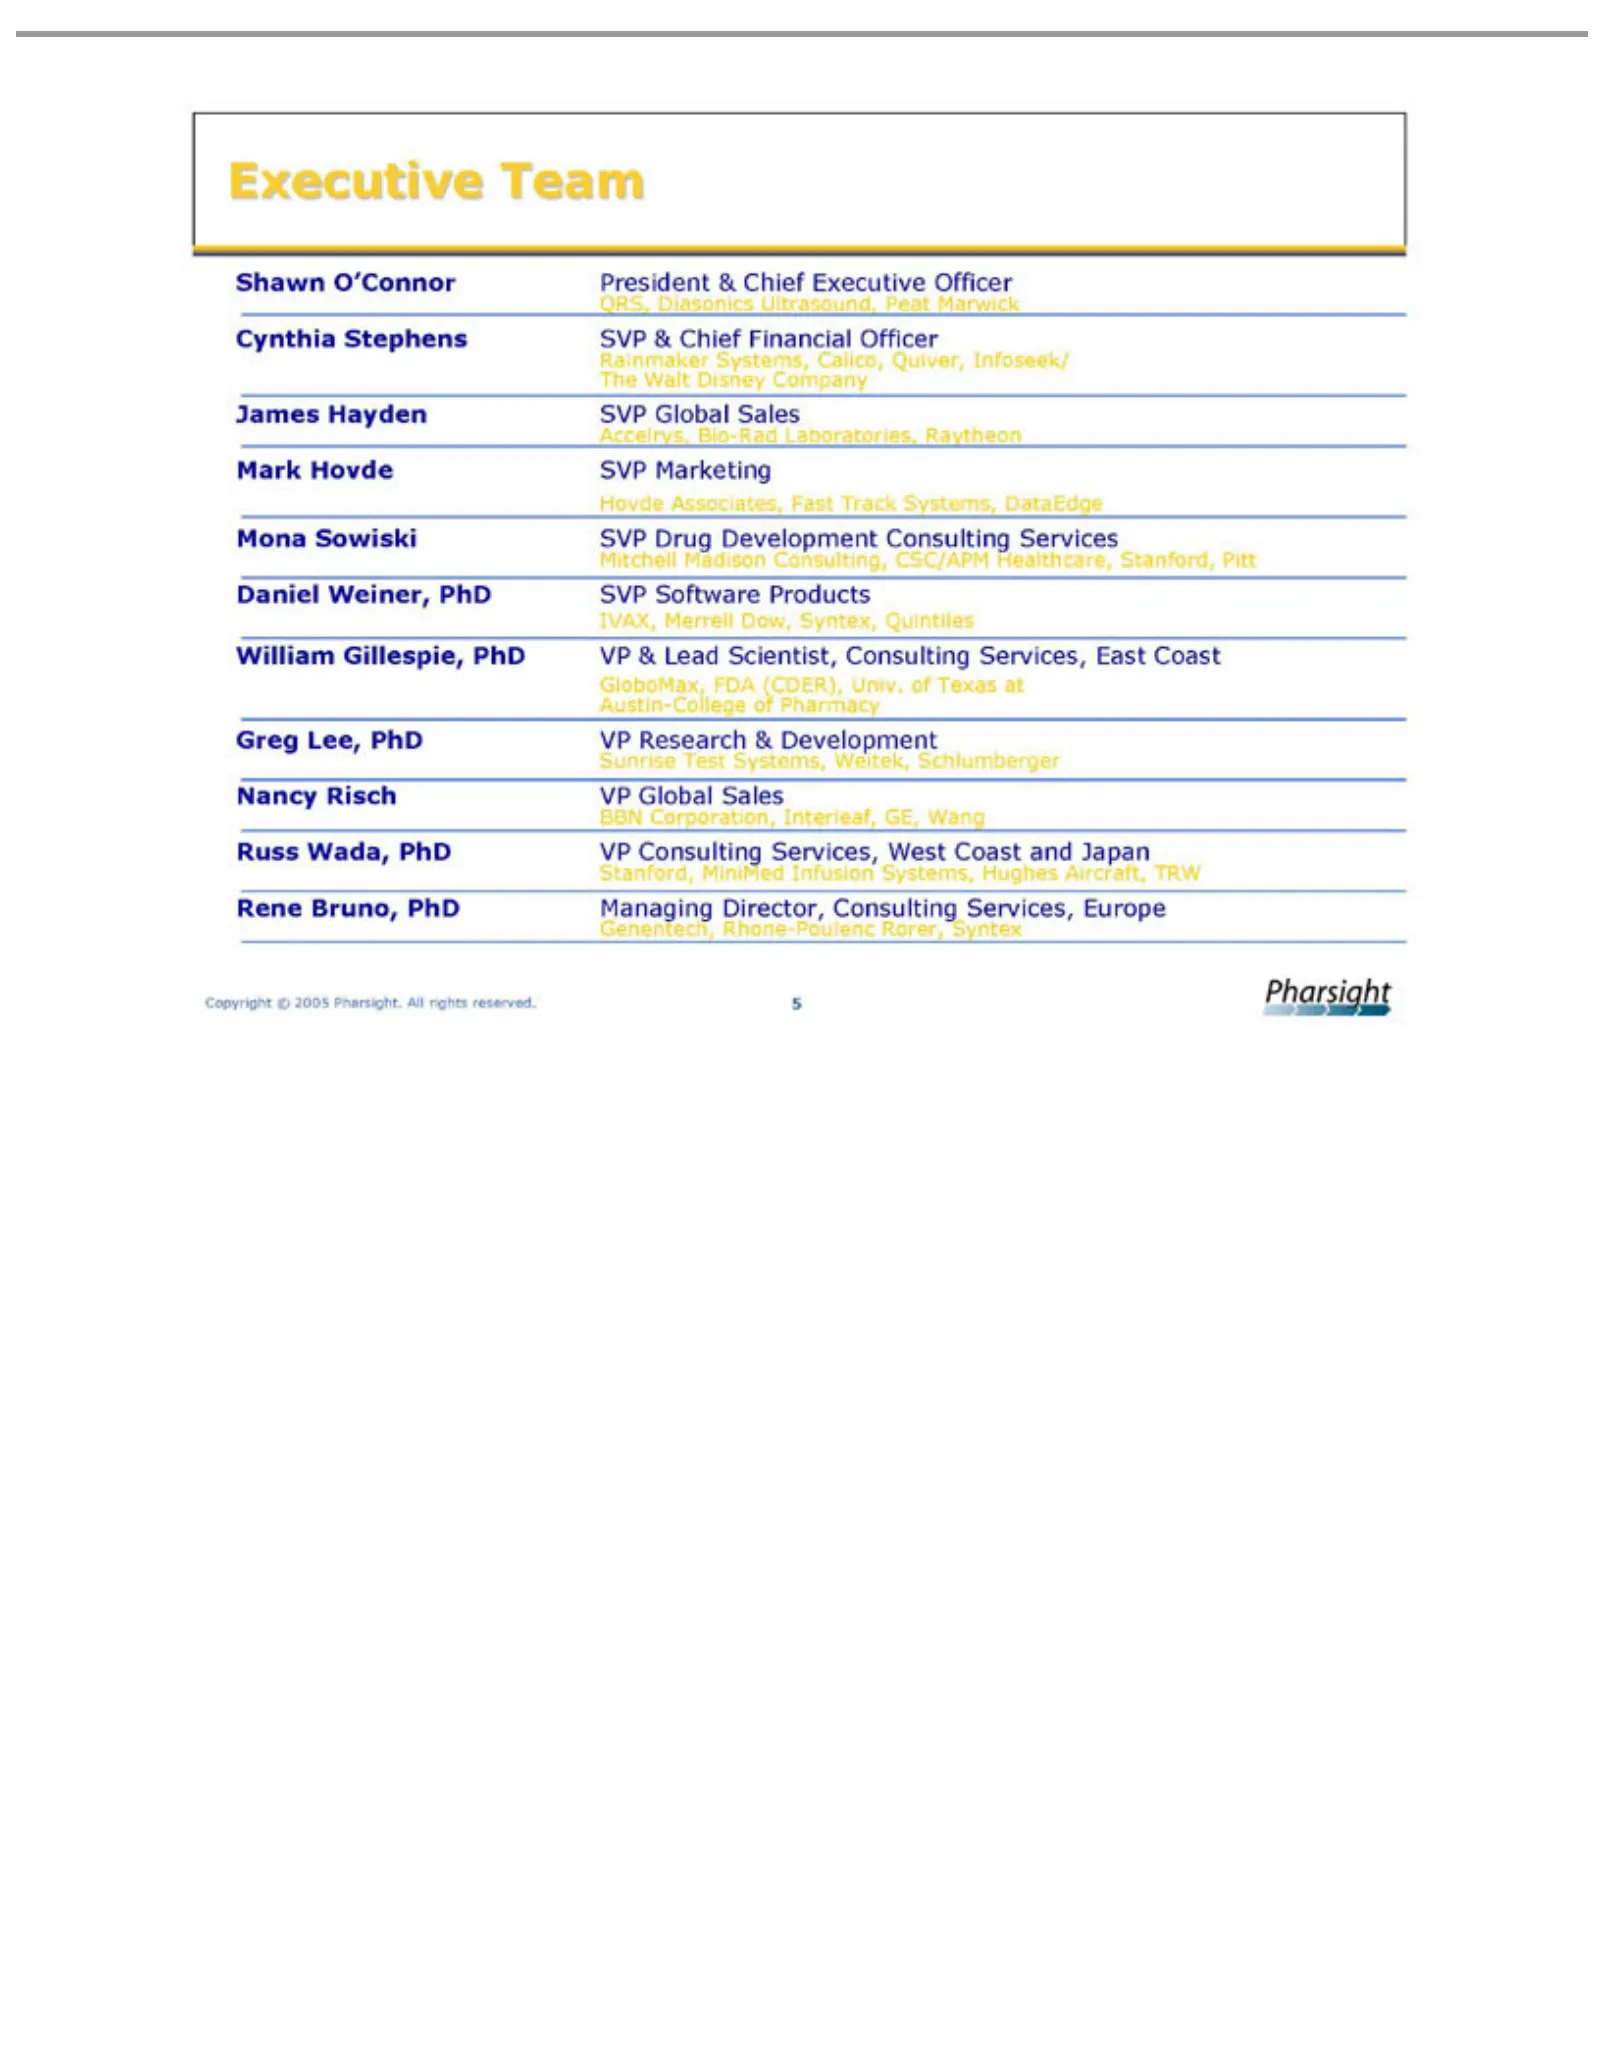
Slide 5: Executive Team
Executive Shawn QRS, Cynthia Rainmaker The James Accelrys, Mark Hovde Mona Mitchell Daniel IVAX, William GloboMax, Austin-College Greg Sunrise Nancy BBN Russ Stanford, Rene Genentech, Copyright Walt Wada, Lee, Bruno, Corporation, Hovde Diasonics Sowiski Hayden Risch Associates, Merrell Weiner, O’Con
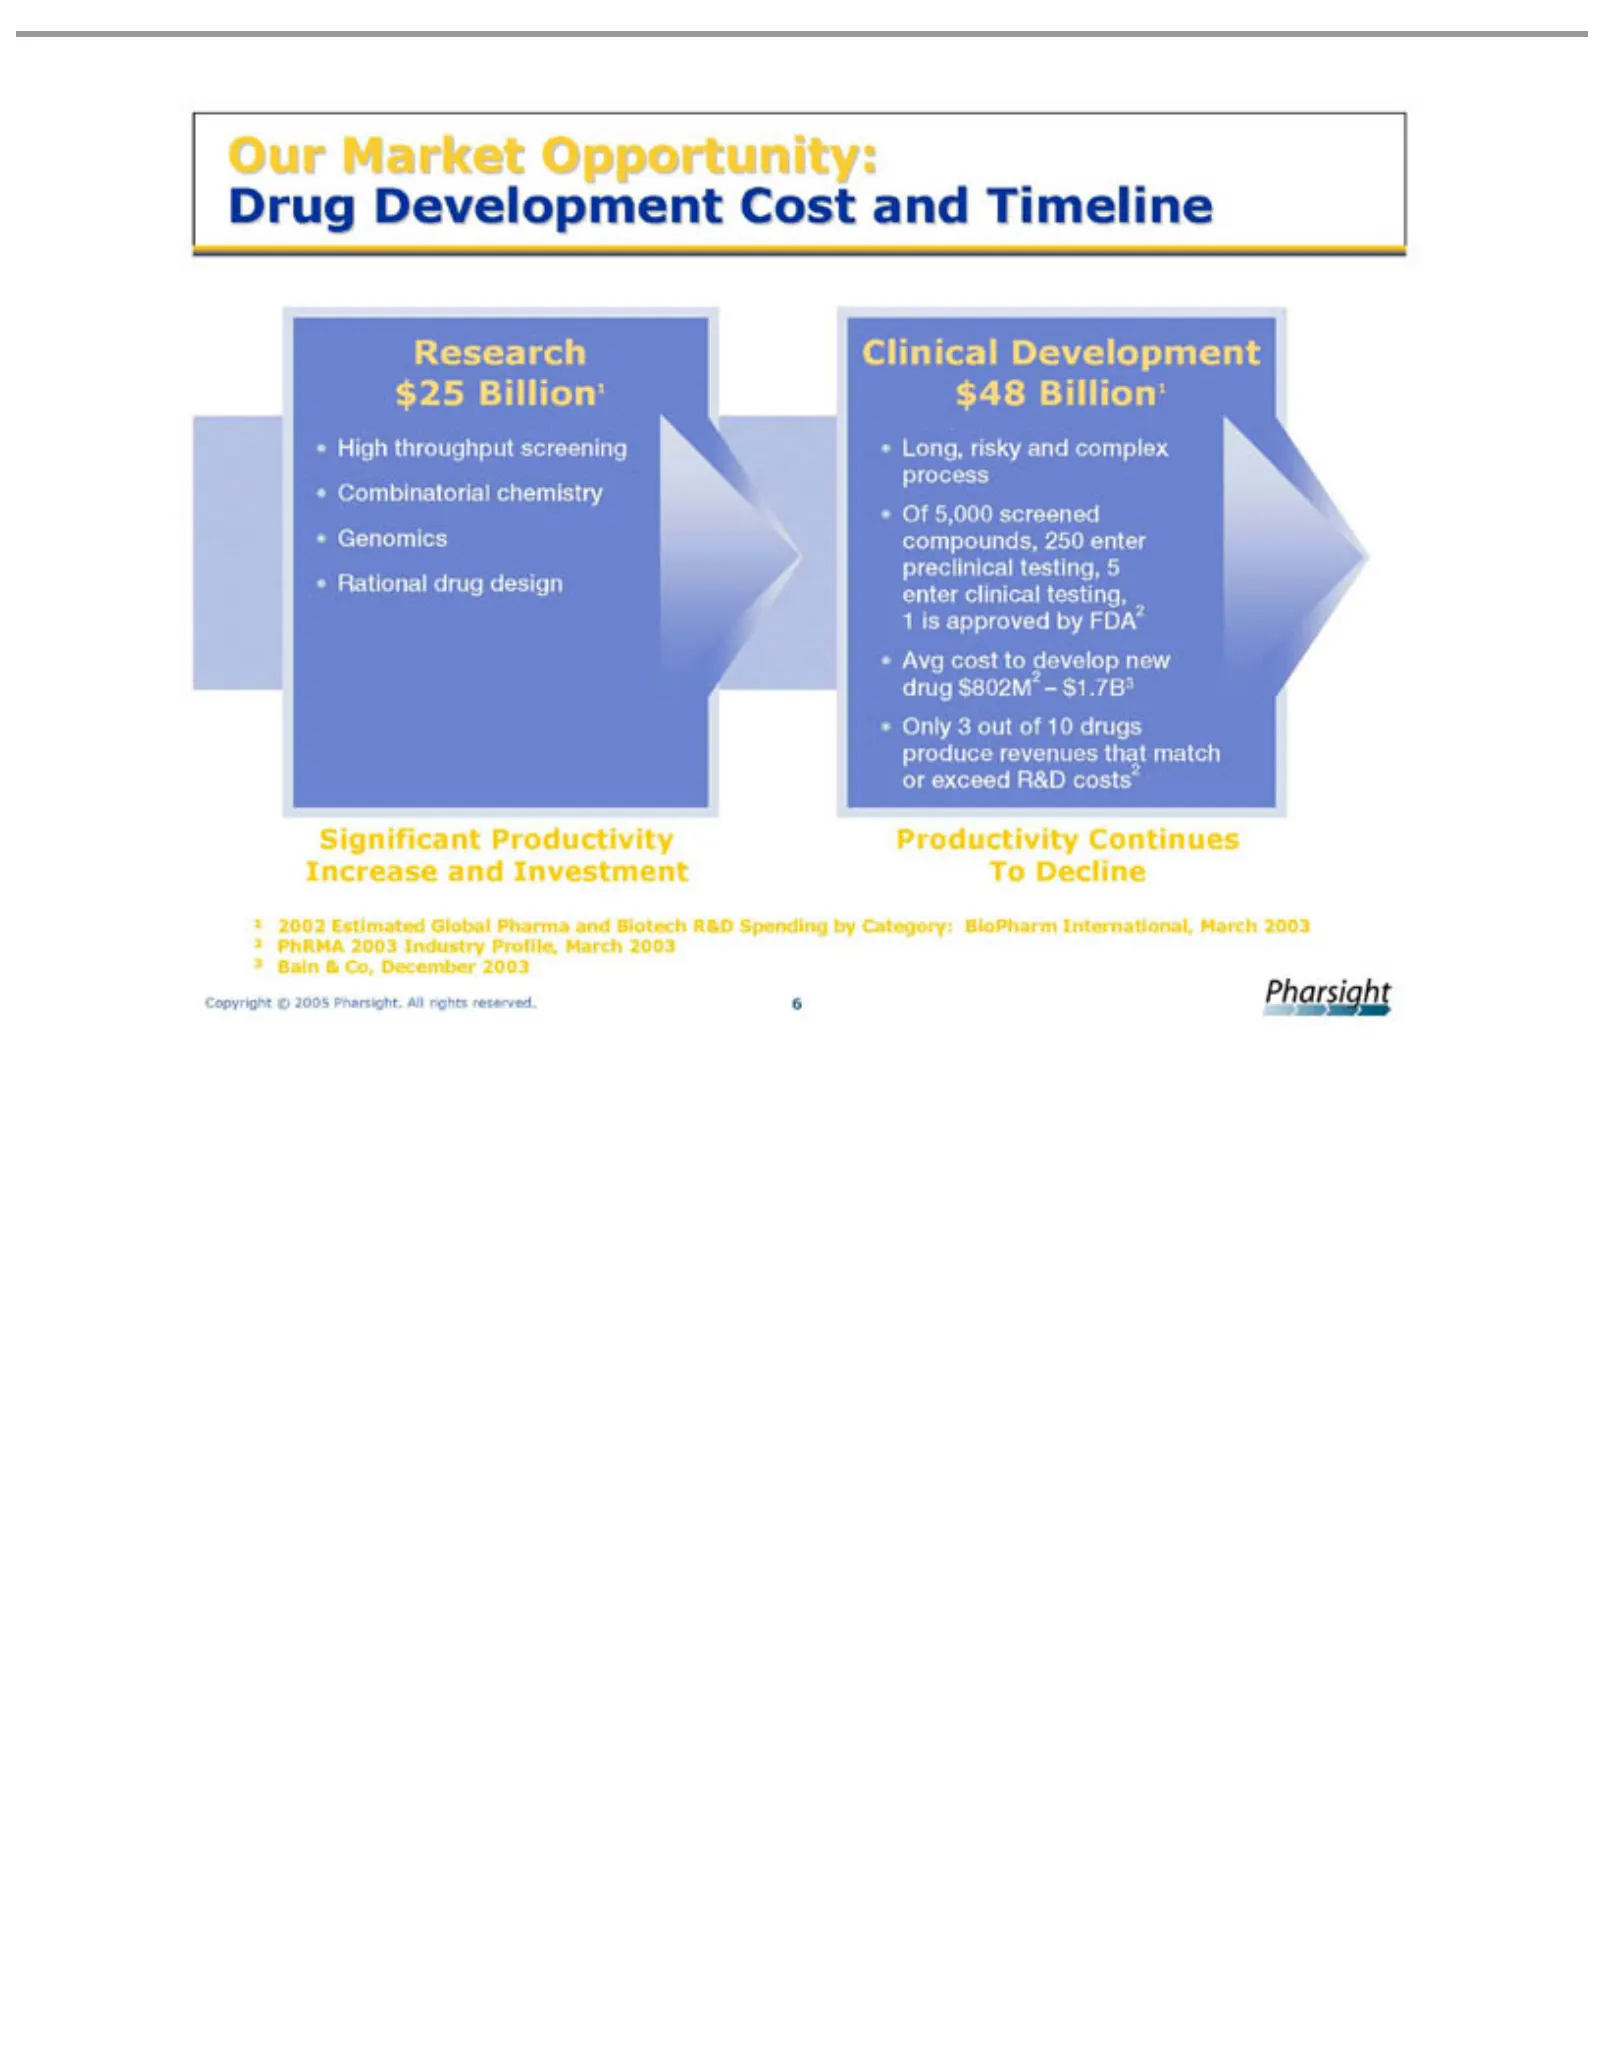
Slide 6: Our Market Opportunity: Drug development process is long, complex and risky
Our Drug Clinical $48 $25 Research High Combinatorial Rational Genomics Long, Of process enter Avg Only Significant Increase Productivity To 1 2 3 Copyright isDecline 2002 PhRMA Bain 5,000 approved Billion1 Market cost clinical 3throughput Development risky & out Estimated Development and drug to sc
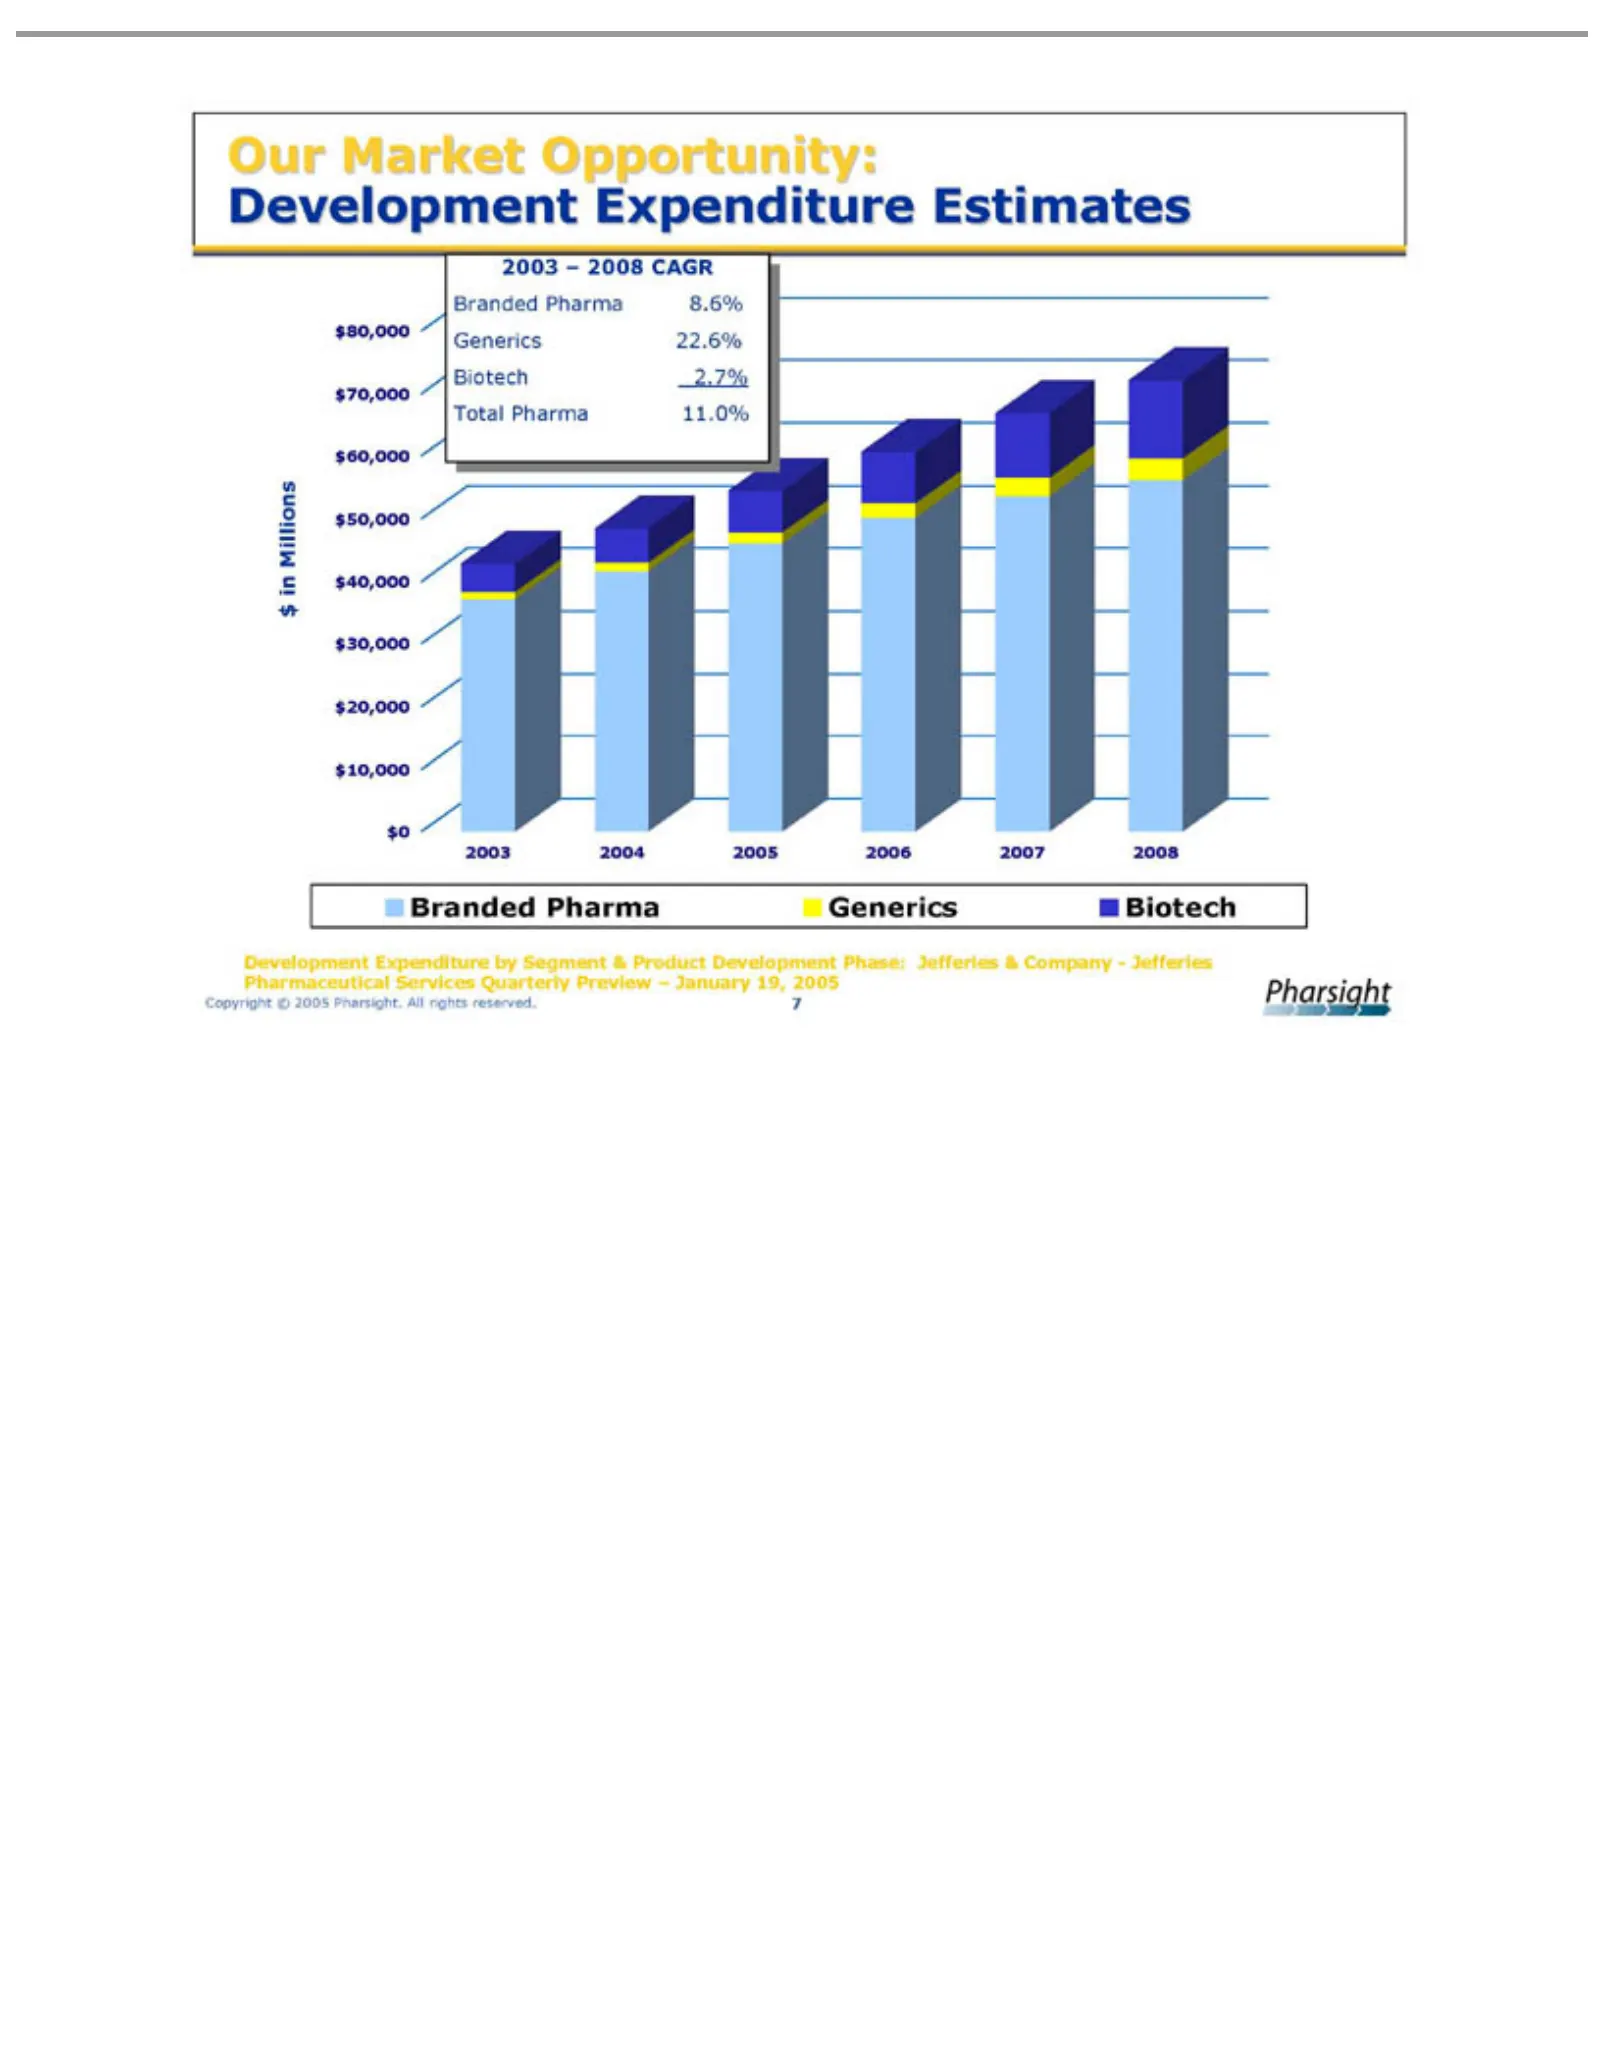
Slide 7: Our Market Opportunity: Total Development Expenditure
Our Total $ $50,000 $60,000 $70,000 $80,000 Branded Generics Biotech 2008 2003 2004 2005 2006 2007 $0 $10,000 $20,000 $30,000 $40,000 Development Copyright in Millions Market –Pharma 2008 2.7% Pharma 22.6% ©Opportunity: CAGR 2005 11.0% Expenditure 8.6% Pharsight. Estimates by All Segment rights & re
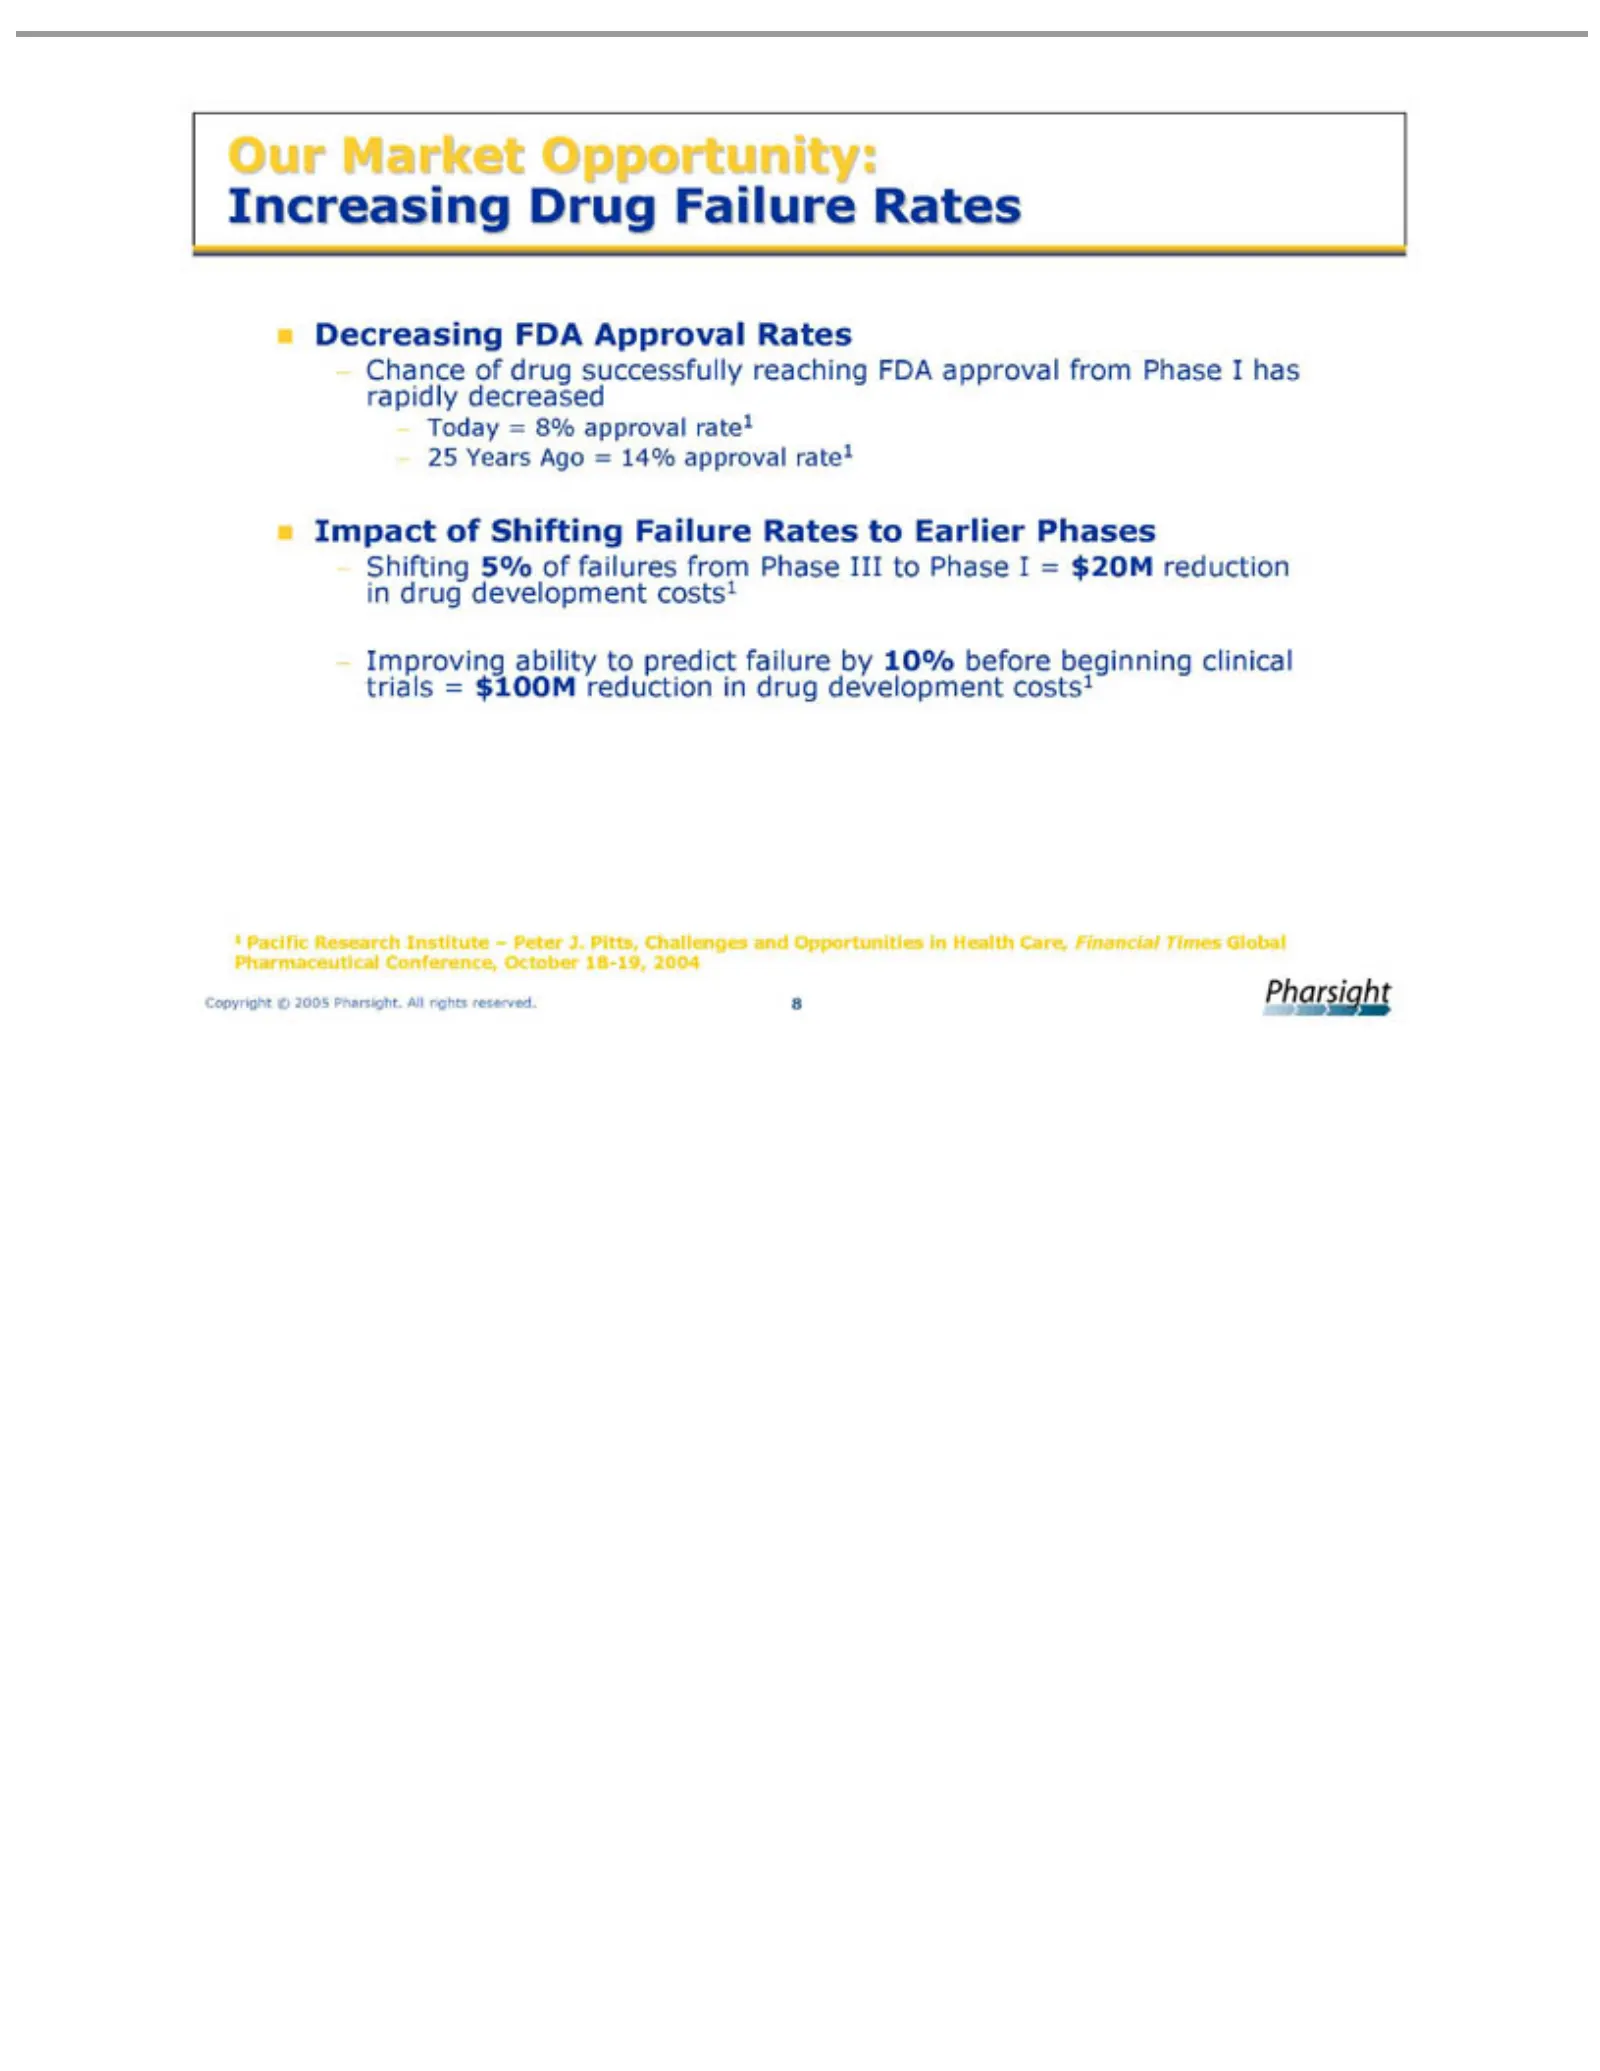
Slide 8: Our Market Opportunity: Shifting Failure Rates
Our Increasing Decreasing Chance Today 25 Impact Shifting Improving 1 Copyright Pacific Years Market =of of 5% 8% Ago Research Shifting © drug Drug ability FDA Opportunity: of approval 2005 =failures successfully 14% Failure Approval toPharsight. Failure Institute predict approval rate1 from Rates R
Slide 9: Pharsight Software Products
Pharsight Software Products
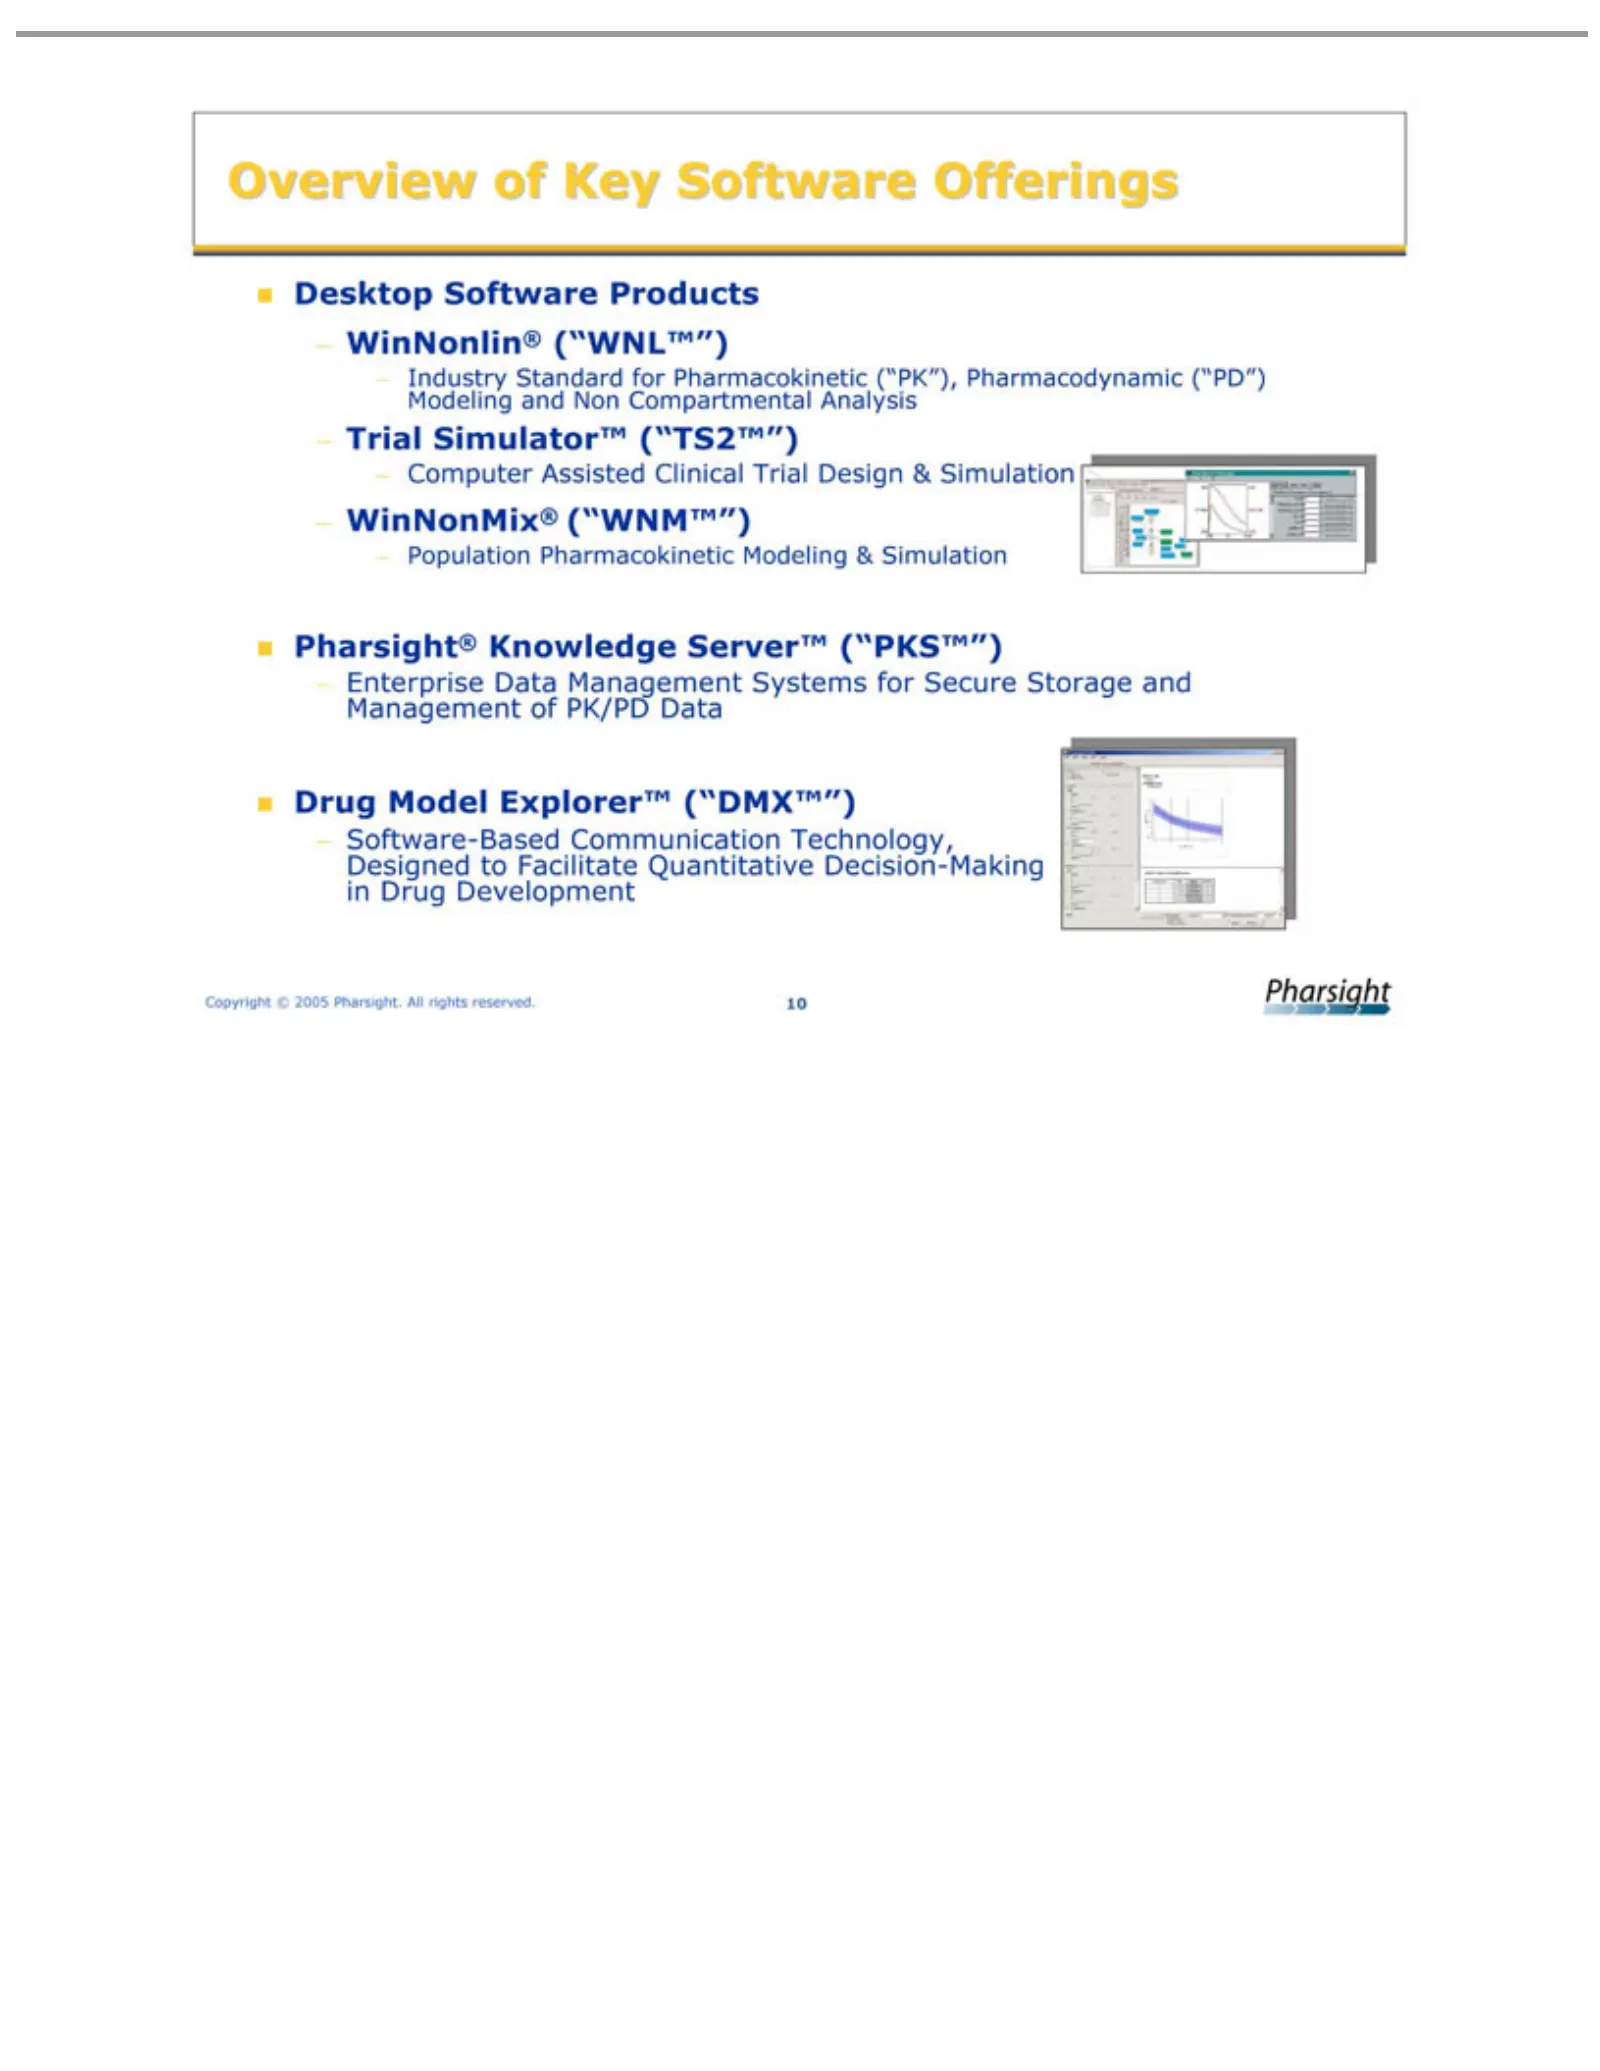
Slide 10: Software Products Overview
Overview Desktop WinNonlin® Industry Trial Computer WinNonMix® Population Pharsight® Enterprise Drug Software-Based Copyright Simulator™ Model Standard Software of Assisted © Data Pharmacokinetic Knowledge Explorer™ Key 2005 (“WNL™”) (“WNM™”) Management Communication Software (“TS2™”) for Products P
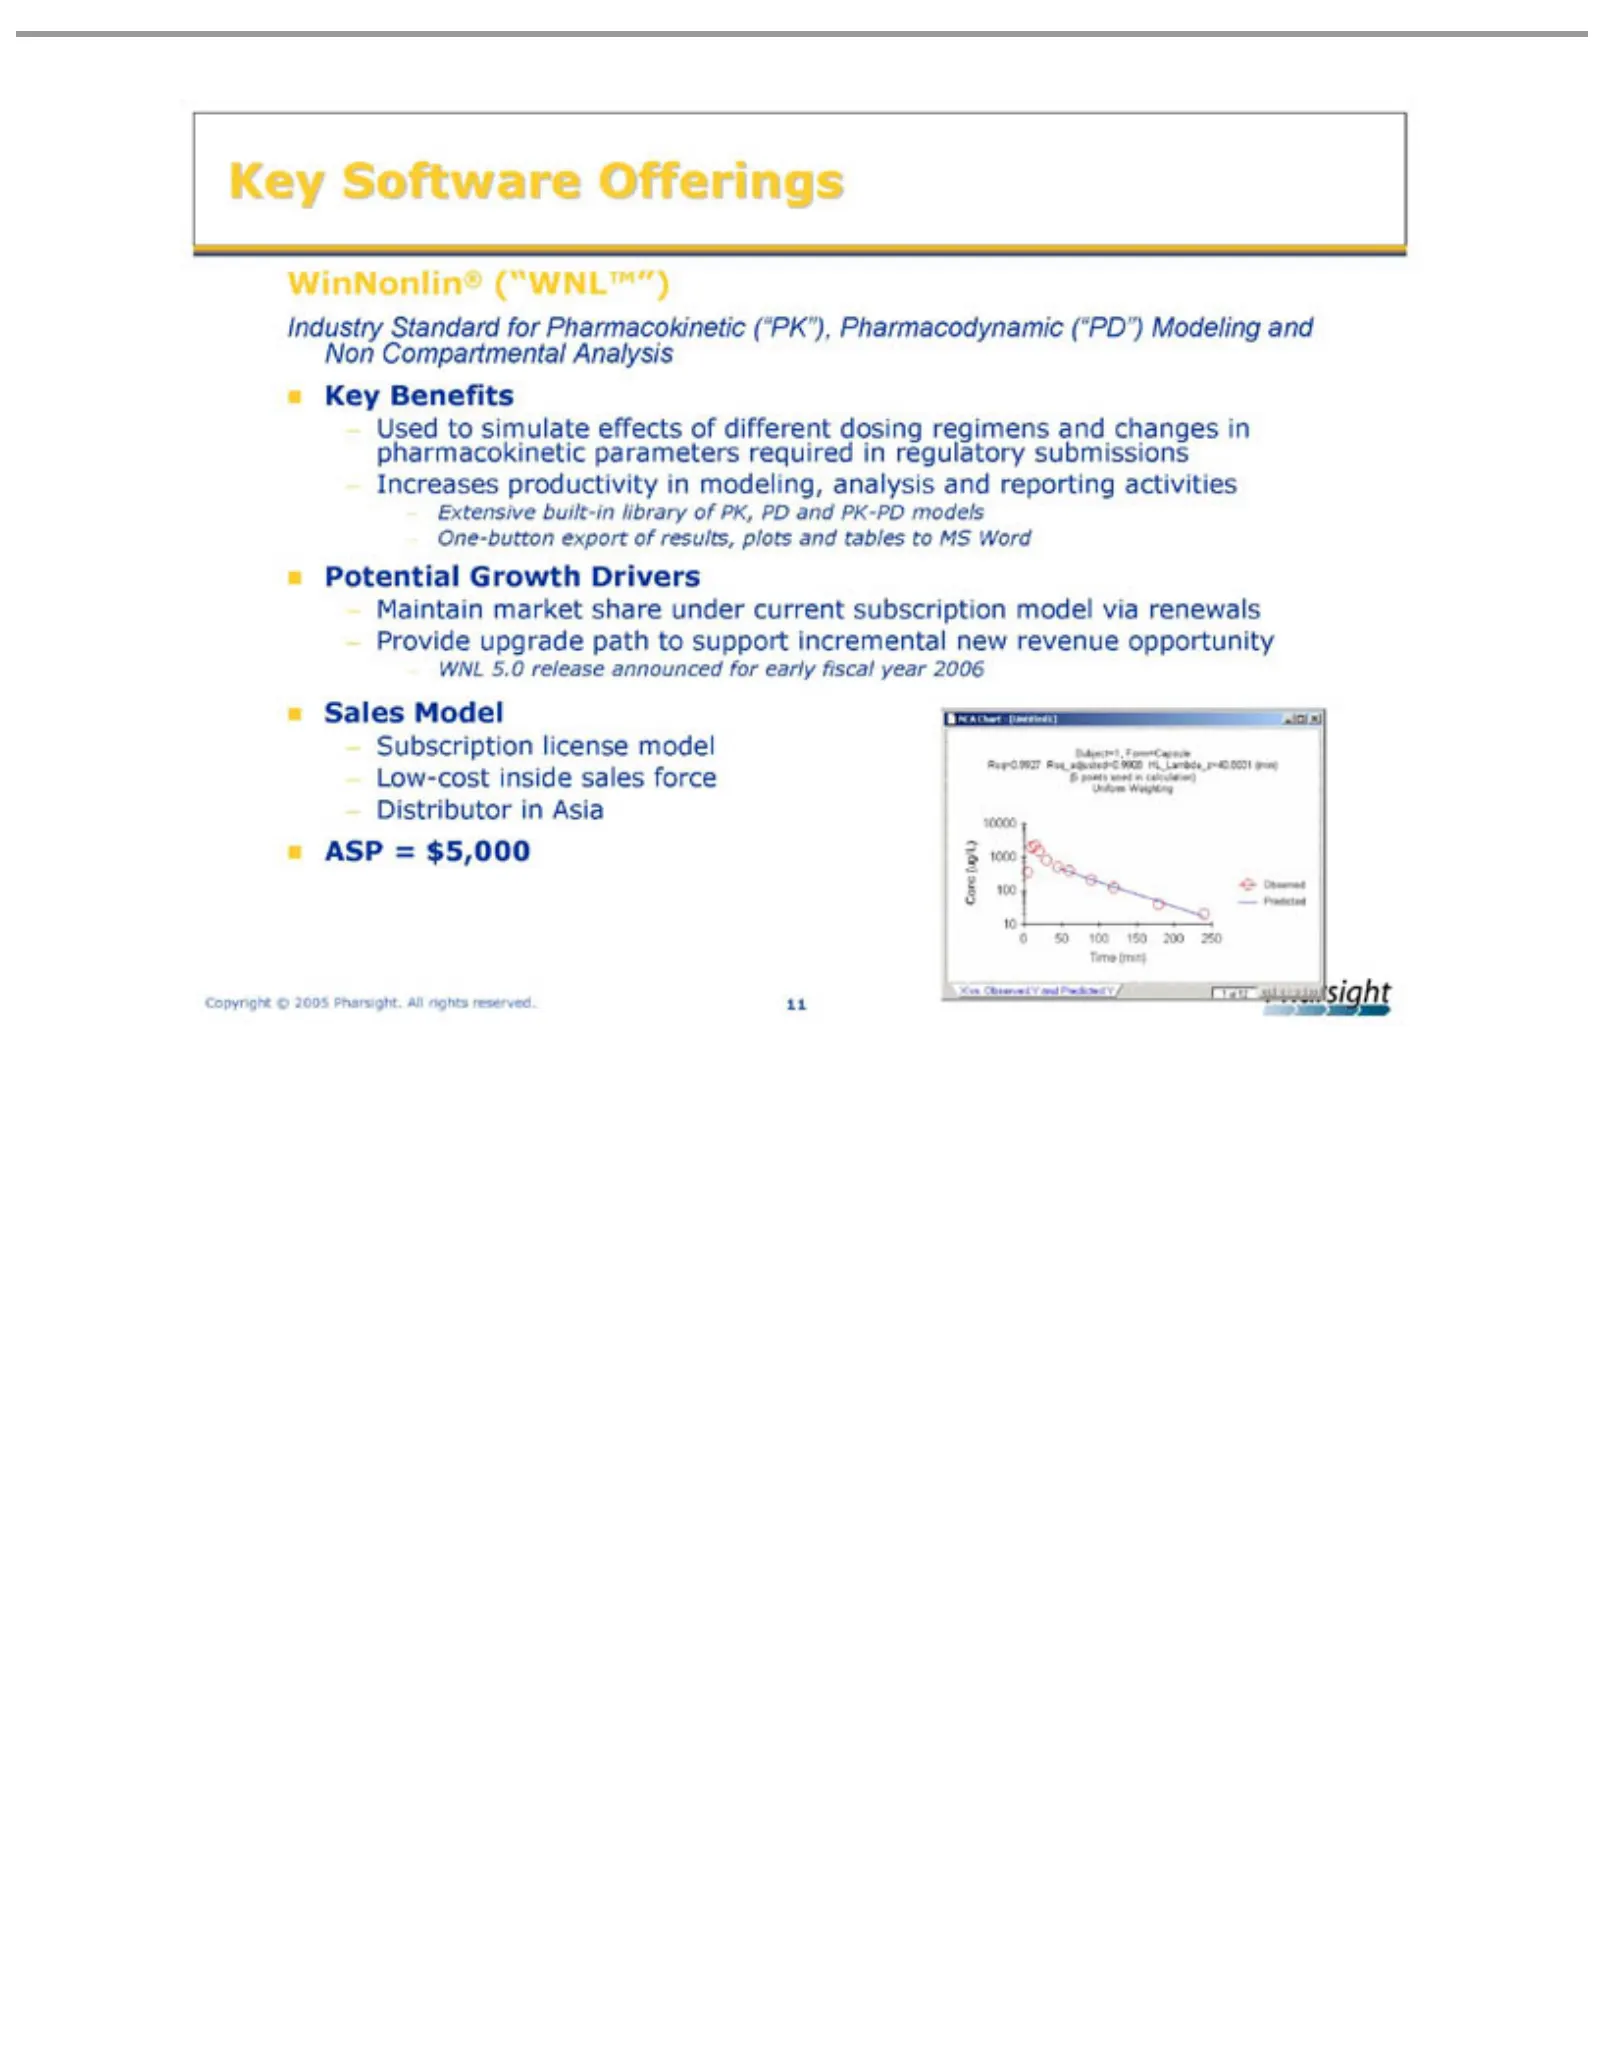
Slide 11: WinNonlin
WinNonlin® Industry Key Used Increases Extensive One-button Potential Maintain Provide WNL Sales Subscription Low-cost Distributor ASP Copyright Software Benefits =to Model 5.0 $5,000 simulate upgrade Standard Growth market productivity release inside built-in ©in export license 2005 (“WNL™”) Asia O
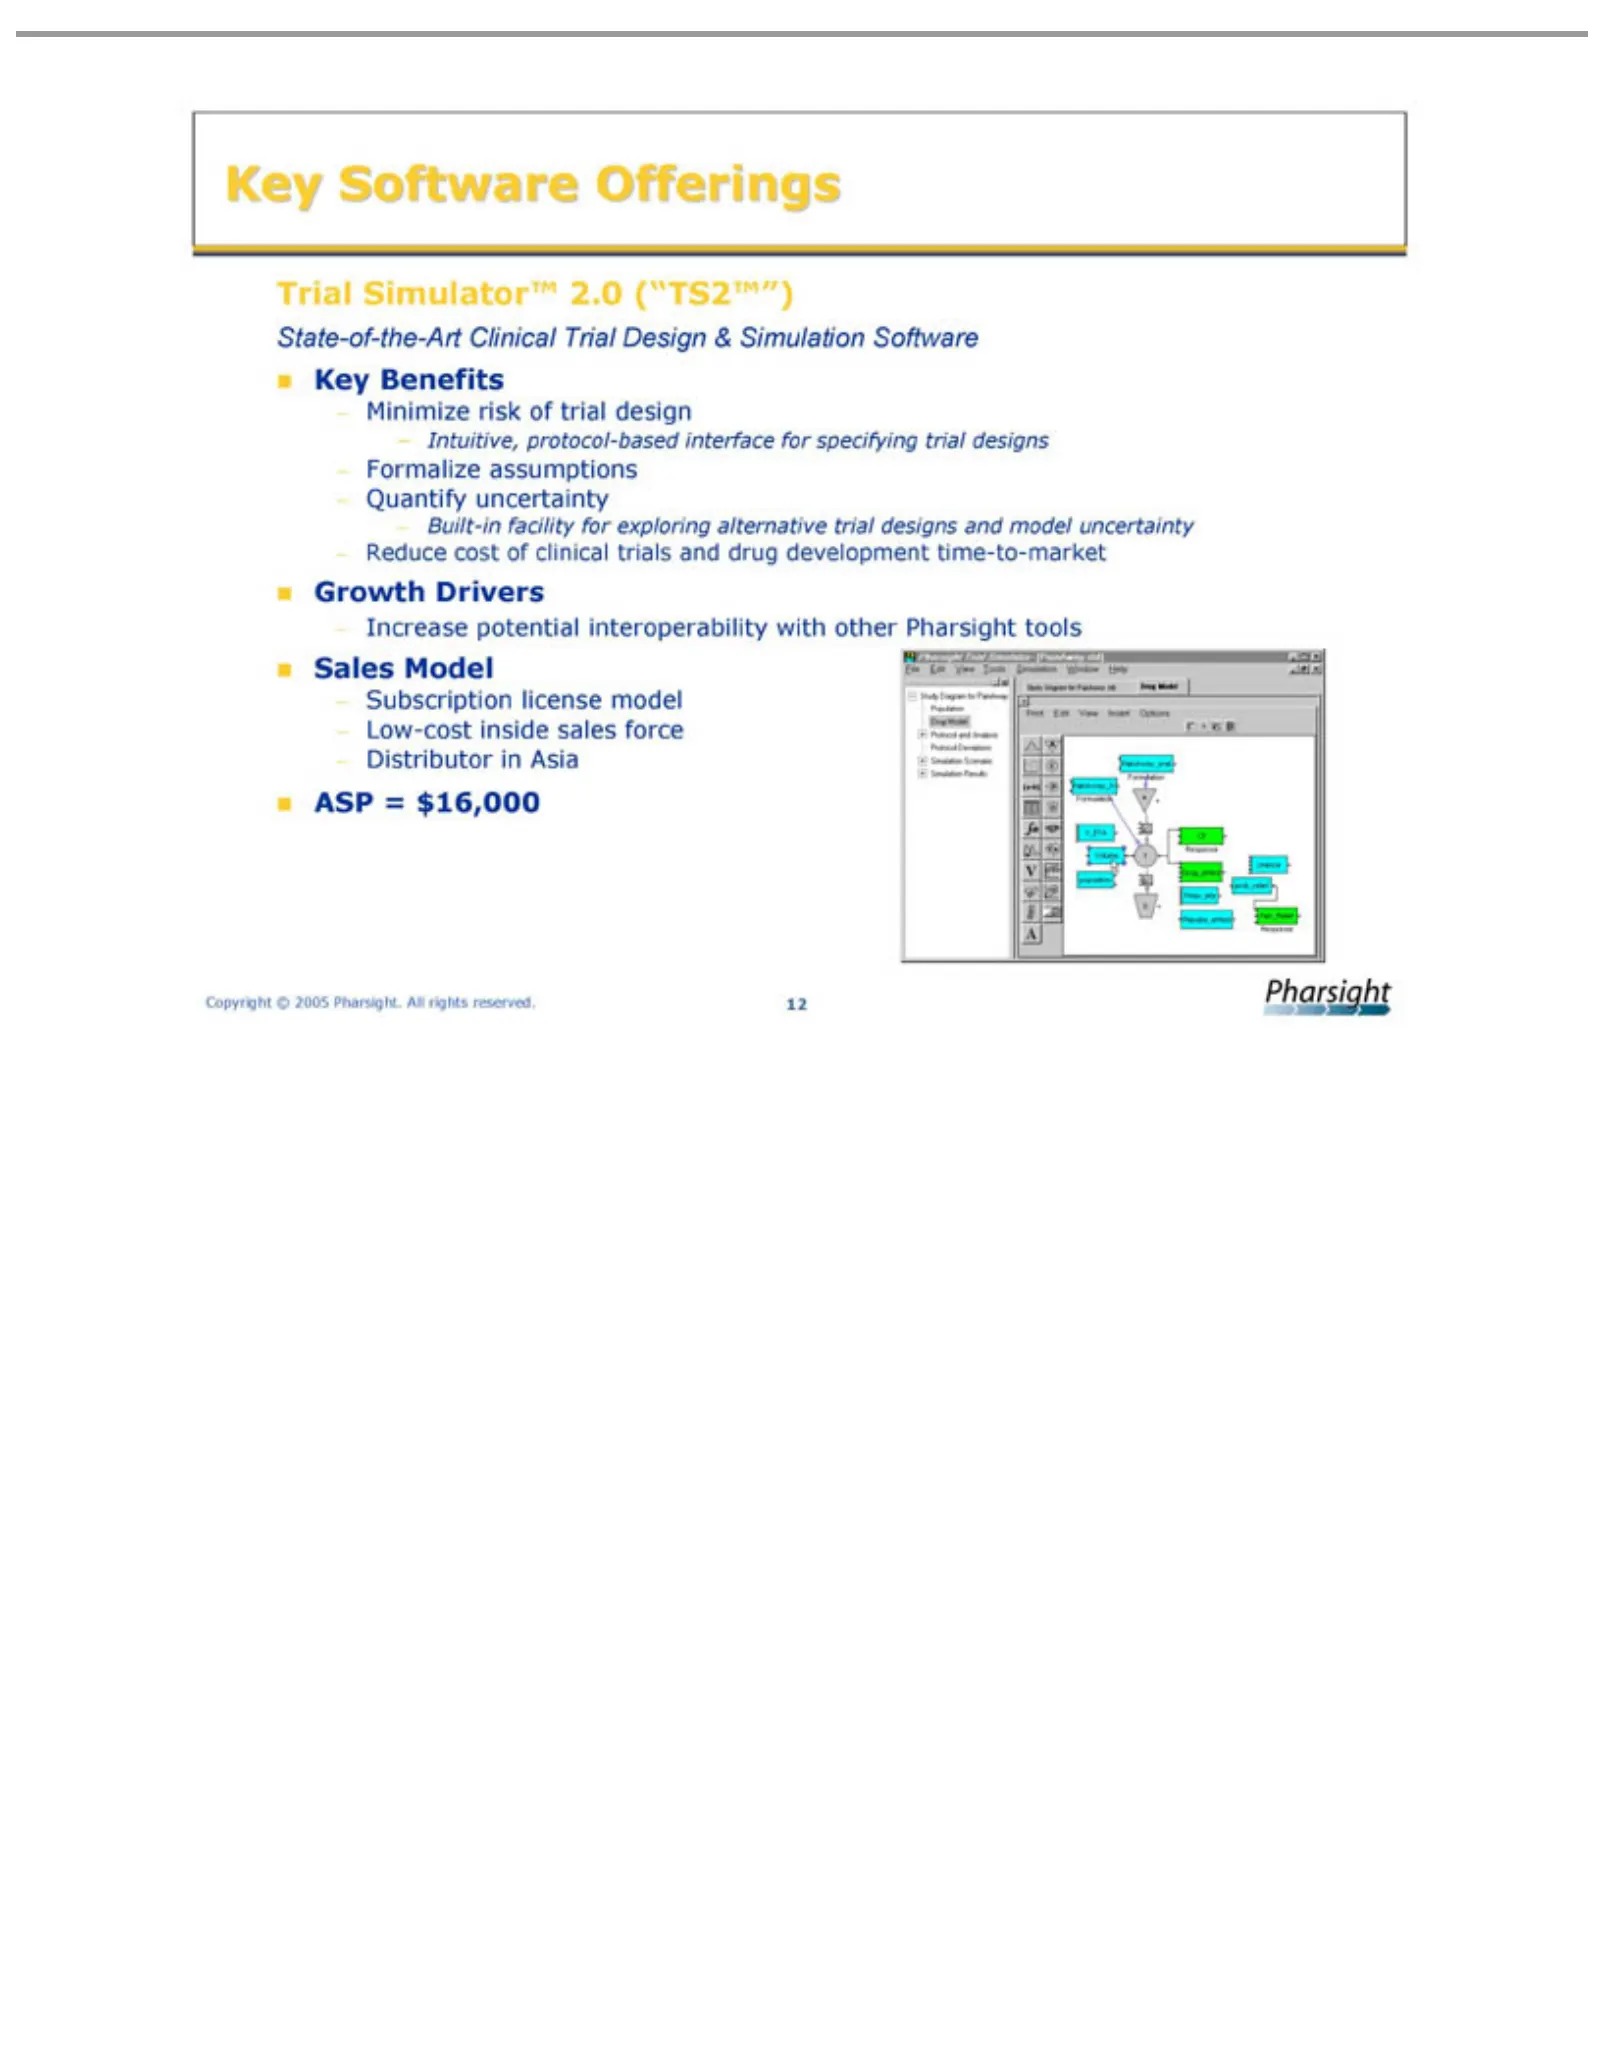
Slide 12: Trial Simulator
TrialBenefits State-of-the-Art Key Minimize Intuitive, Formalize Quantify Built-in Reduce Growth Increase Sales Subscription Low-cost Distributor ASP Copyright Software =Simulator™ Model $16,000 cost Drivers facility potential uncertainty protocol-based inside risk assumptions ©inof license 2005 Asi
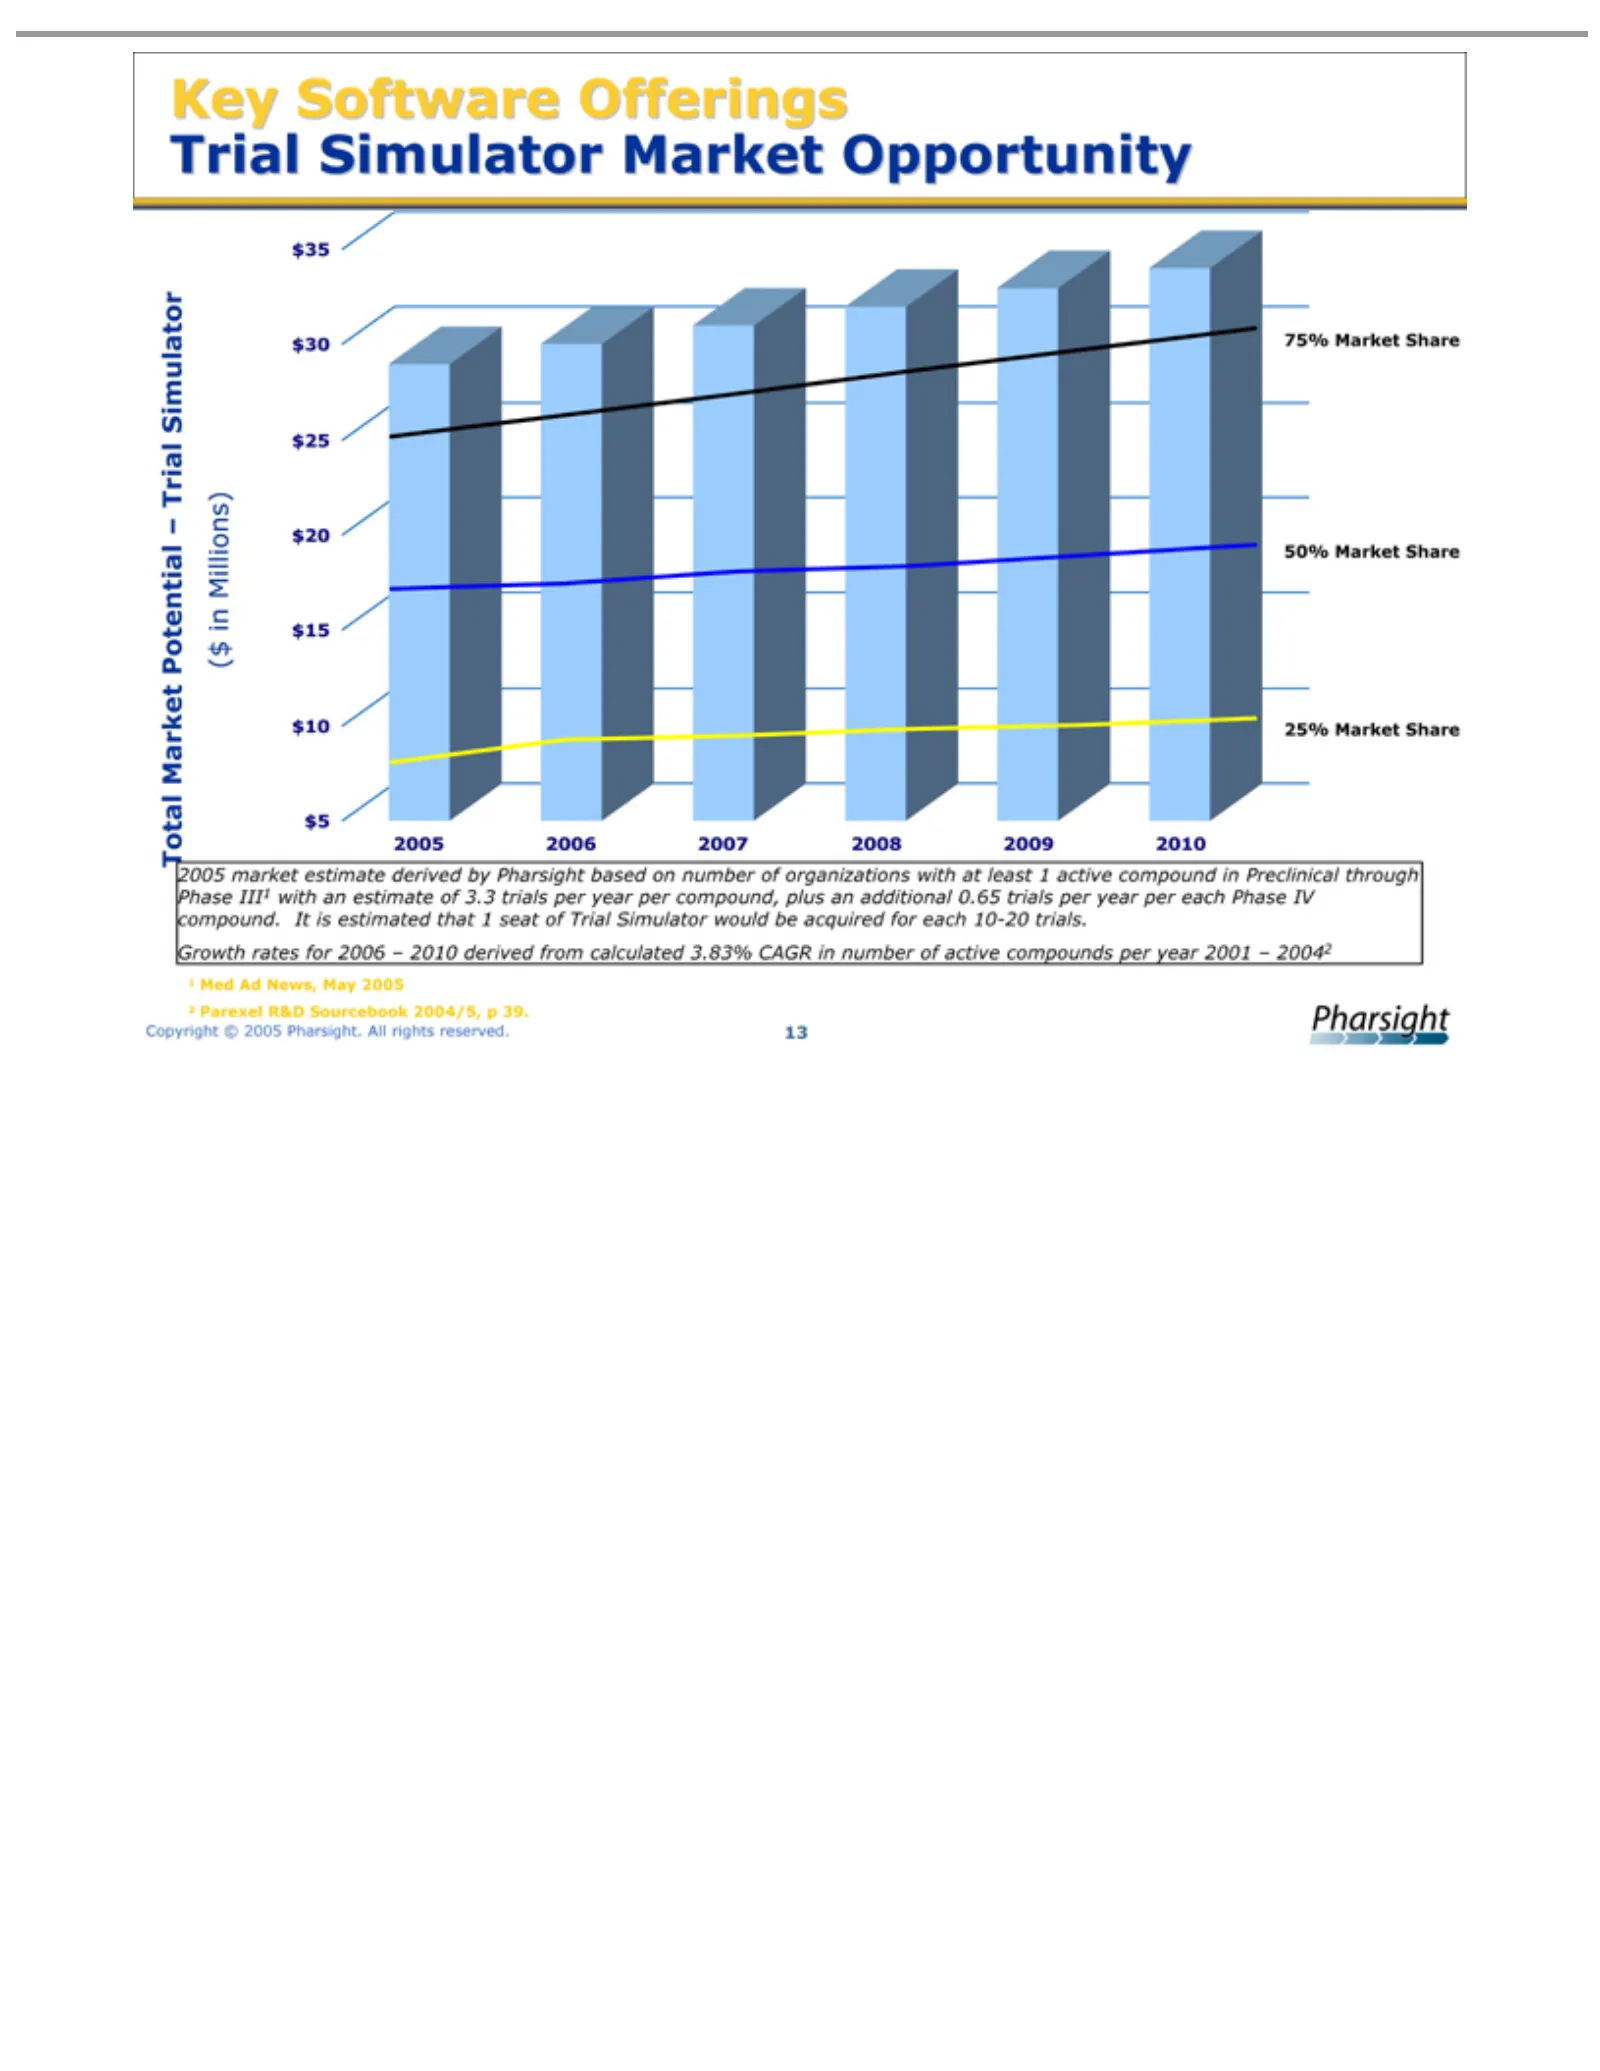
Slide 13: Key Trial Simulator Market Opportunity
Key Trial 75% 2005 plus Total ($ Growth 1 2 Copyright 13Med Parexel in Software an Market Millions) Simulator 2006 market Market Ad additional rates R&D News, © 2007 Share estimate 2005 Potential for Offerings Market Sourcebook 2008 2006 May 0.65 Pharsight. 50%derived 2009 -2005 -trials Opportunity
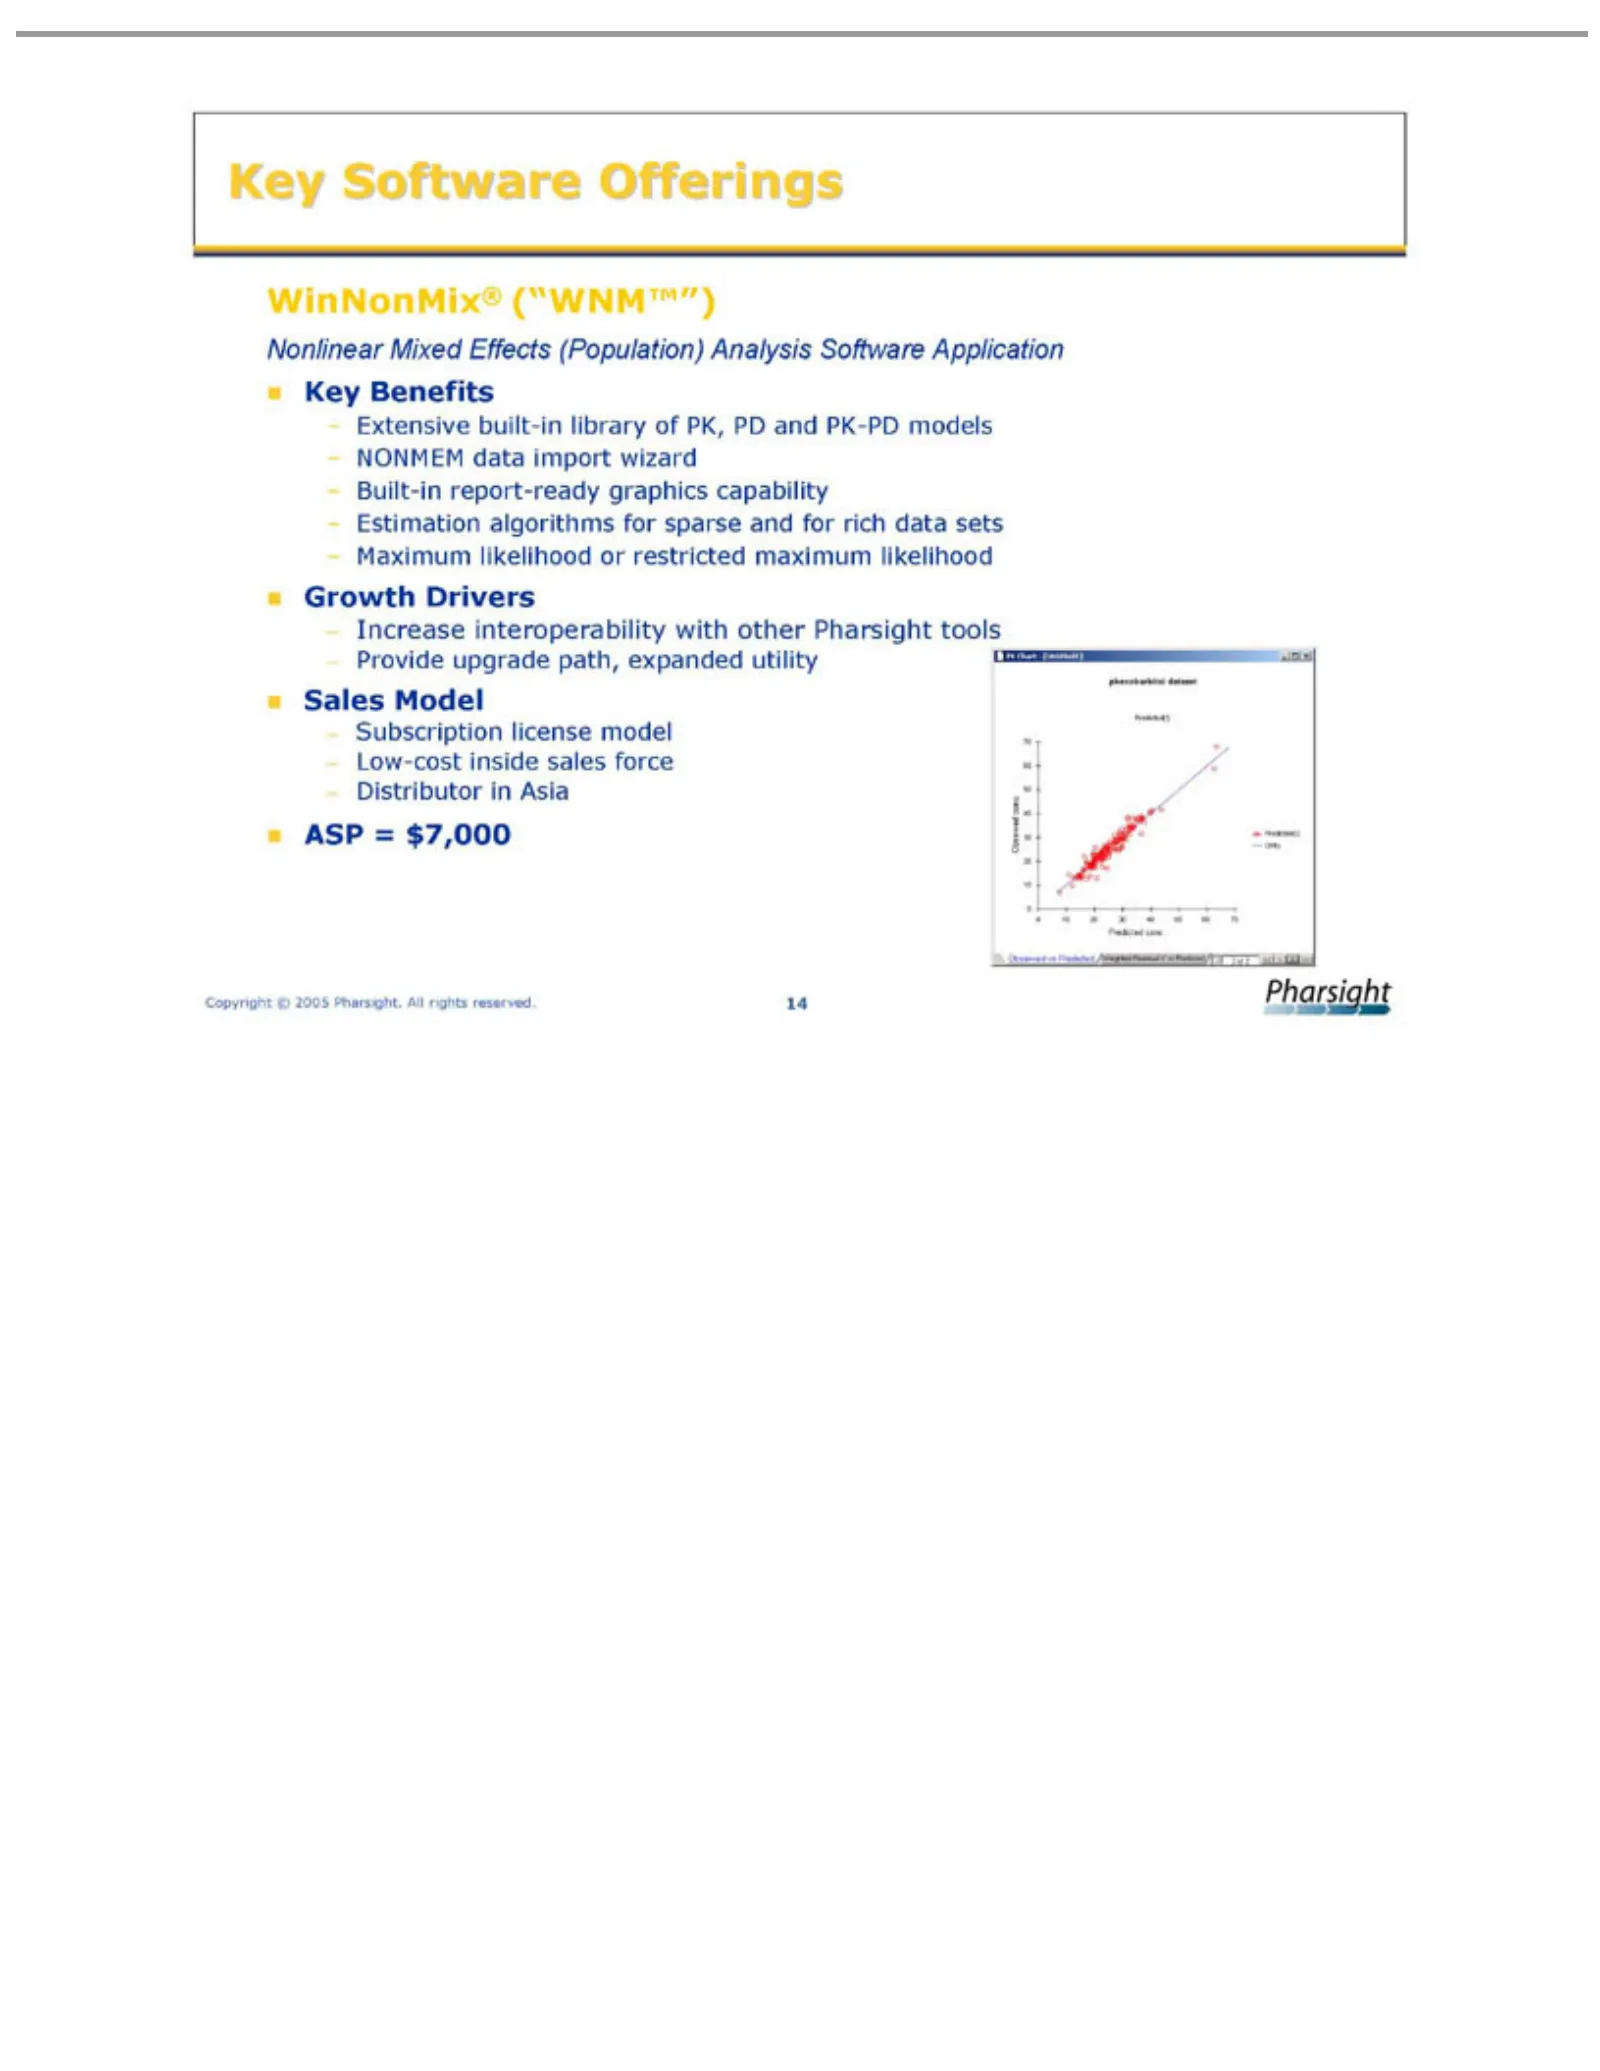
Slide 14: WinNonMix
WinNonMix® Nonlinear Key Extensive NONMEM Built-in Estimation Maximum Growth Increase Provide Sales Subscription Low-cost Distributor ASP Copyright Software Benefits =Model $7,000 Drivers upgrade report-ready interoperability inside built-in Mixed © likelihood algorithms in data license 2005 Asia Of
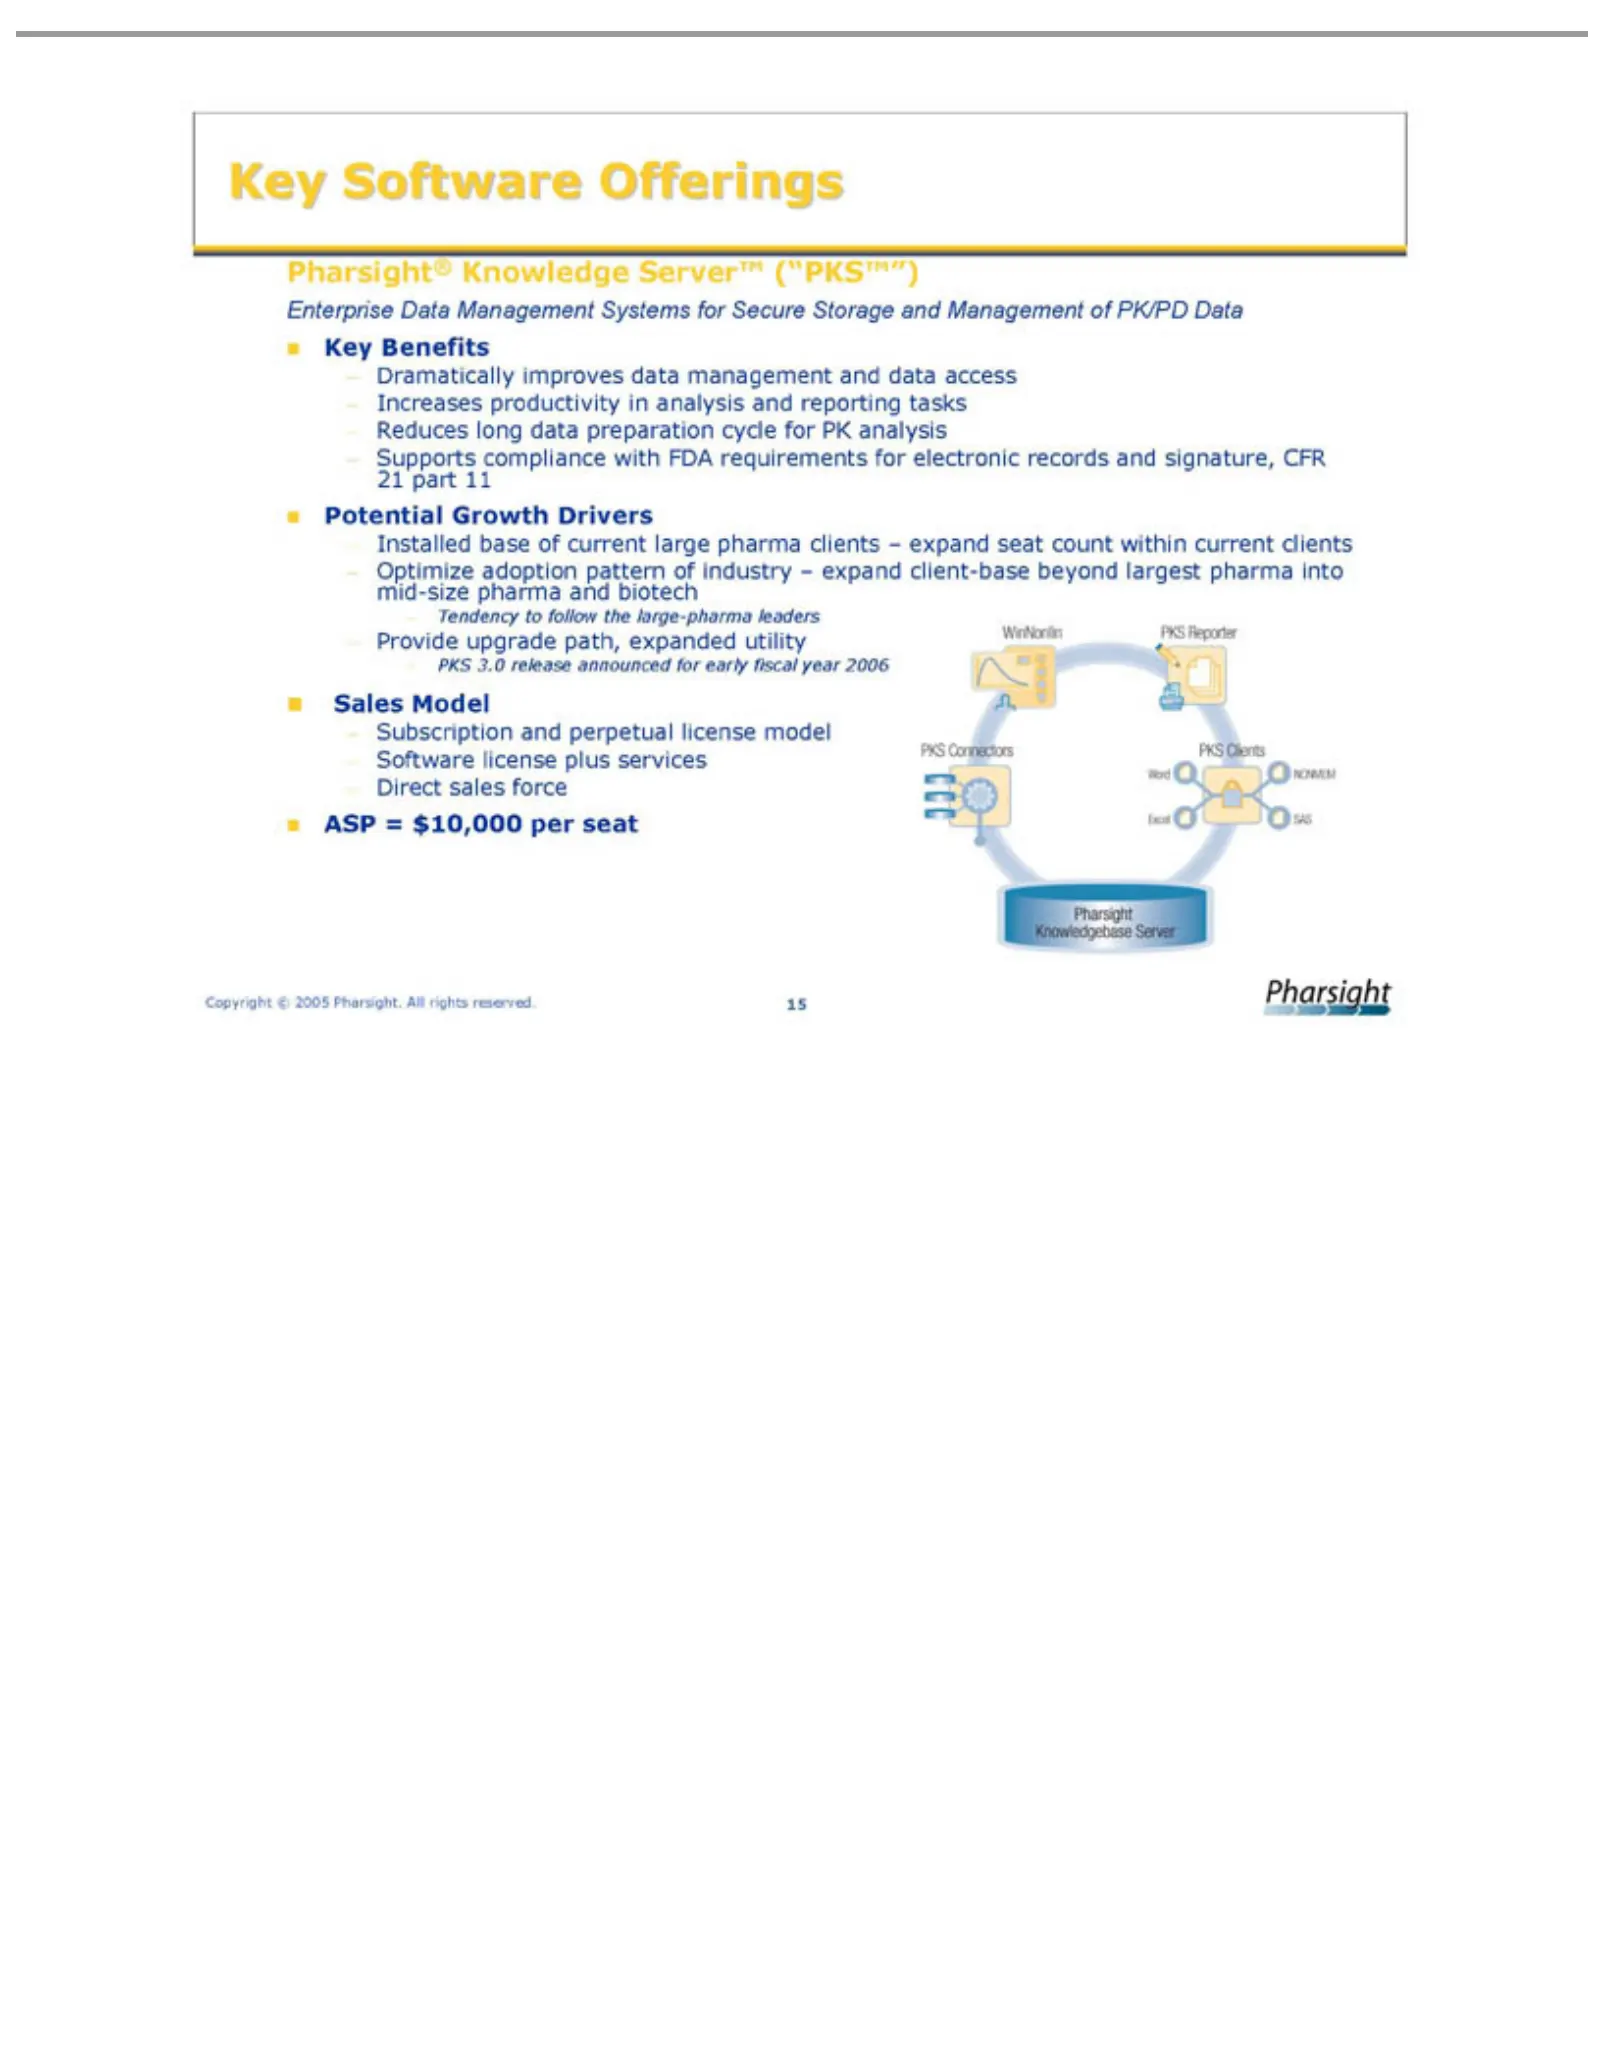
Slide 15: Pharsight Knowledgebase Server
Pharsight® Enterprise Key Dramatically Increases Reduces Supports Potential Installed Optimize Tendency Provide PKS Sales Subscription Software Direct ASP Copyright Software Benefits =3.0 Model sales $10,000 upgrade release long base Growth compliance license productivity adoption to © Data Knowledg
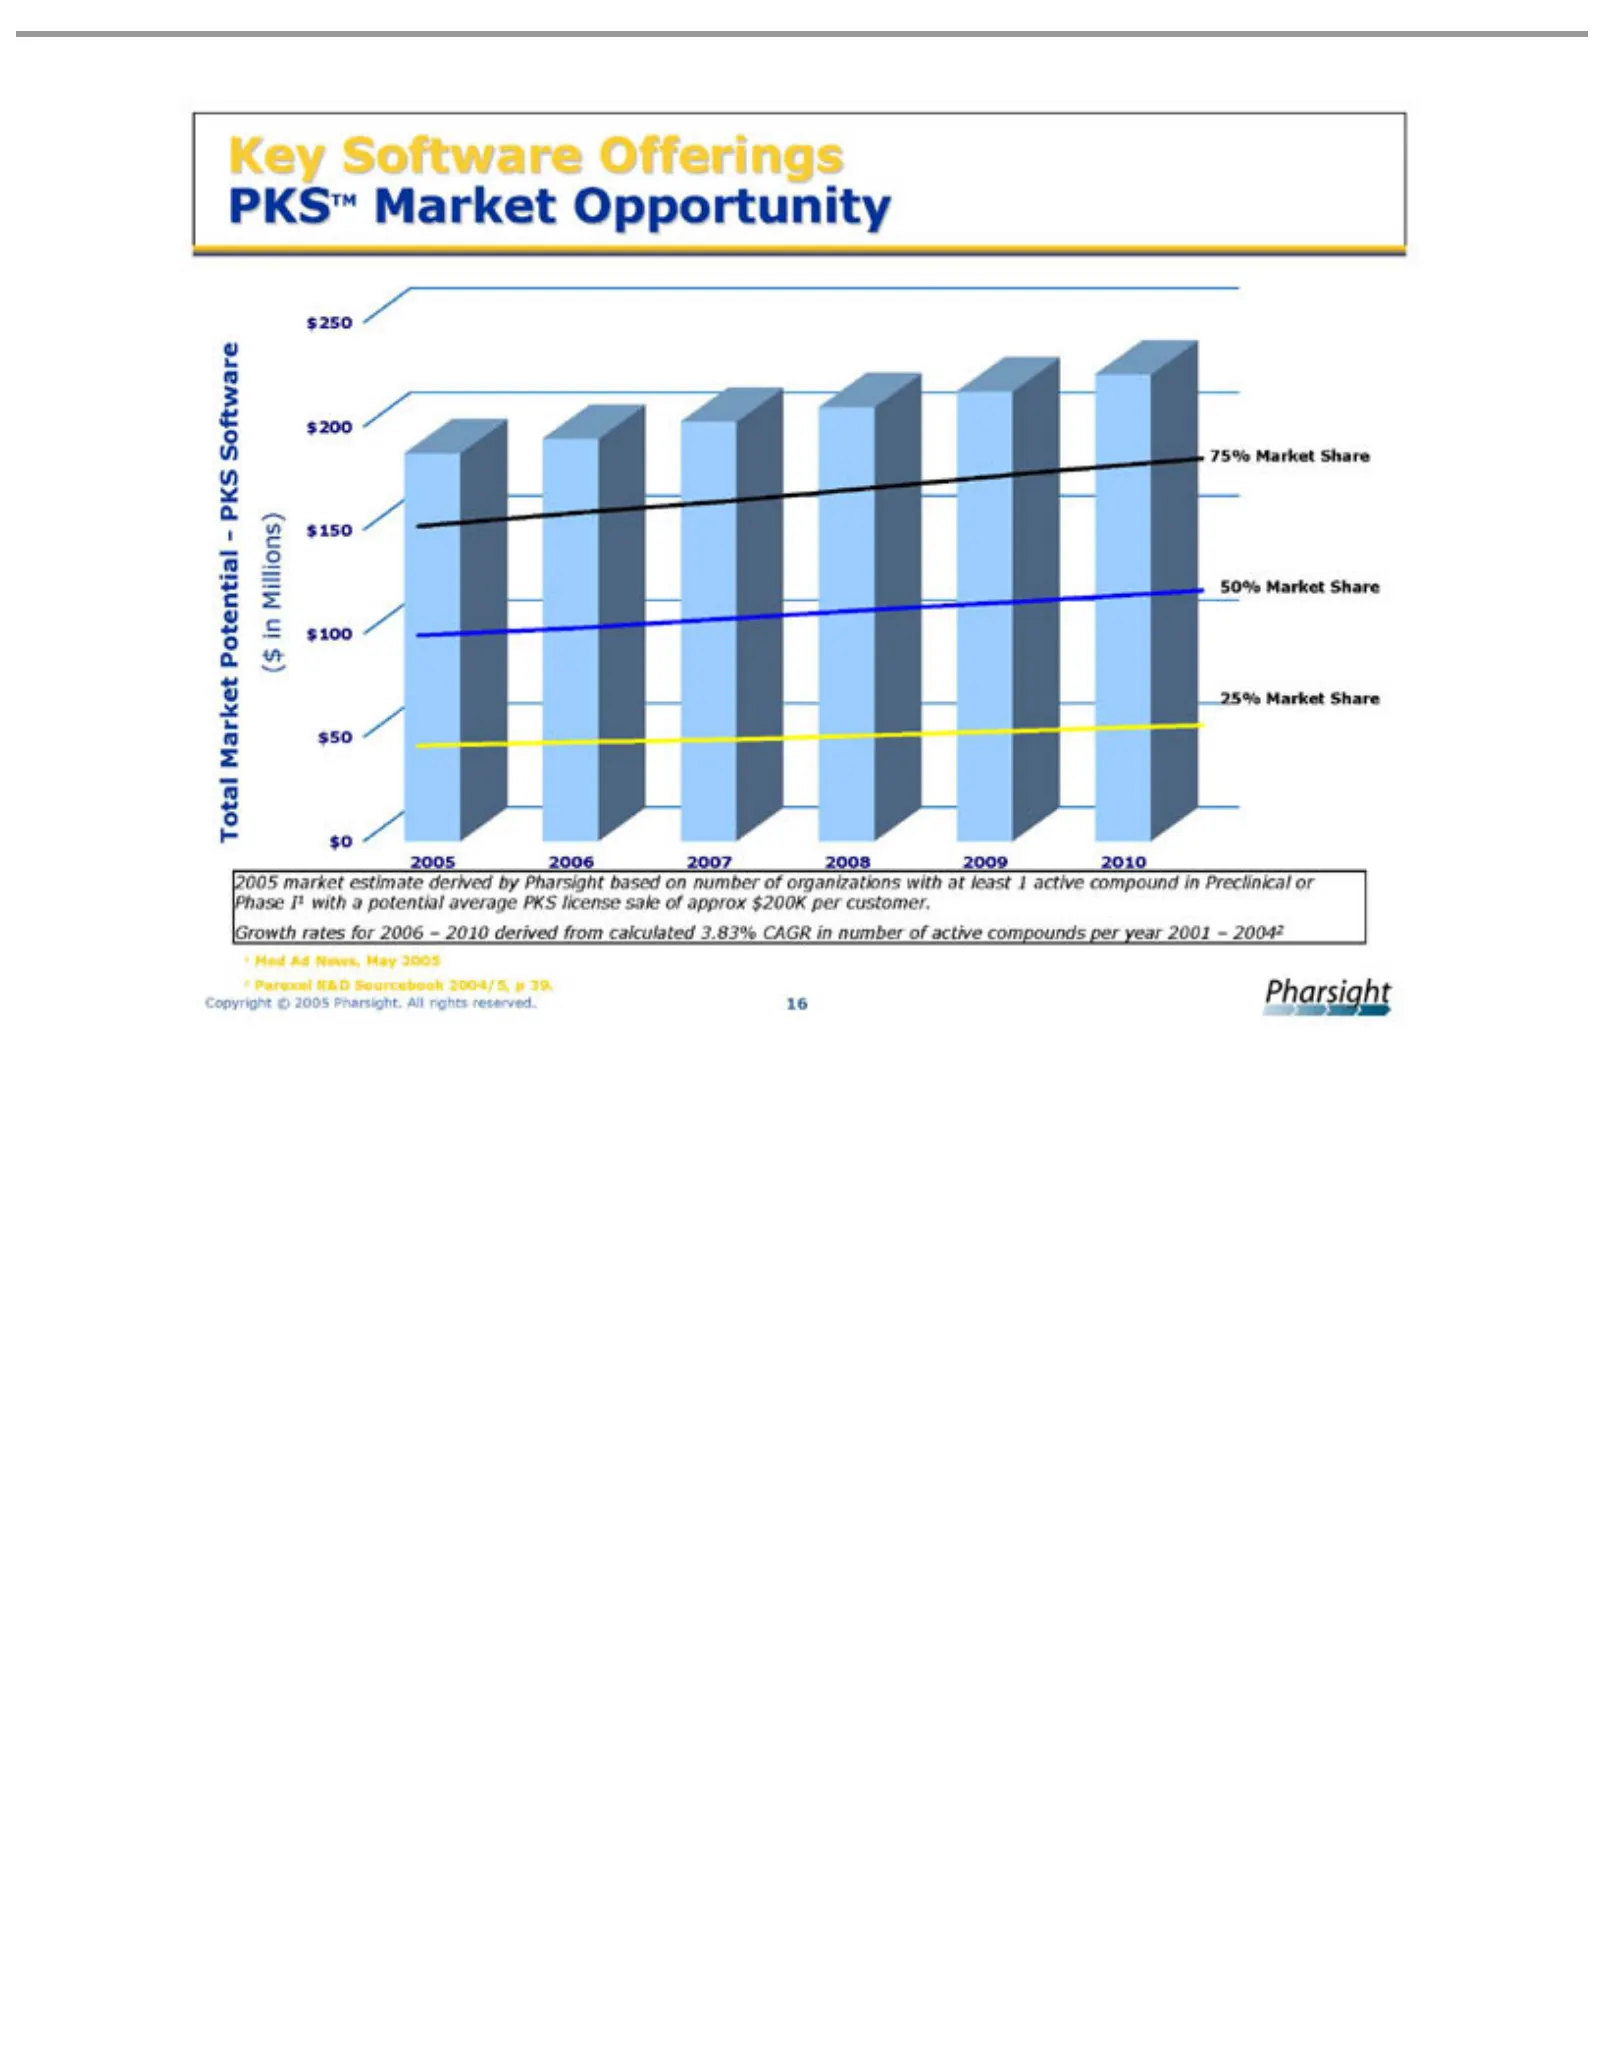
Slide 16: Key PKS Market Opportunity
Key PKSTM 75% $200 $250 Total $150 ($ 50% 25% $100 2010 2005 2006 2007 2008 2009 $0 $50 Growth customer. 1 2 Copyright Med Parexel in Software Market Millions) market Market Ad rates Market R&D News, © Share estimate 2005 Potential for Offerings Sourcebook Opportunity 2006 May Pharsight. derived –20
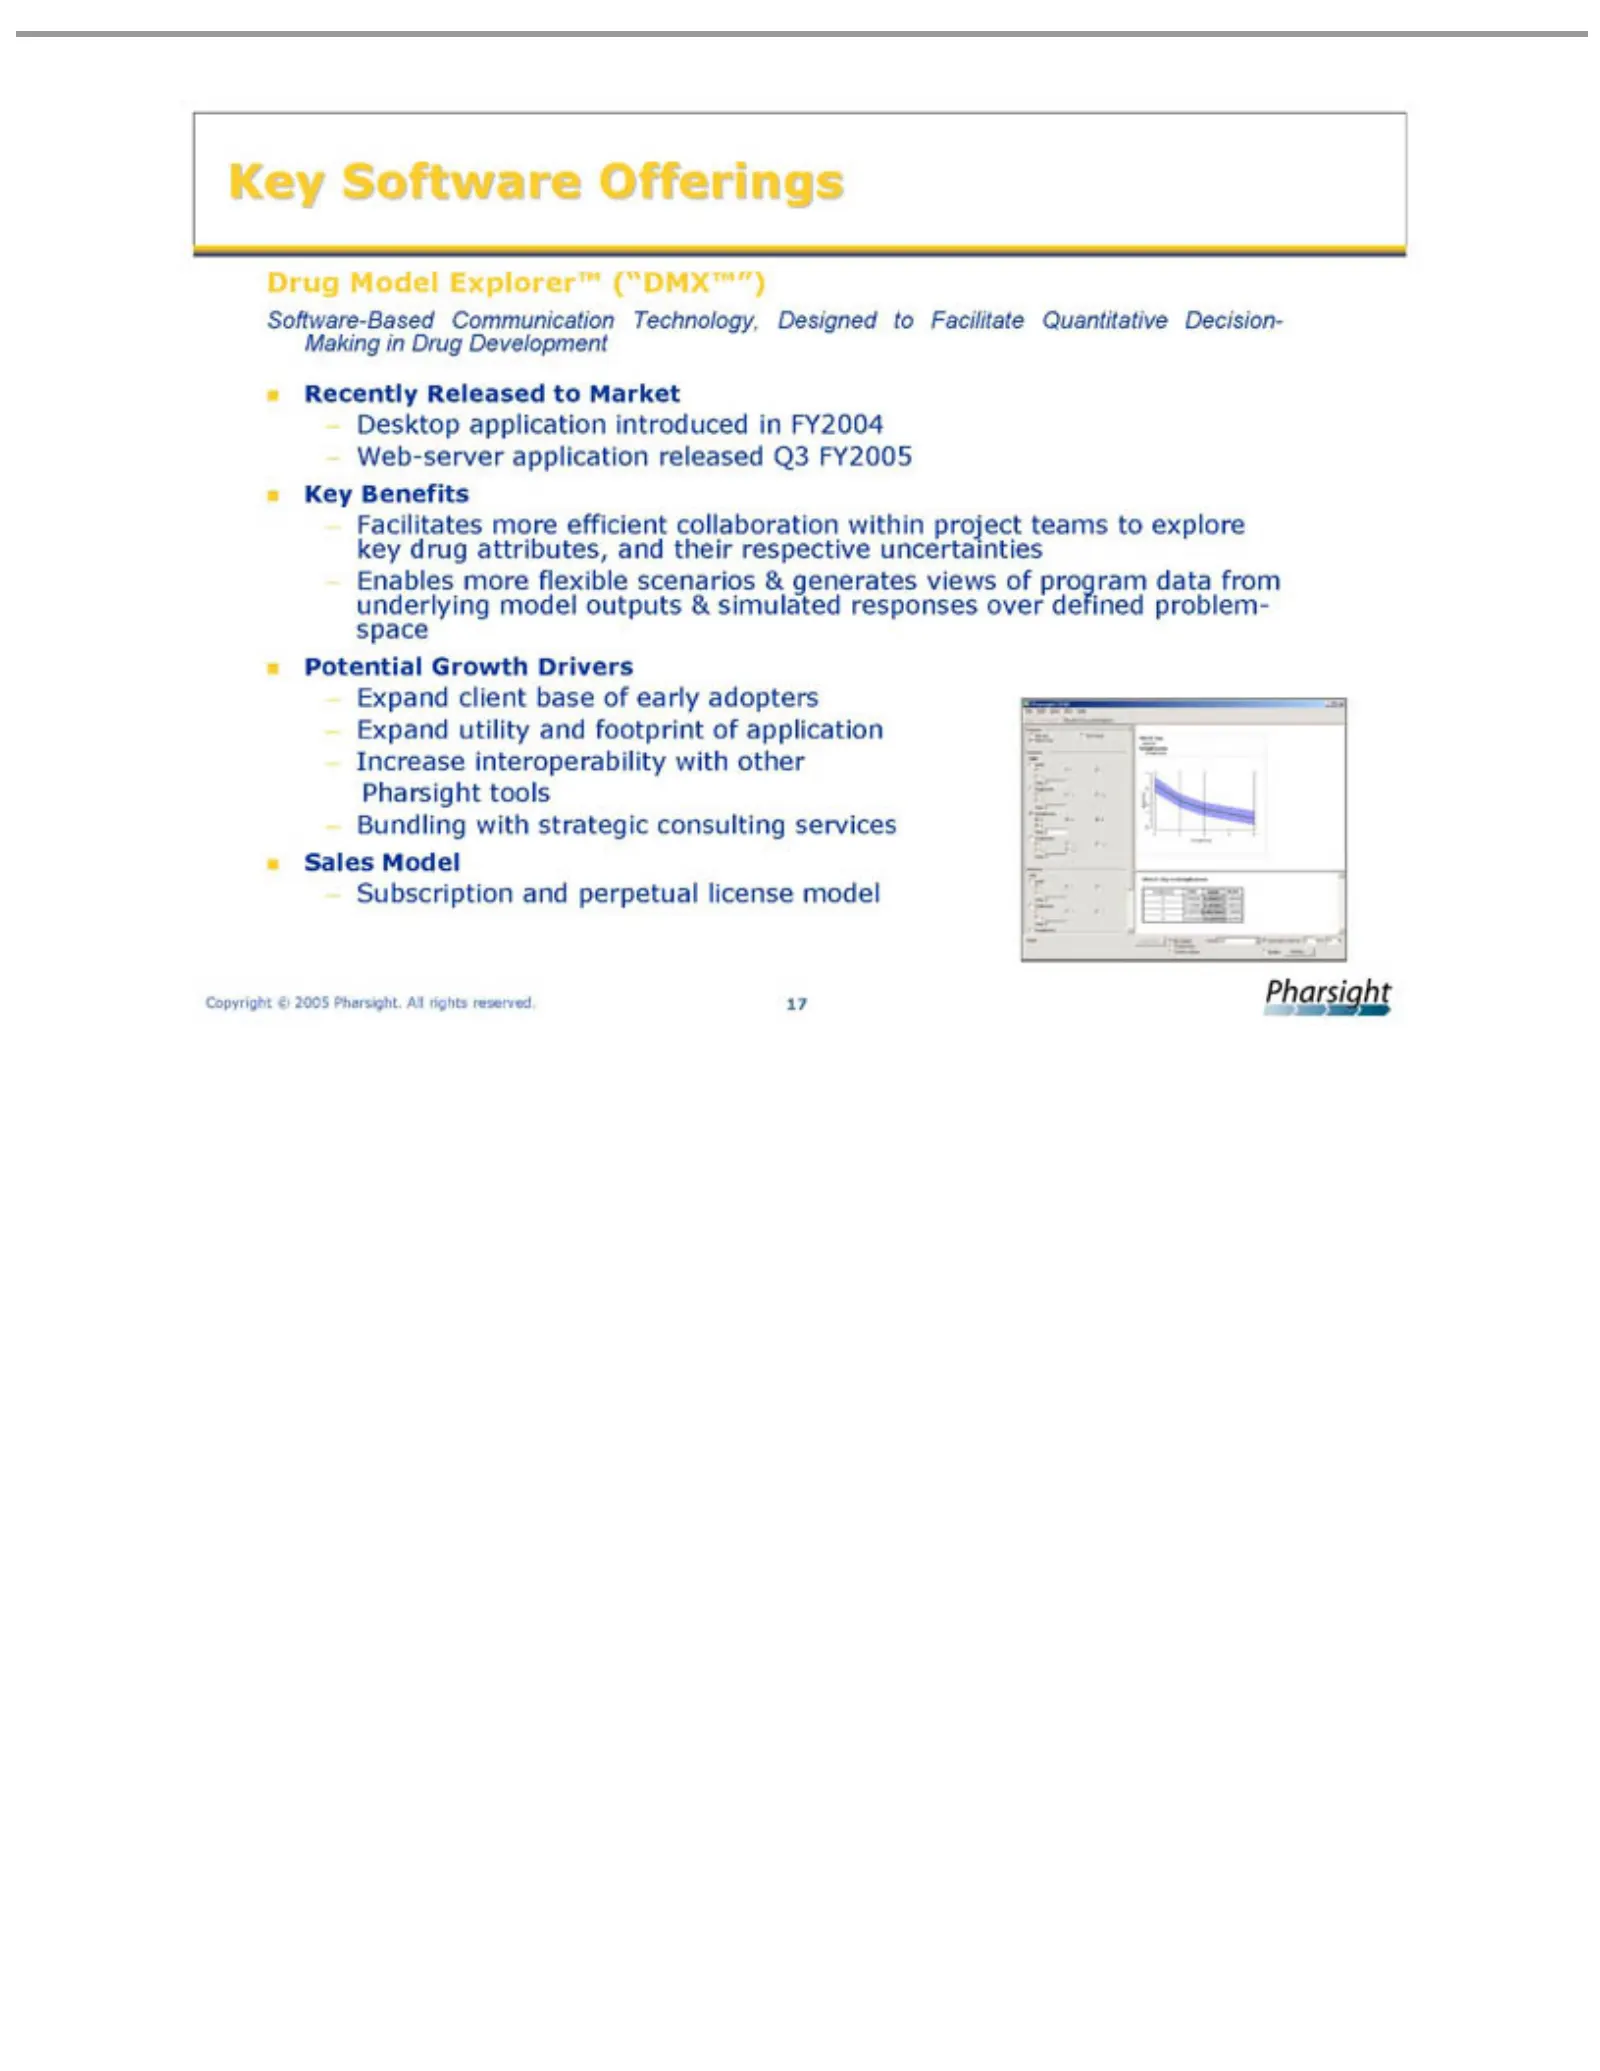
Slide 17: Drug Model Explorer
DrugBenefits Software-Based Recently Desktop Web-server Key Facilitates Enables Potential Expand Increase Bundling Sales Subscription Copyright Software Model client utility more interoperability application Released Growth with © more application Explorer™ and 2005 flexible Offerings base and strat
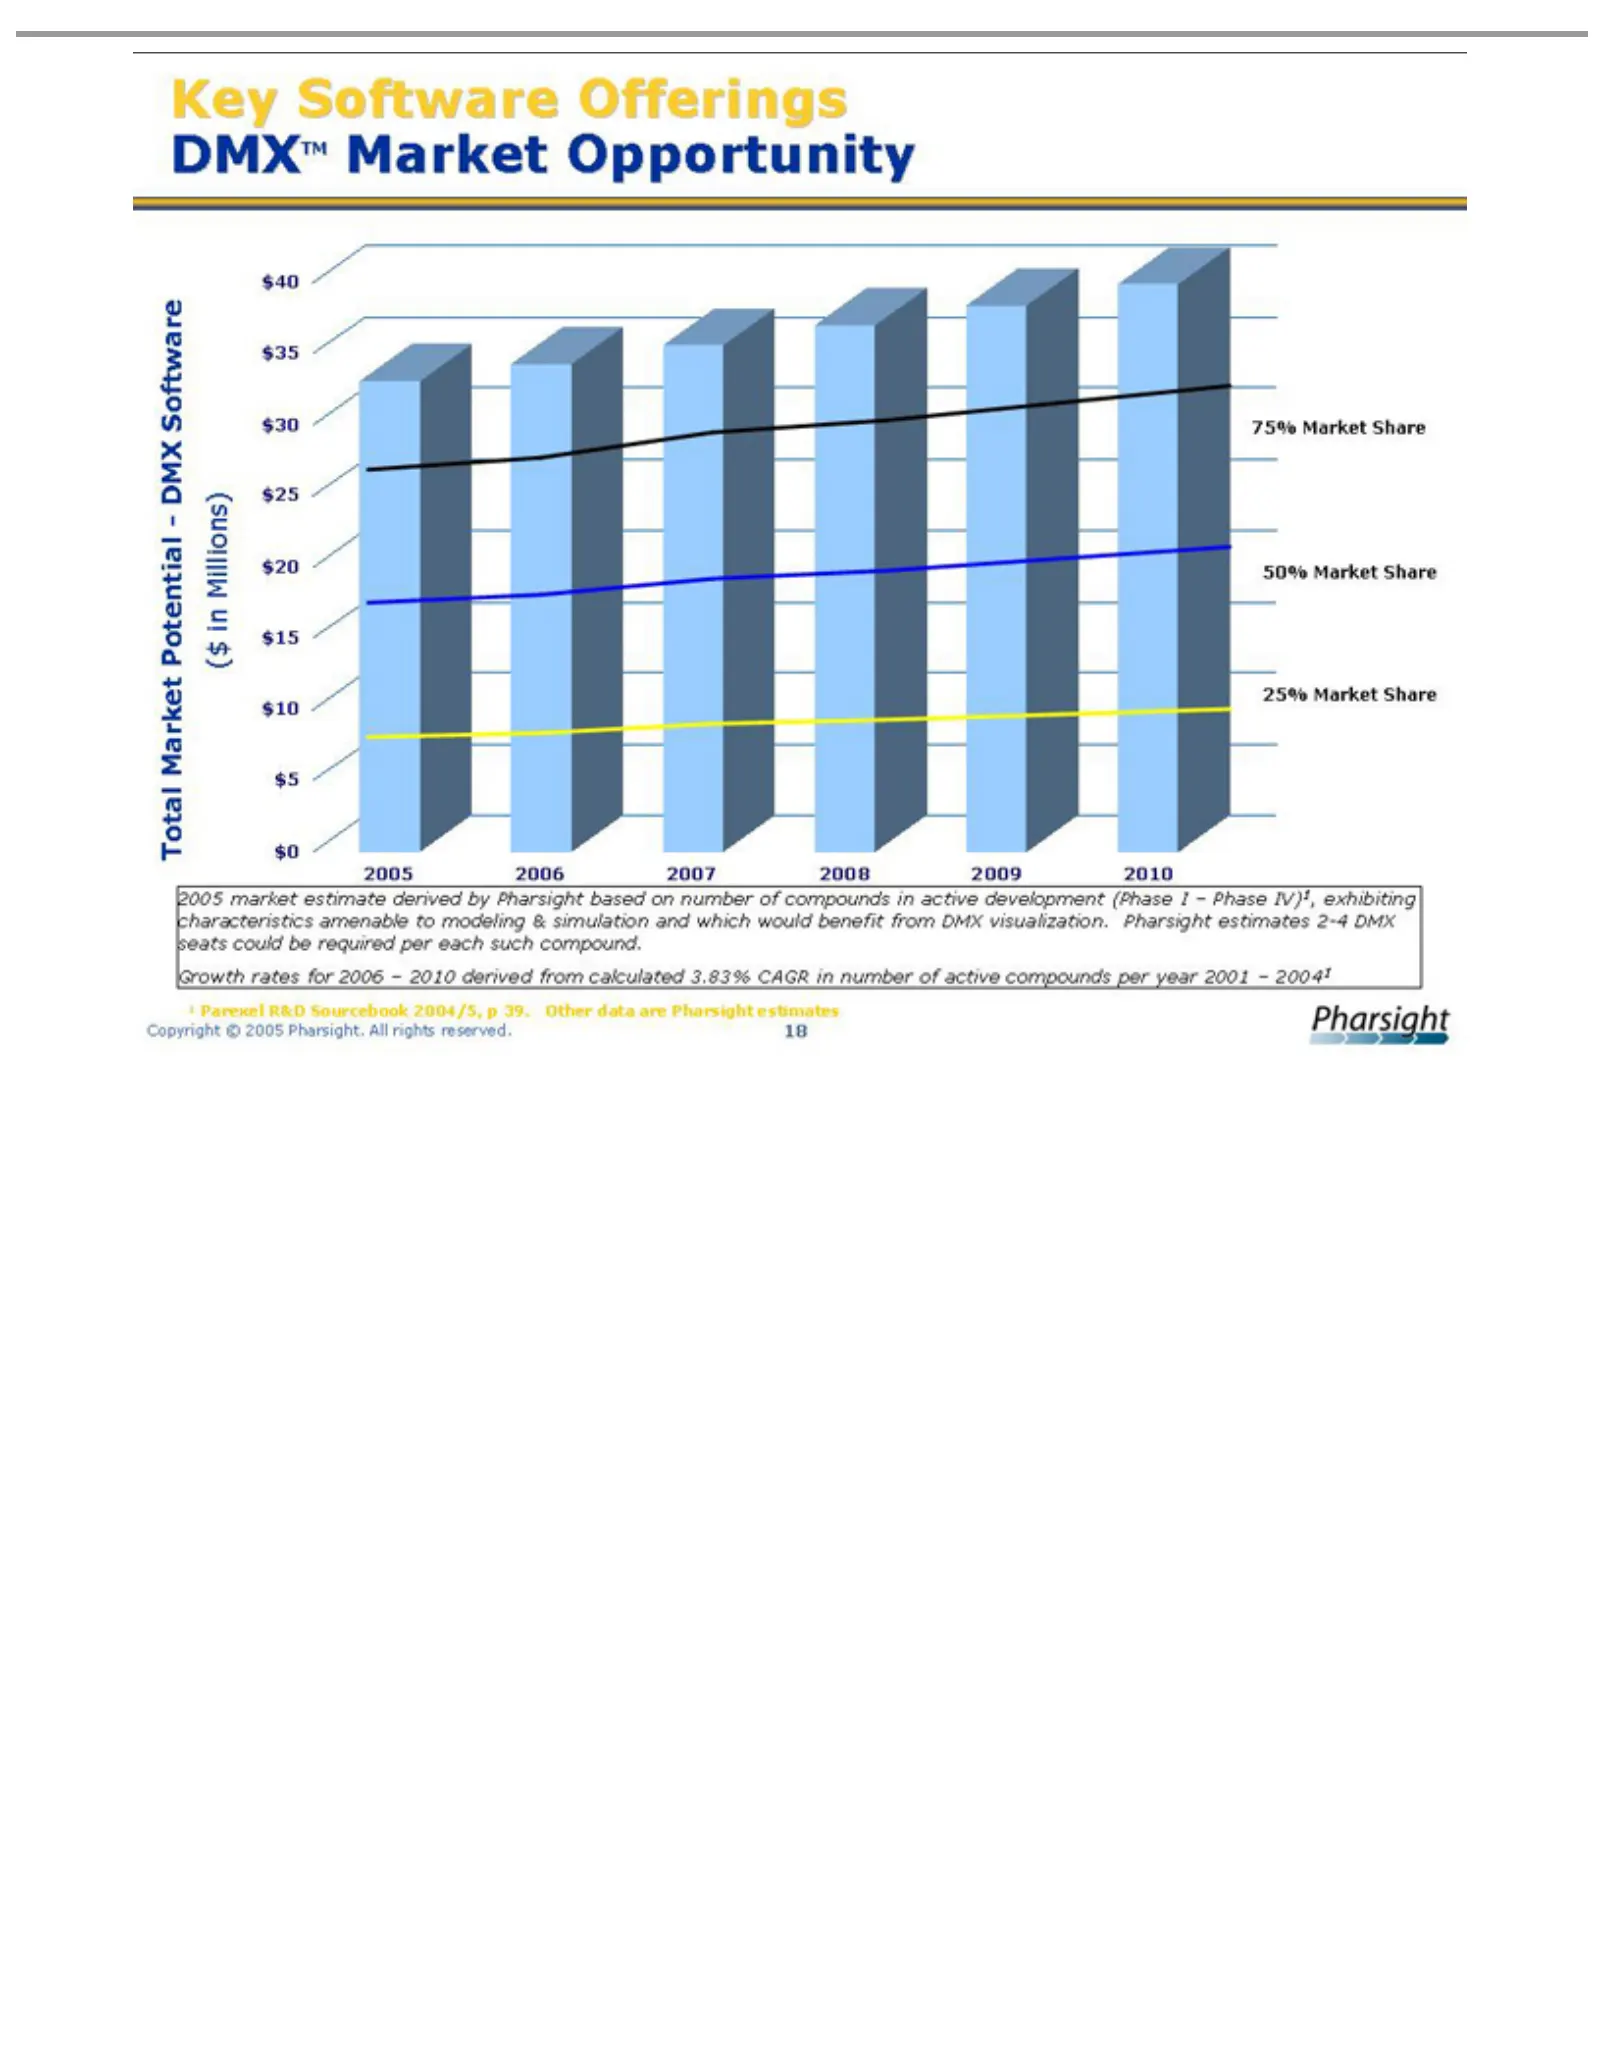
Slide 18: Key DMX Market Opportunity
Key $40 75% 2005 would Growth 1 Copyright Parexel $35 Software Market 2006 market benefit rates $30 R&D © 2007 Share $25 estimate 2005 for Offerings from Sourcebook 2008 2006 $20 Pharsight. 50% DMX $15 derived 2009 – Market DMXTM 2010 $10 visualization. 2010 2004/5, All by derived $5Share rights Pha
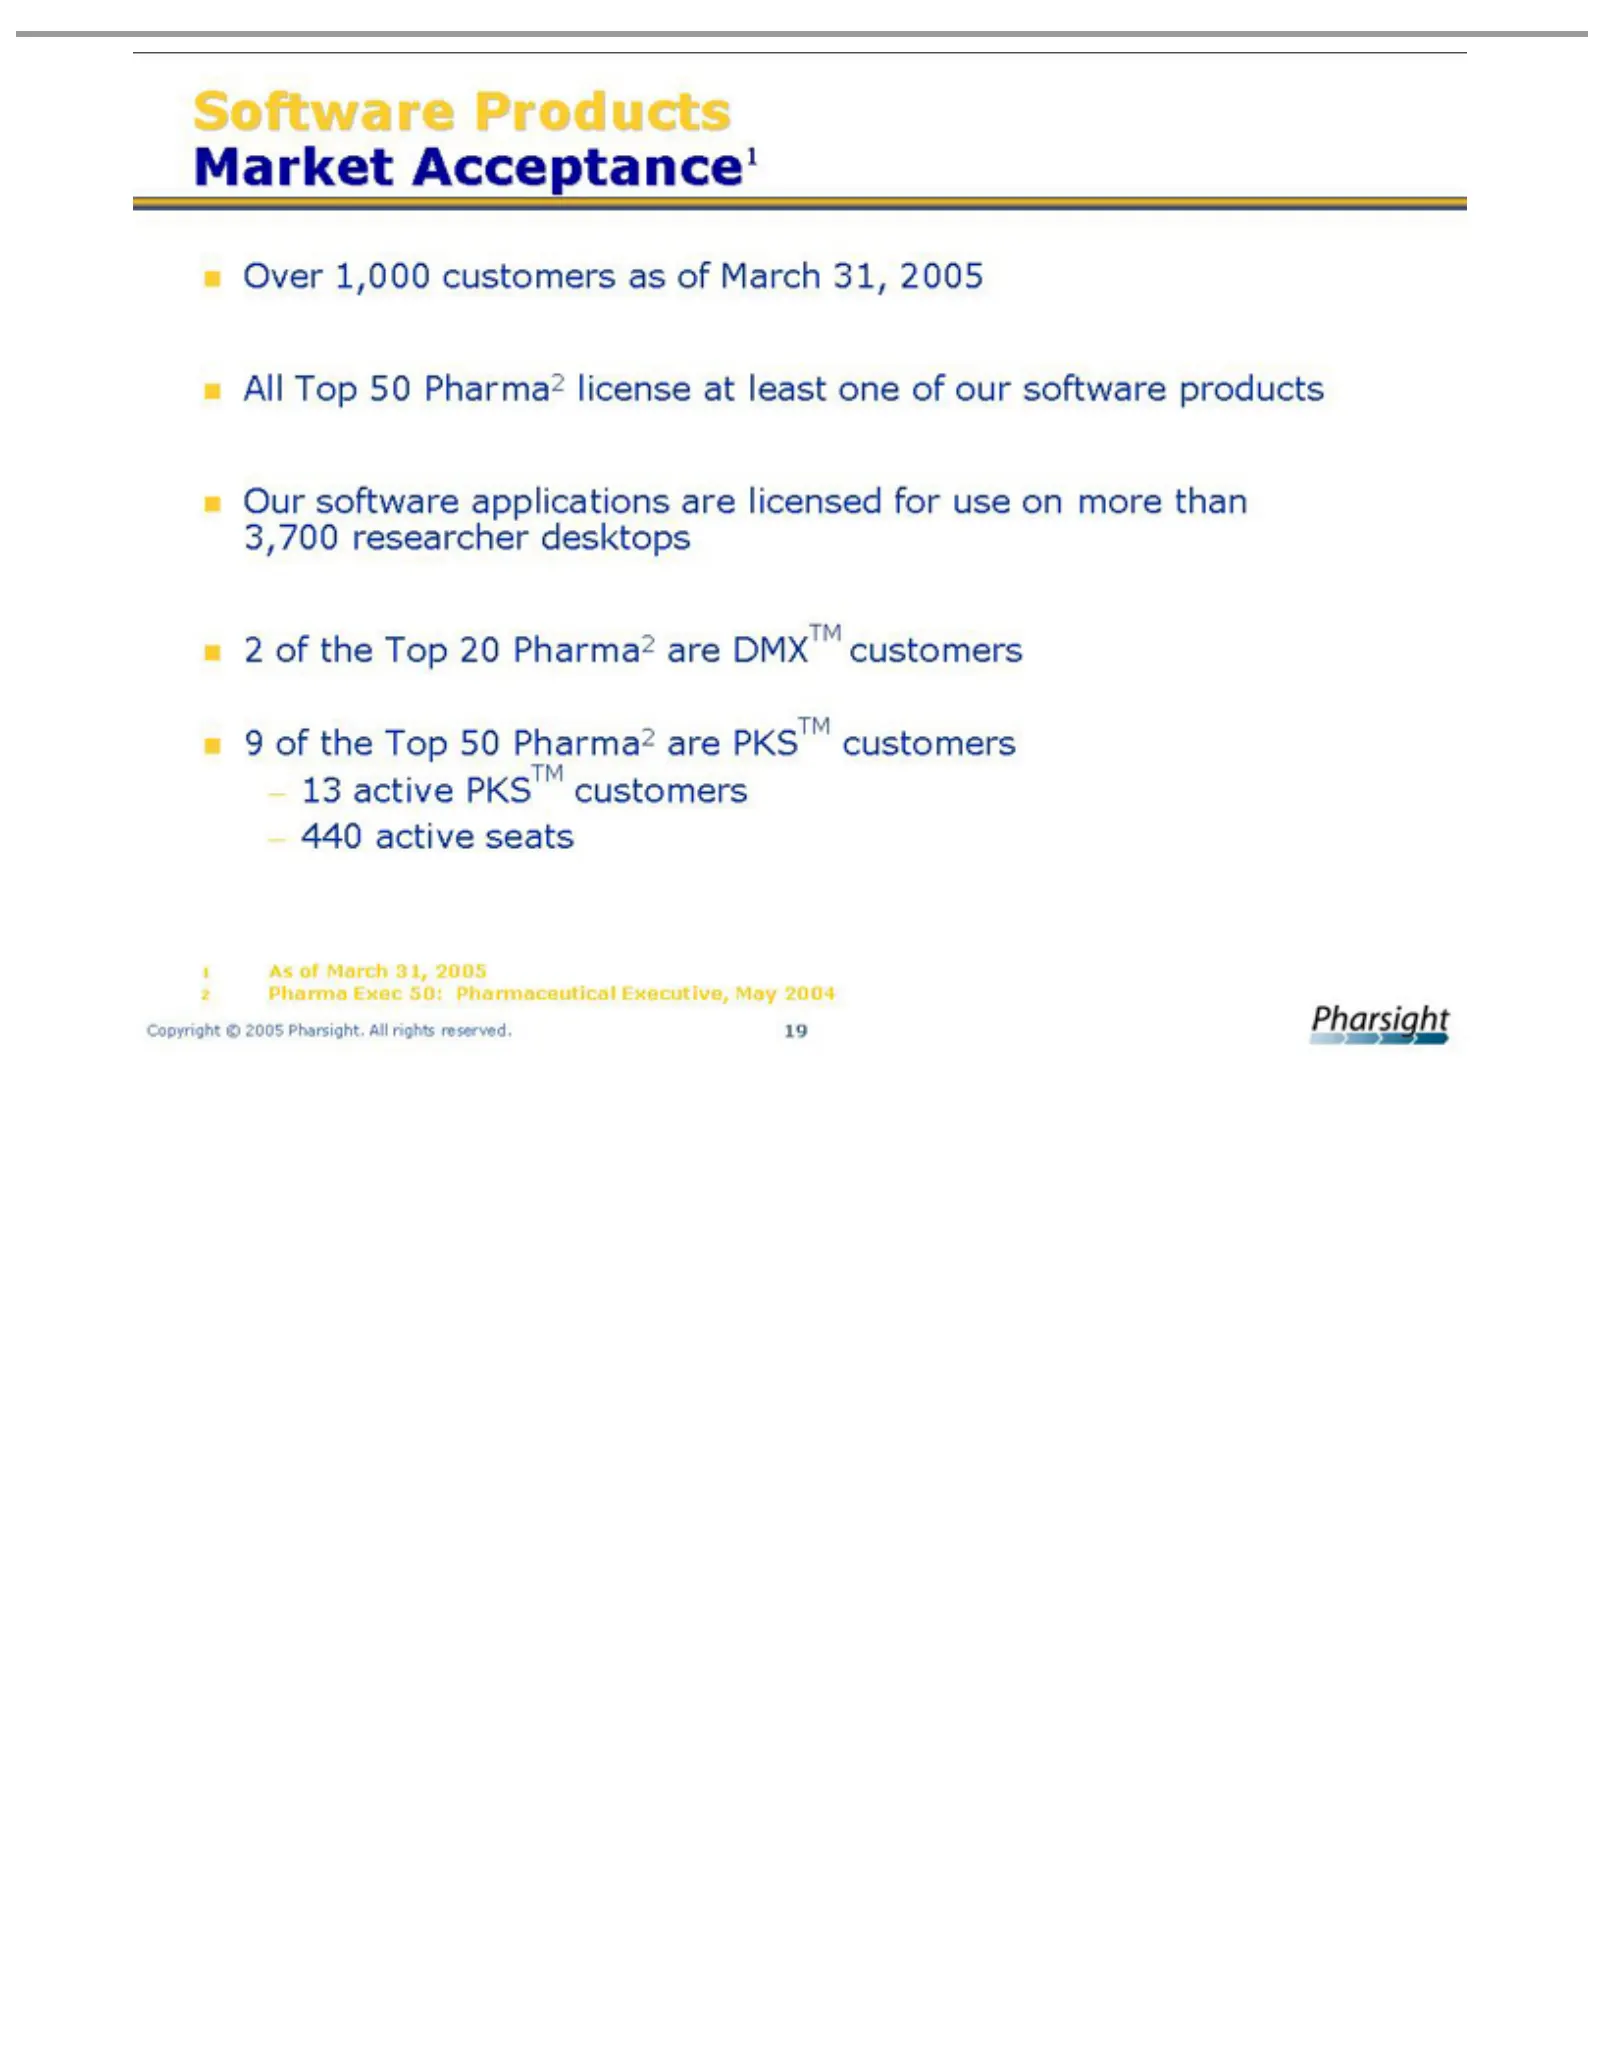
Slide 19: Software Market Acceptance
Software Market Over All Our 9 13 440 1 2 Copyright As ofactive Pharma Top active software the of 1,000 Acceptance1 March Top 50Products PKSTM Exec © seats Pharma2 customers 20 50 2005 applications 31, 50: Pharma2 customers 2005 Pharsight. Pharmaceutical license as are ofare March at DMXTM PKSTM All
Slide 20: Strategic Consulting Services
Strategic Consulting Services
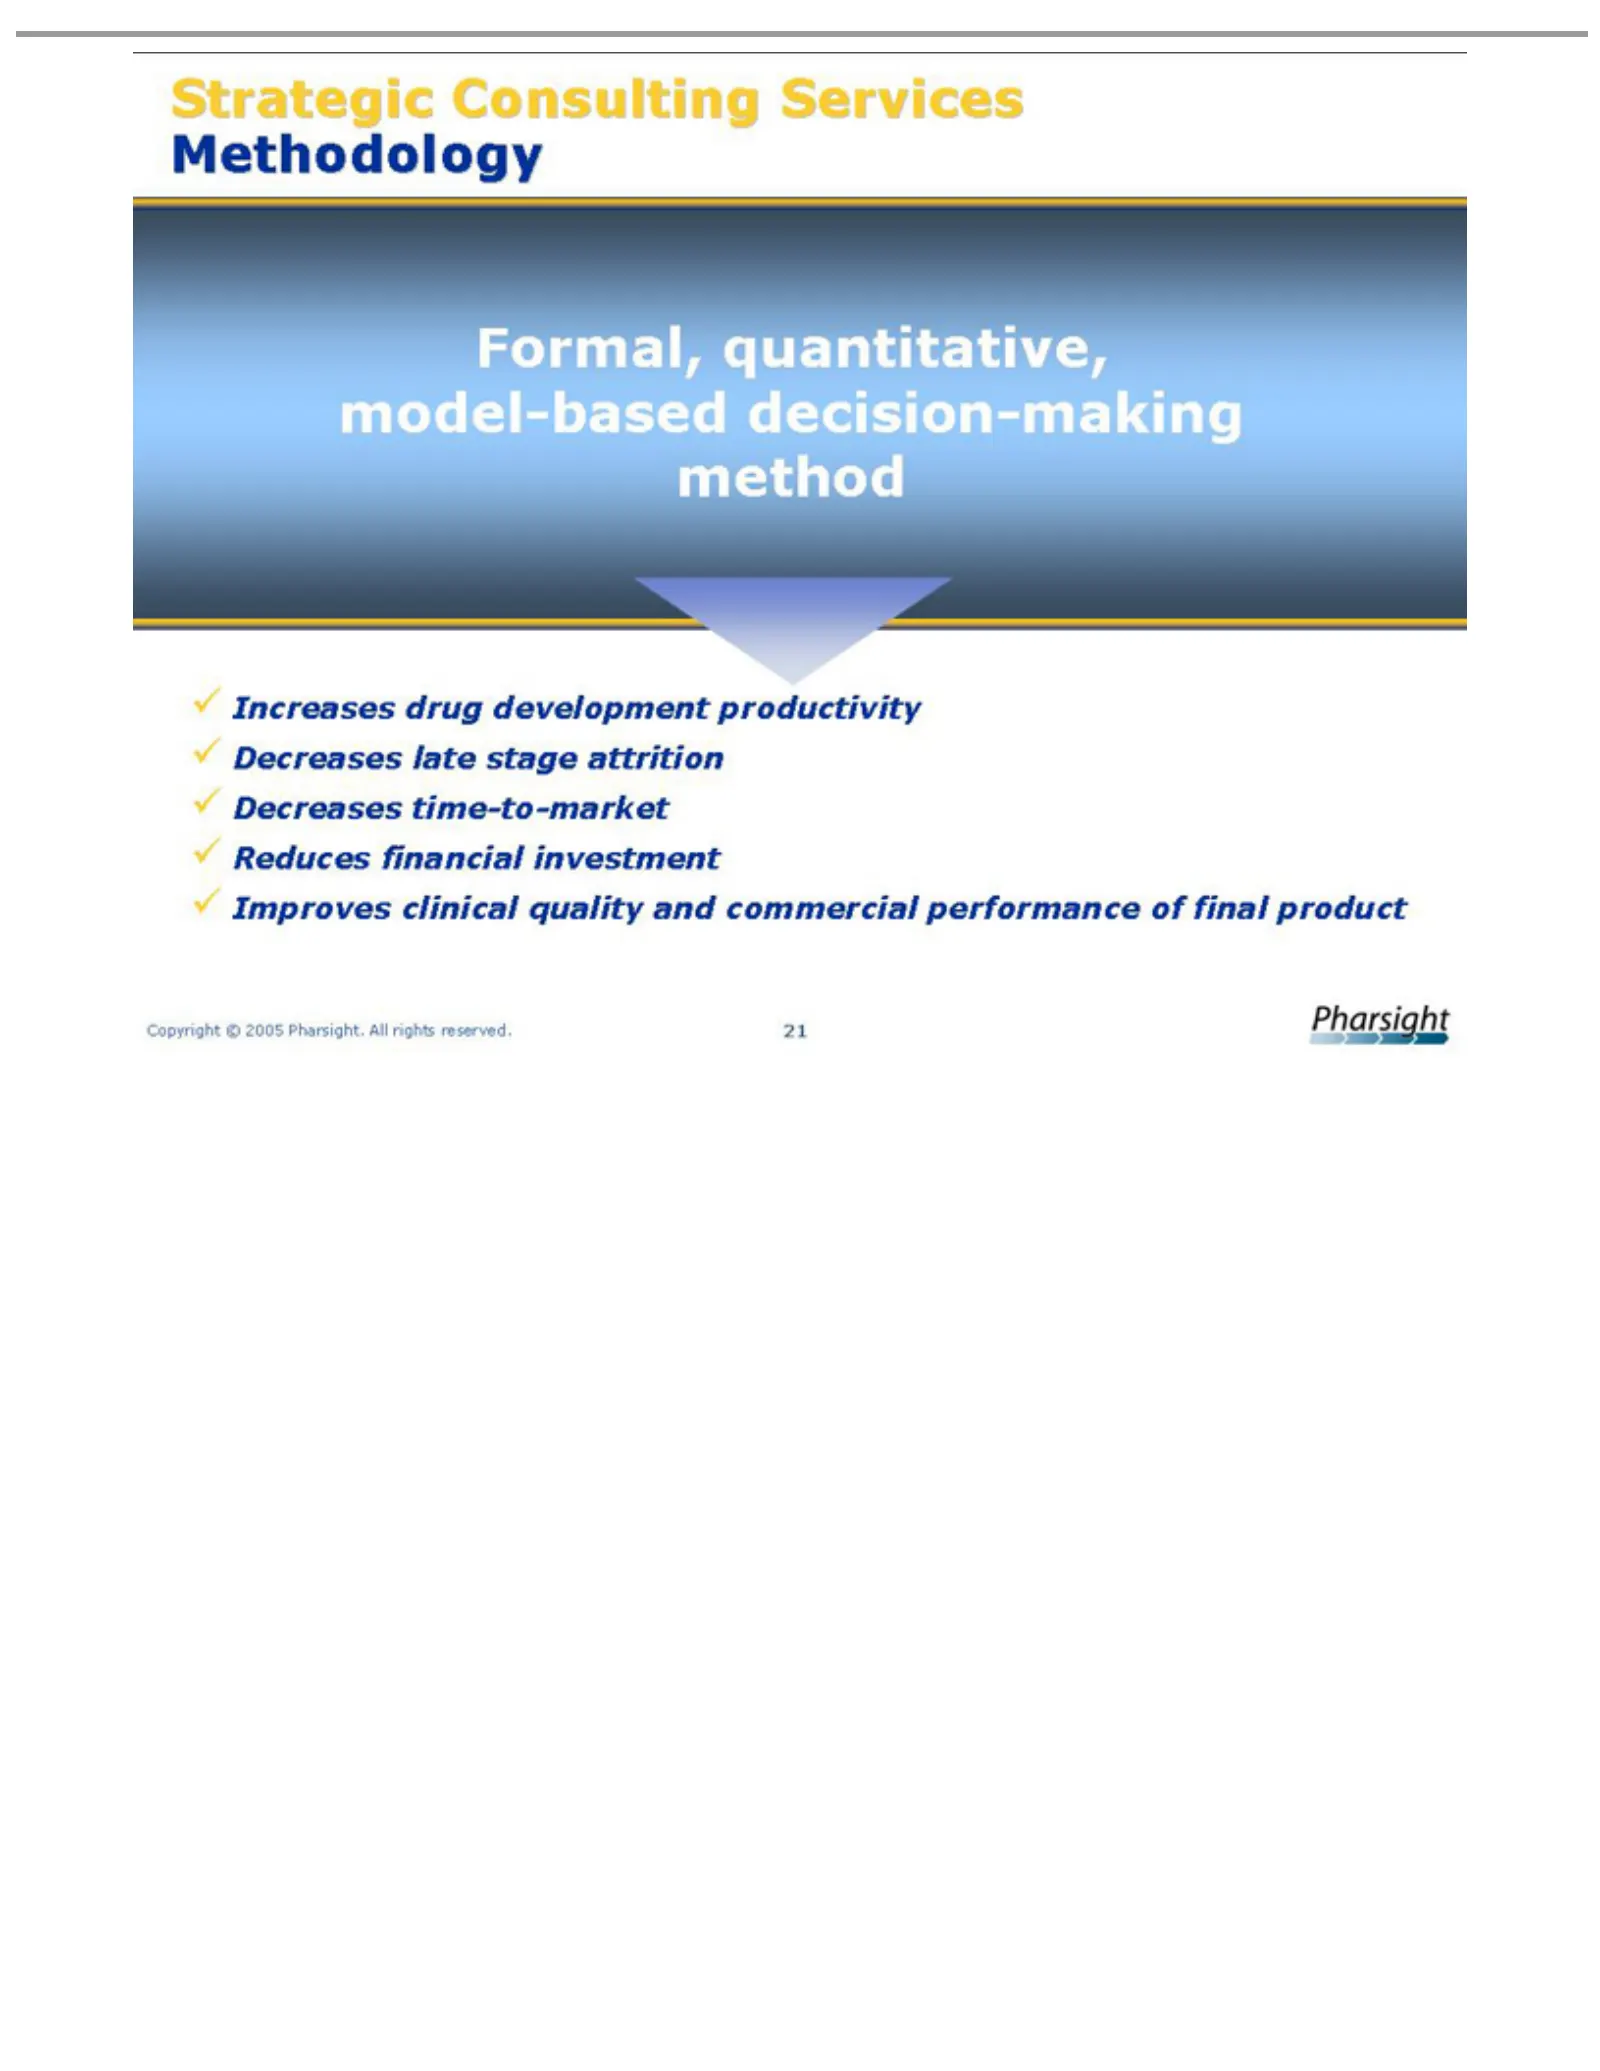
Slide 21: Strategic Consulting Services
Strategicquantitative, Formal, Methodology Increases Decreases Reduces Improves Copyrightfinancial Consulting drug clinical late time-to-market © 2005 stage development quality investment Pharsight. attrition Services model-based andproductivity All commercial rights decision-making reserved. perfor
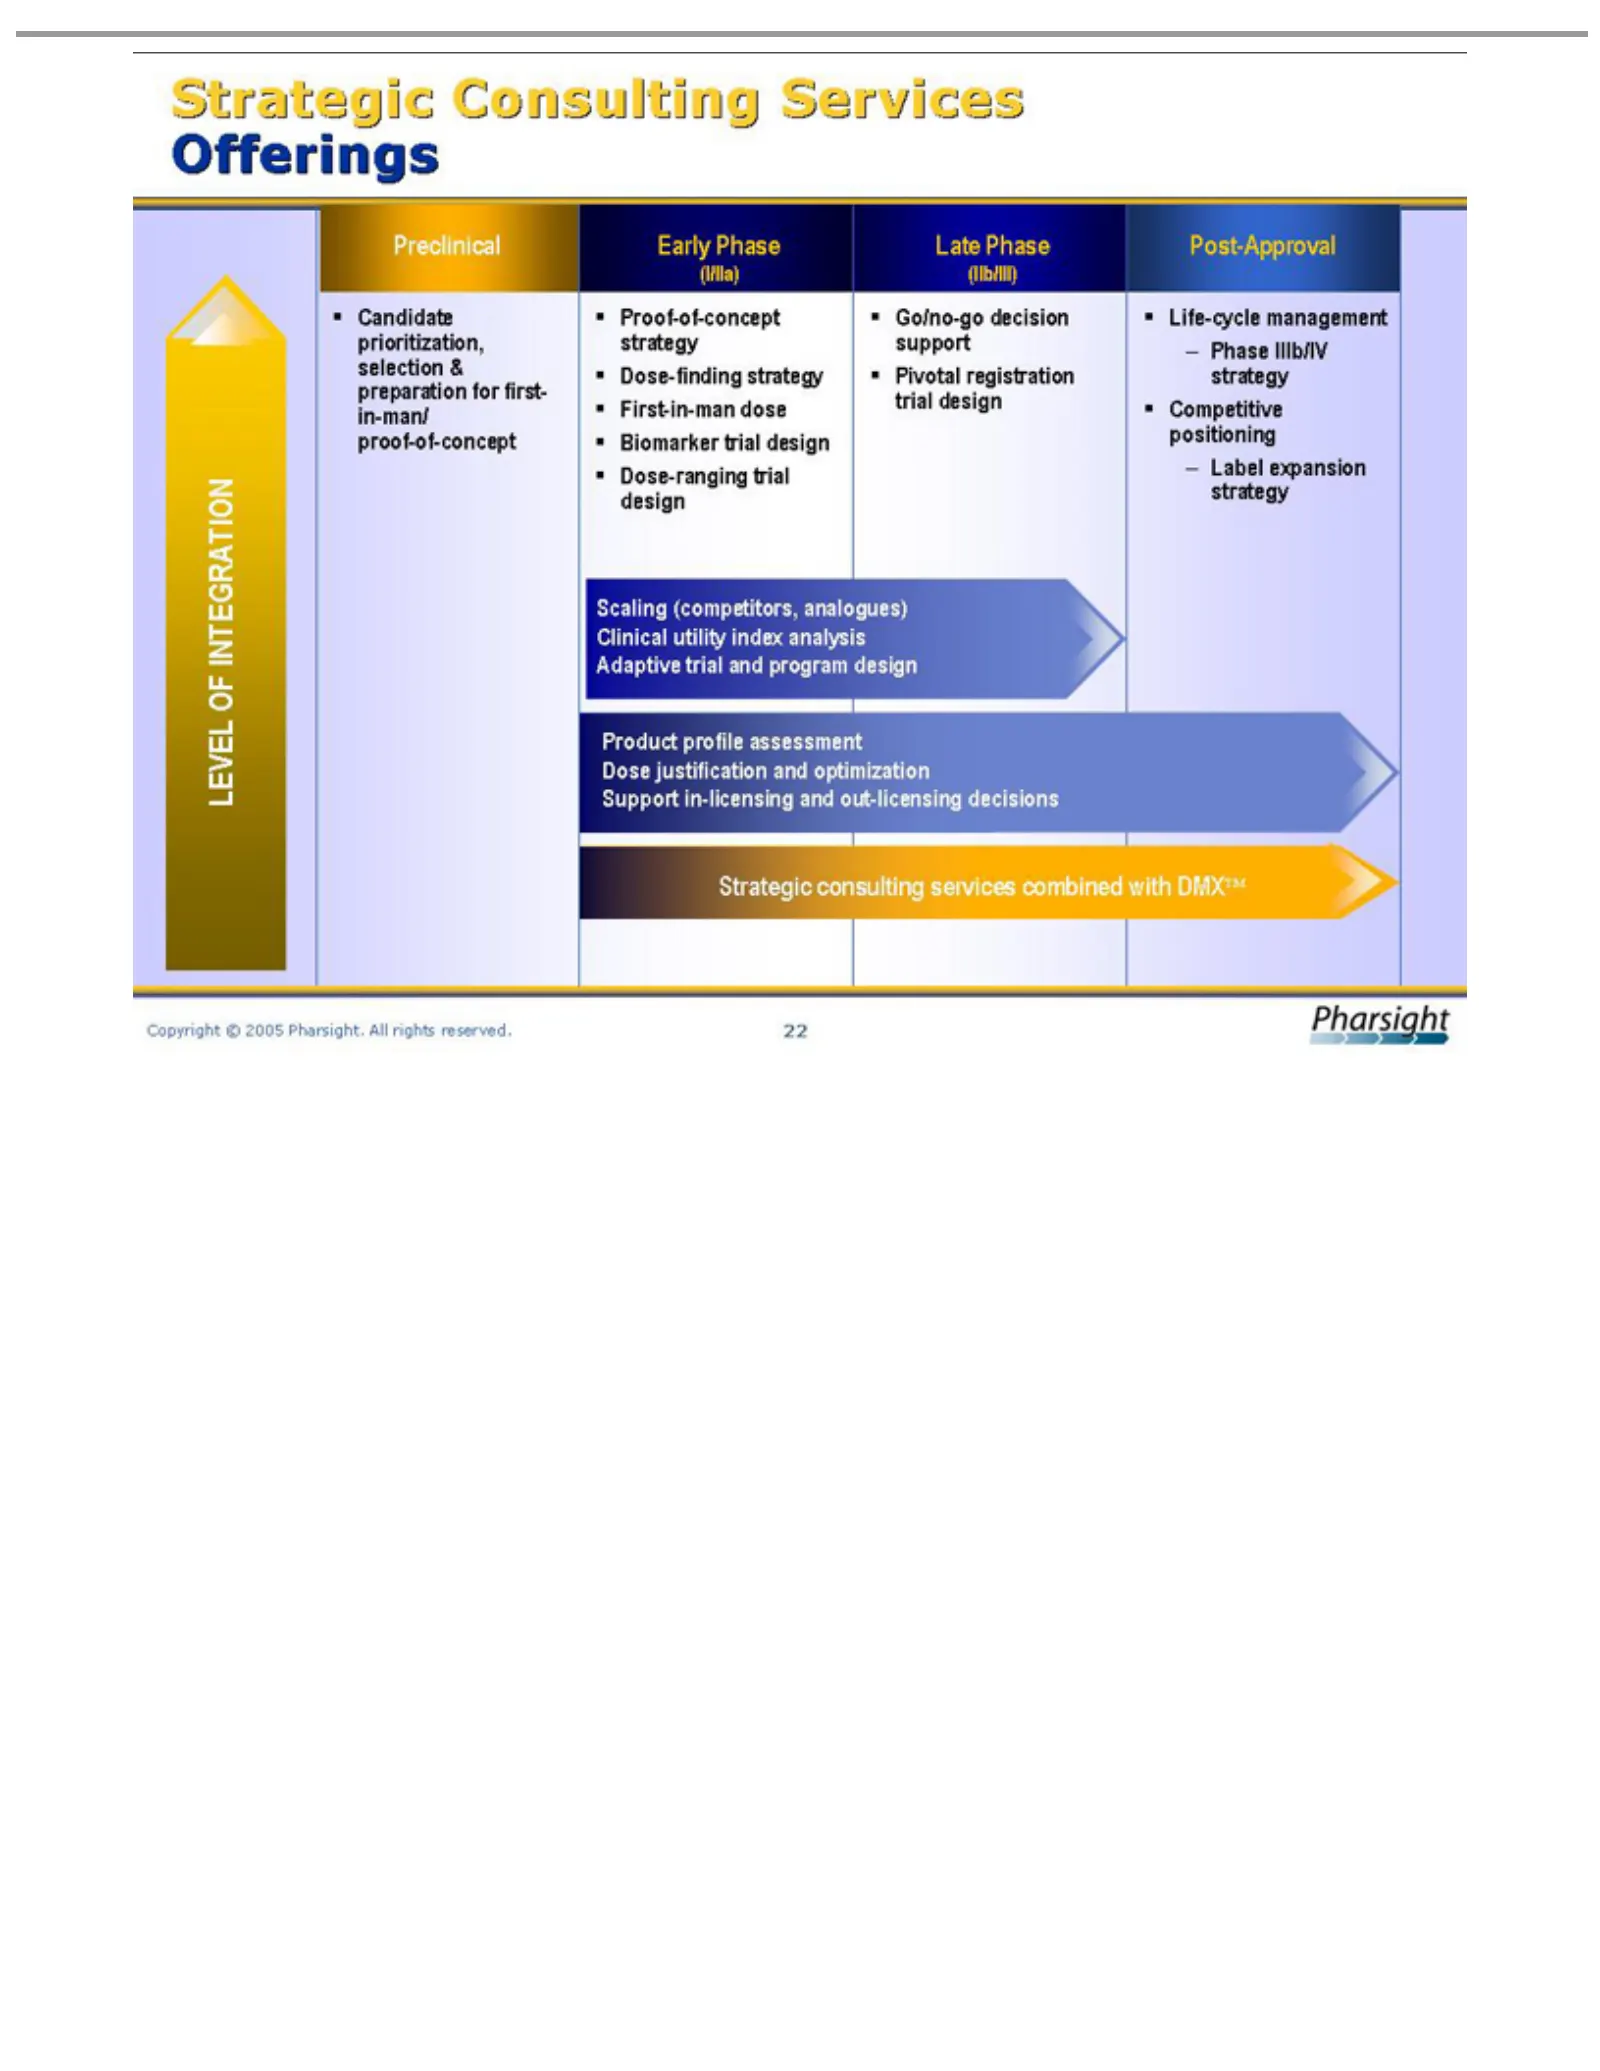
Slide 22: Consulting Services Offerings by Development Phase
EarlyPhase Late (I/IIa) Candidate Preclinical Post-Approval (IIb/III) Life-cycle Phase Competitive Label Go/no-go Pivotal Proof-of-concept Dose-finding First-in-man Biomarker Dose-ranging Scaling Clinical Adaptive LEVEL Product Dose Support Strategic Copyright justification Phase expansion IIIb/IV r
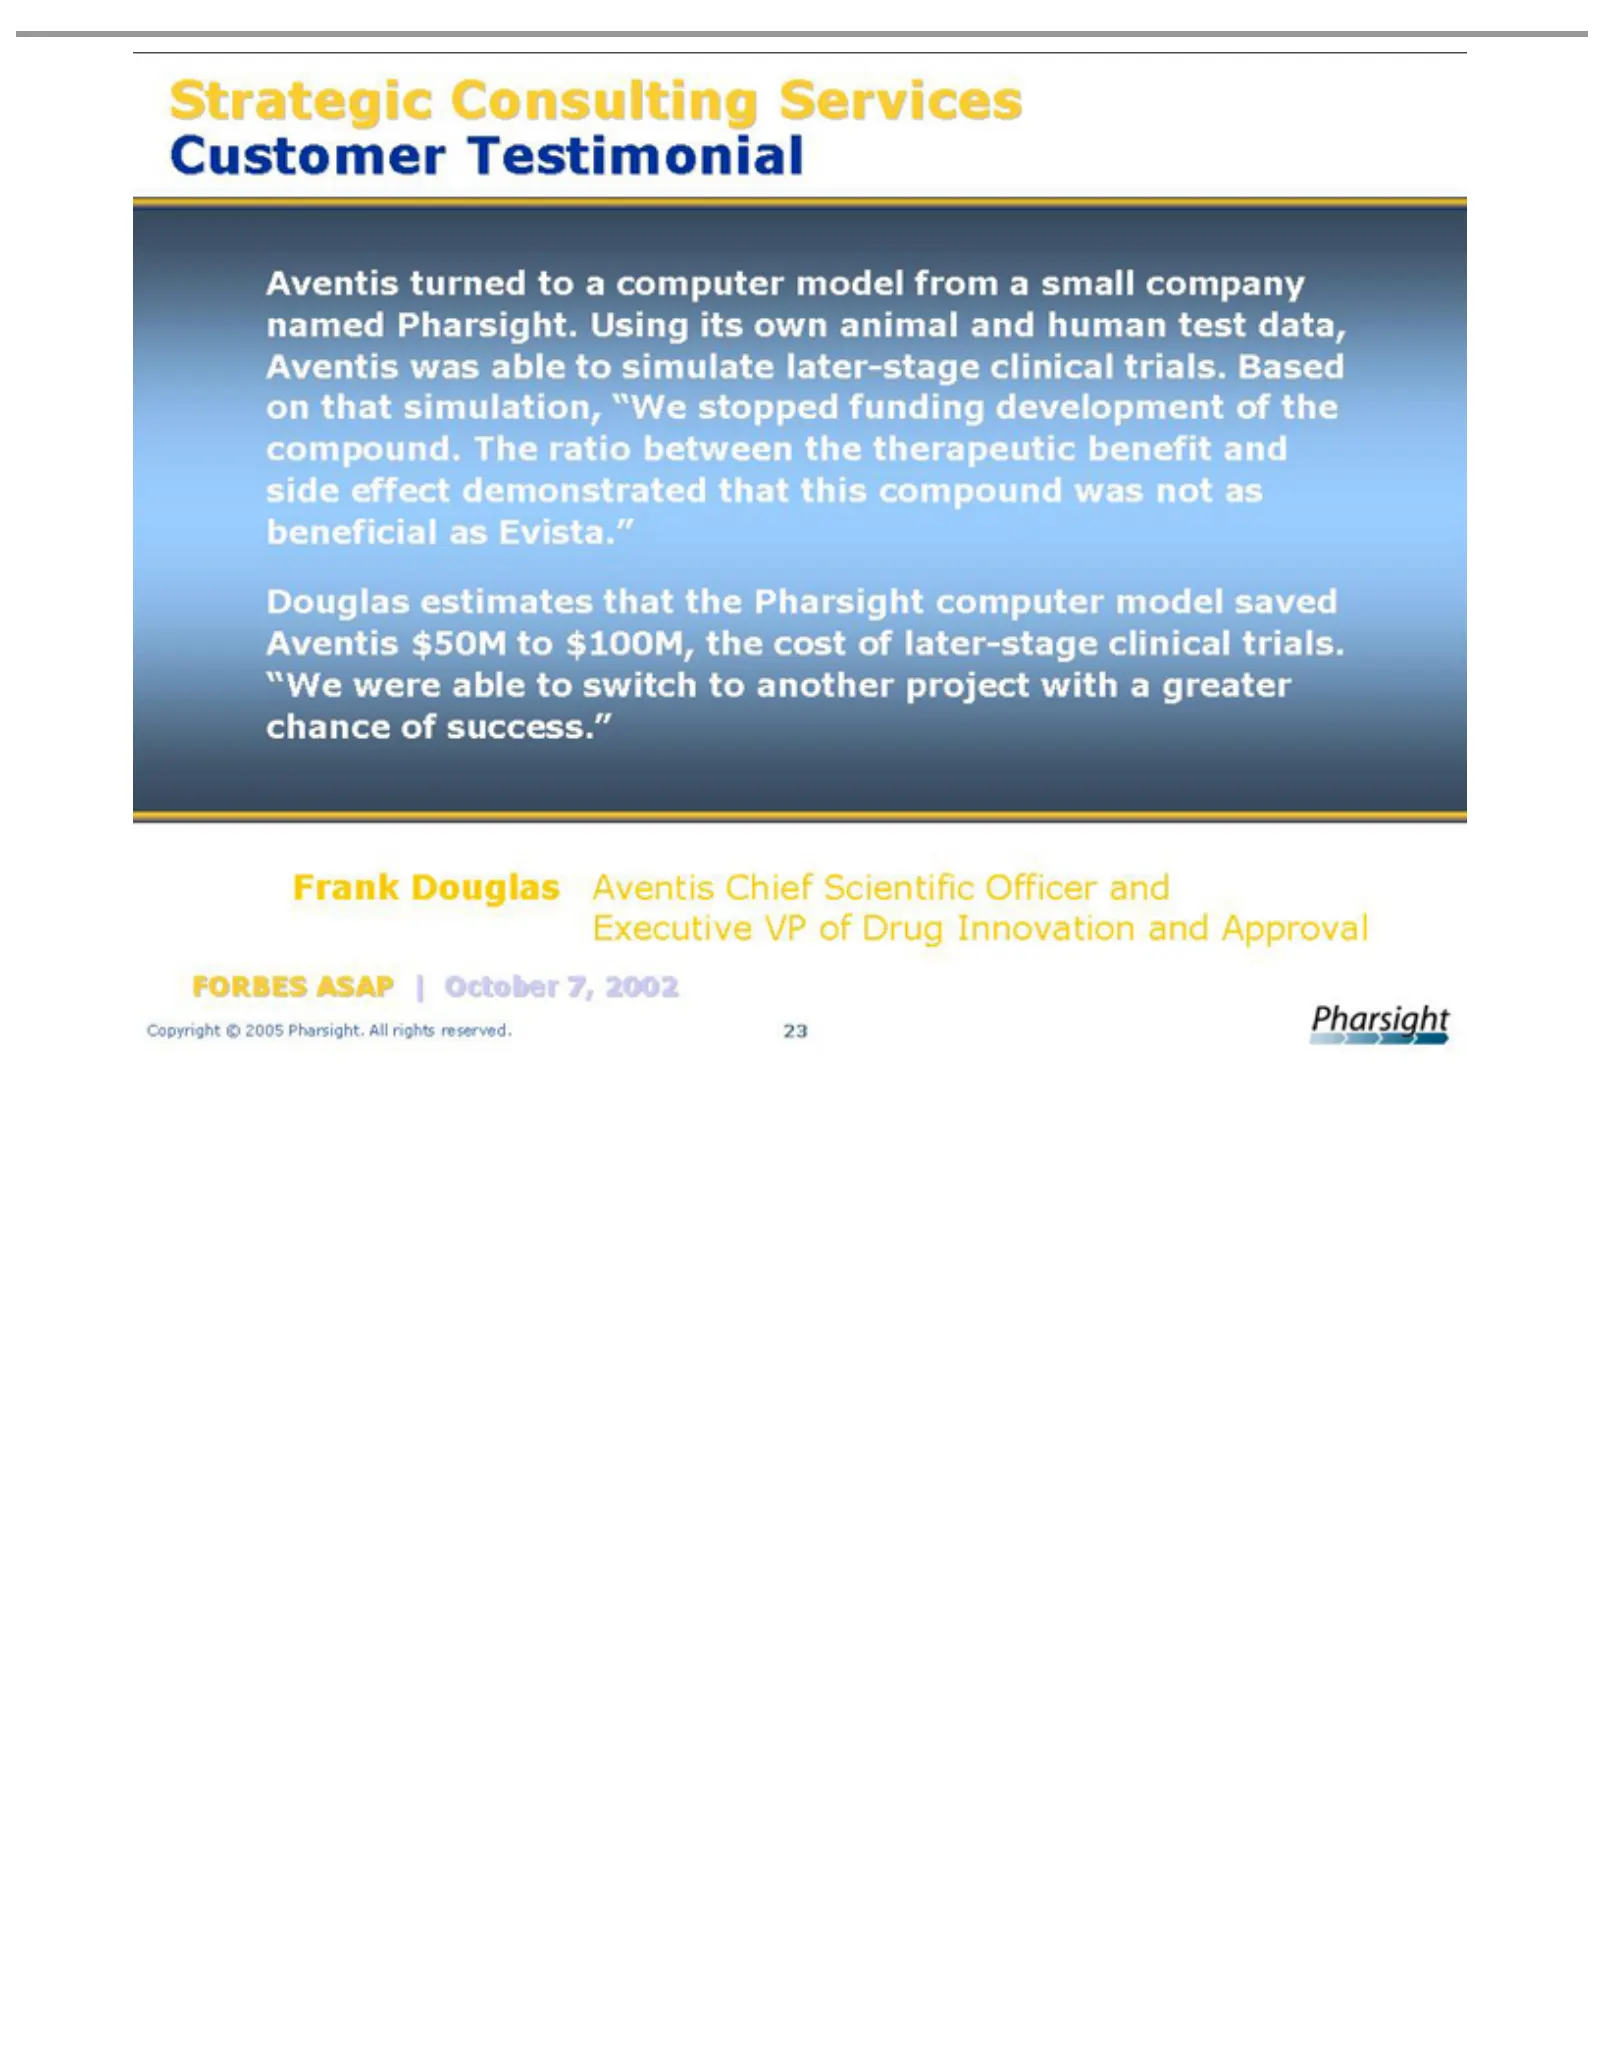
Slide 23: Customer Testimonial: Aventis
Strategic Aventis simulation, Douglas Frank FORBES Copyright Douglas turned estimates Consulting ASAP ©“We 2005 to Aventis stopped | aOctober that Pharsight. computer Services the Chief funding 7, Pharsight 2002 All model Scientific Customer rights development from computer reserved. Officer Testimo
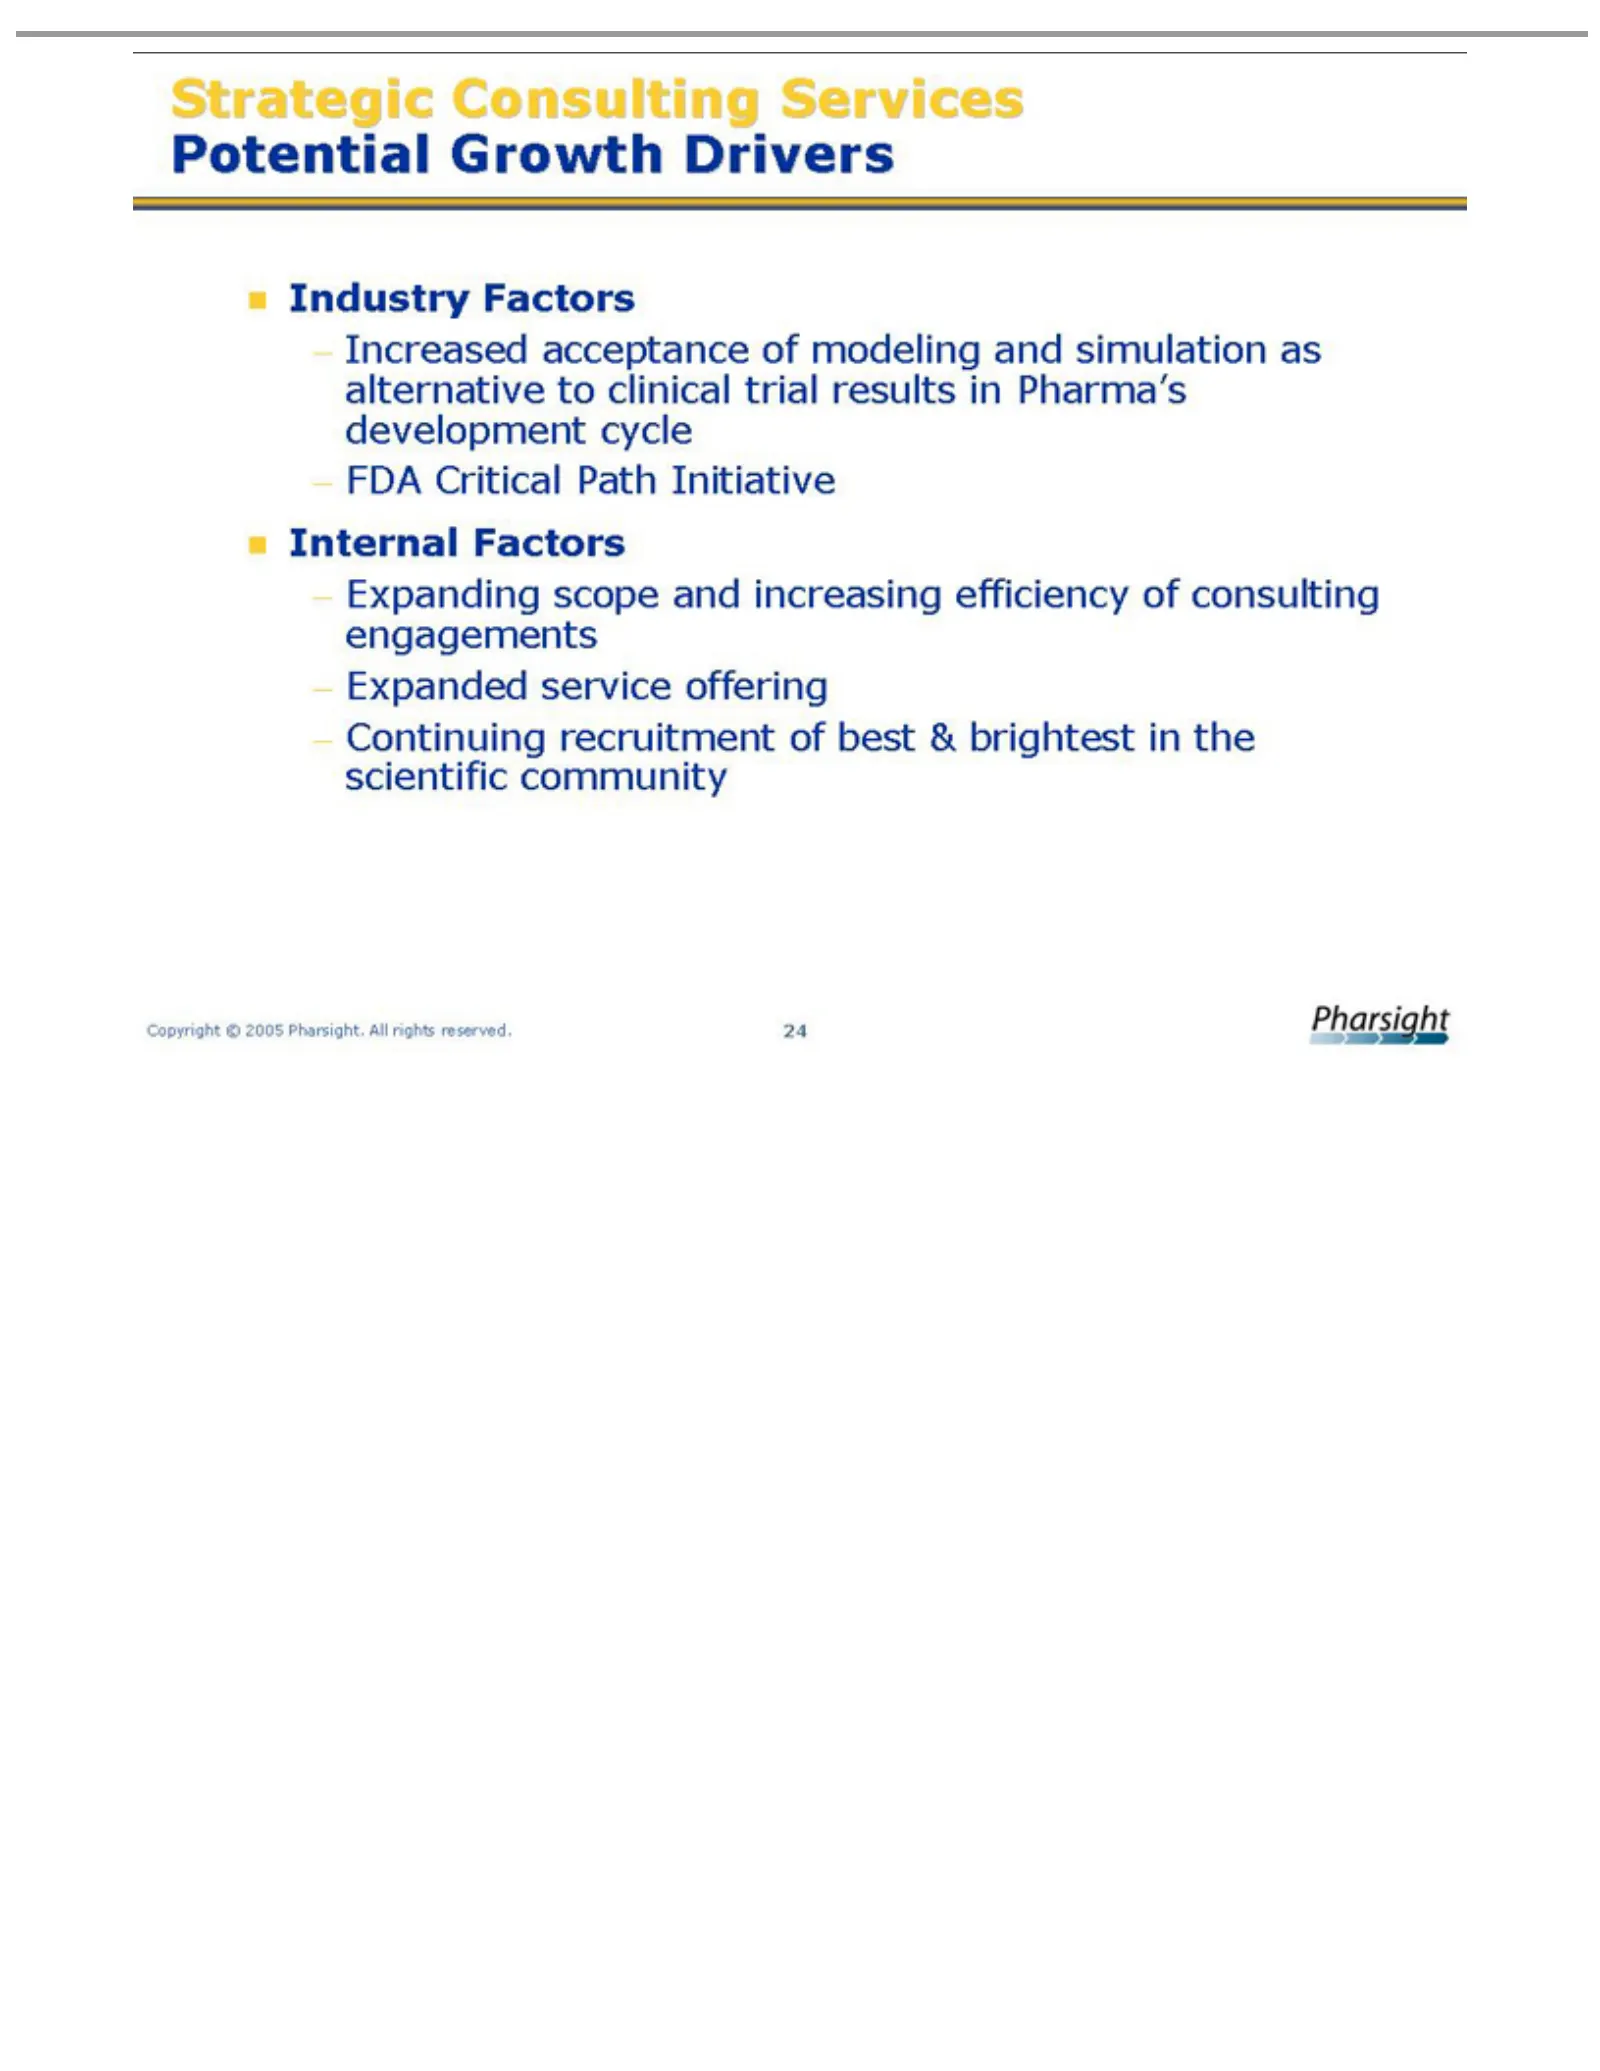
Slide 24: Strategic Consulting Industry Factors and Growth Drivers
Strategic Industry Increased FDA Internal Expanding Expanded Continuing Copyright Critical Factors Factors Consulting acceptance service ©scope recruitment 2005 Pathand offering Initiative Pharsight. Services of increasing of modeling best All Potential &efficiency rights brightest and simulation re
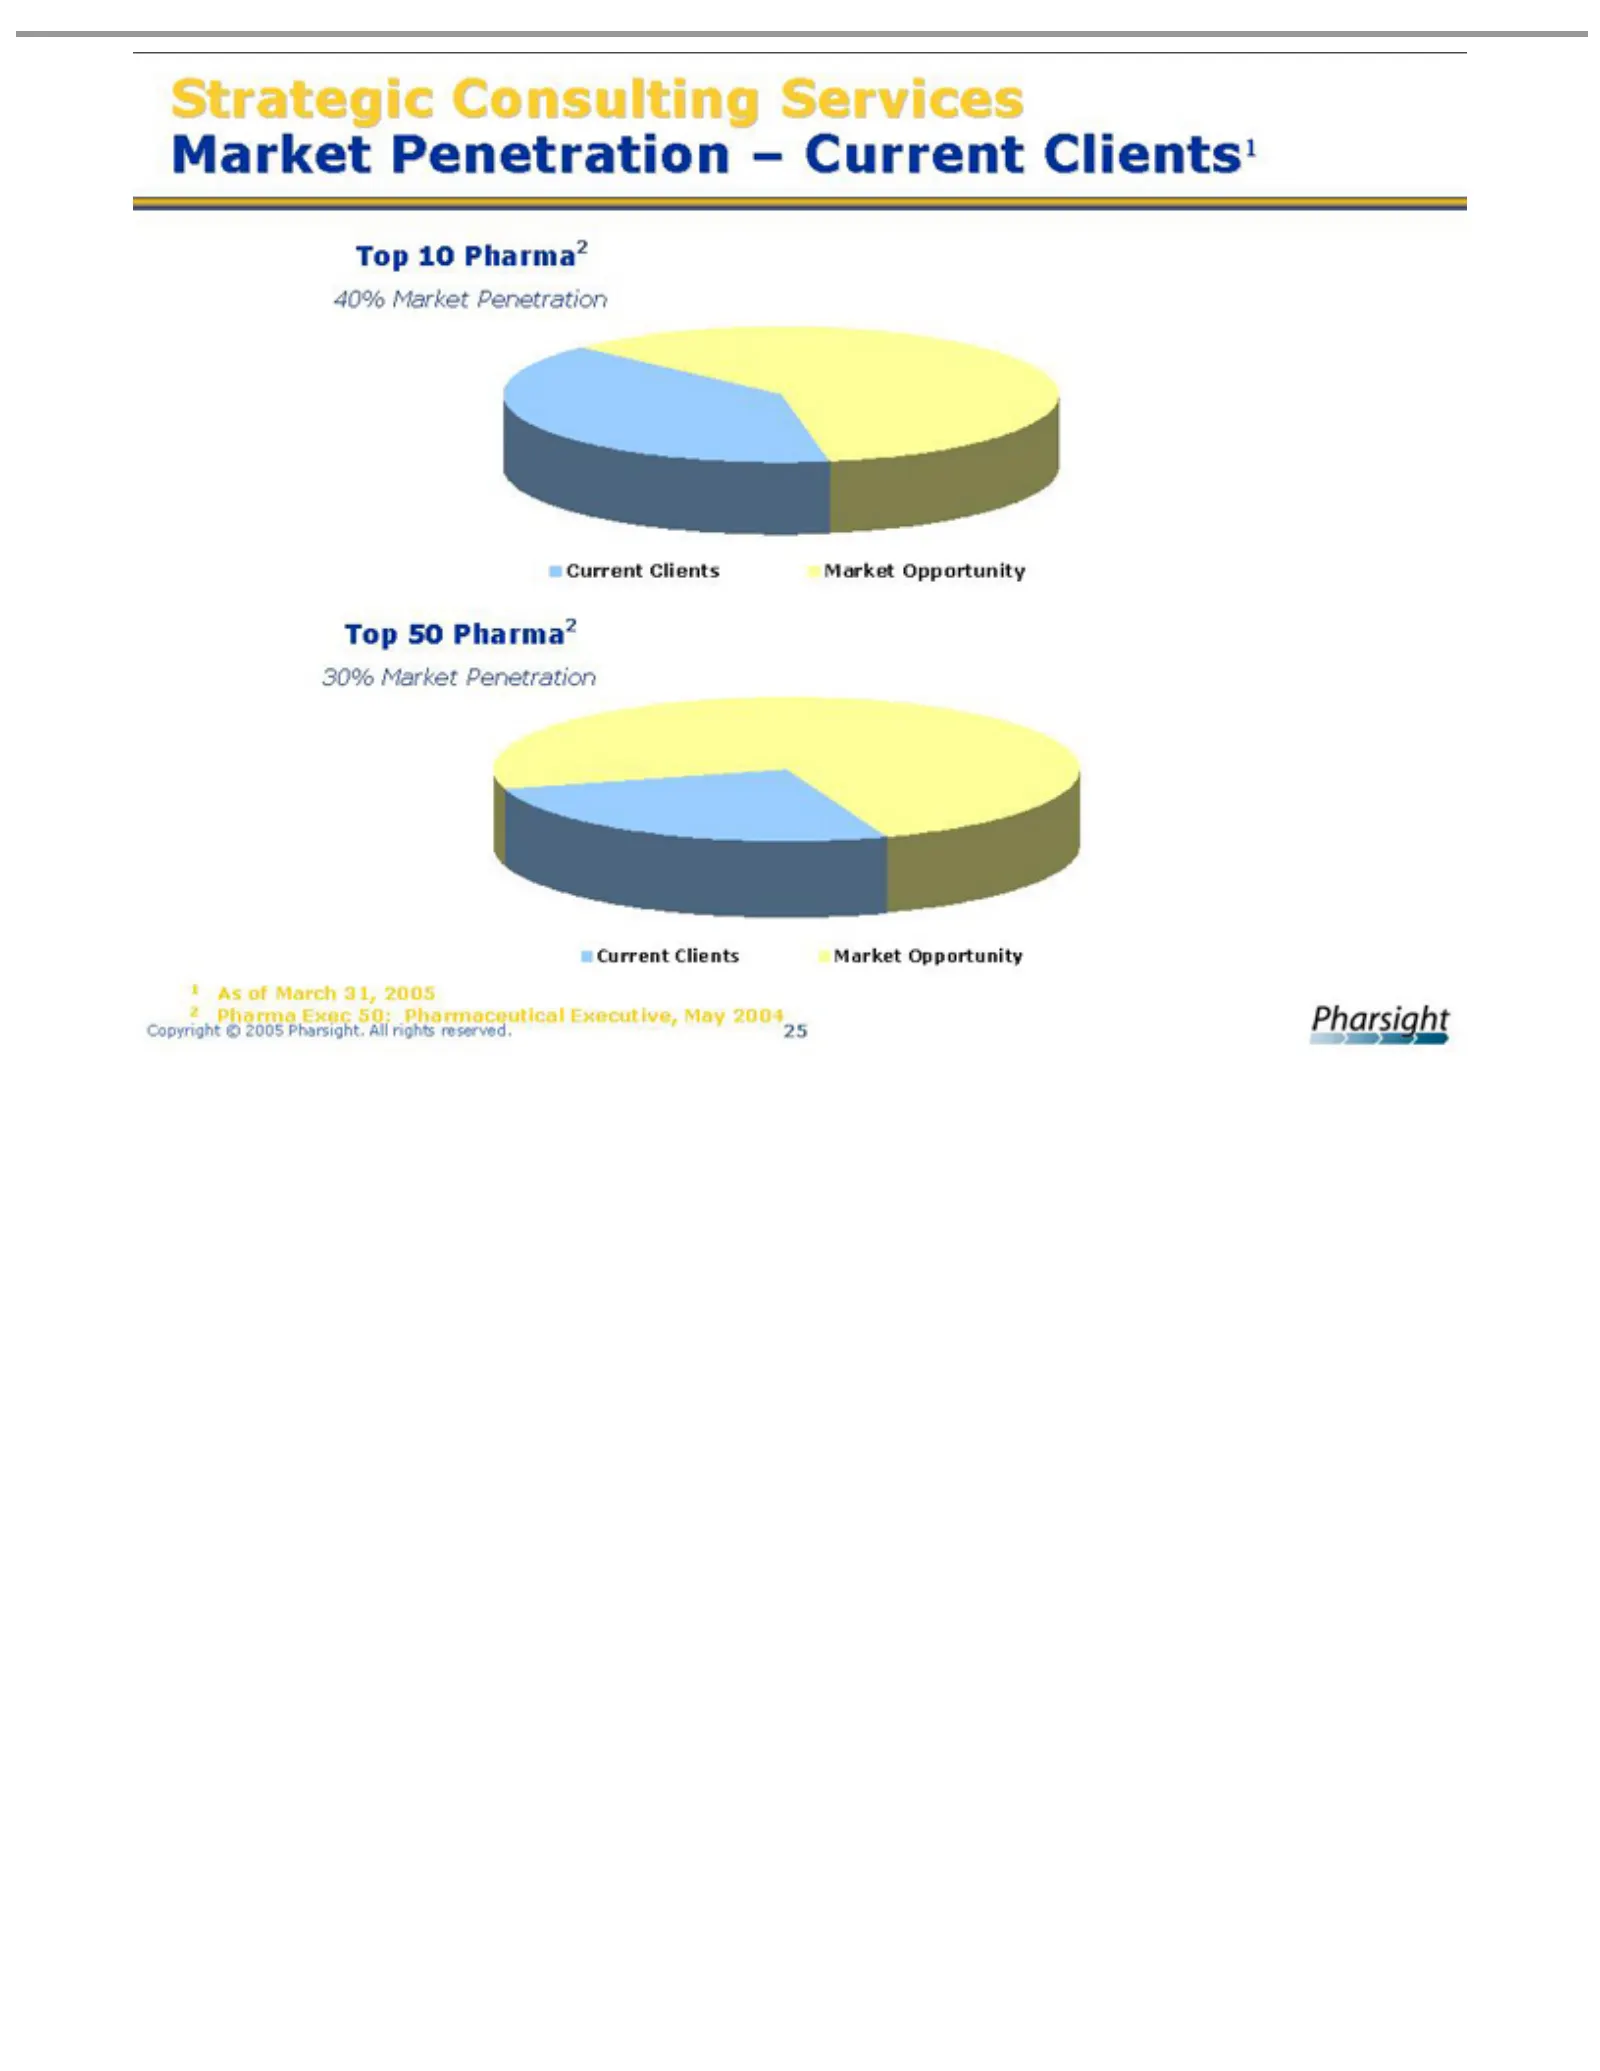
Slide 25: Current Market Penetration
Strategic 40% Top 30% Current Market 1 2 Copyright As Pharma 10 50 of Market Pharma2 Opportunity March Clients Consulting Exec © Penetration 2005 31, 50:2005 Pharsight. Pharmaceutical ServicesAll Market rights Executive, Penetration reserved. May25 – Current 2004 Clients1
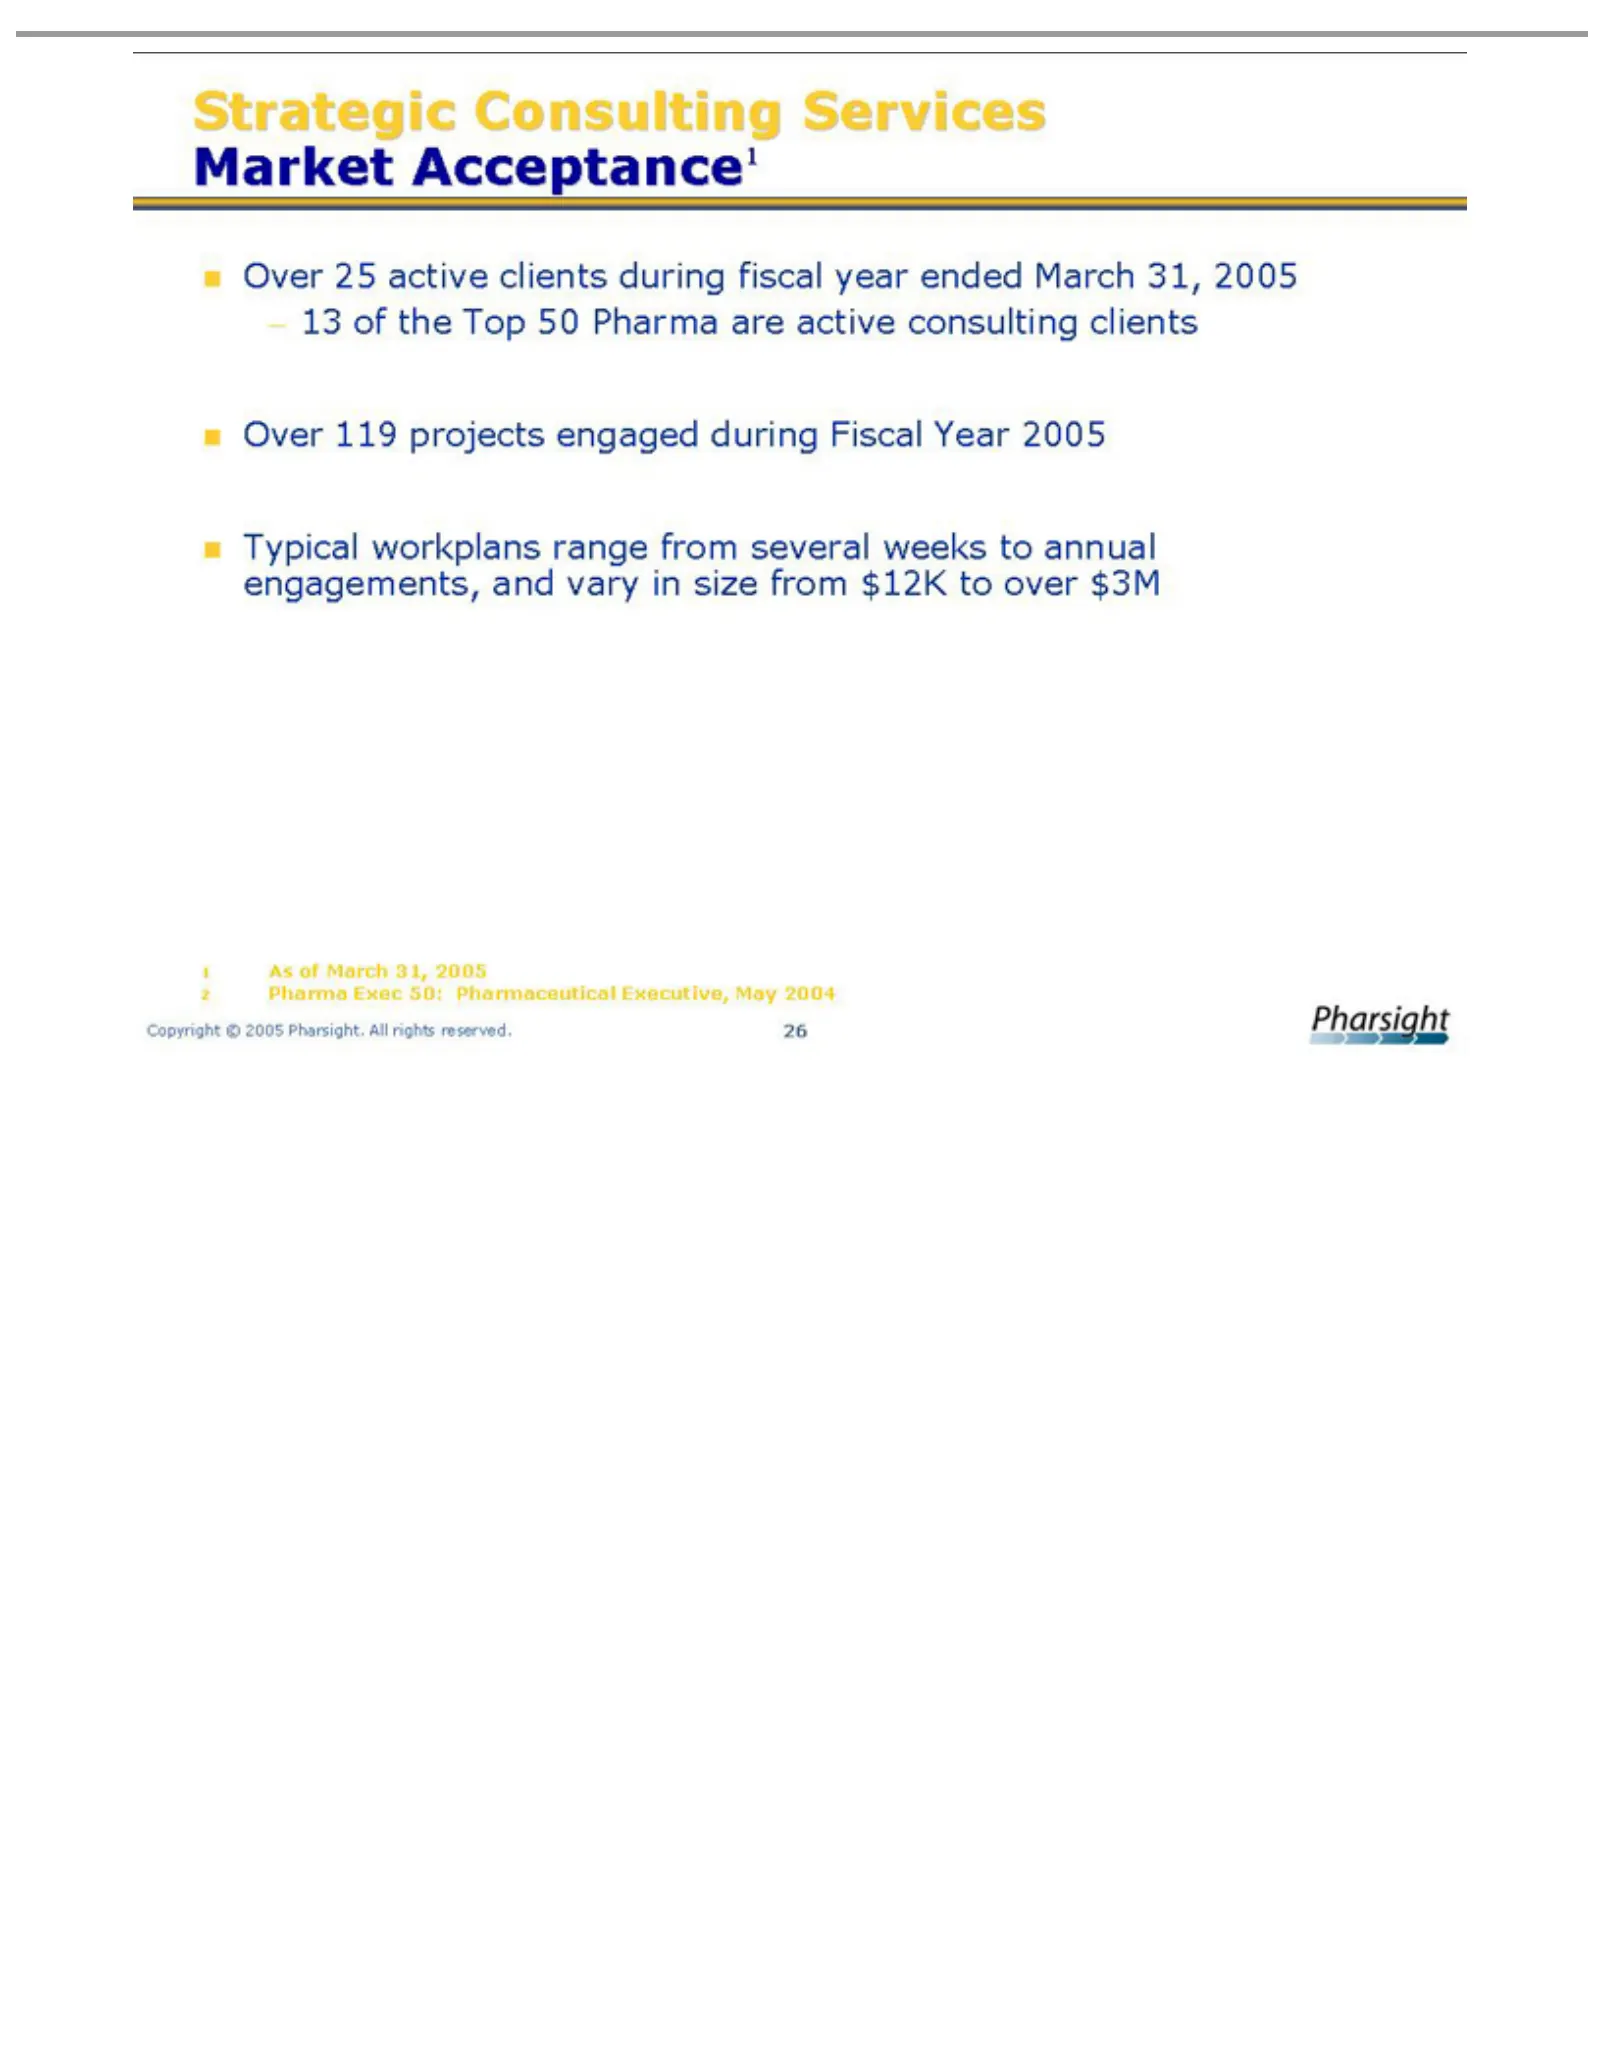
Slide 26: Consulting Projects and Engagements
Strategic 13 Over Typical 1 2 Copyright As Pharma ofof 25 119 theMarch workplans active Top Consulting projects Exec © 2005 5031, clients 50: Pharma engaged 2005 Pharsight. range Pharmaceutical Services during from areduring active All fiscal Market several rights Fiscal consulting Executive, year A
Slide 27: Pharsight Financial Overview
Pharsight Financial Overview
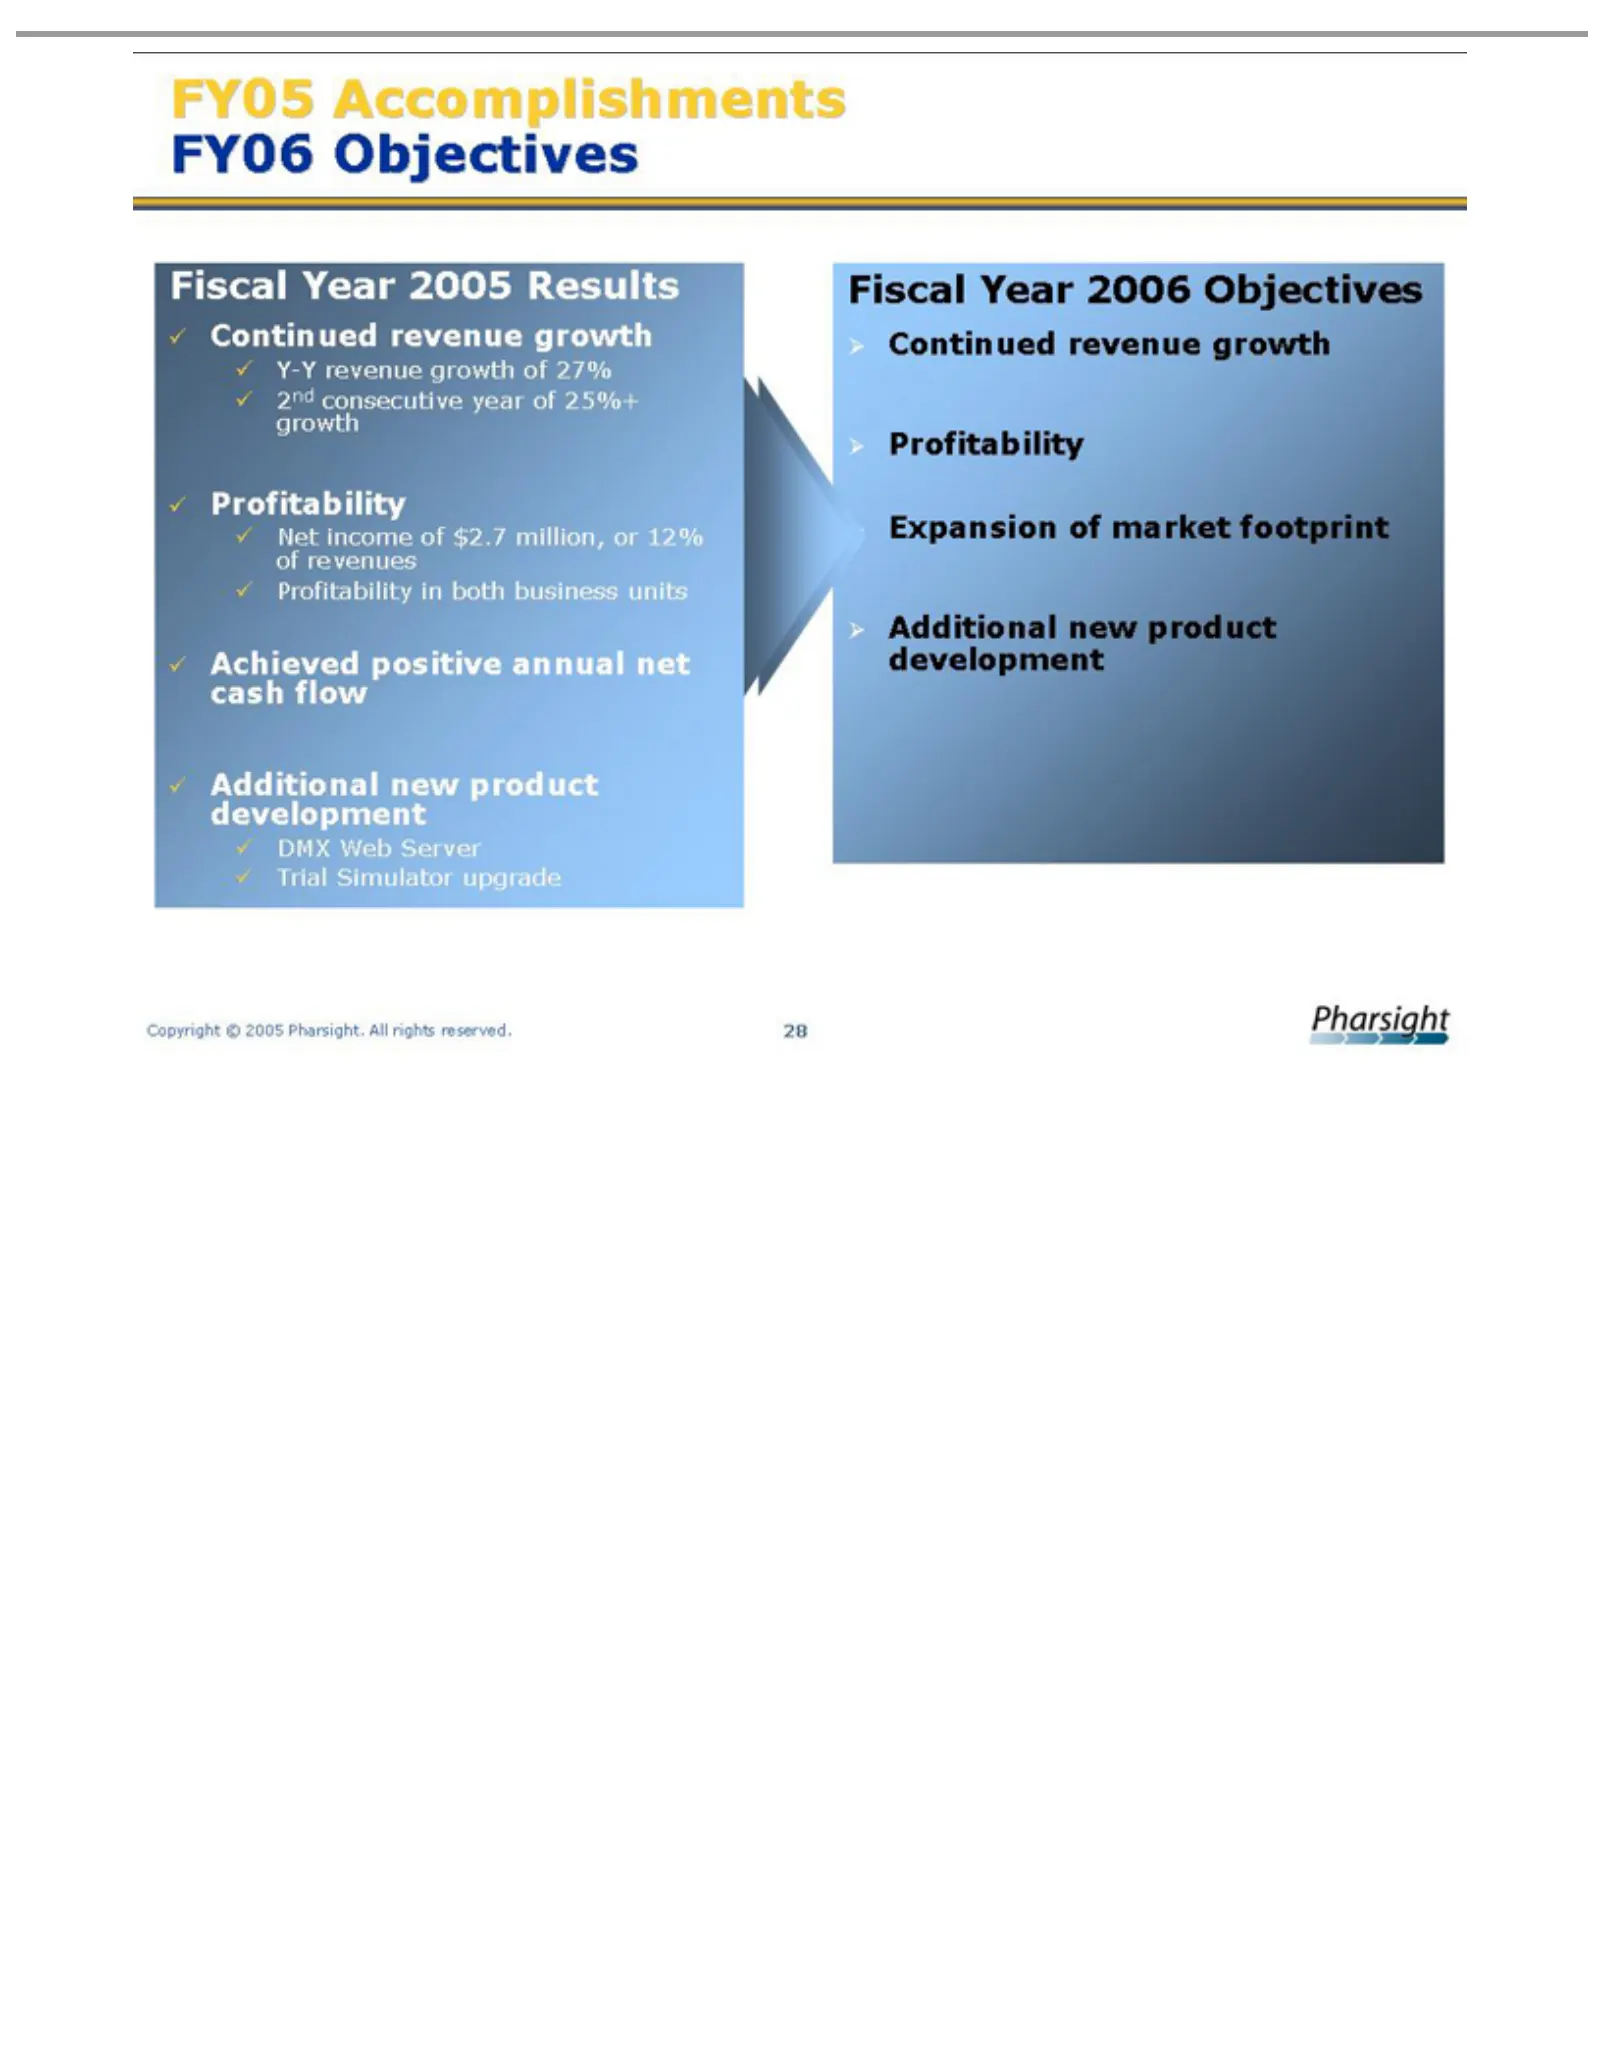
Slide 28: FY05 Accomplishments and FY06 Objectives
FY05 FY06 Y-Y 2nd Net Achieved DMX Trial Fiscal Continued Expansion Profitability Additional Copyright income consecutive revenue Simulator Accomplishments Objectives Web Yearpositive © revenue of new Server 2005 2006 of in growth 2005 market $2.7 both upgrade product year Results Objectives annual
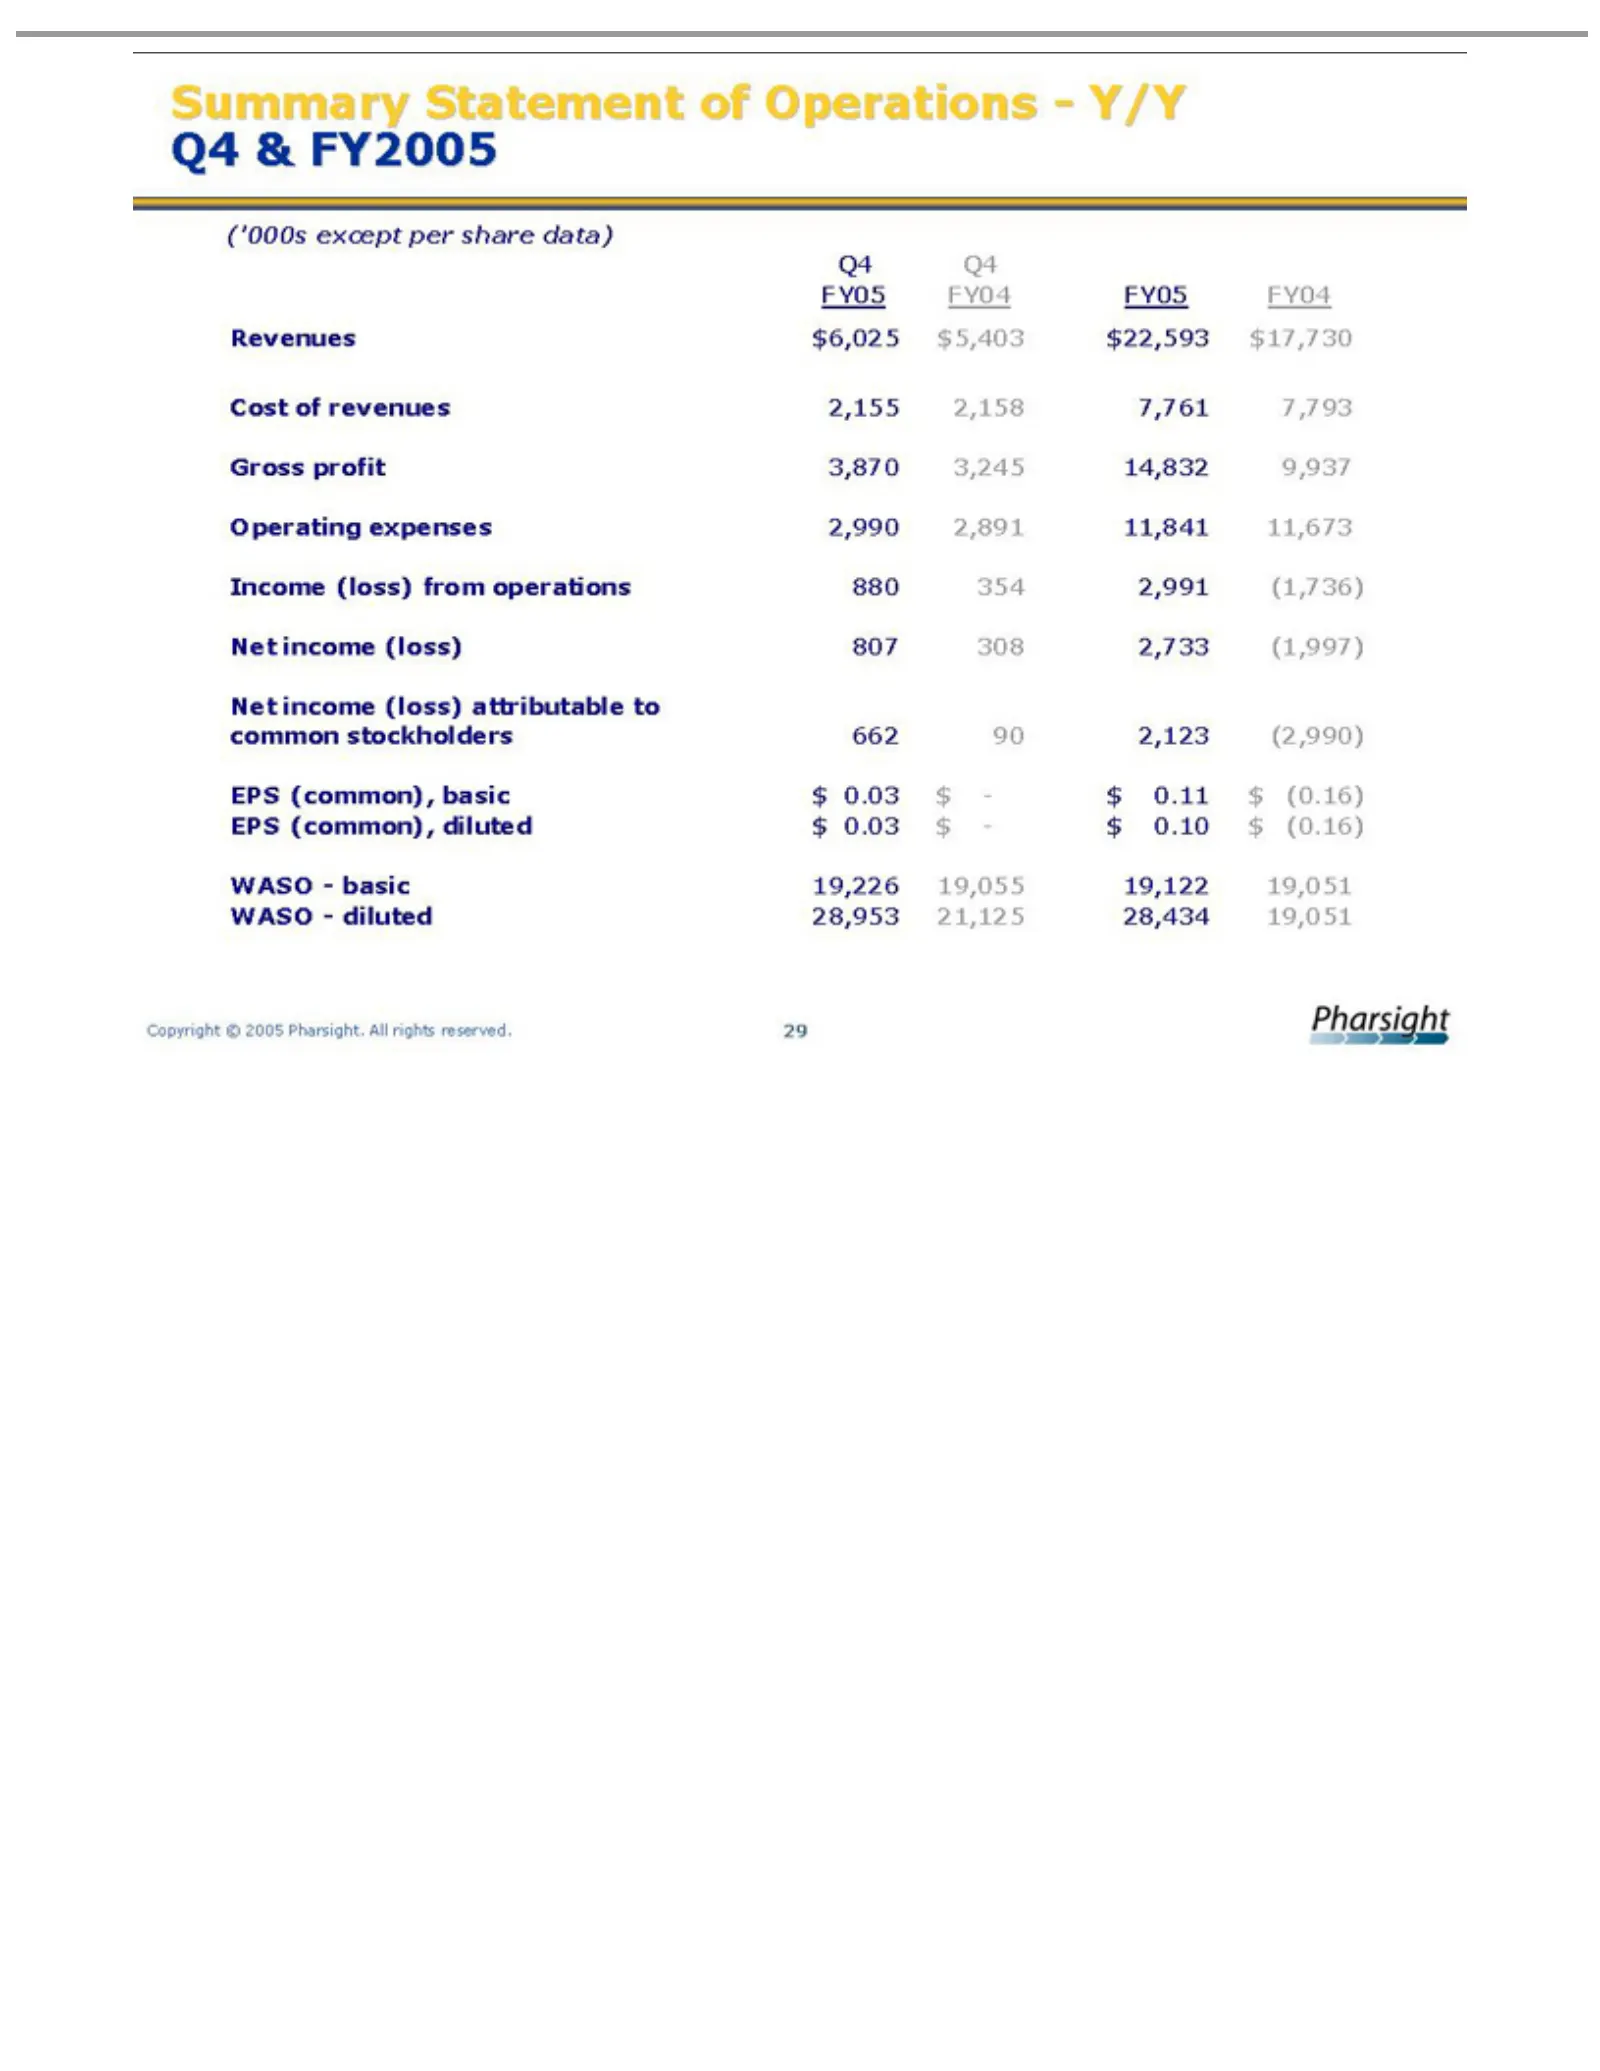
Slide 29: Summary Statement of Operations Q4 & FY2005
Summary (‘000s Cost 2,155 2,158 7,761 7,793 Revenues $6,025 $5,403 $22,593 $17,730 FY04 FY05 Q4 Gross 3,870 3,245 14,832 9,937 Operating 2,990 2,891 11,841 11,673 Income 880 354 2,991 (1,736) 807 308 2,733 (1,997) Net common 662 90 2,123 (2,990) $(0.16) $ EPS 19,226 19,055 19,122 WASO 19,051 28,434
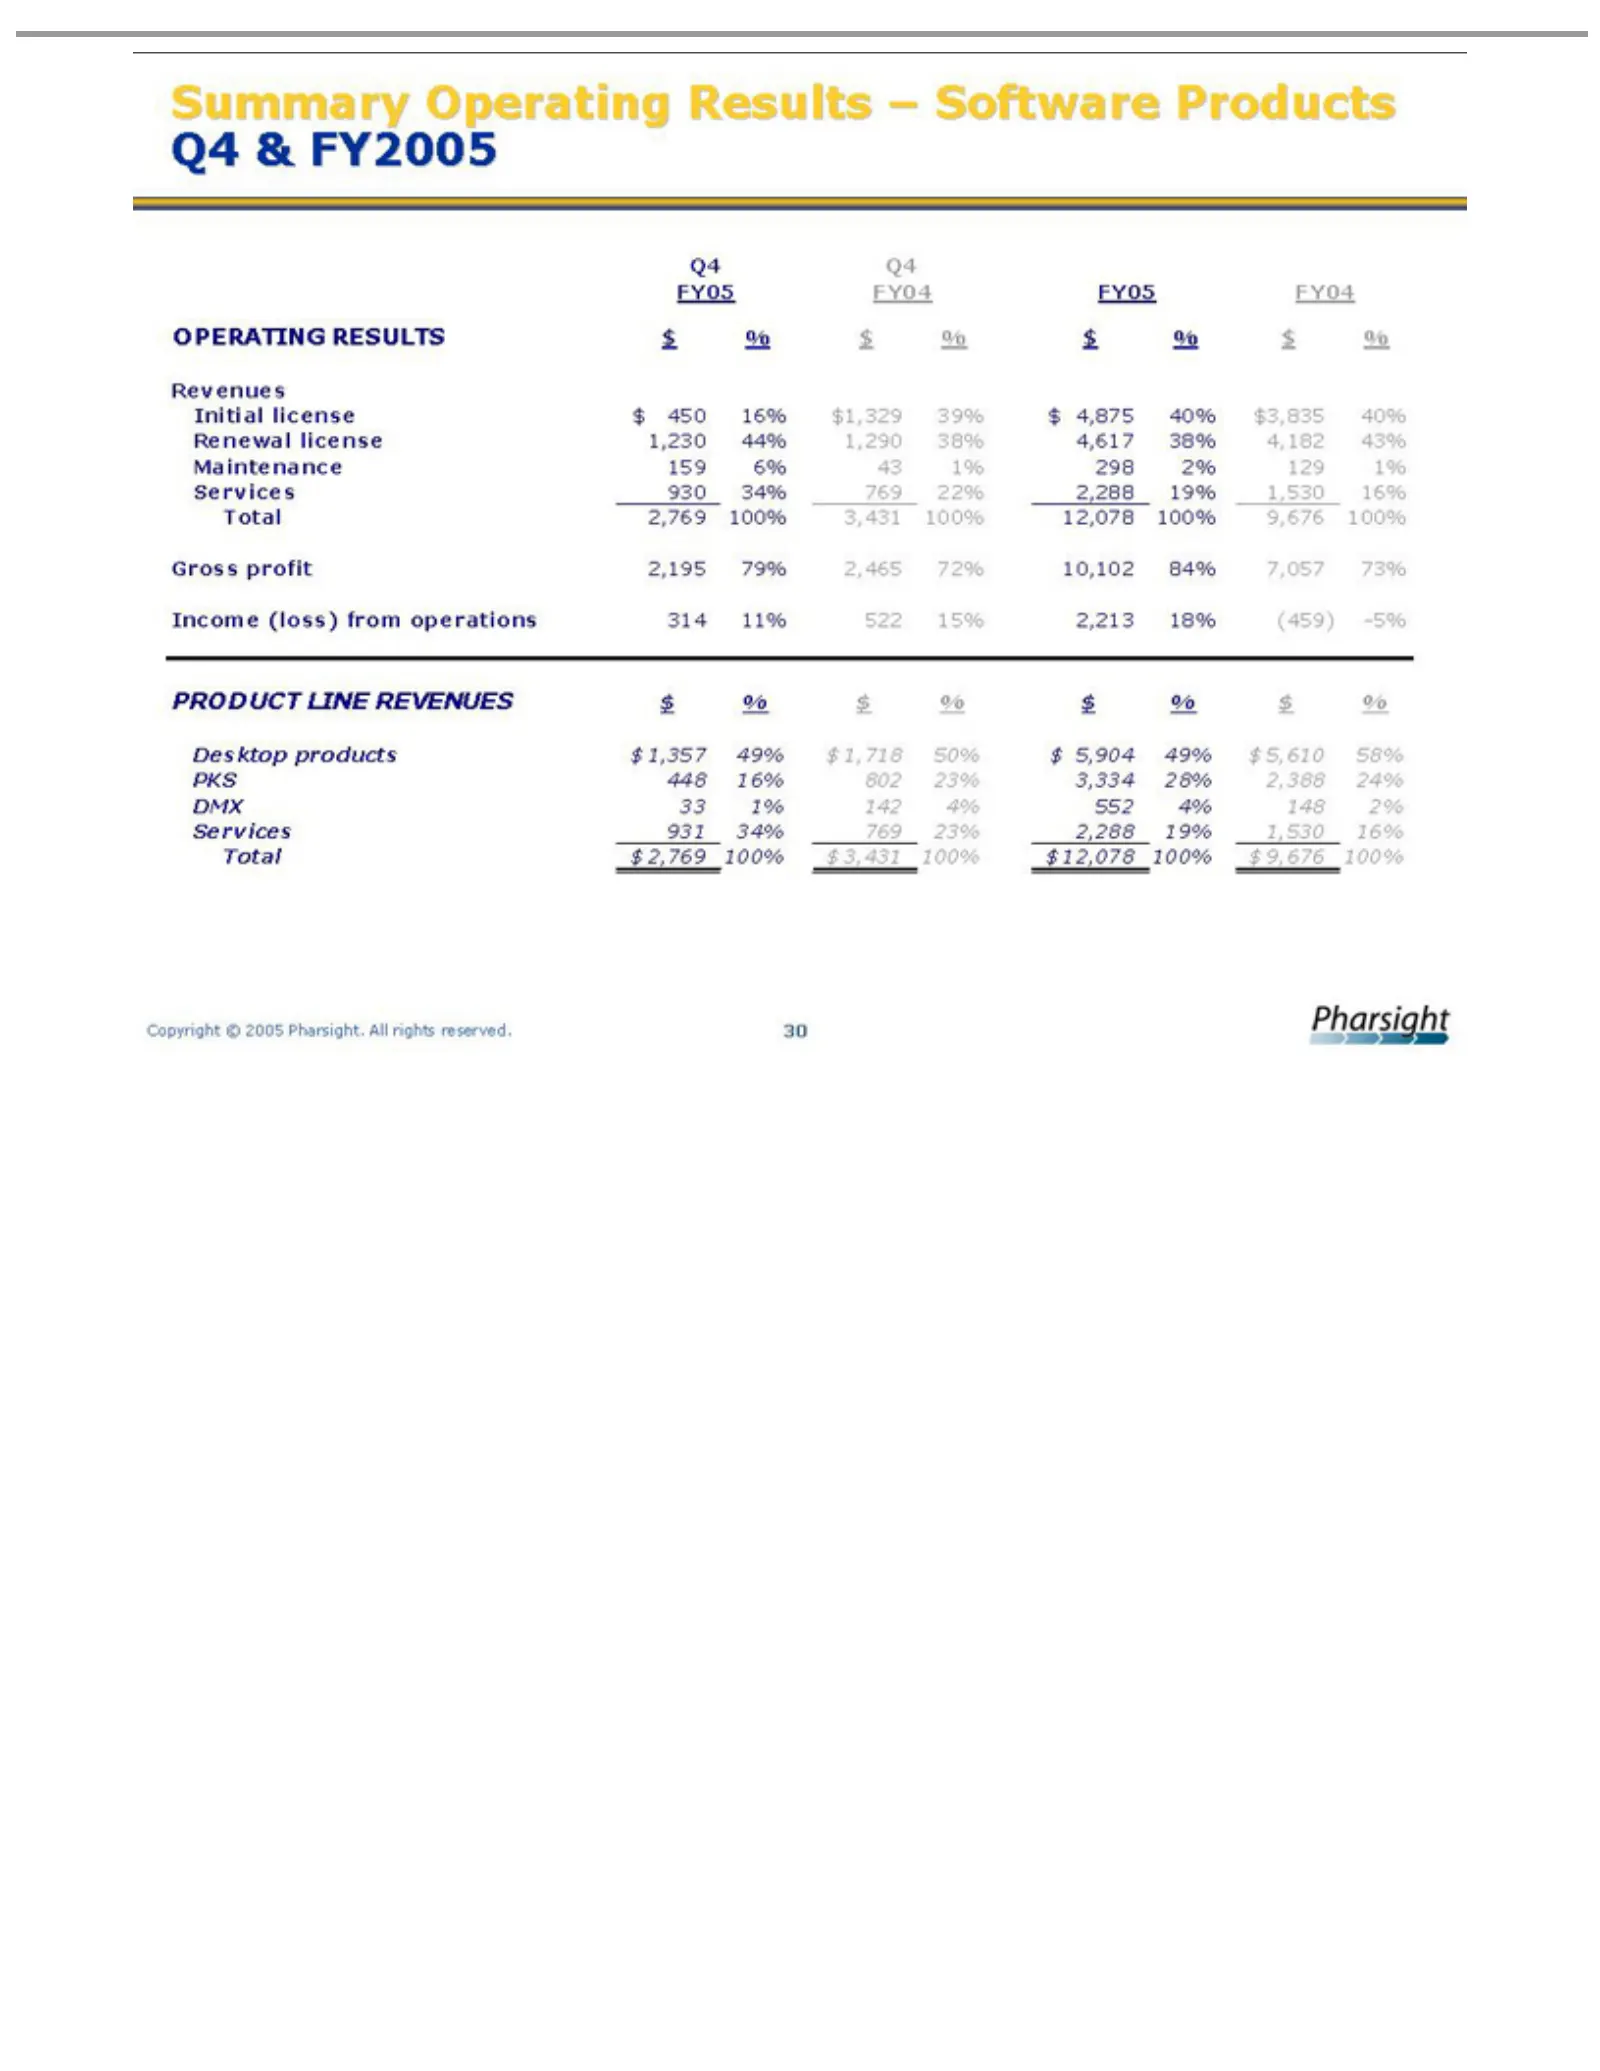
Slide 30: Software Products Results Q4 & FY2005
Summary O FY04 FY05 Q4 Revenues 39% 4 Initial Renewal 1,230 44% 1,290 4,617 38% 4,182 40% Gross 2,195 79% 2,465 72% 10,102 84% 7,057 2,769 3,431 12,078 9,676 930 22% Maintenance 159 6% 43 298 129 43% Income 314 11% 522 15% 2,213 18% (459) 73% P % -5% 5 50% 49% Desktop 9 Services 931 34% 769 2,288 19
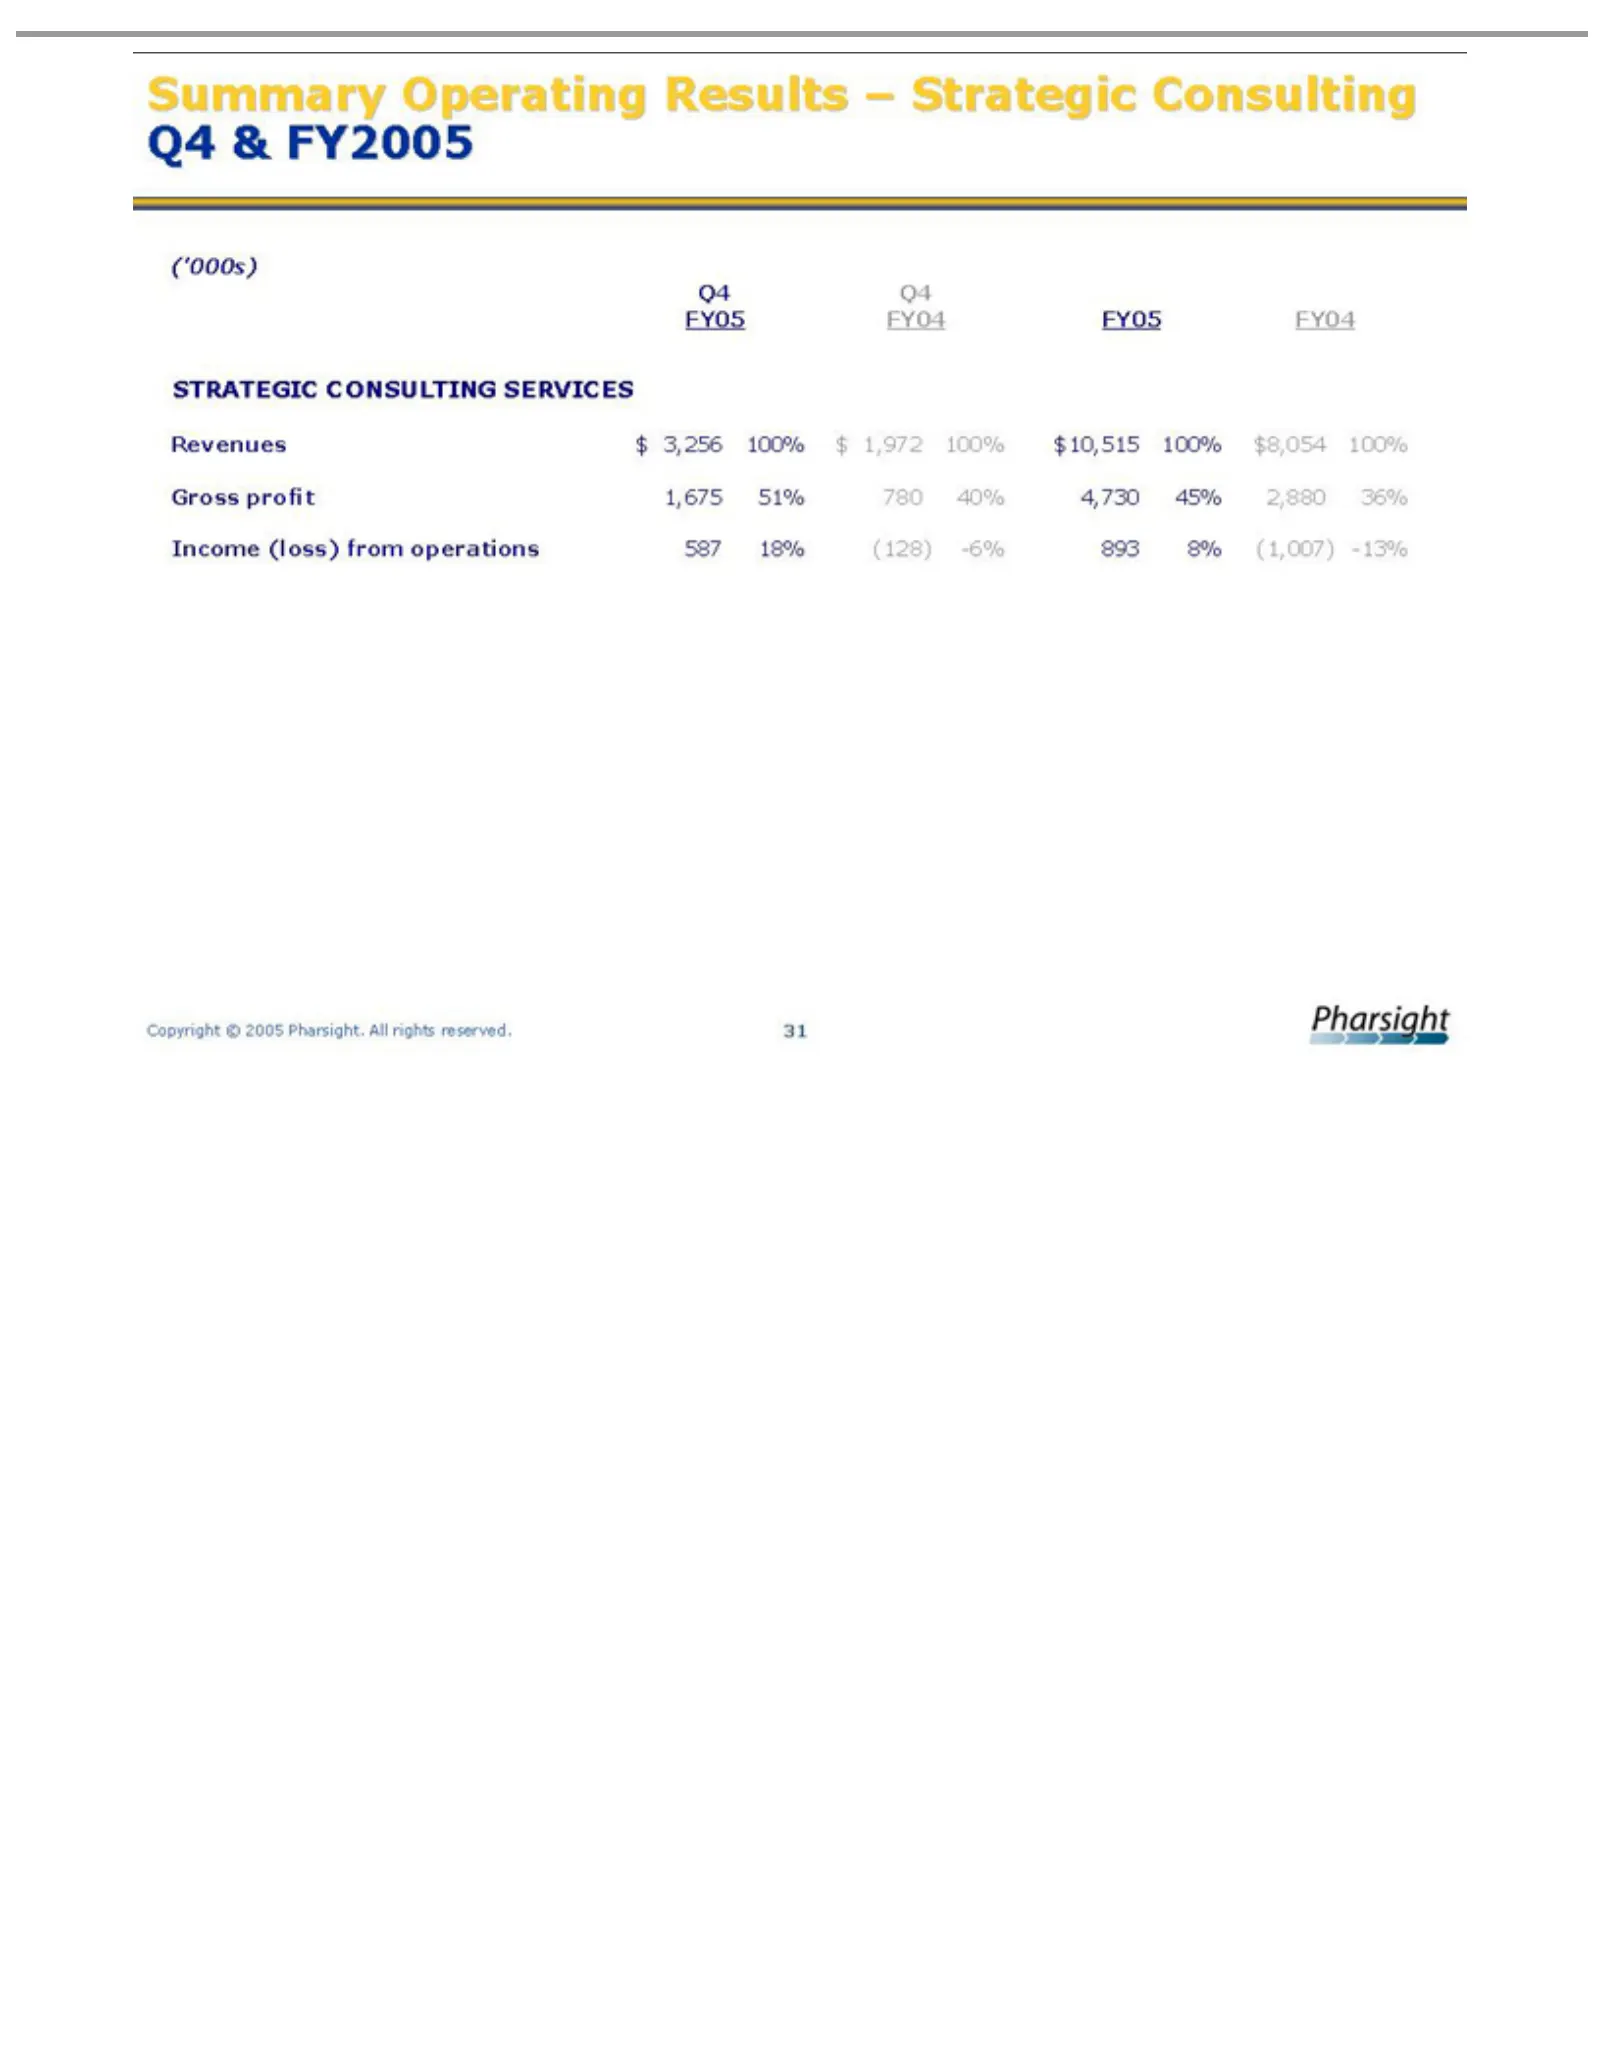
Slide 31: Strategic Consulting Services Results
Summary STRATEGIC FY04 FY05 Q4 (‘000s) 8 1 3 $ Gross 1,675 51% 780 40% 4,730 45% 2,880 100% Revenues Income -13% 36% Copyright (1,007) 8% 893 -6% (128) 18% 587 ,054 profit 0,515 ,972 ,256 (loss) Operating © 2005 CONSULTING fromPharsight. operations Results –All SERVICES Strategic rights reserved.31
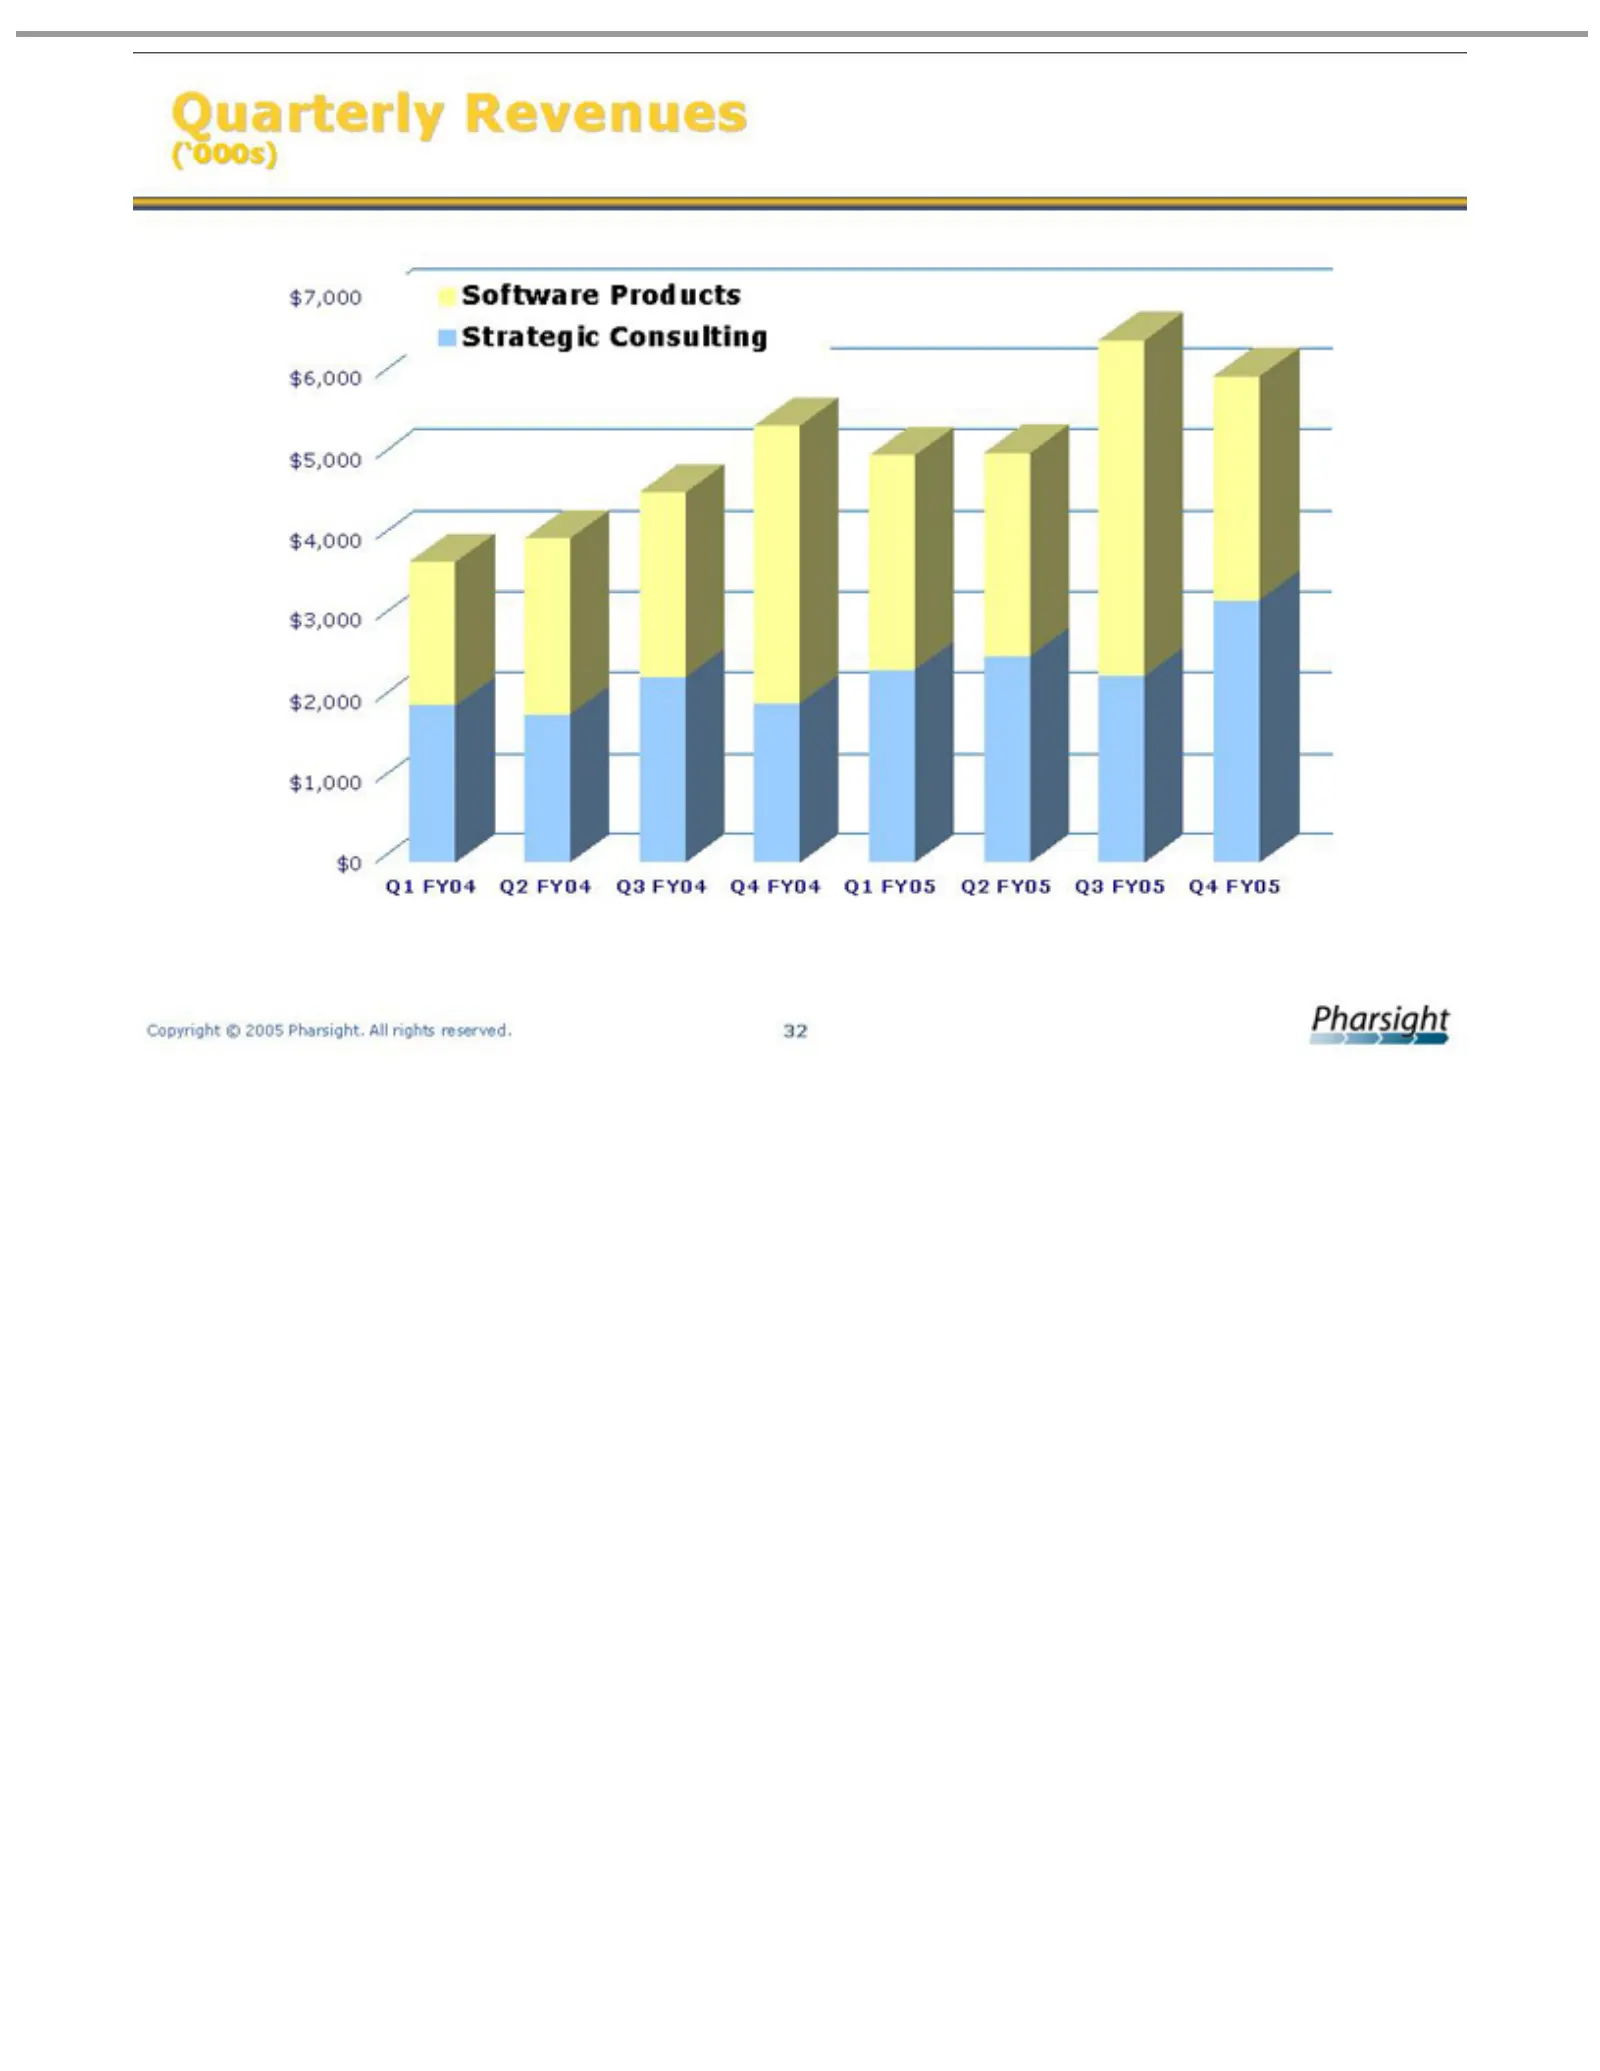
Slide 32: Quarterly Revenues by Segment
Quarterly Software (‘000s) Strategic $7,000 $0 $1,000 $2,000 $3,000 $4,000 $5,000 $6,000 Q4 Q1 Q2 Q3 Copyright FY05 Consulting FY04 Products Revenues © 2005 Pharsight. All rights reserved. 32
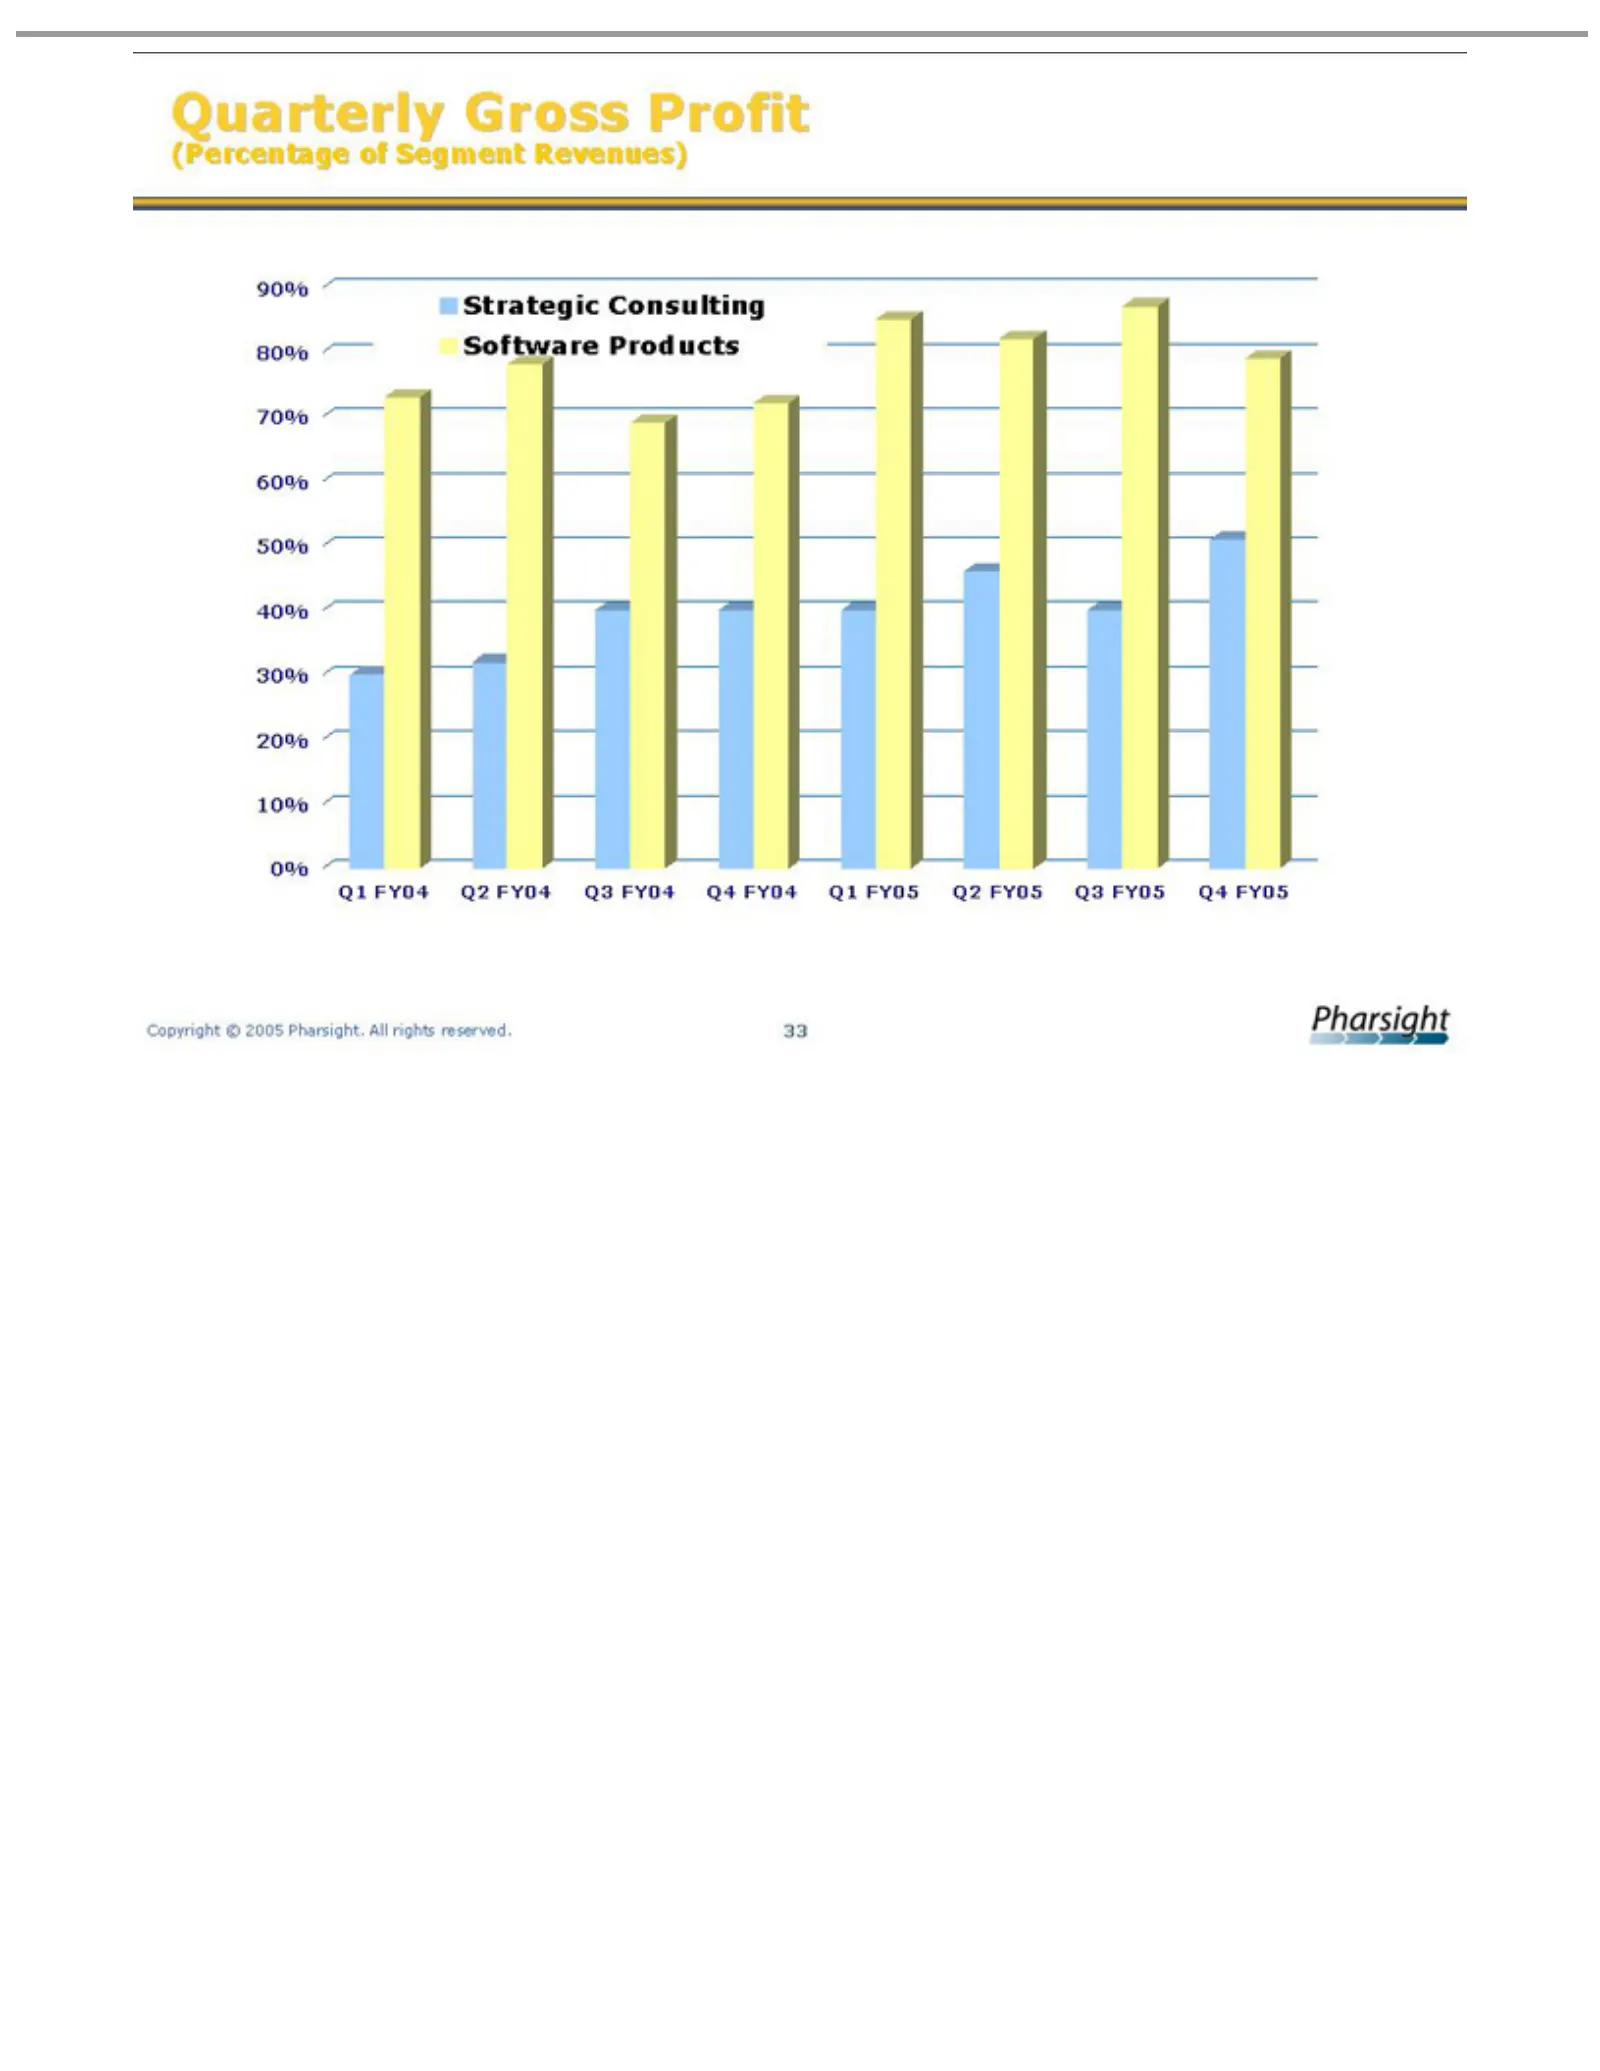
Slide 33: Quarterly Segment Gross Profit
Quarterly (Percentage Strategic Software 90% 0% 10% 20% 30% 40% 50% 60% 70% 80% Q4 Q1 Q2 Q3 Copyright FY04 Consulting FY05 Products Gross ©of2005 Segment Profit Pharsight. Revenues) All rights reserved. 33
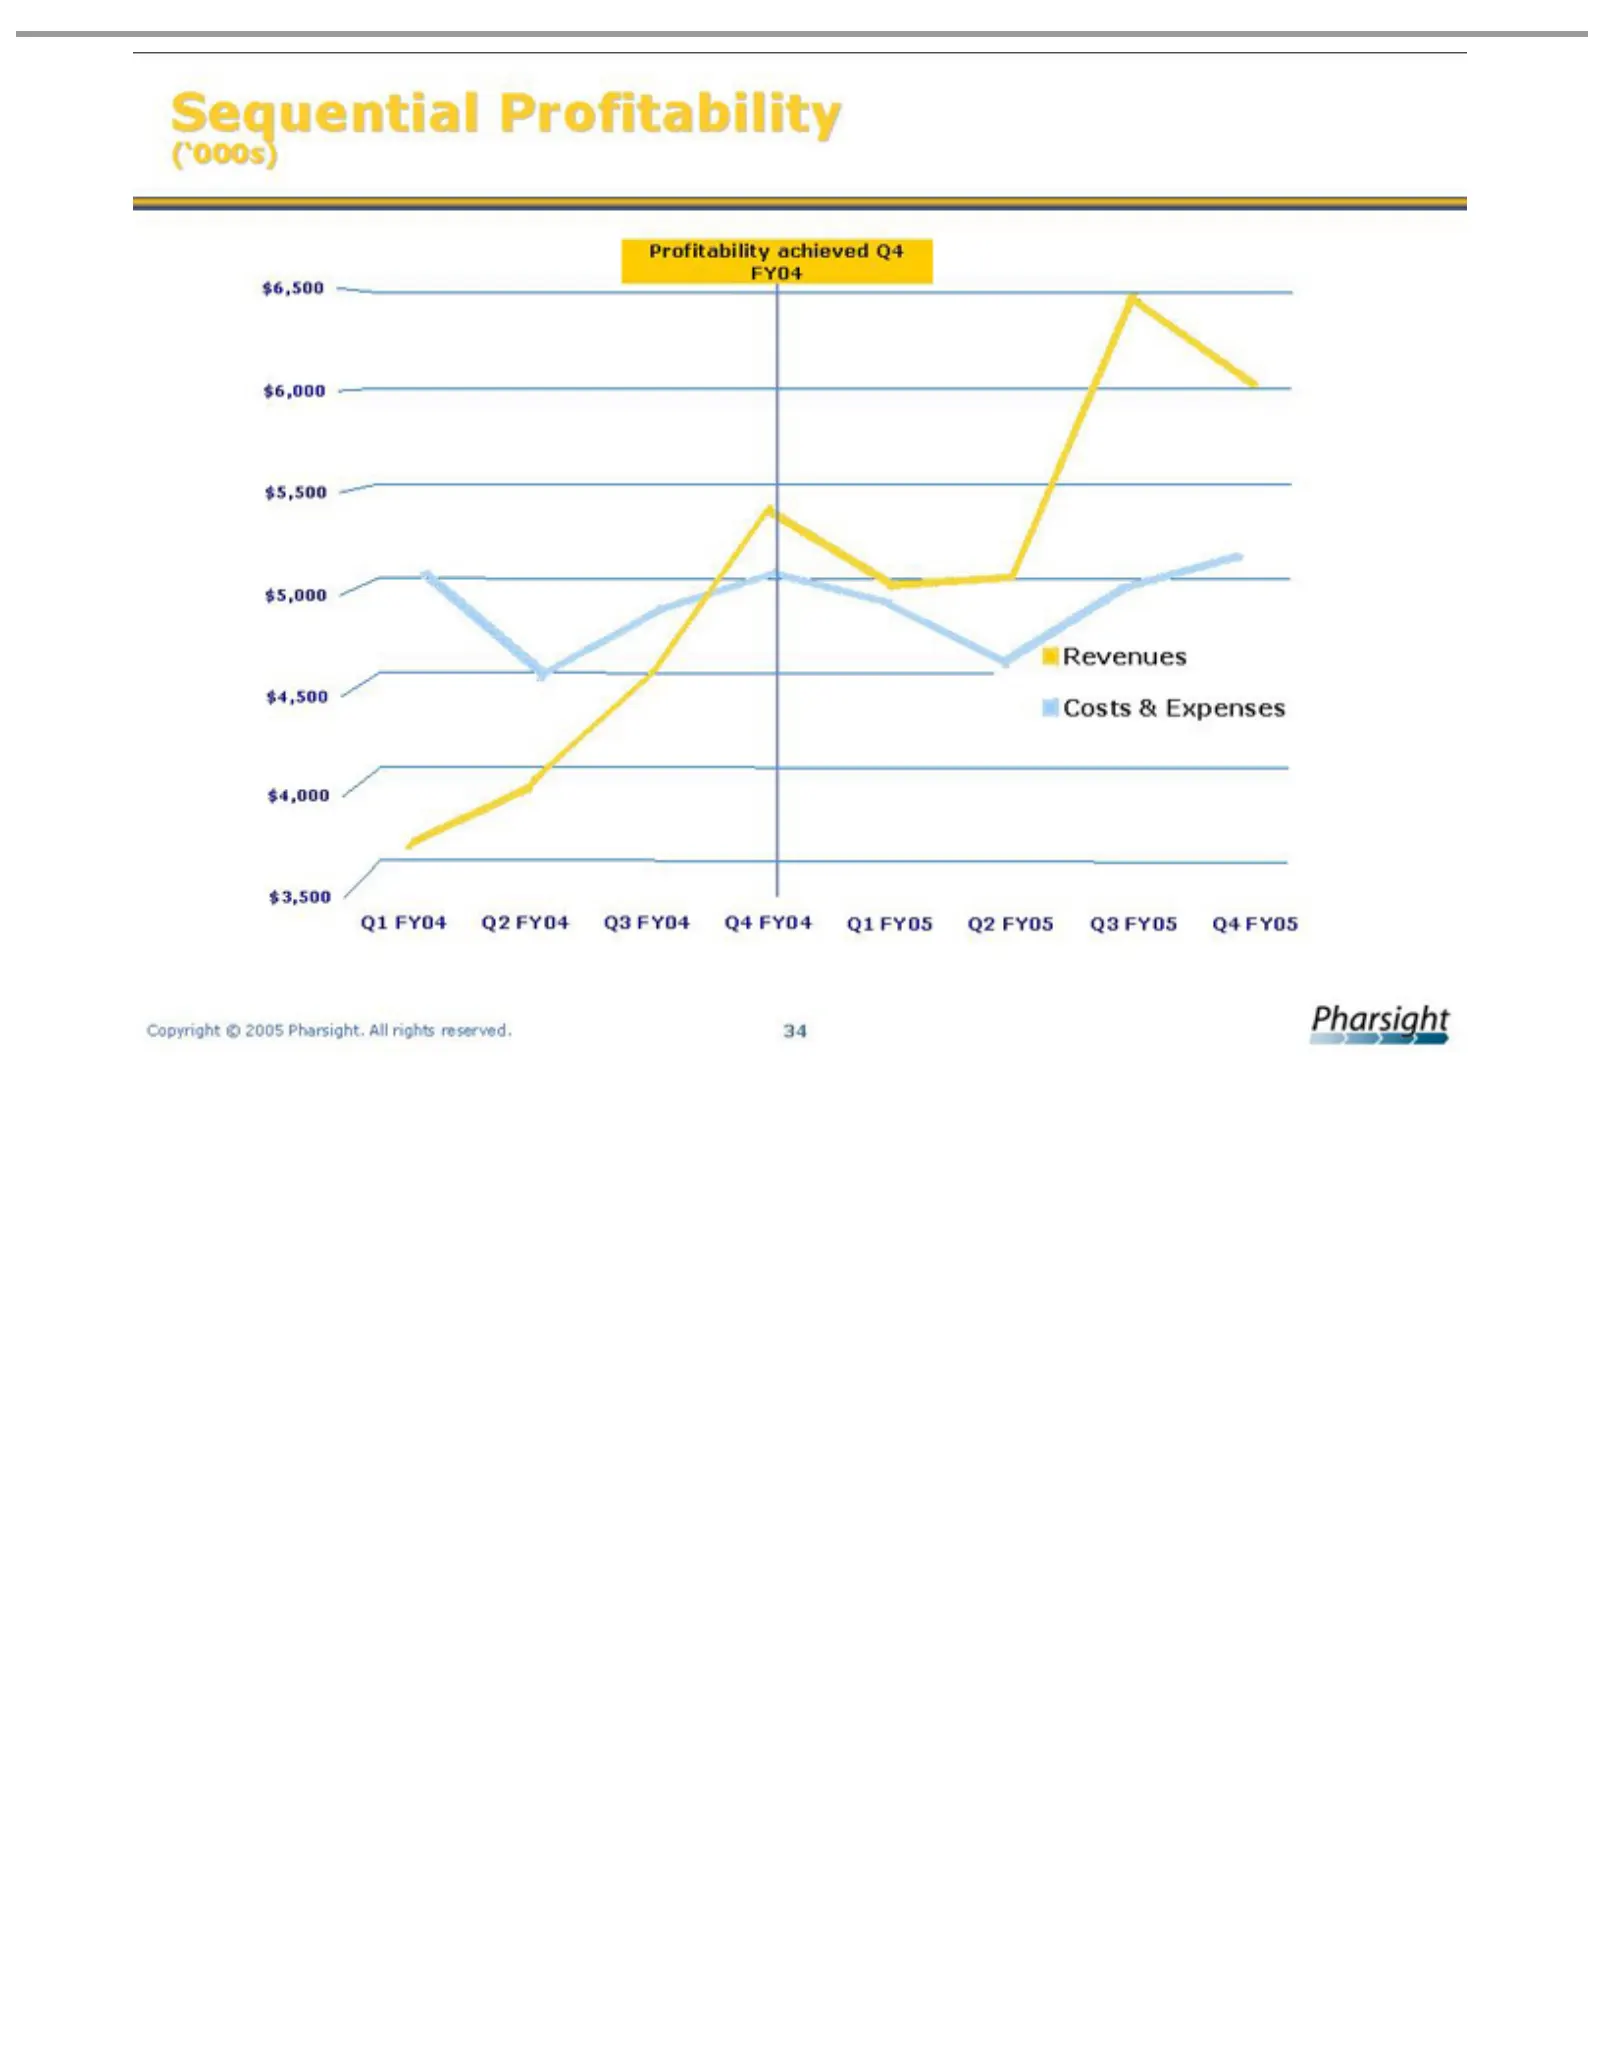
Slide 34: Sequential Profitability
Sequential Profitability (‘000s) Costs Revenues $5,000 $5,500 $6,000 $6,500 $3,500 $4,000 $4,500 Q1 Q2 Q3 Q4 Copyright FY05 FY04 & Expenses © Profitability achieved 2005 Pharsight. Q4 FY04All rights reserved. 34
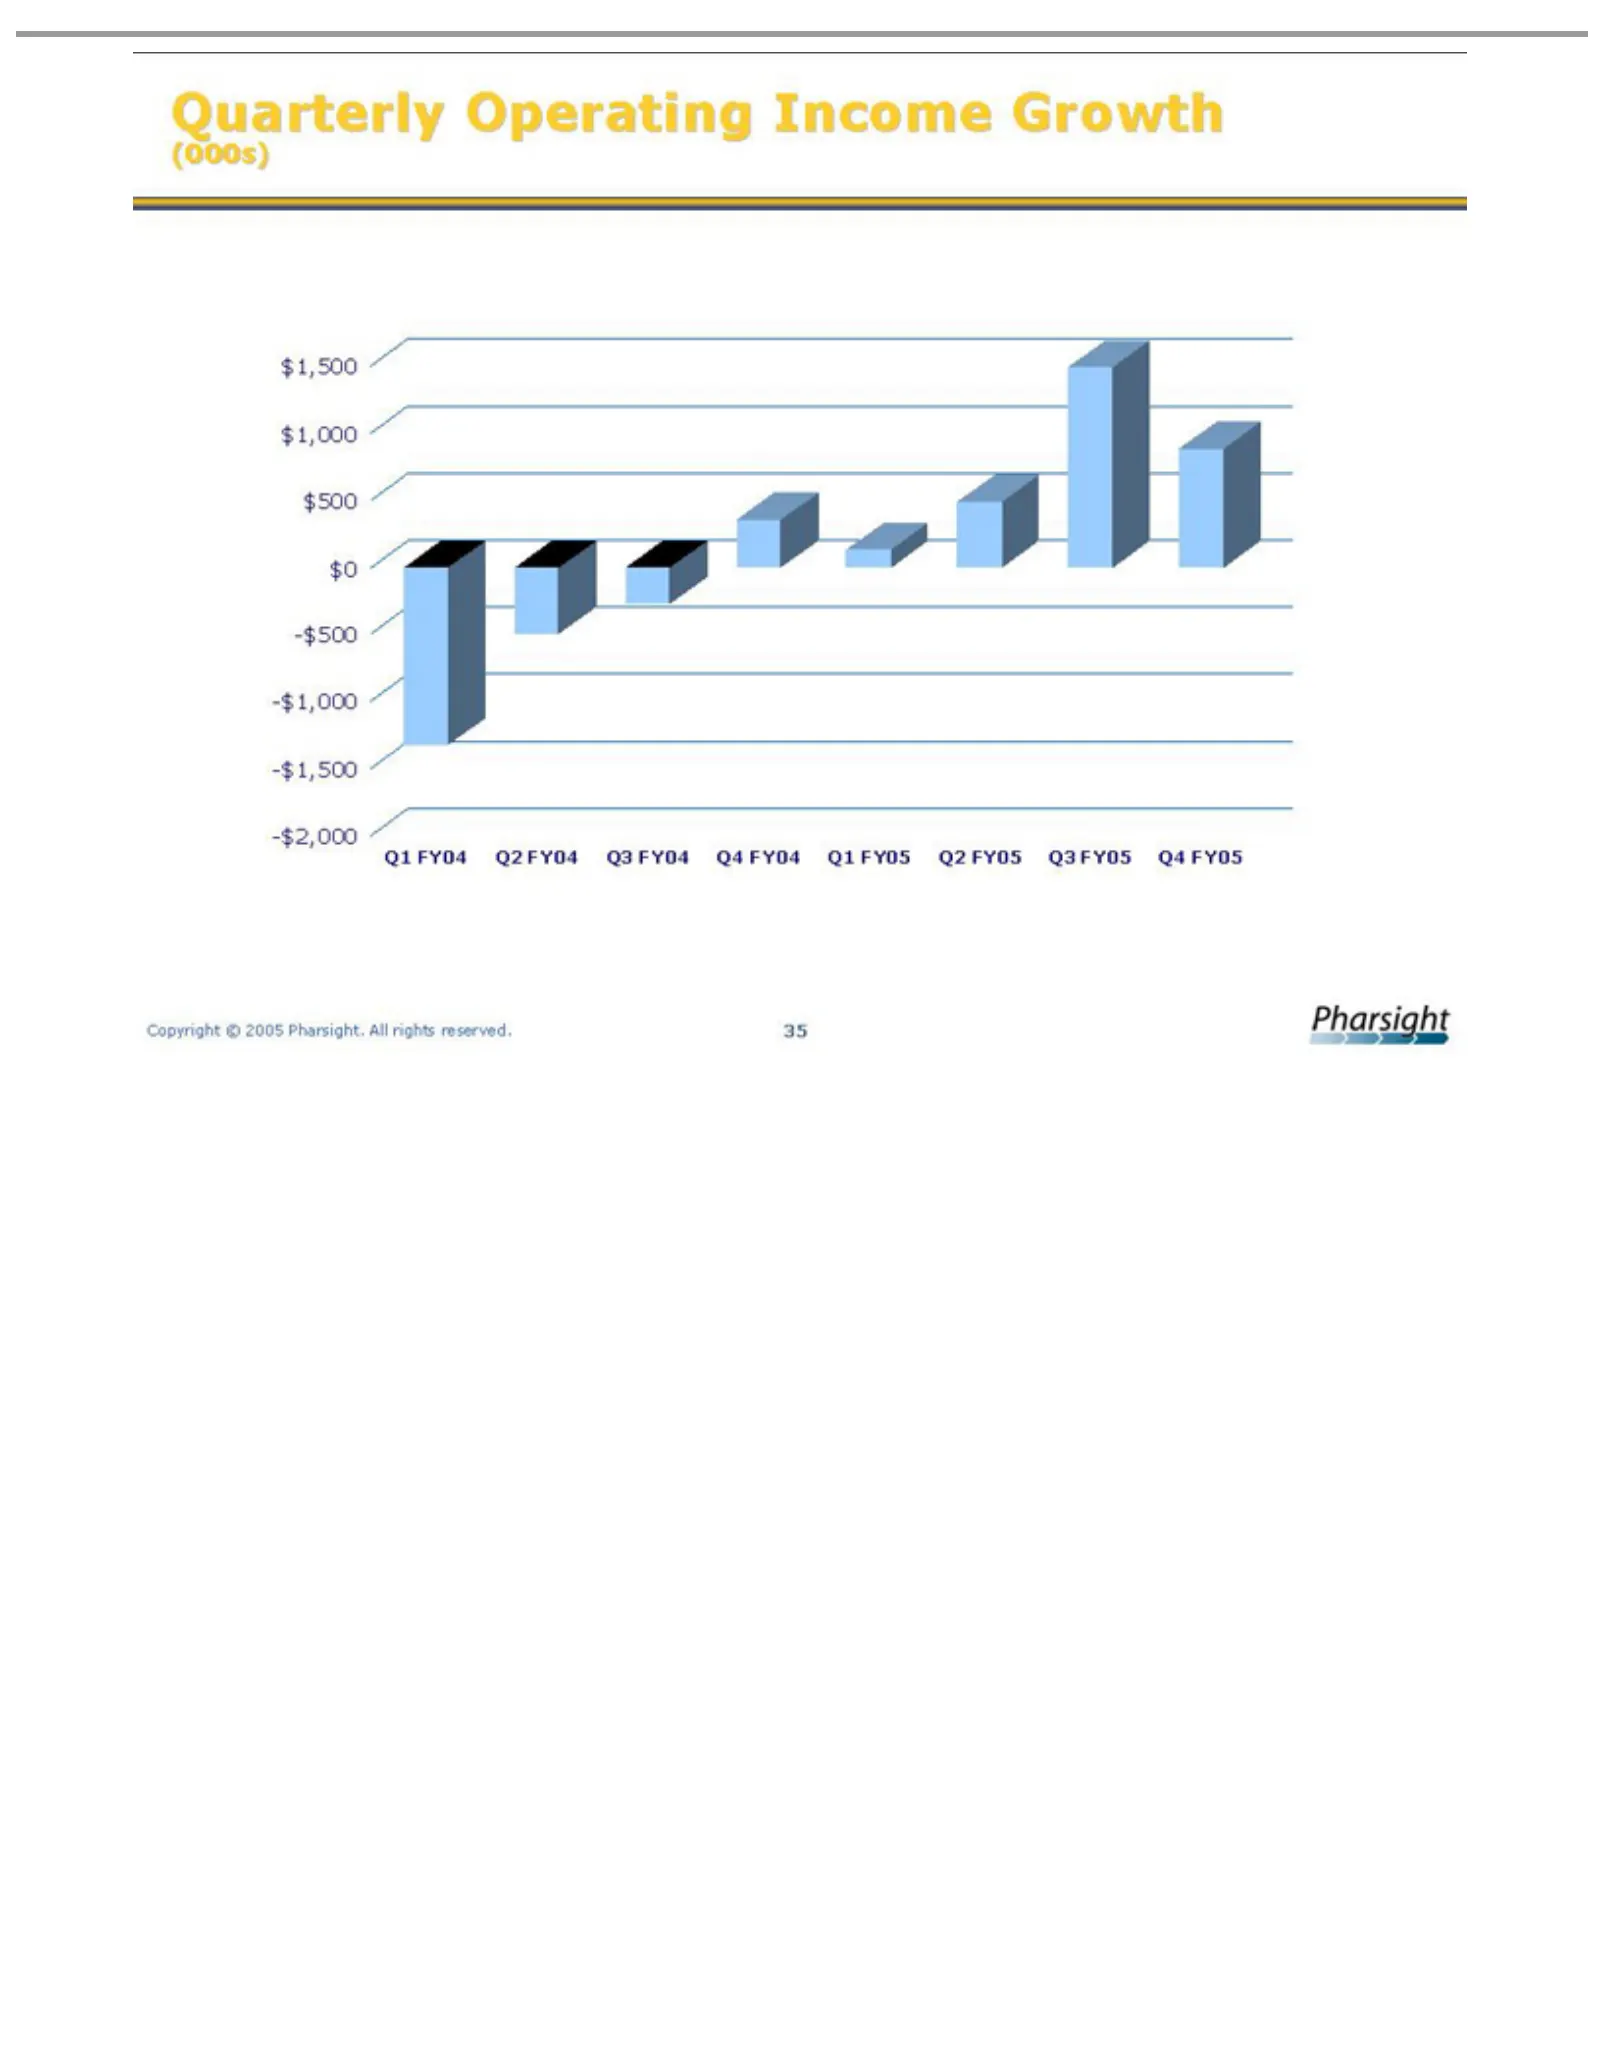
Slide 35: Quarterly Operating Income
Quarterly -$2,000 -$1,500 -$1,000 -$500 $0 $500 $1,000 $1,500 (000s) Q4 Q1 Q2 Q3 Copyright FY05 Operating FY04 © 2005 Pharsight. Income Growth All rights reserved. 35
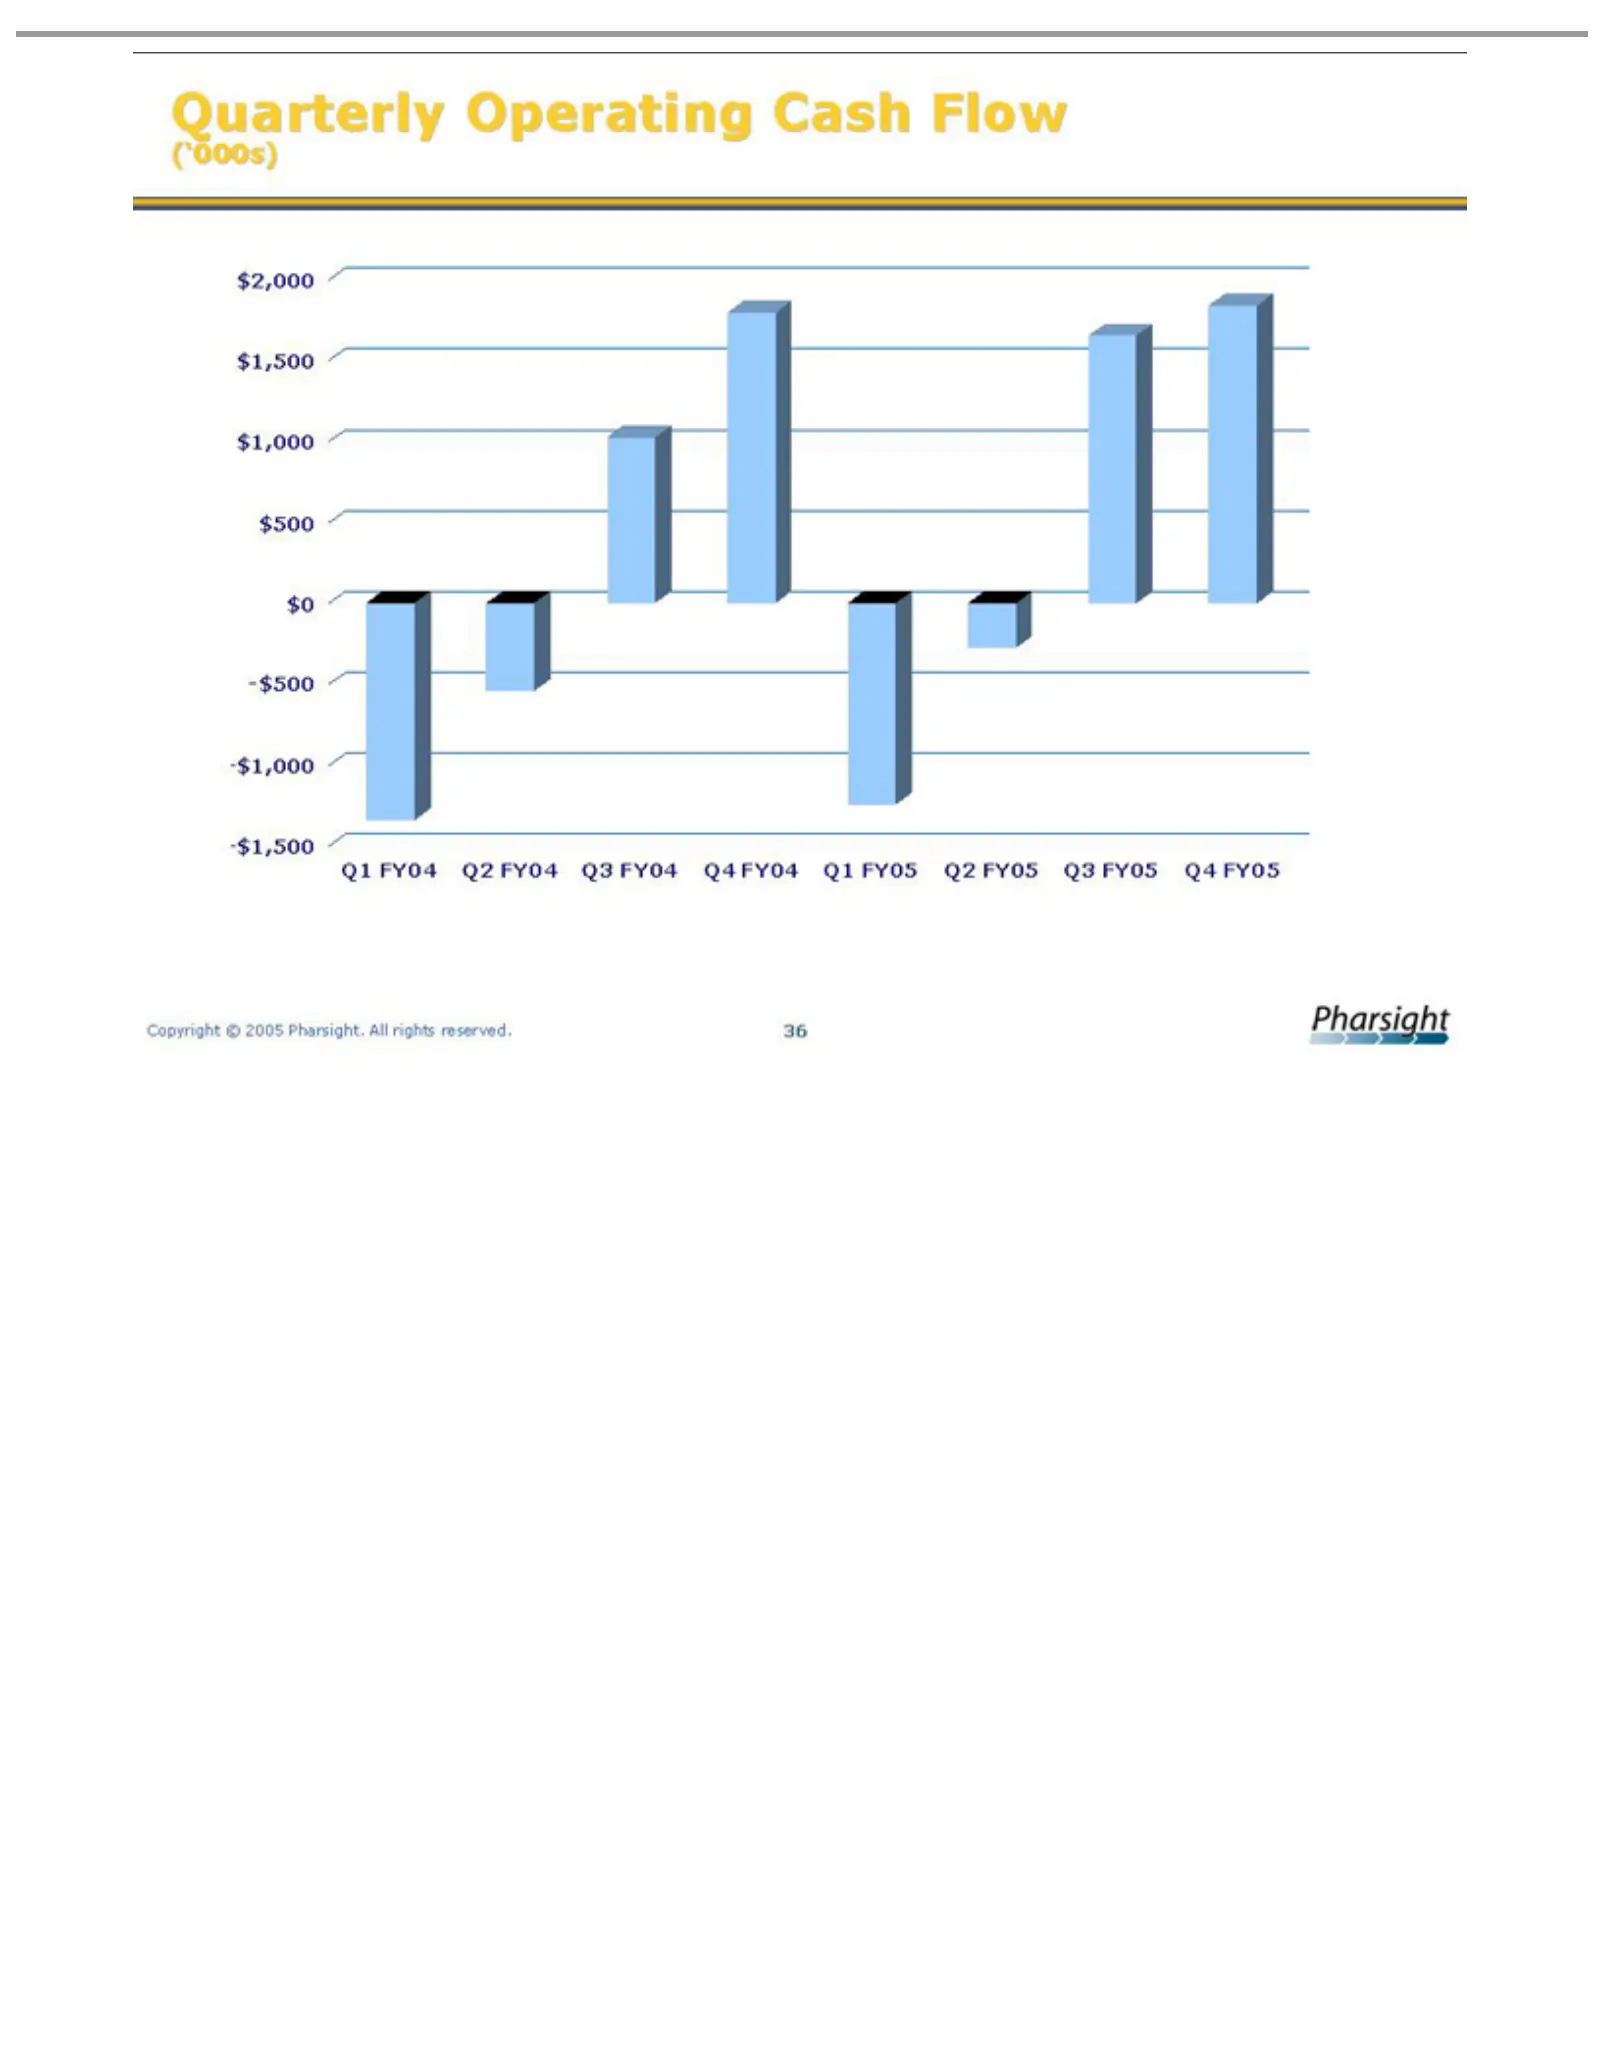
Slide 36: Quarterly Operating Cash Flow
Quarterly -$1,500 -$1,000 -$500 $0 $500 $1,000 $1,500 $2,000 (‘000s) Q4 Q1 Q2 Q3 Copyright FY05 Operating FY04 © 2005 Pharsight. Cash FlowAll rights reserved. 36
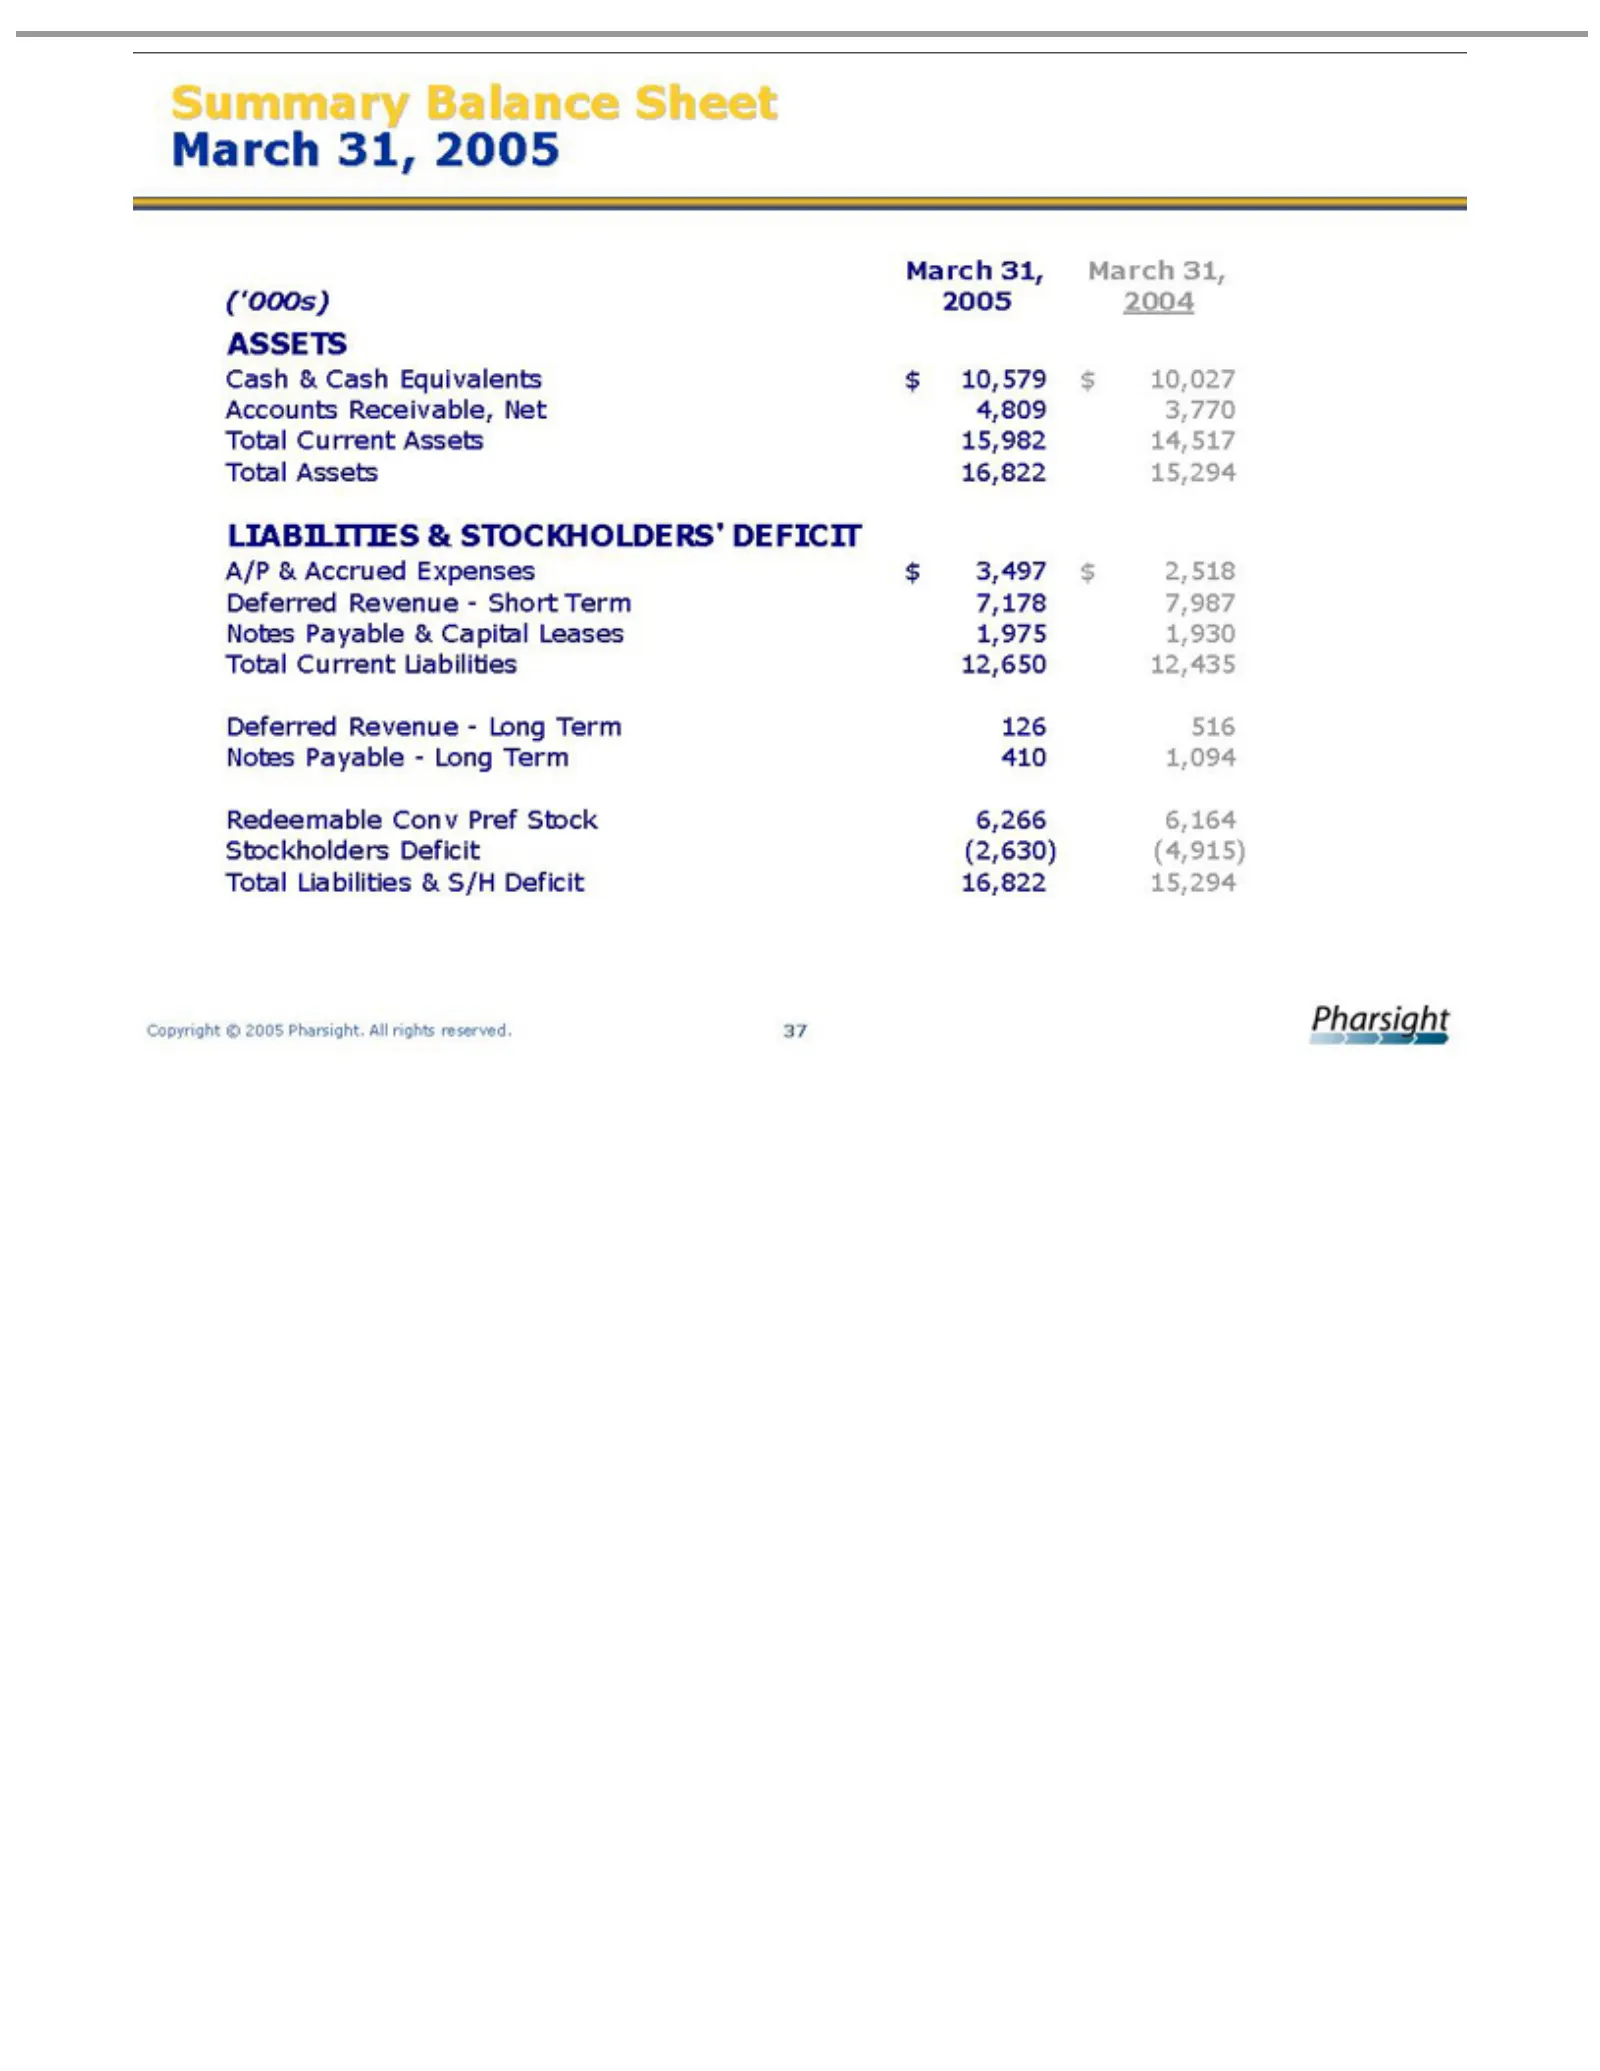
Slide 37: Summary Balance Sheet March 31, 2005
Summary March ASSETS 2004 (‘000s) 2005 Cash Accounts 4,809 3,770 15,982 14,517 LIABILITIES $ A/P 7,178 7,987 1,975 1,930 12,650 12,435 Deferred 126 516 Notes 410 1,094 Redeemable 6,266 6,164 Stockholders (2,630) (4,915) Total 15,294 16,822 Copyright 10,027 10,579 2,518 3,497 &Assets & Current Liabil
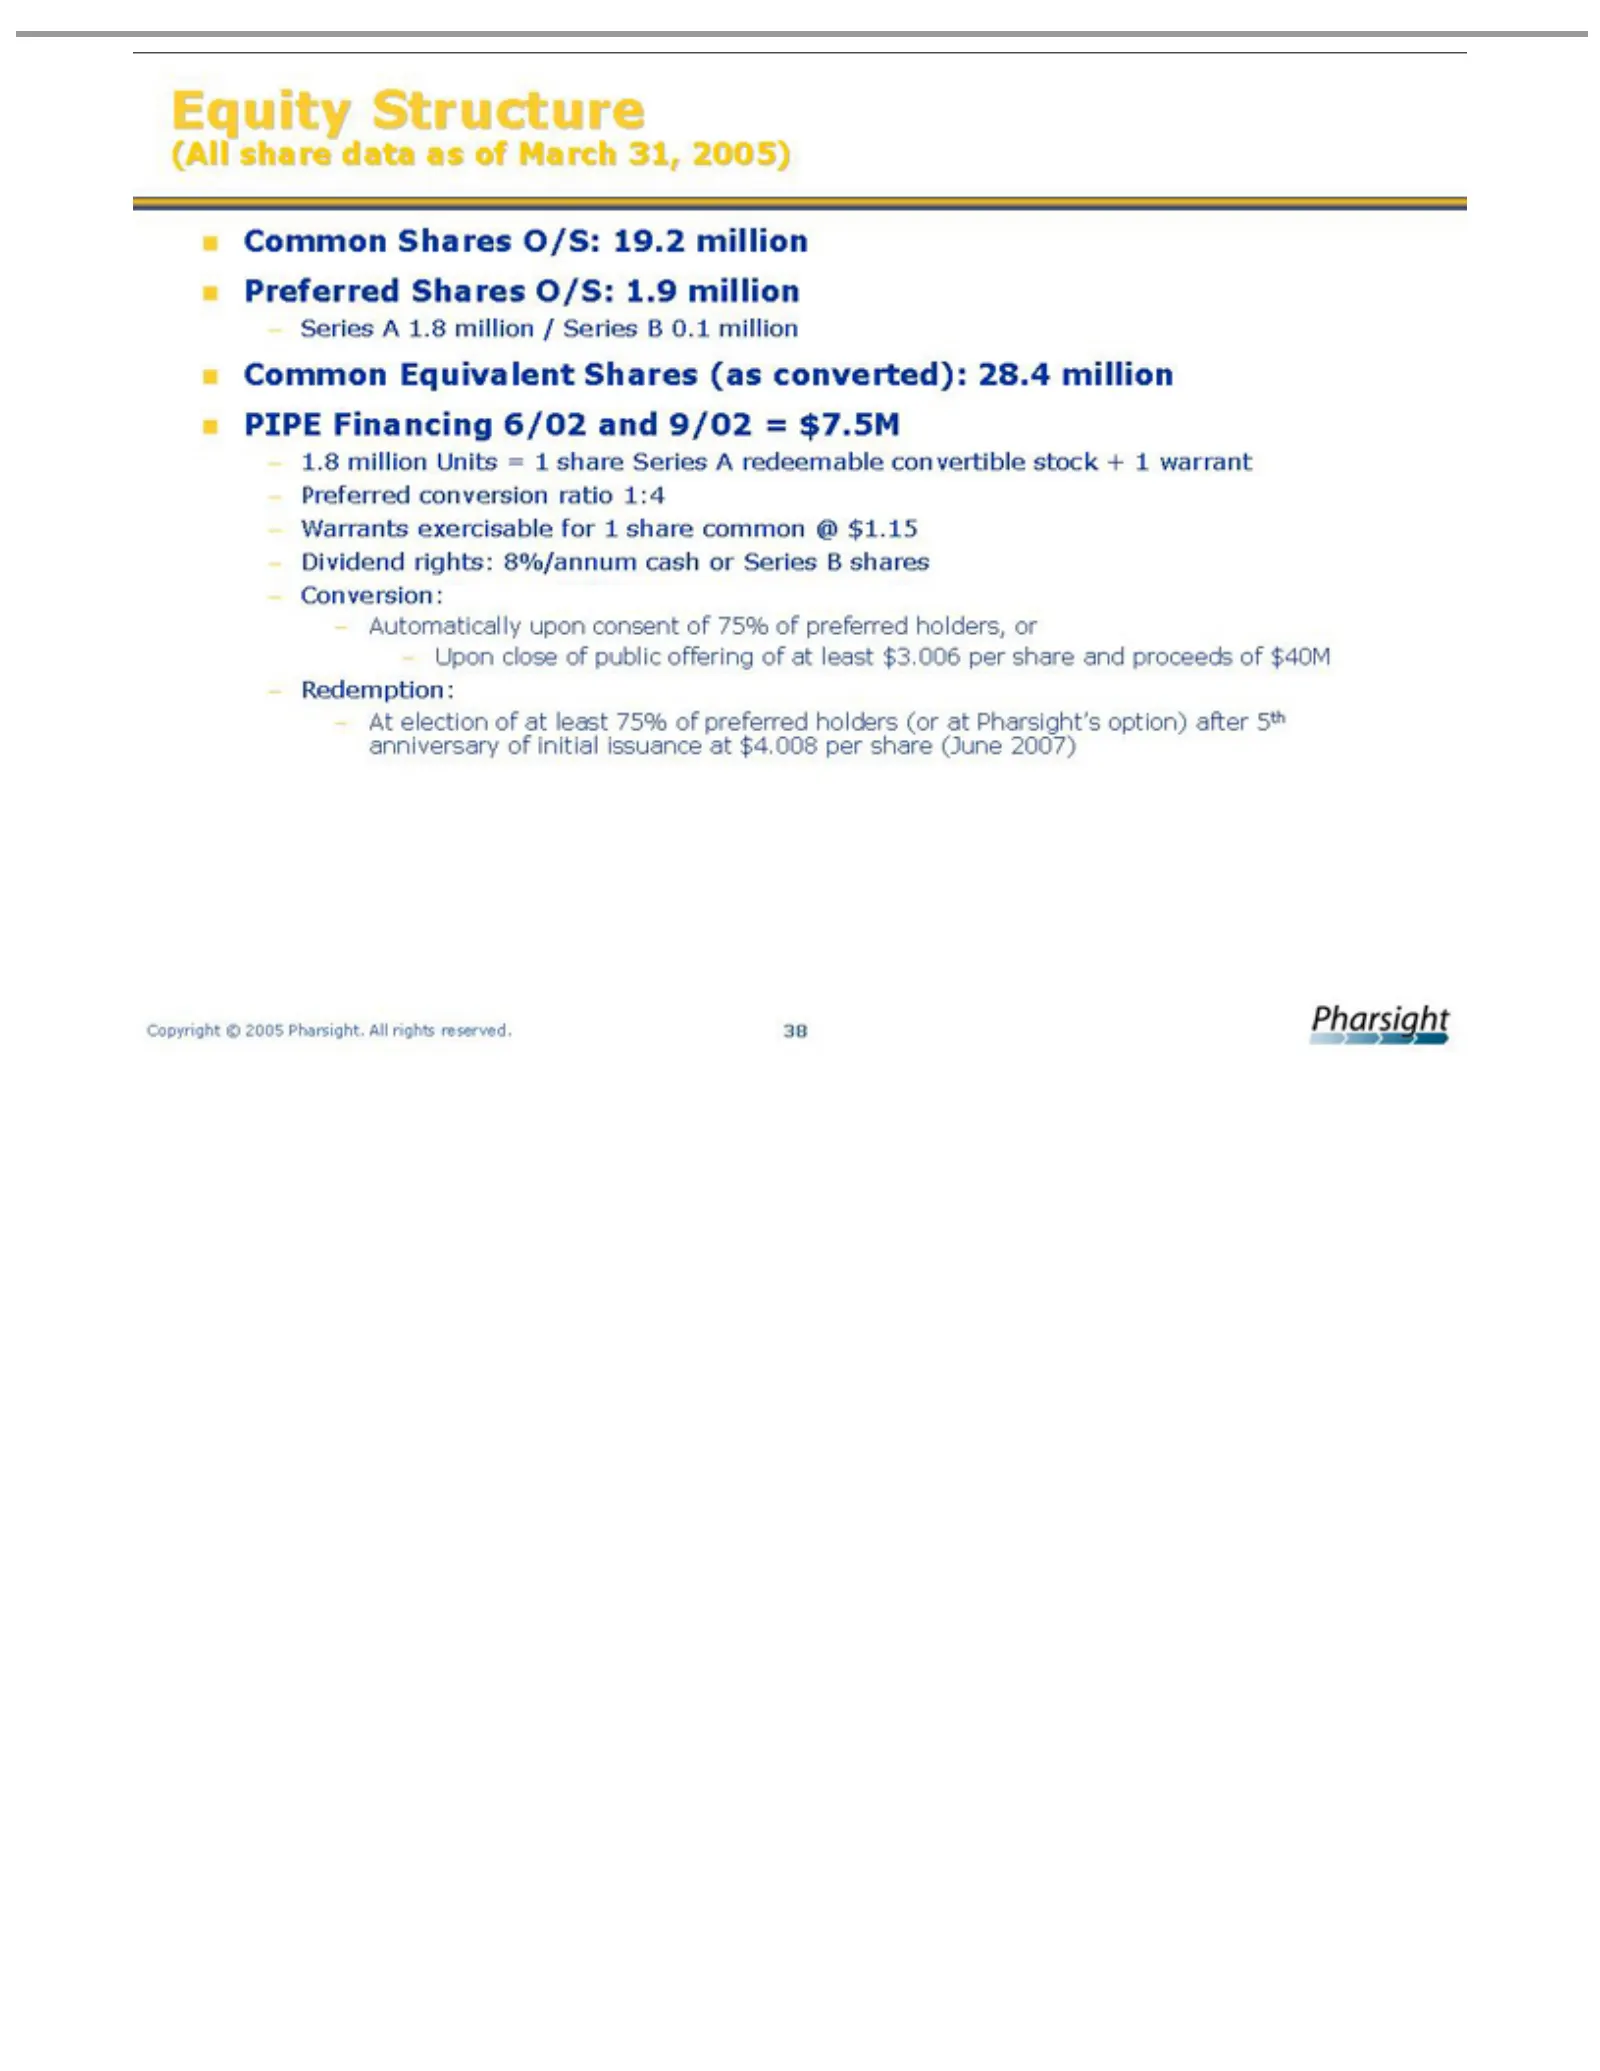
Slide 38: Equity Structure
Equity (All Series Common PIPE 1.8 Preferred Warrants Dividend Automatically Conversion: Upon At Redemption: Copyright election million share Financing close AStructure 1.8 exercisable Shares conversion rights: Equivalent data ©Units of of million 2005 at public upon as6/02 least 8%/annum O/S: =ofPh
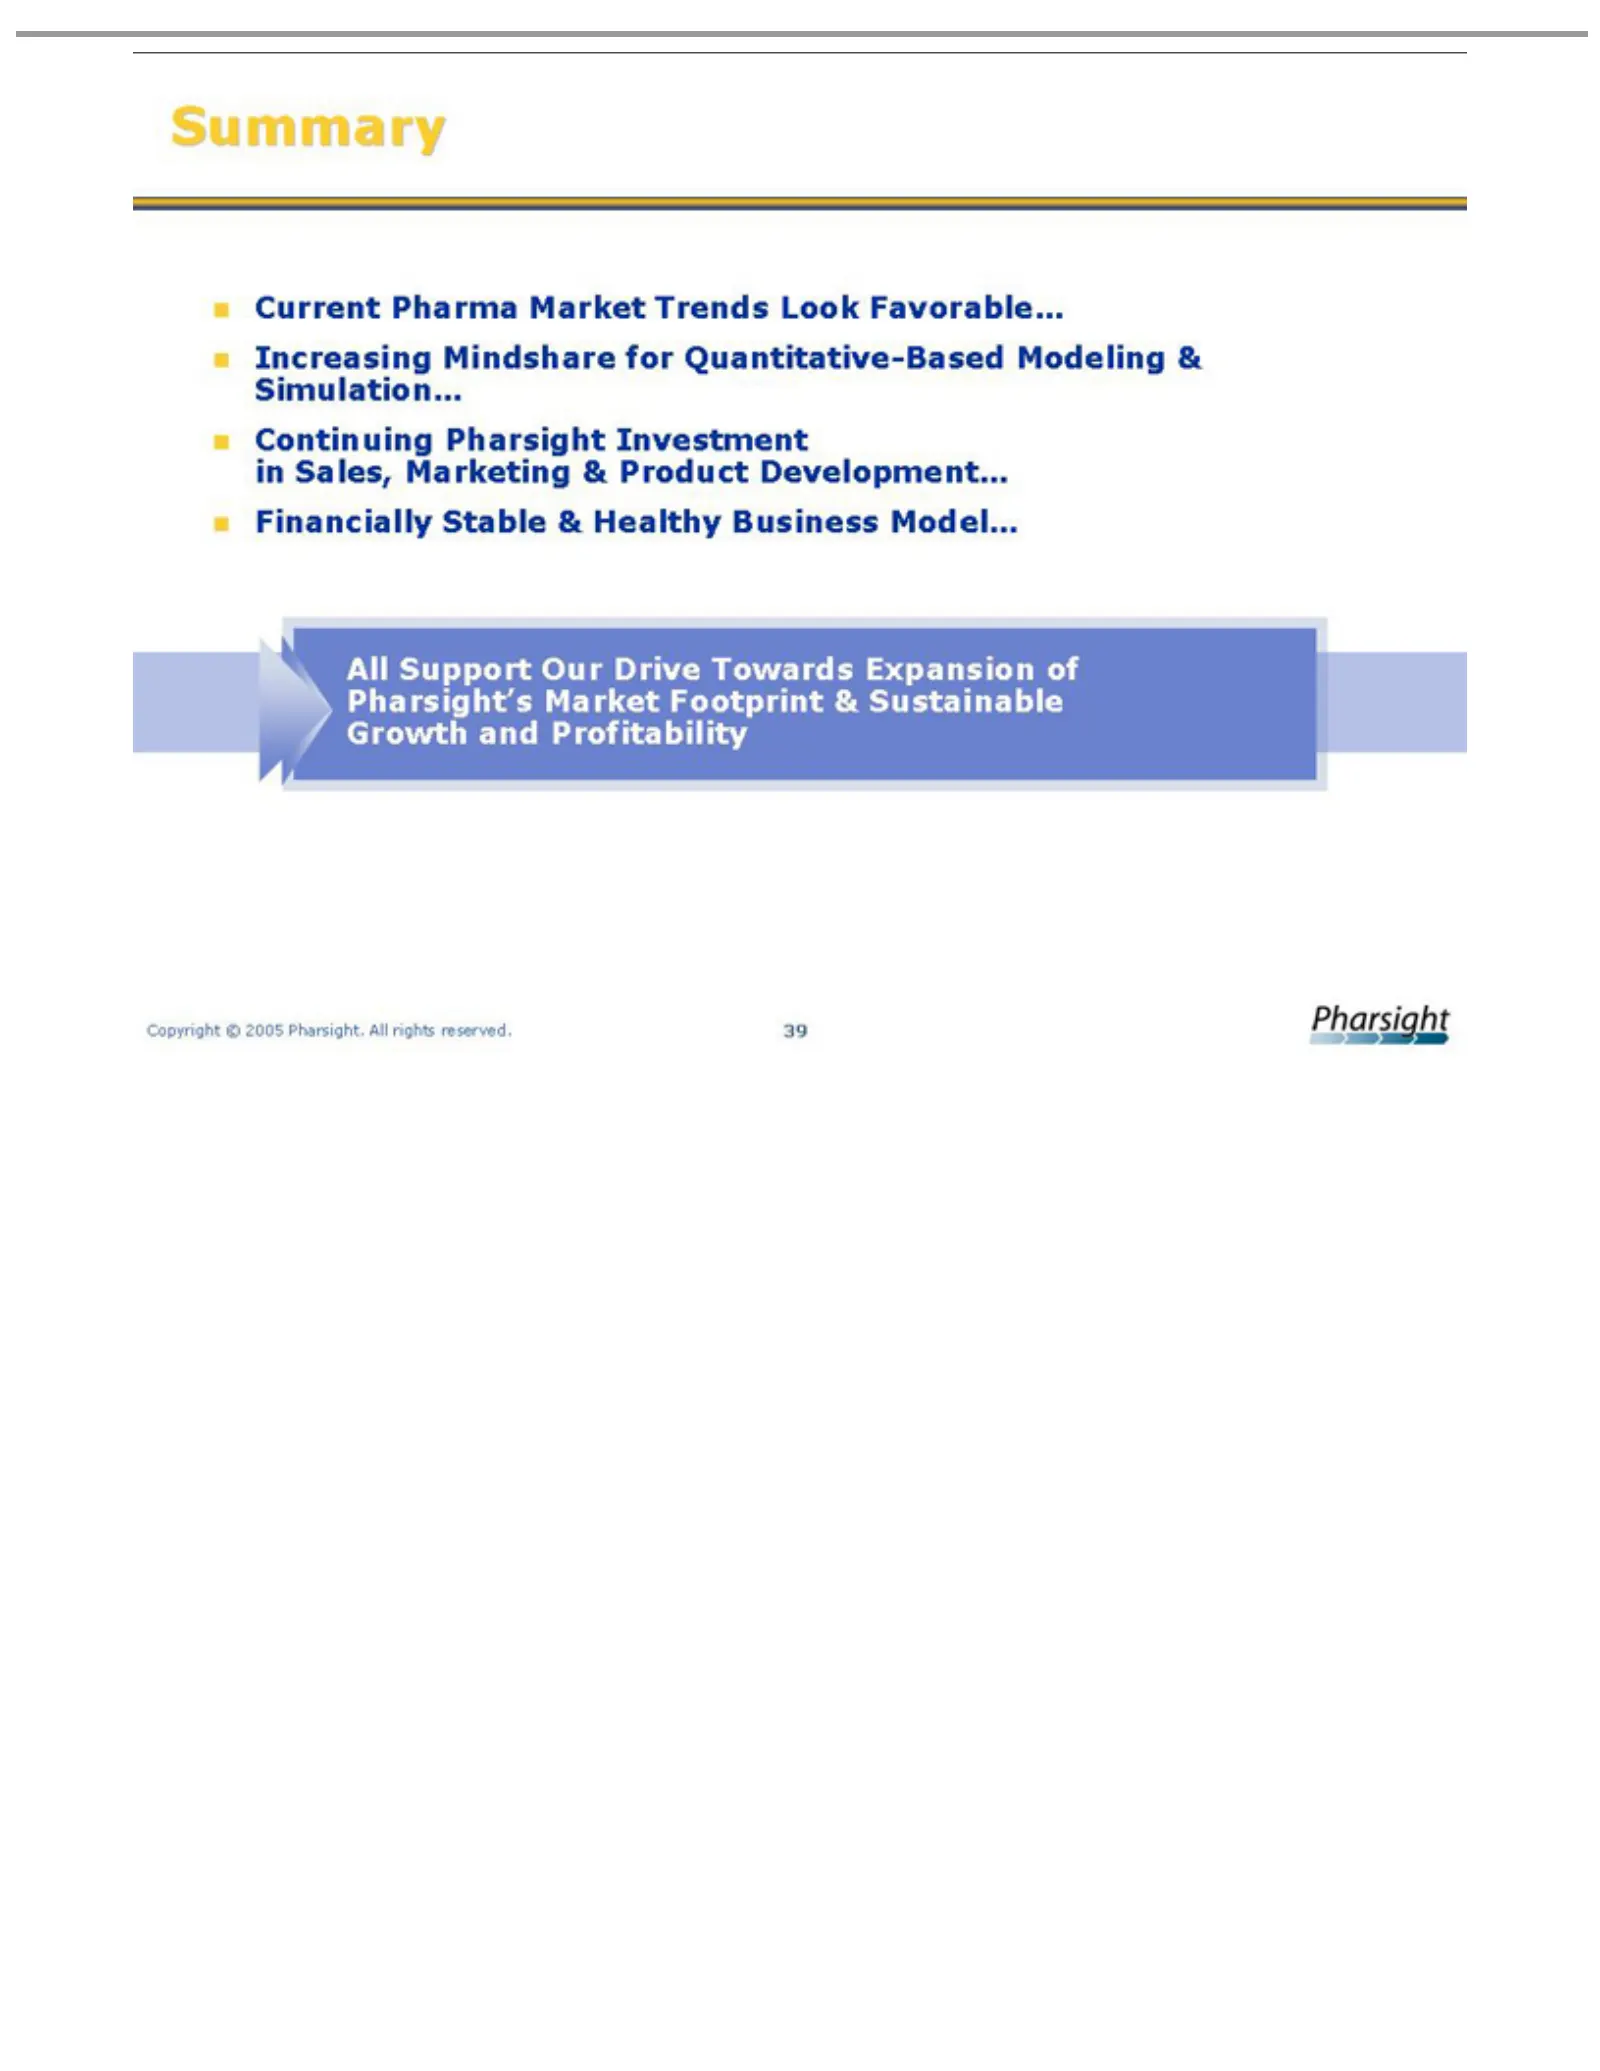
Slide 39: Current Summary
Current Summary Increasing Continuing Financially All Copyright Support Pharma © Mindshare Stable Pharsight Our 2005 Market Drive & Pharsight. Healthy Investment for Towards Trends Quantitative-Based All Business Look Expansion rights in Sales, Favorable… Model… reserved. Marketing of Modeling Phars
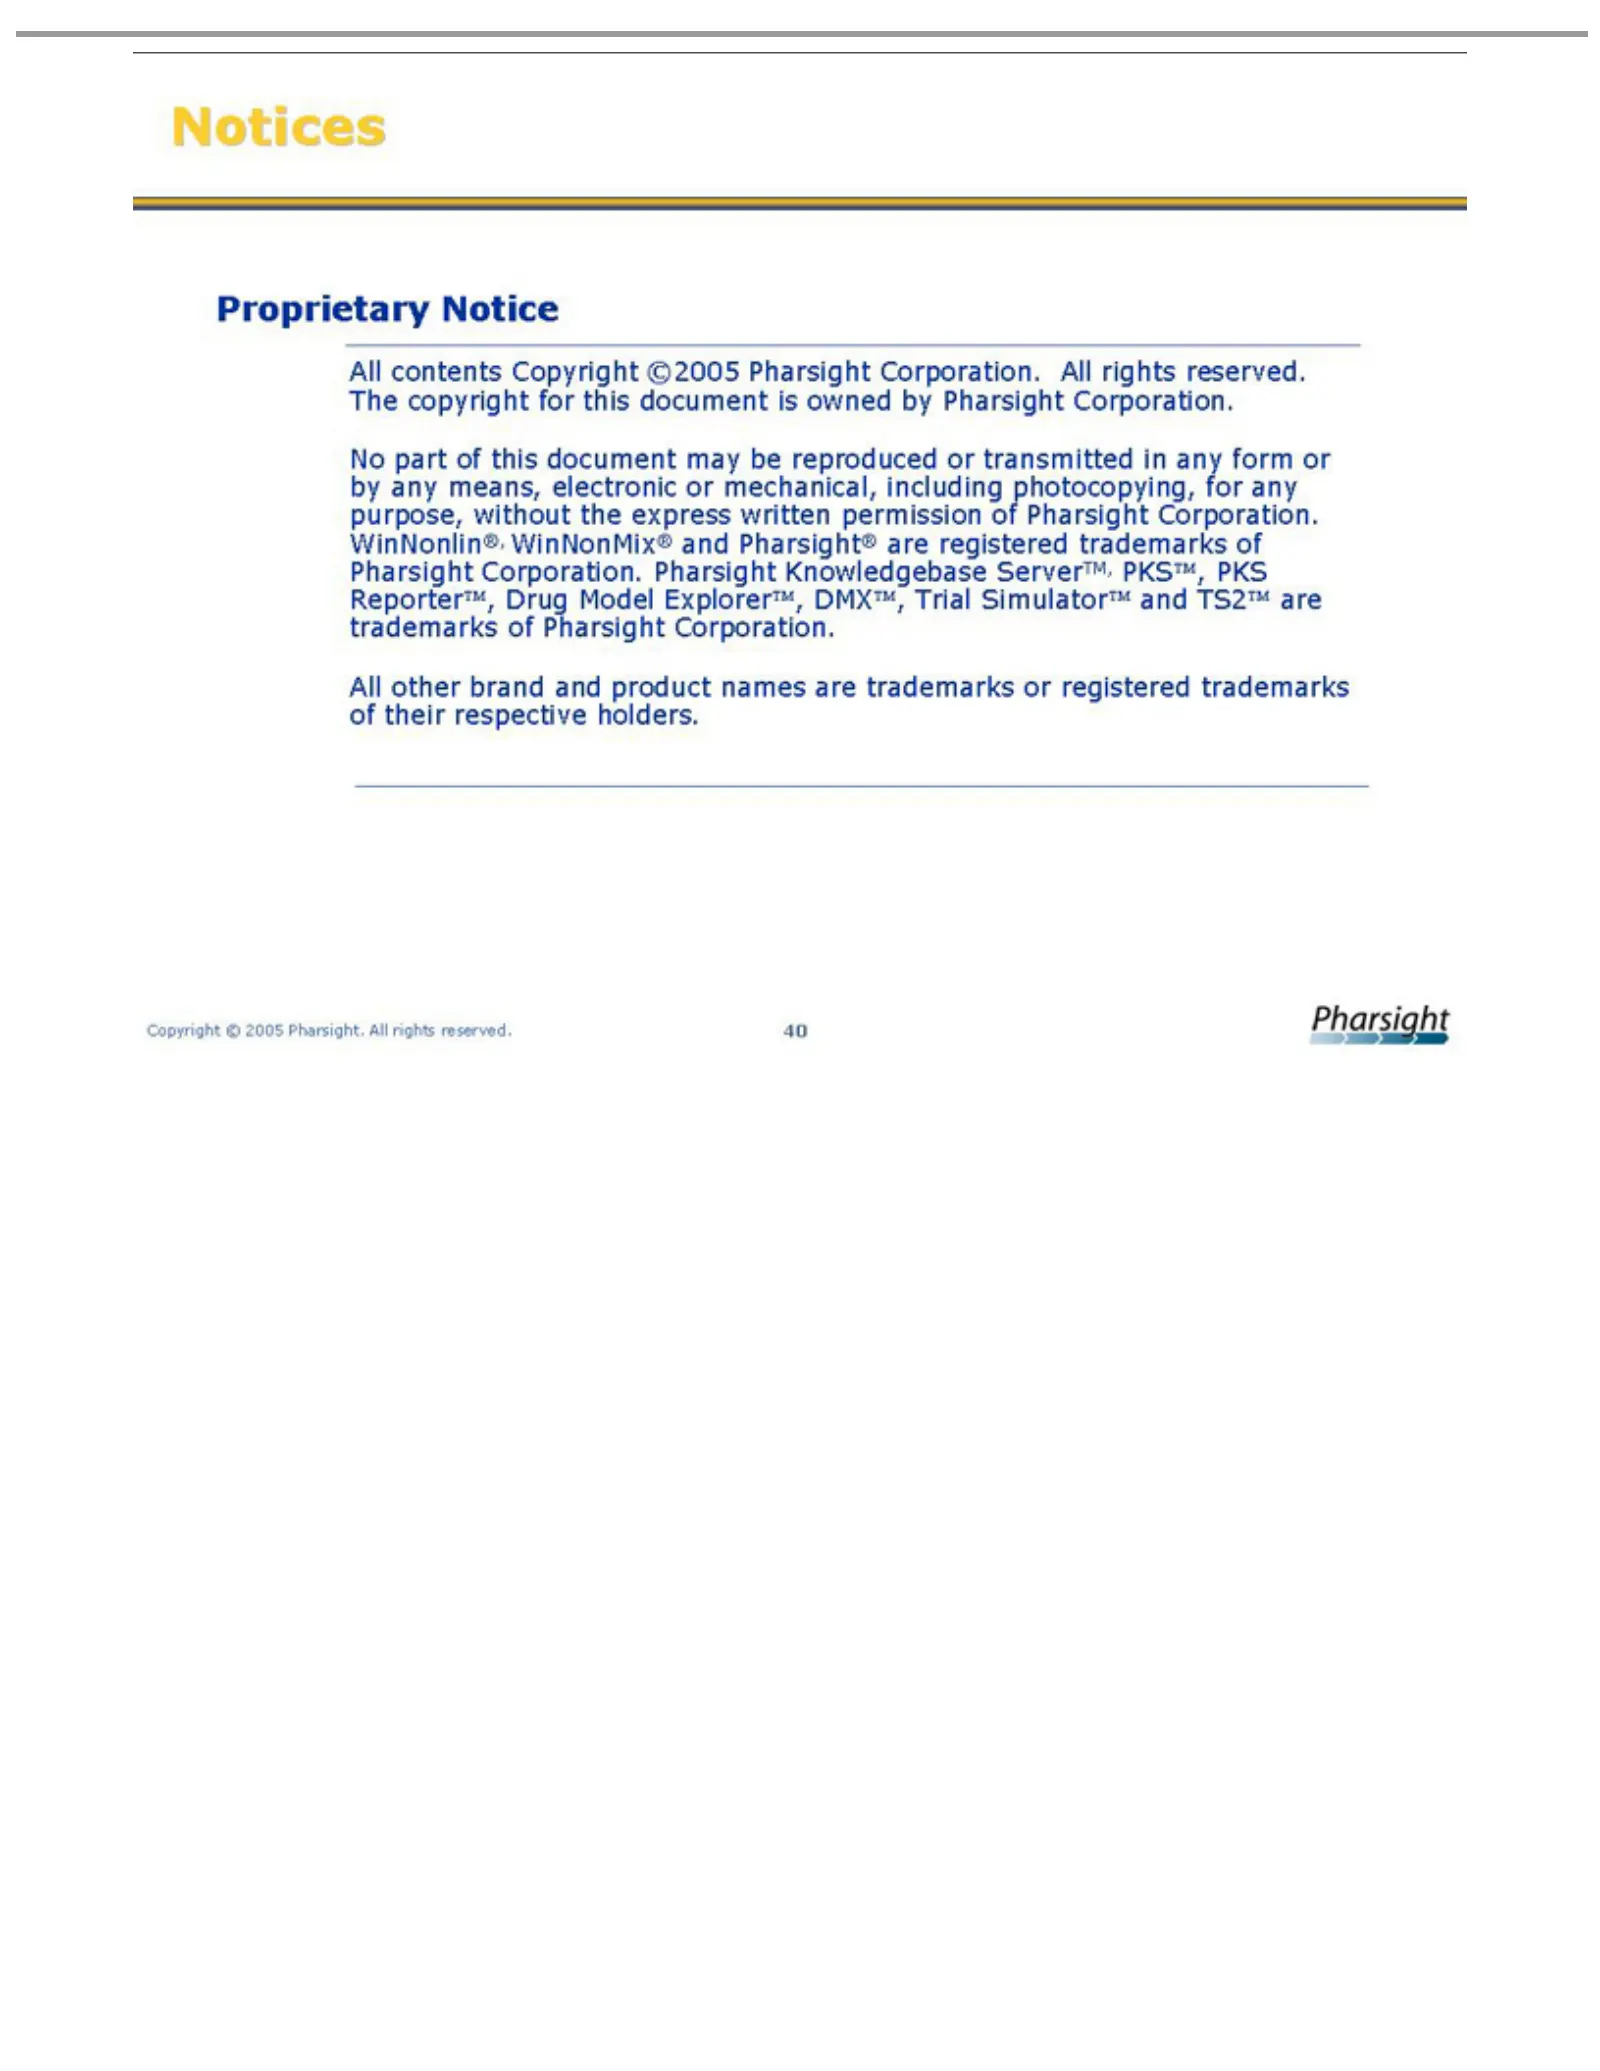
Slide 40: Proprietary Notices
Proprietary Notices No Pharsight Model All Copyright part contents other ExplorerTM, ofbrand Corporation. © this Notice Copyright 2005 document andPharsight. product DMXTM, WinNonlin®, ©2005 maynames All be Pharsight Trial rights reproduced are SimulatorTM WinNonMix® trademarks reserved. Corporation

Slide 41: Pharsight
Pharsight oo
Source: SEC EDGAR · 8-K filed Jun 28, 2005
More decks from Pharsight Corp
 Q4 2007 Earnings Presentation45 slides · May 14, 2007
 Investor Presentation (January 2007)41 slides · Jan 26, 2007
 Q2 2007 Earnings Presentation33 slides · Nov 30, 2006
 Q1 FY2007 Earnings Presentation37 slides · Aug 3, 2006
 Investor Presentation (June 2006)36 slides · Jun 6, 2006
 Investor Presentation (February 2006)31 slides · Feb 2, 2006