Nnit A/S · OMXCOP:NNIT
Nnit A/S — Q1 2021 Earnings Presentation
23 slides from Nnit A/S's earnings presentation, May 7, 2021

Slide 1: Welcome to the Q1 2021 Financial Results Webcast
1 Welcome to the Q1 2021 Financial Results Webcast NNIT A/S May 7, 2021 1
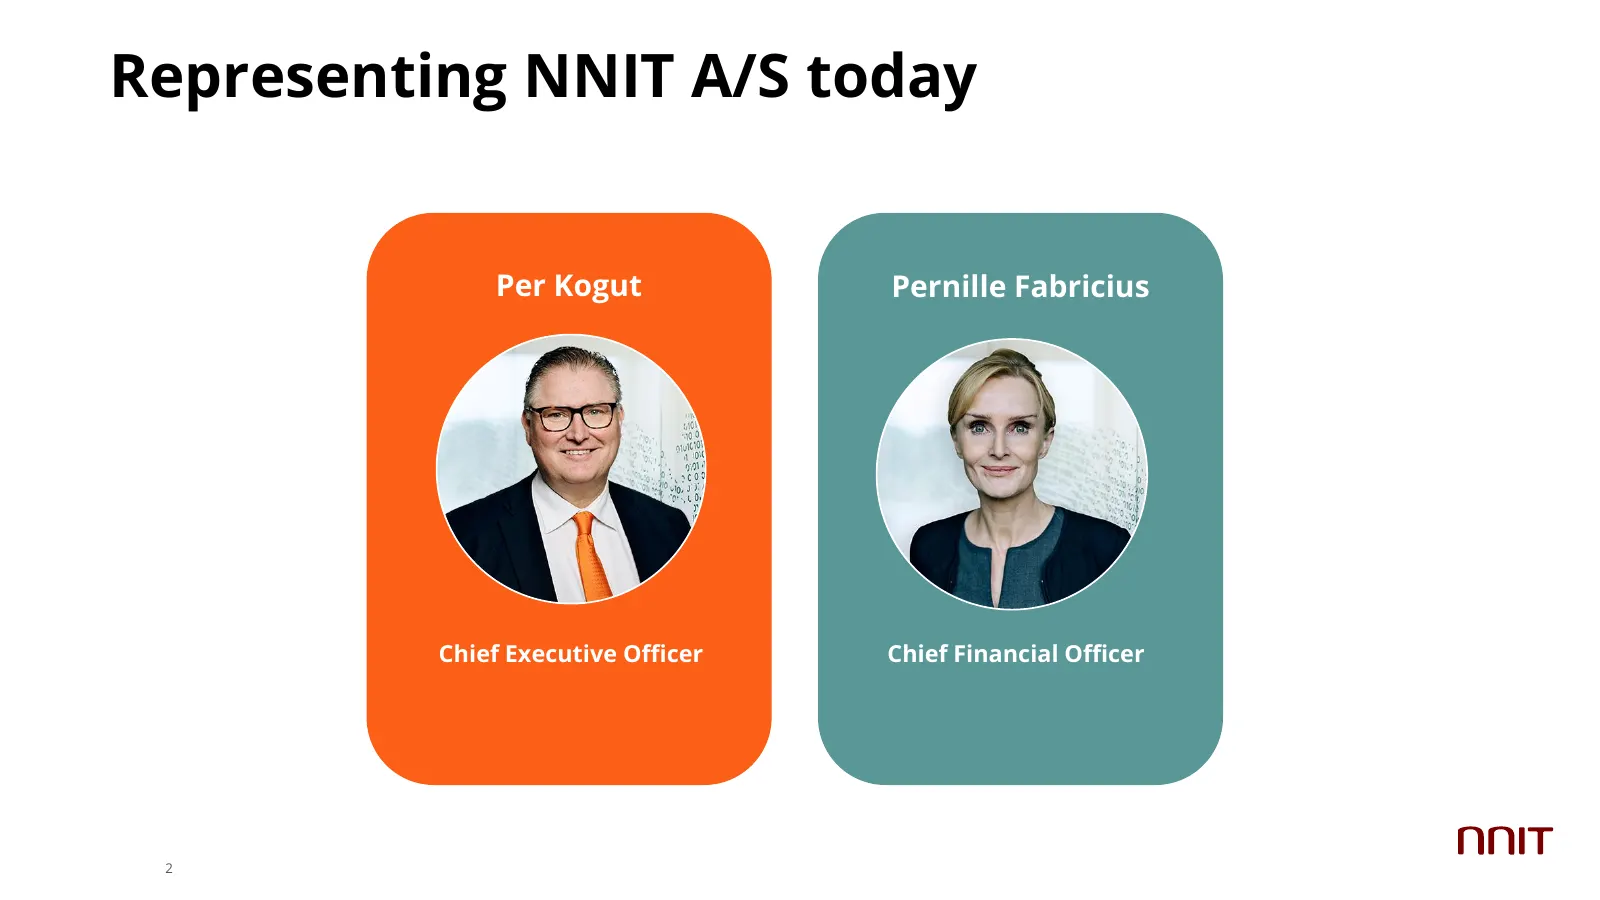
Slide 2: Representing NNIT A/S today
Representing NNIT A/S today Per Kogut Pernille Fabricius Chief Executive Officer Chief Financial Officer 2
Slide 3: Agenda
Agenda 01 Highlights for Q1 2021 02 Financial performance 03 Balance sheet and cash flow 04 Outlook for 2021 05 Closing remarks 3
Slide 4: Forward looking statements
Forward looking statements This announcement contains forward-looking statements. Words such as ‘believe’, ‘expect’, ‘may’, ‘will’, ‘plan’, ‘strategy’, ‘prospect’, ‘foresee’, ‘estimate’, ‘project’, ‘anticipate’, ‘can’, ‘intend’, ‘outlook’, ‘guidance’, ‘target’ and other words and terms of similar me
Slide 5: Agenda
Agenda 01 Highlights for Q1 2021 02 Financial performance 03 Balance sheet and cash flow 04 Outlook for 2021 05 Closing remarks 5
Slide 6: Business update
Business update We remain on course Winning Solutions Continued growth in strategy momentum Life Sciences International 6
Slide 7: Commercial Highlights Q1 2021
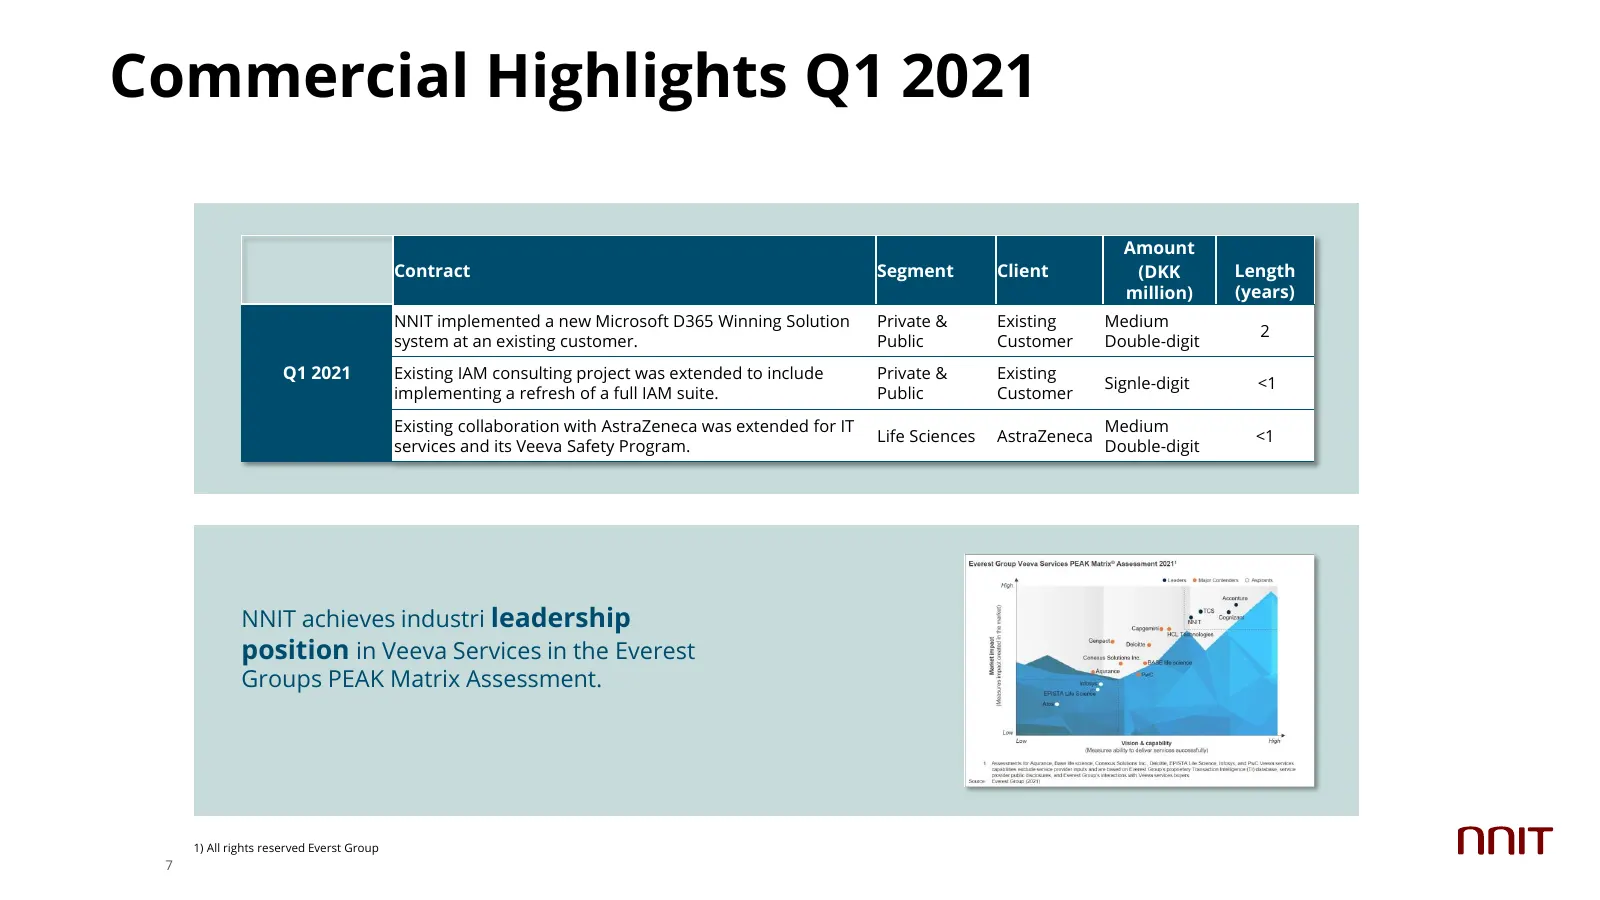
Commercial Highlights Q1 2021 Amount Contract Segment Client (DKK Length million) (years) NNIT implemented a new Microsoft D365 Winning Solution Private & Existing Medium 2 system at an existing customer. Public Customer Double-digit Q1 2021 Existing IAM consulting project was extended to include Pr
Slide 8: Agenda
Agenda 01 Highlights for Q1 2021 02 Financial performance 03 Balance sheet and cash flow 04 Outlook for 2021 05 Closing remarks 8
Slide 9: Q1 2021 at a glance
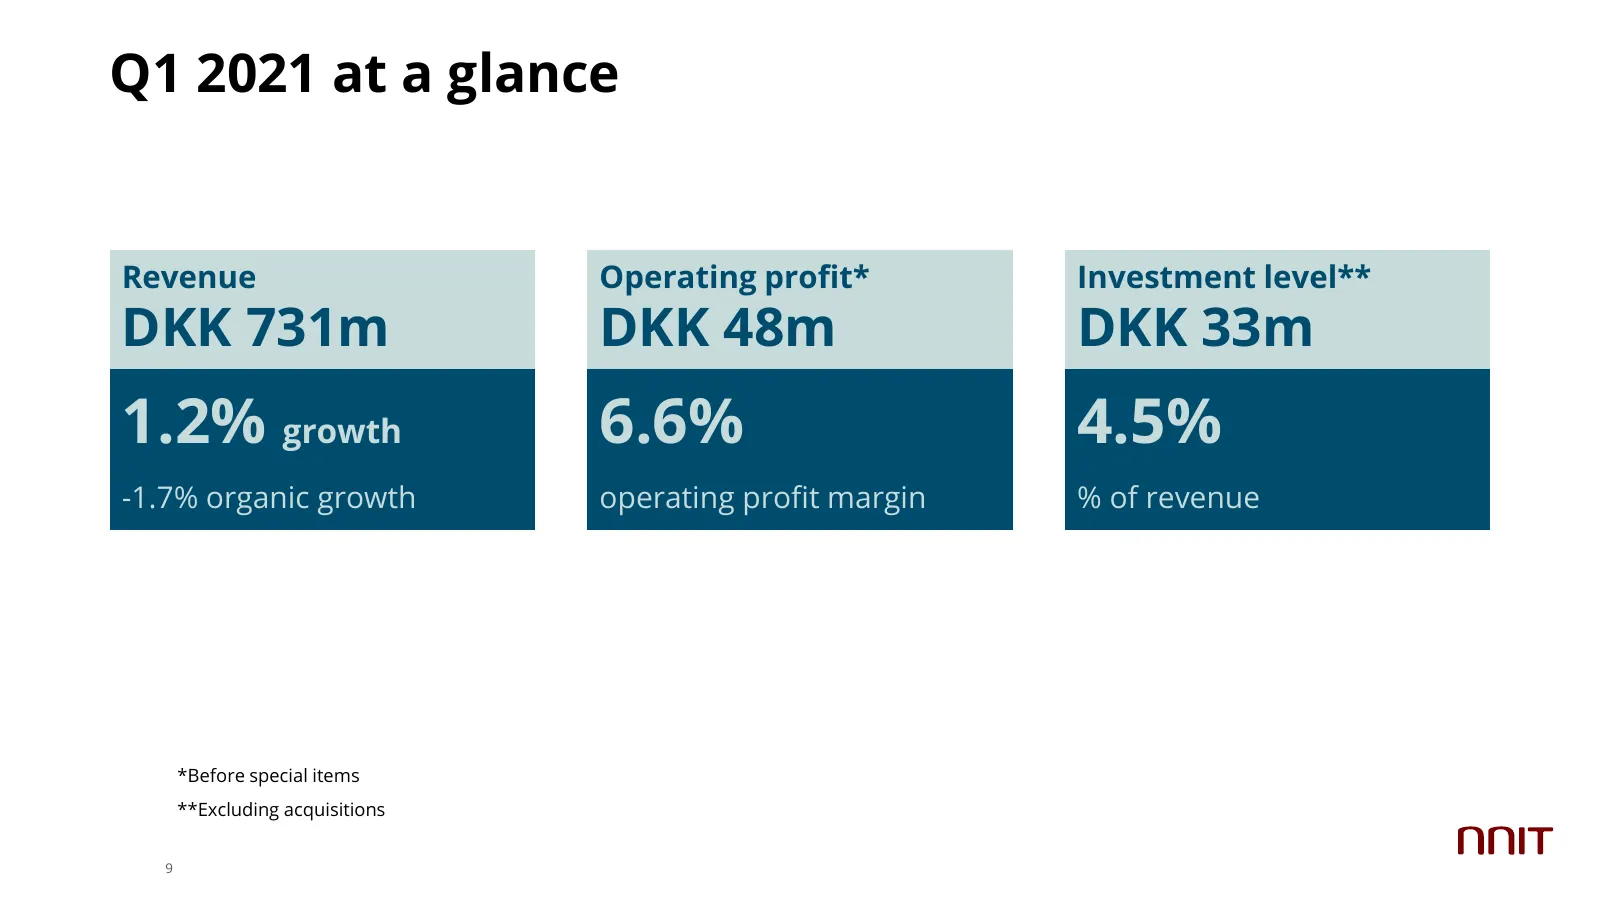
Q1 2021 at a glance Revenue Operating profit* Investment level** DKK 731m DKK 48m DKK 33m 1.2% growth 6.6% 4.5% -1.7% organic growth operating profit margin % of revenue *Before special items **Excluding acquisitions 9
Slide 10: Group Performance Overview
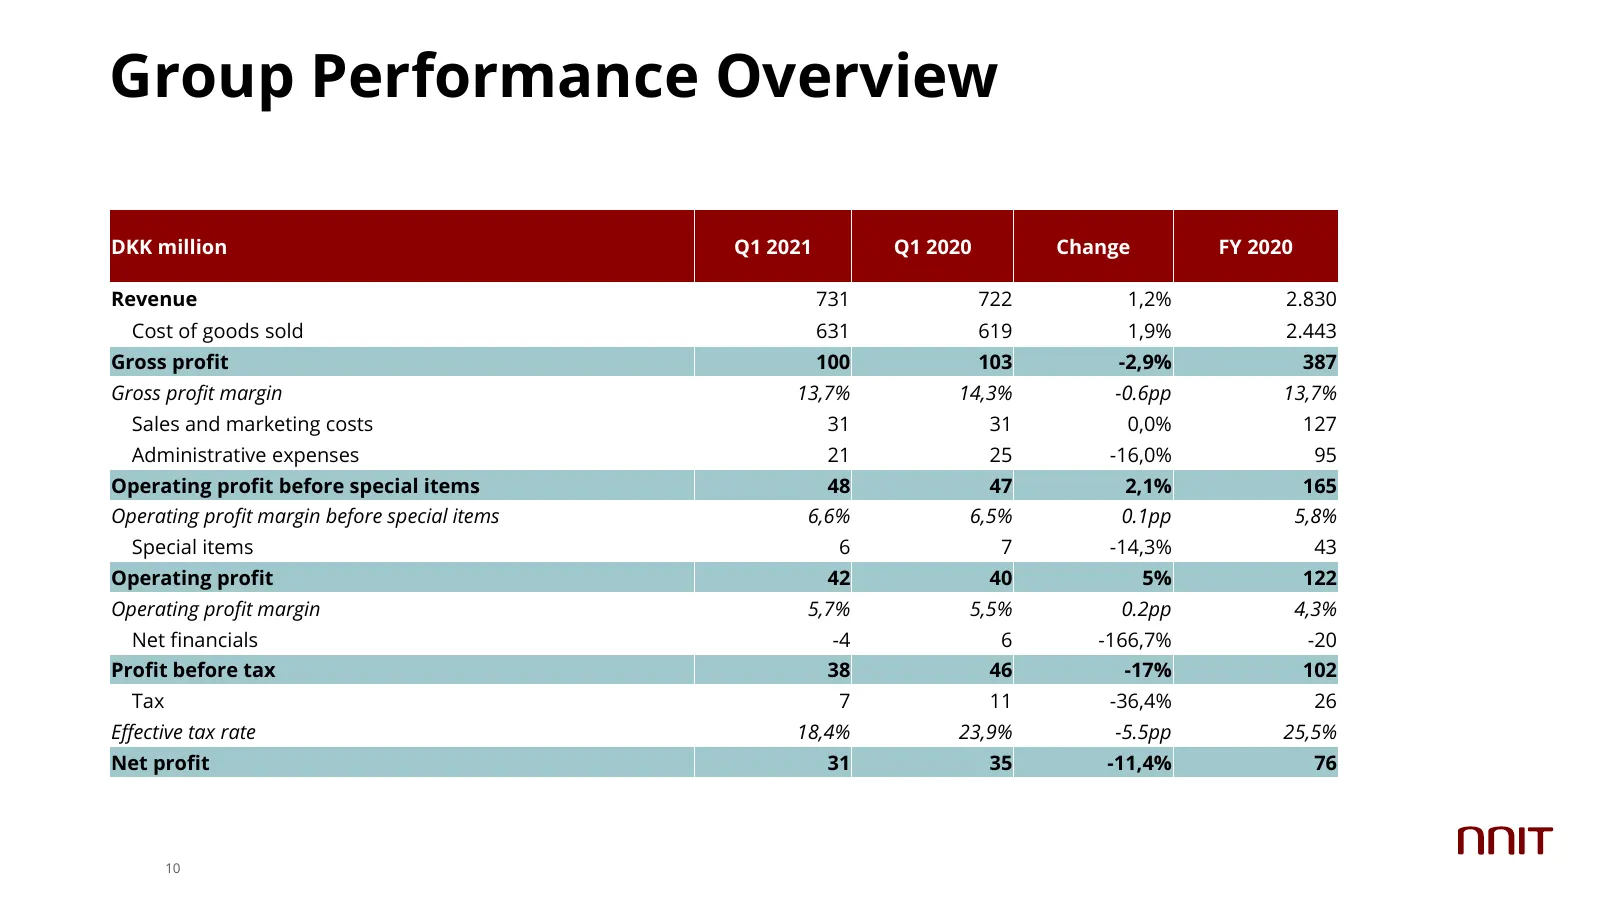
Group Performance Overview DKK million Q1 2021 Q1 2020 Change FY 2020 Revenue 731 722 1,2% 2.830 Cost of goods sold 631 619 1,9% 2.443 Gross profit 100 103 -2,9% 387 Gross profit margin 13,7% 14,3% -0.6pp 13,7% Sales and marketing costs 31 31 0,0% 127 Administrative expenses 21 25 -16,0% 95 Operatin
Slide 11: Life Sciences
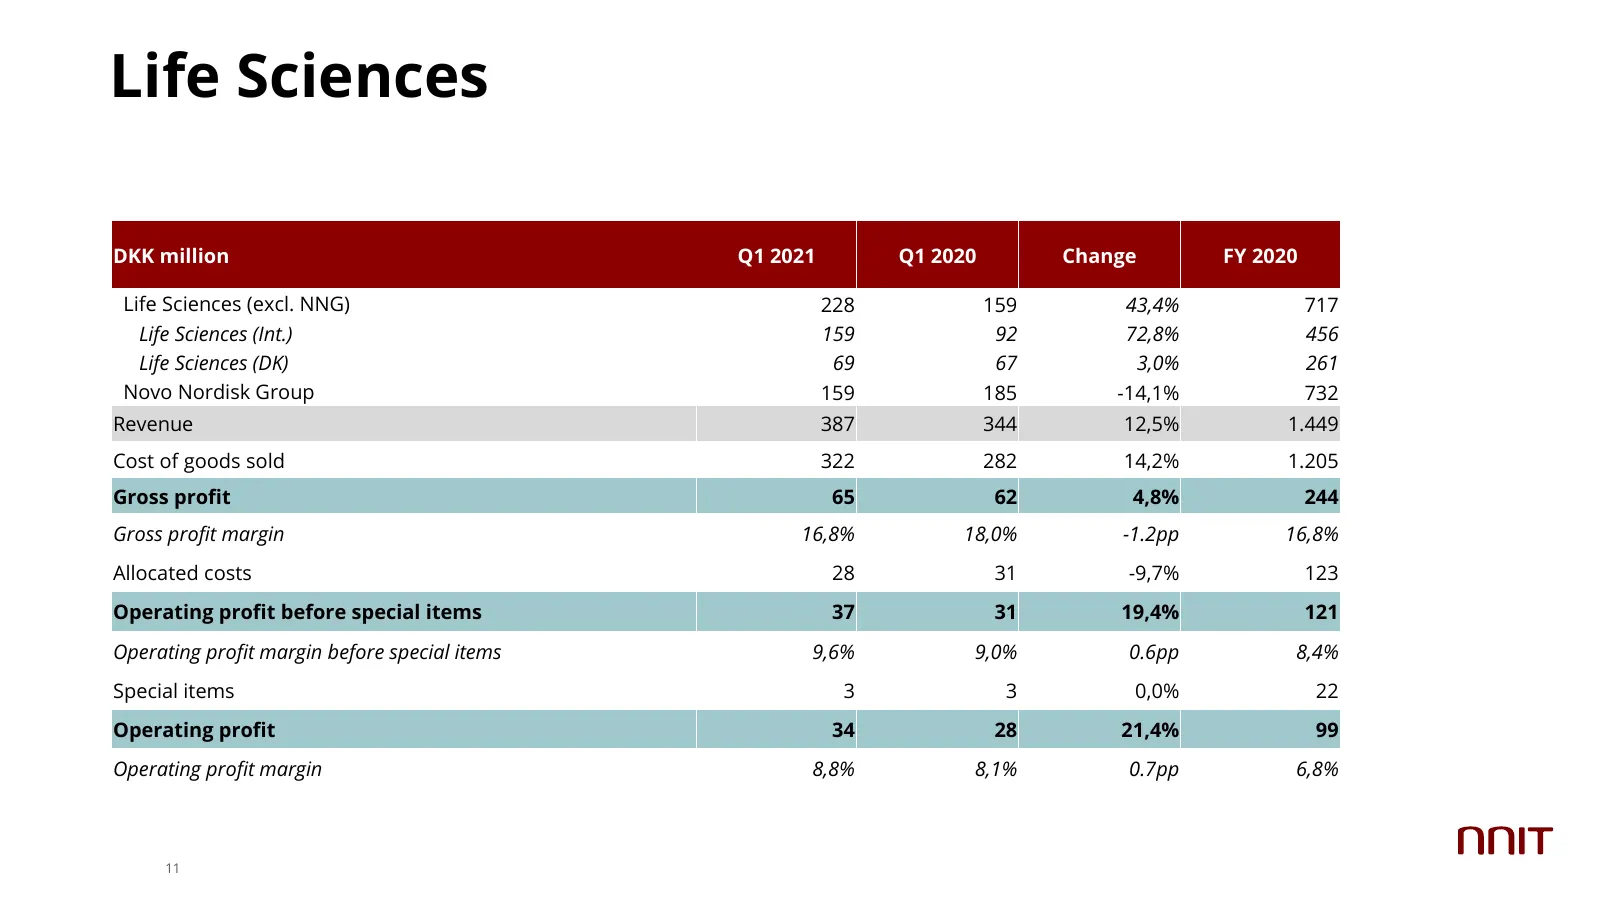
Life Sciences DKK million Q1 2021 Q1 2020 Change FY 2020 Life Sciences (excl. NNG) 228 159 43,4% 717 Life Sciences (Int.) 159 92 72,8% 456 Life Sciences (DK) 69 67 3,0% 261 Novo Nordisk Group 159 185 -14,1% 732 Revenue 387 344 12,5% 1.449 Cost of goods sold 322 282 14,2% 1.205 Gross profit 65 62 4,8
Slide 12: Private & Public
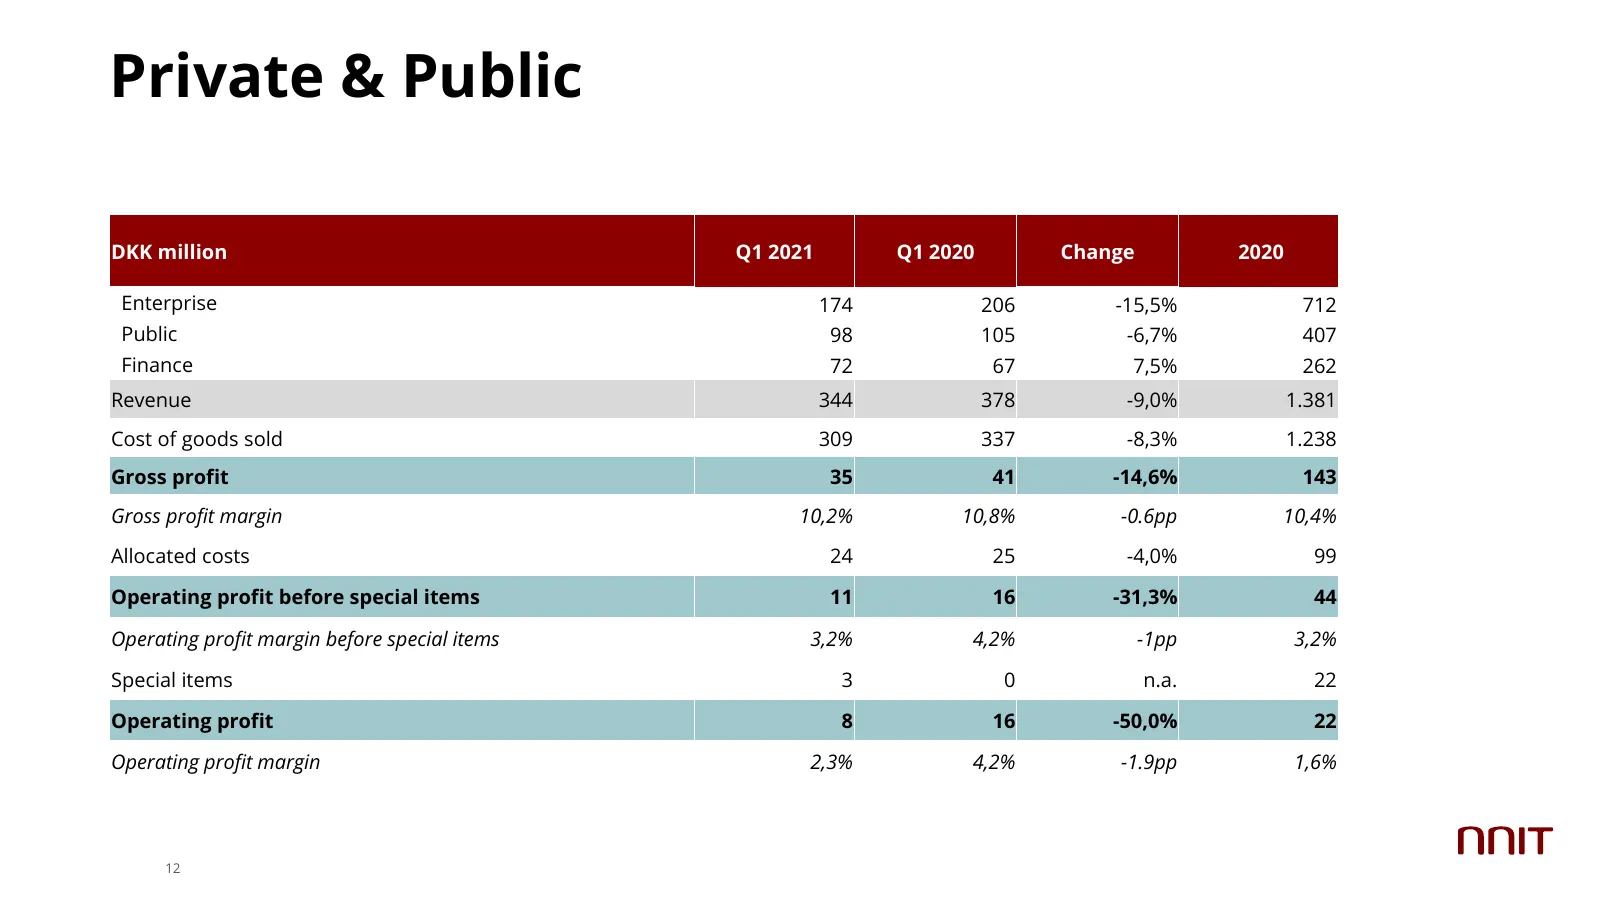
Private & Public DKK million Q1 2021 Q1 2020 Change 2020 Enterprise 174 206 -15,5% 712 Public 98 105 -6,7% 407 Finance 72 67 7,5% 262 Revenue 344 378 -9,0% 1.381 Cost of goods sold 309 337 -8,3% 1.238 Gross profit 35 41 -14,6% 143 Gross profit margin 10,2% 10,8% -0.6pp 10,4% Allocated costs 24 25 -4
Slide 13: Agenda
Agenda 01 Highlights for Q1 2021 02 Financial performance 03 Balance sheet and cash flow 04 Outlook for 2021 05 Closing remarks 13
Slide 14: Balance sheet
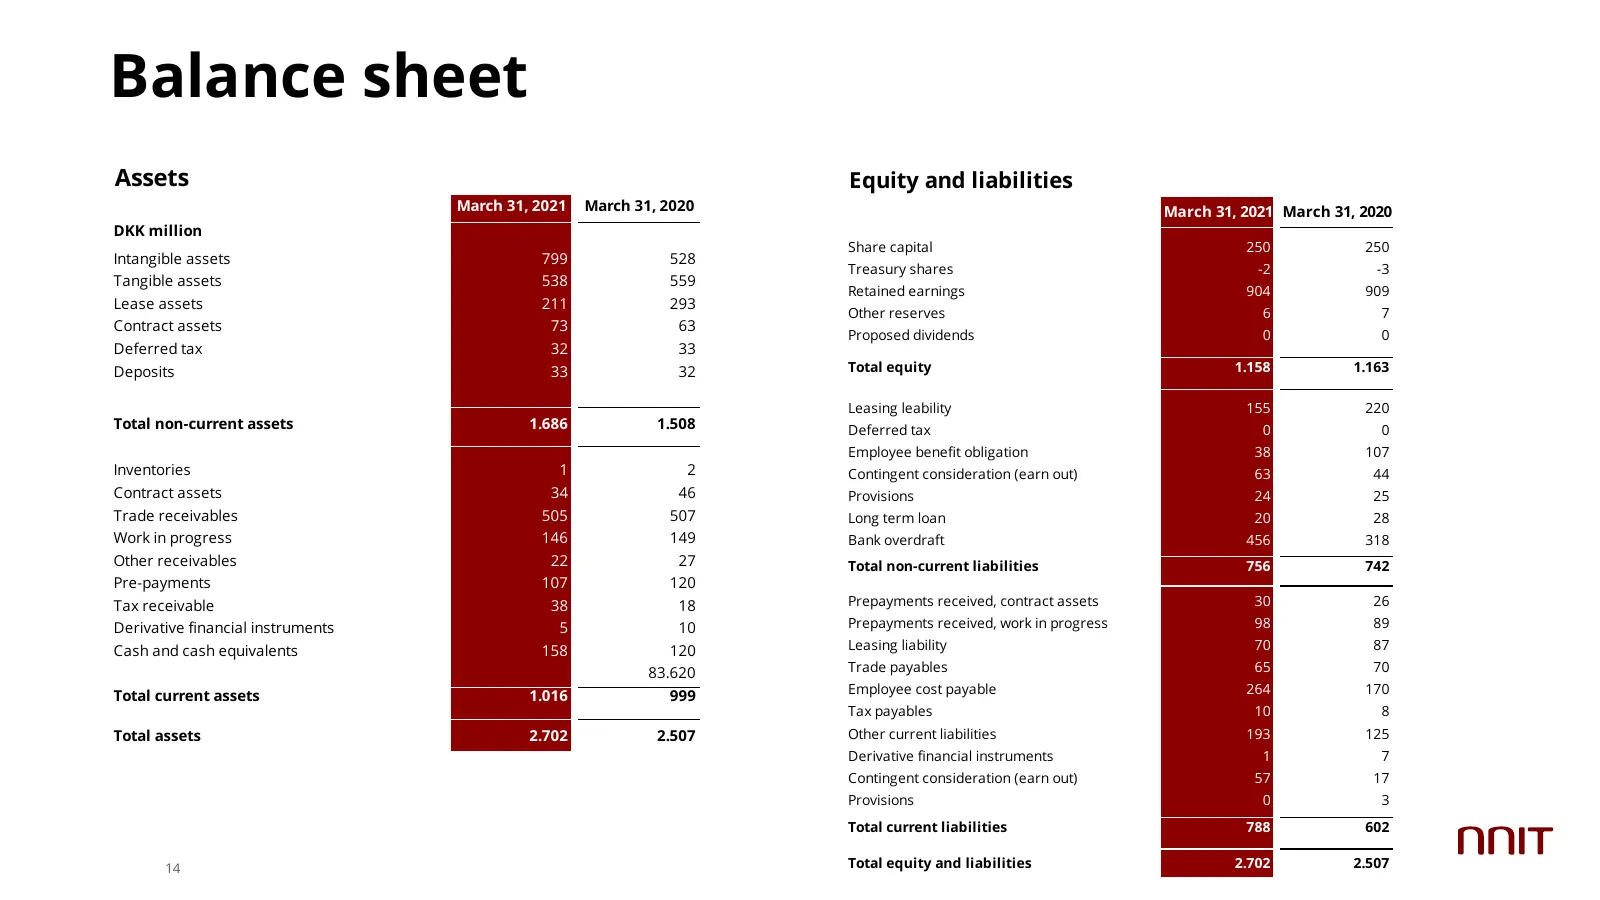
Balance sheet Assets Equity and liabilities March 31, 2021 March 31, 2020 March 31, 2021 March 31, 2020 DKK million Share capital 250 250 Intangible assets 799 528 Treasury shares -2 -3 Tangible assets 538 559 Retained earnings 904 909 Lease assets 211 293 Other reserves 6 7 Contract assets 73 63 Pr
Slide 15: Cash flows
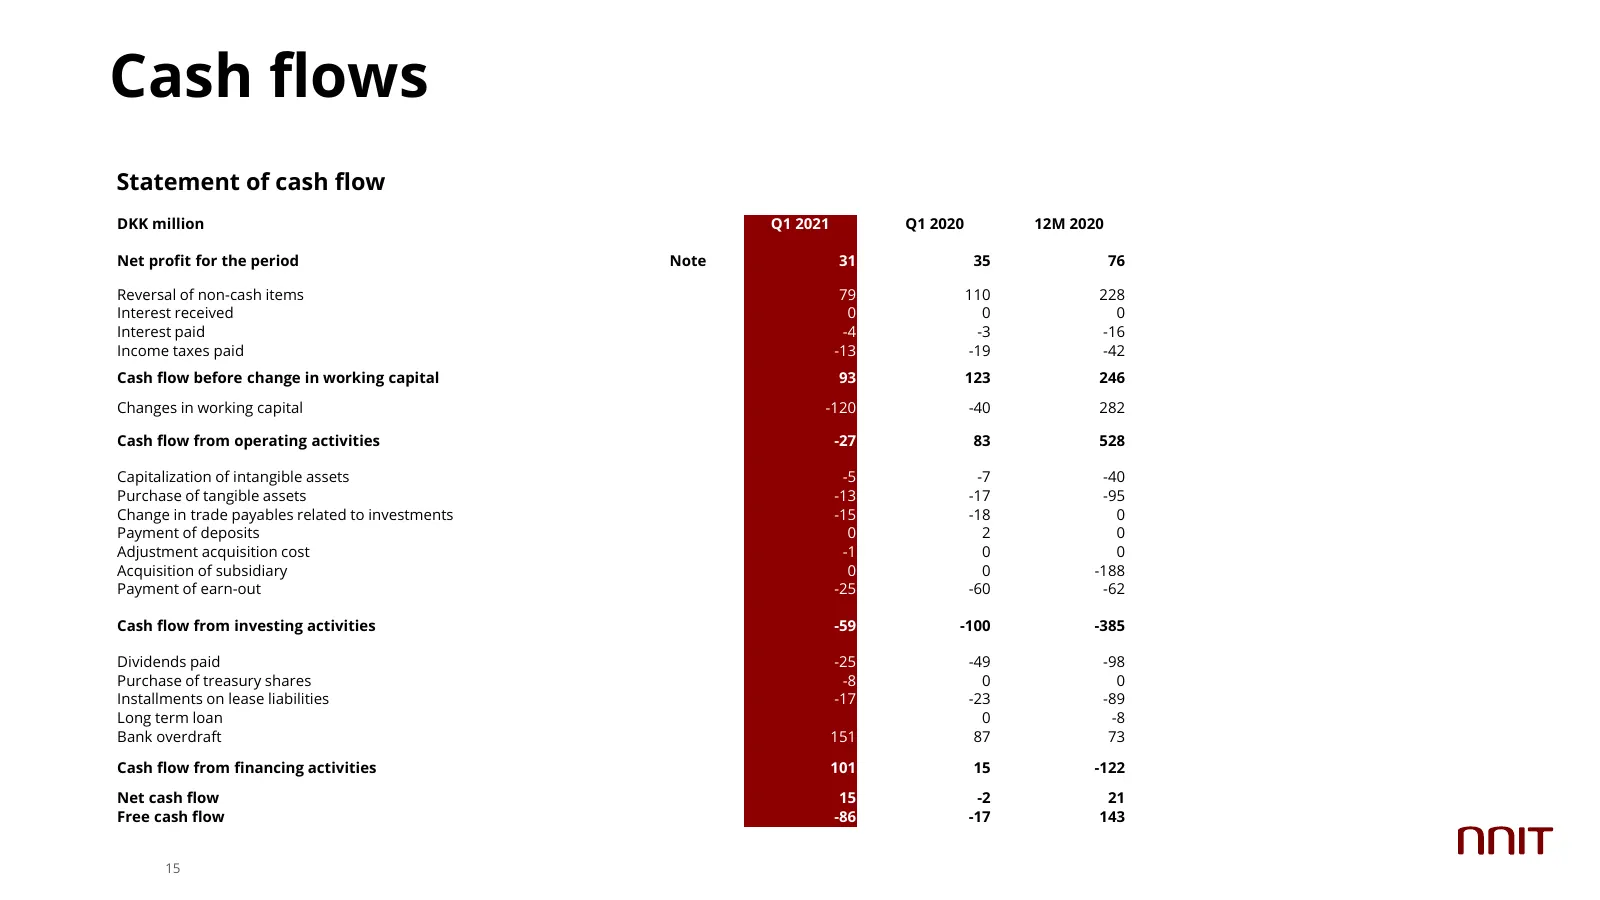
Cash flows Statement of cash flow DKK million Q1 2021 Q1 2020 12M 2020 Net profit for the period Note 31 35 76 Reversal of non-cash items 79 110 228 Interest received 0 0 0 Interest paid -4 -3 -16 Income taxes paid -13 -19 -42 Cash flow before change in working capital 93 123 246 Changes in working
Slide 16: Agenda
Agenda 01 Highlights for Q1 2021 02 Financial performance 03 Balance sheet and cash flow 04 Outlook for 2021 05 Closing remarks 16
Slide 17: Backlog development, current year
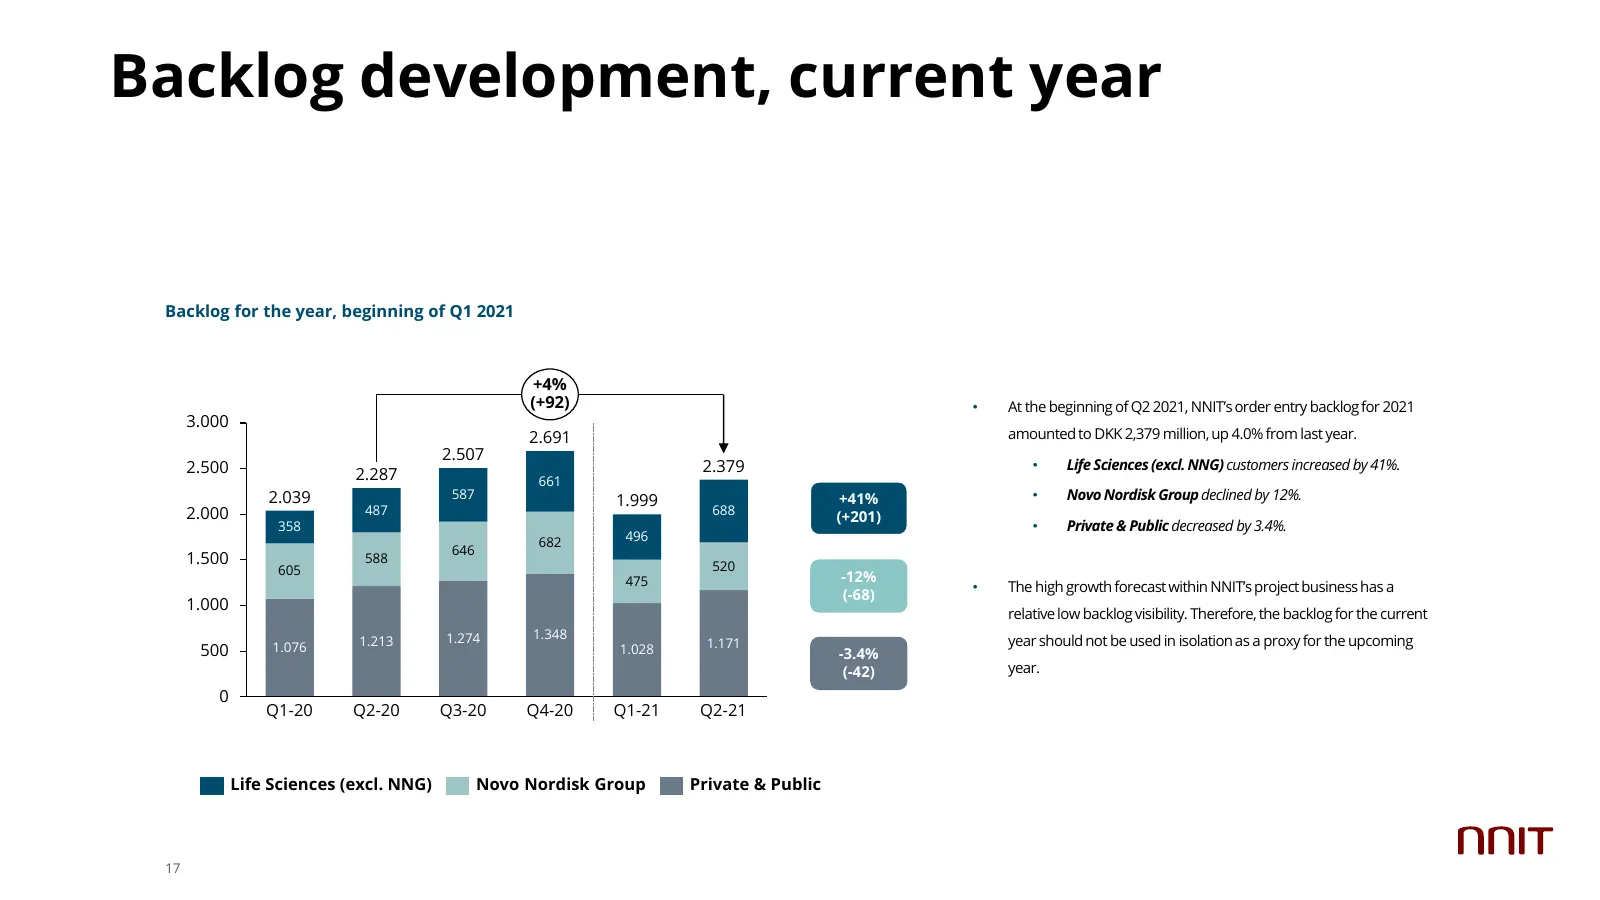
Backlog development, current year Backlog for the year, beginning of Q1 2021 +4% (+92) • At the beginning of Q2 2021, NNIT’s order entry backlog for 2021 3.000 2.691 amounted to DKK 2,379 million, up 4.0% from last year. 2.507 2.500 2.379 • Life Sciences (excl. NNG) customers increased by 41%. 2.287
Slide 18: Outlook
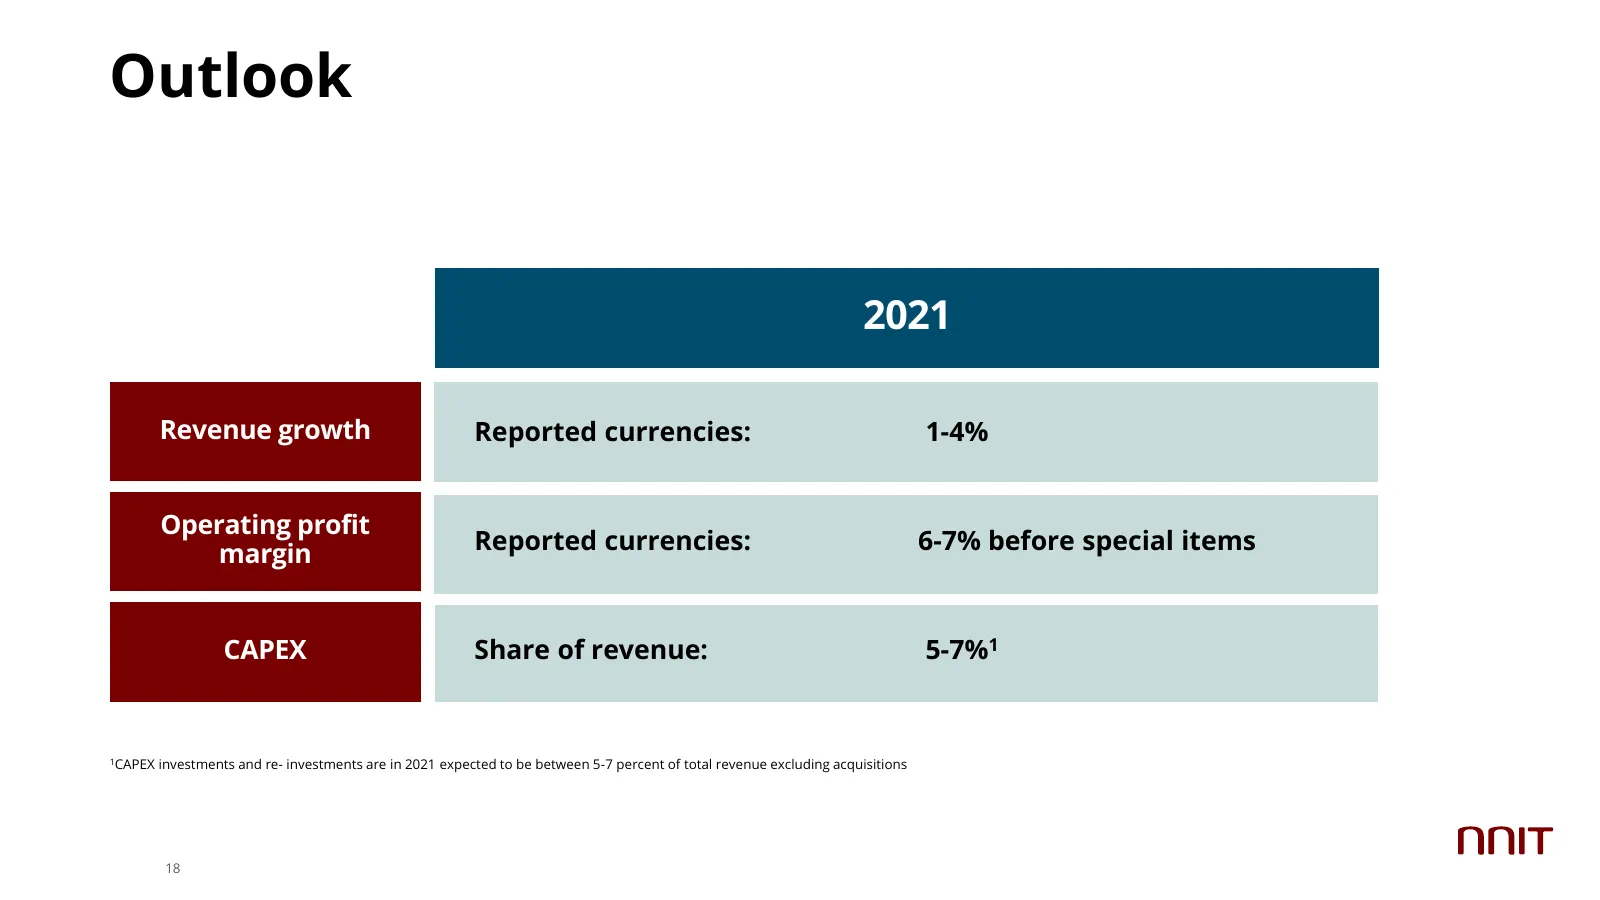
Outlook 2021 Revenue growth Reported currencies: 1-4% Operating profit margin Reported currencies: 6-7% before special items CAPEX Share of revenue: 5-7%1 1CAPEX investments and re- investments are in 2021 expected to be between 5-7 percent of total revenue excluding acquisitions 18
Slide 19: Agenda
Agenda 01 Highlights for Q1 2021 02 Financial performance 03 Balance sheet and cash flow 04 Outlook for 2021 05 Closing remarks 19
Slide 20: Closing remarks
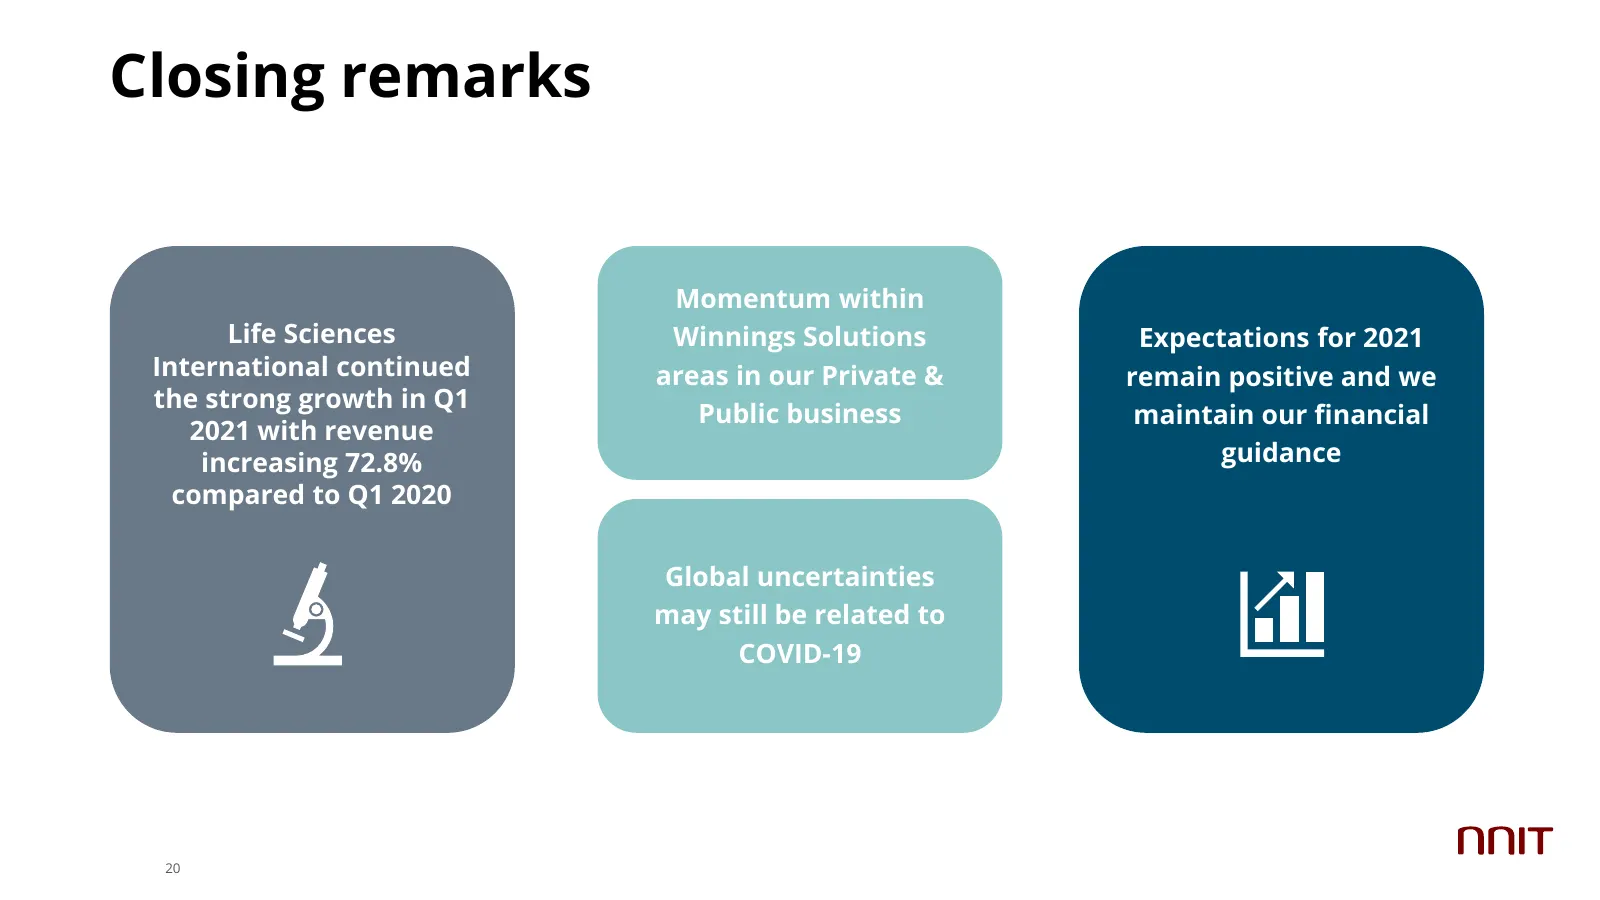
Closing remarks Momentum within Life Sciences Winnings Solutions Expectations for 2021 International continued areas in our Private & remain positive and we the strong growth in Q1 Public business maintain our financial 2021 with revenue increasing 72.8% guidance compared to Q1 2020 Global uncertain

Slide 21: Questions
Questions ANIT
Slide 22: Investor contact information
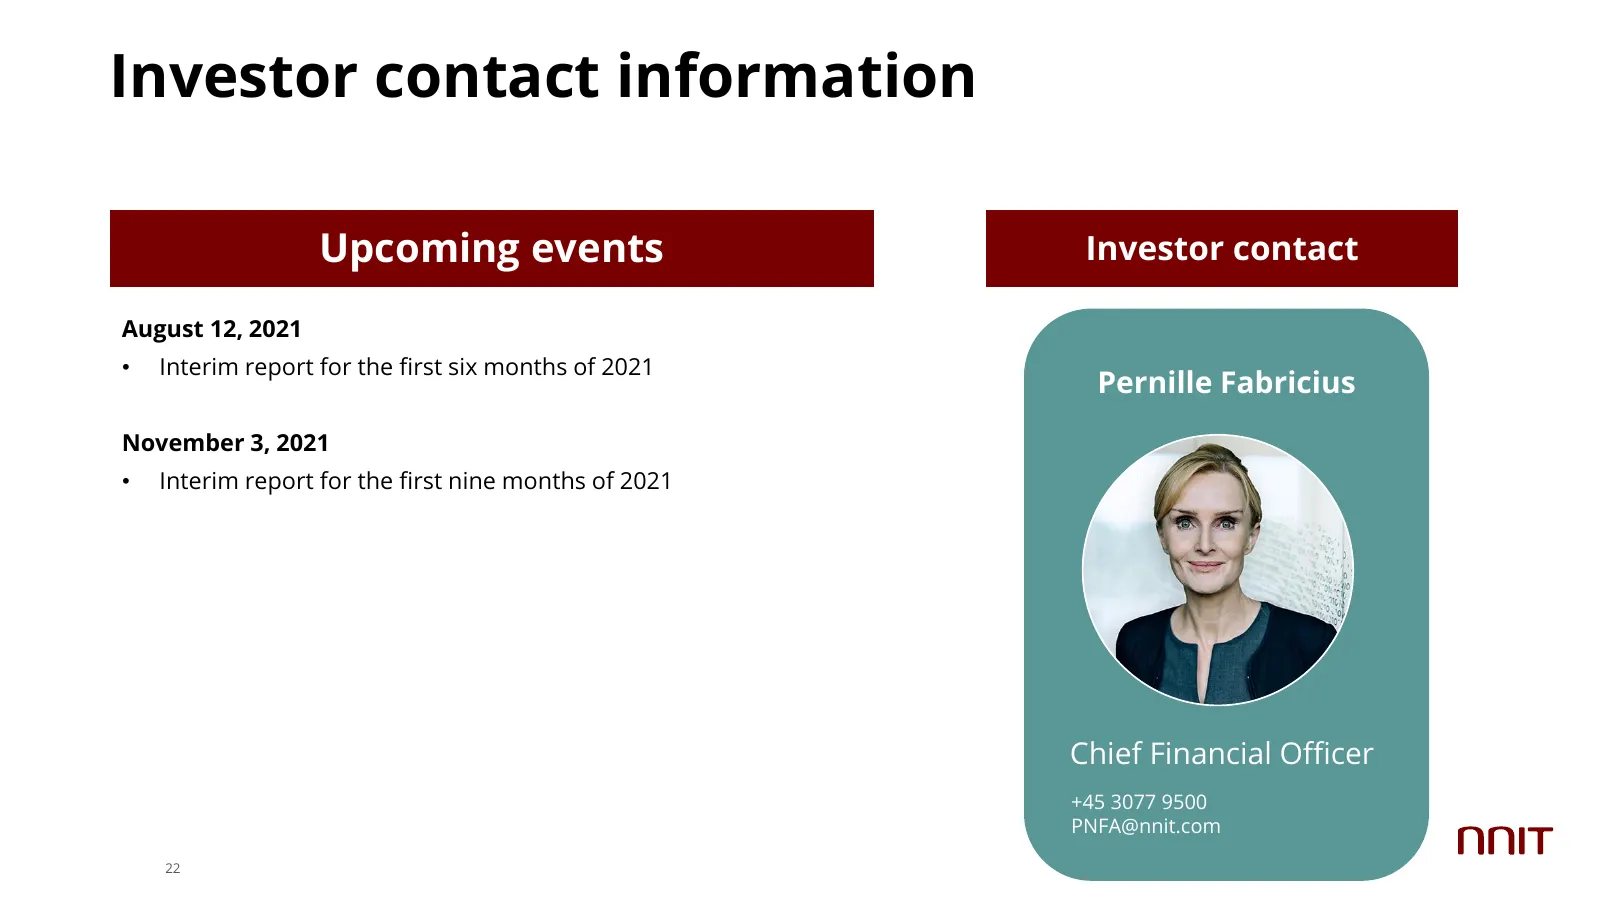
Investor contact information Upcoming events Investor contact August 12, 2021 • Interim report for the first six months of 2021 Pernille Fabricius November 3, 2021 • Interim report for the first nine months of 2021 Chief Financial Officer +45 3077 9500 PNFA@nnit.com 22
Slide 23: We make a mark
We make a mark nnit.com ANIT
Source: Internet Archive copy of nnit.com
More decks from Nnit A/S
 Q3 2026 Earnings Presentation26 slides · November 2026
 Q2 2026 Earnings Presentation22 slides · August 2026
 Q1 2026 Earnings Presentation24 slides · May 2026
 FY2025 Earnings Presentation30 slides · February 2026
 Q3 2025 Earnings Presentation26 slides · November 2025
 Q2 2025 Earnings Presentation26 slides · September 2025