Inland Real Estate — Investor Presentation (November 2007)
23 slides from Inland Real Estate's investor presentation, Nov 14, 2007

Slide 1: Investor Presentation 3rd Quarter 2007
Investor Presentation www.inlandrealestate.com NYSE: IRC 3rd Quarter 2007
Slide 2: Forward-Looking Statements
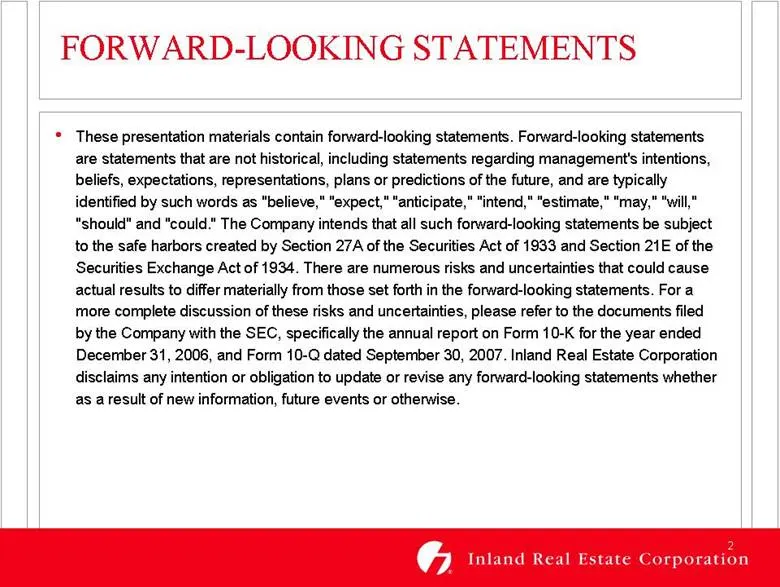
FORWARD-LOOKING STATEMENTS These presentation materials contain forward-looking statements. Forward-looking statements are statements that are not historical, including statements regarding management's intentions, beliefs, expectations, representations, plans or predictions of the future, and are t
Slide 3: IRC Snapshot
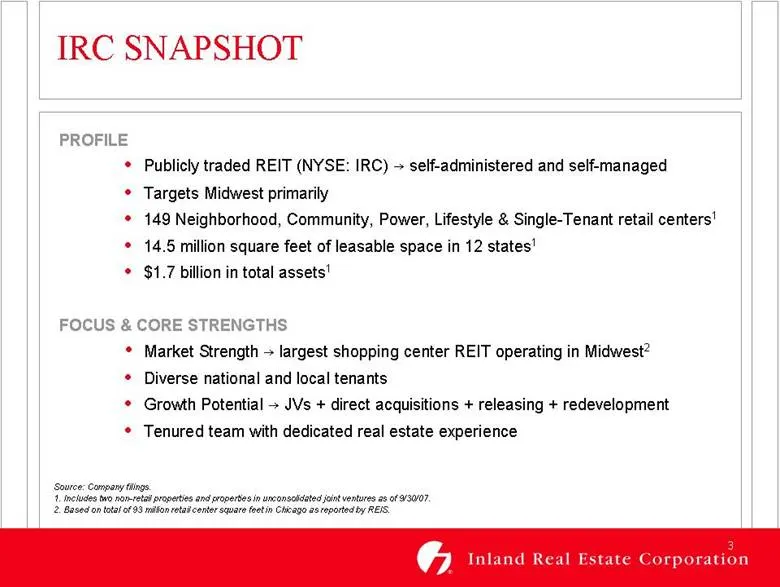
IRC SNAPSHOT Source: Company filings. 1. Includes two non-retail properties and properties in unconsolidated joint ventures as of 9/30/07. 2. Based on total of 93 million retail center square feet in Chicago as reported by REIS. PROFILE Publicly traded REIT (NYSE: IRC) — self-administered and self-m
Slide 4: IRC Team
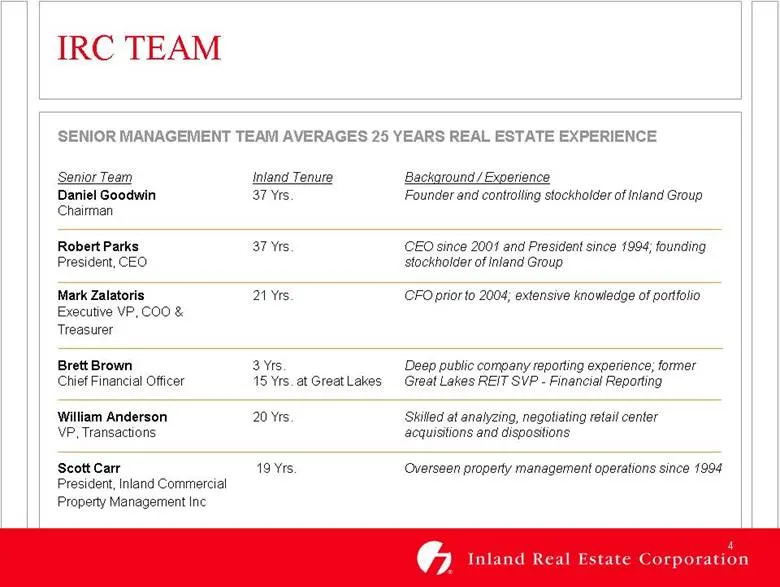
IRC TEAM SENIOR MANAGEMENT TEAM AVERAGES 25 YEARS REAL ESTATE EXPERIENCE Senior Team Inland Tenure Background / Experience Daniel Goodwin 37 Yrs. Founder and controlling stockholder of Inland Group Chairman Robert Parks 37 Yrs. CEO since 2001 and President since 1994; founding President, CEO stockho
Slide 5: IRC Portfolio
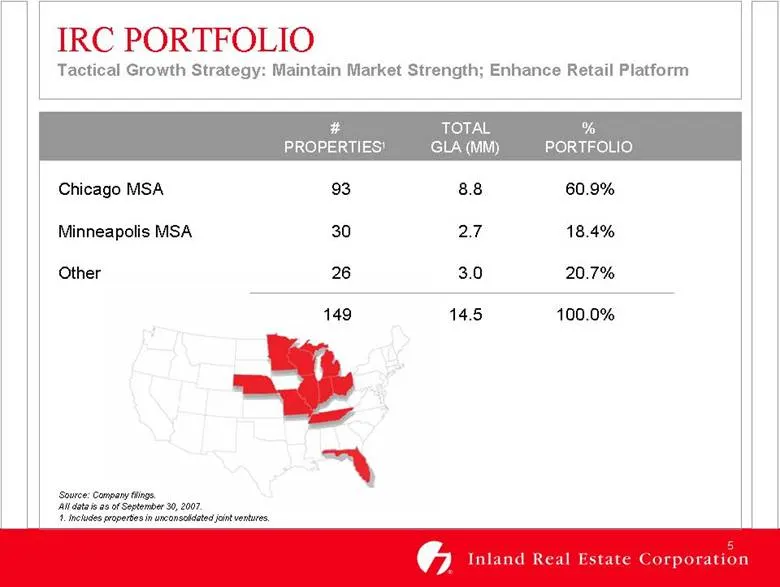
IRC PORTFOLIO Tactical Growth Strategy: Maintain Market Strength; Enhance Retail Platform Chicago MSA 93 8.8 60.9% Minneapolis MSA 30 2.7 18.4% Other 26 3.0 20.7% 149 14.5 100.0% # TOTAL % PROPERTIES1 GLA (MM) PORTFOLIO Source: Company filings. All data is as of September 30, 2007. 1. Includes prope
Slide 6: IRC Today
IRC TODAY Groundwork Established — Measurable Impact Strong Performance 3Q07 Consistent Solid Operations JV Progress
Slide 7: IRC Financial Snapshot
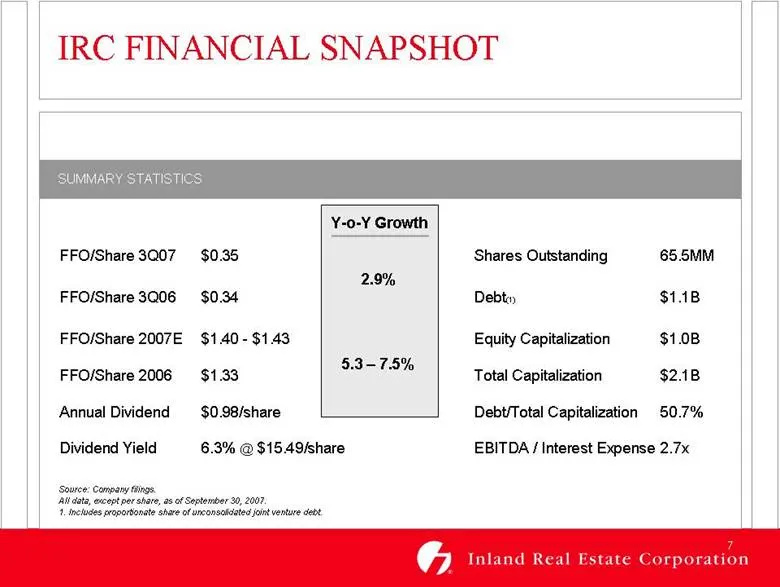
IRC FINANCIAL SNAPSHOT SUMMARY STATISTICS Source: Company filings. All data, except per share, as of September 30, 2007. 1. Includes proportionate share of unconsolidated joint venture debt. Y-o-Y Growth 5.3 – 7.5% 2.9% FFO/Share 3Q07 $0.35 Shares Outstanding 65.5MM FFO/Share 3Q06 $0.34 Debt(1) $1.1
Slide 8: IRC Financial Highlights
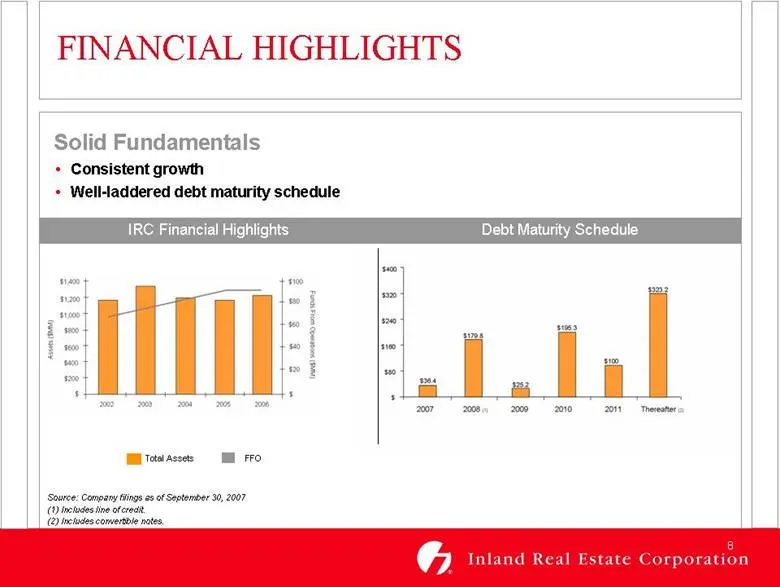
Source: Company filings as of September 30, 2007 (1) Includes line of credit. (2) Includes convertible notes. FINANCIAL HIGHLIGHTS Total Assets FFO IRC Financial Highlights Debt Maturity Schedule Solid Fundamentals Consistent growth Well-laddered debt maturity schedule
Slide 9: Solid FFO & Dividend Growth
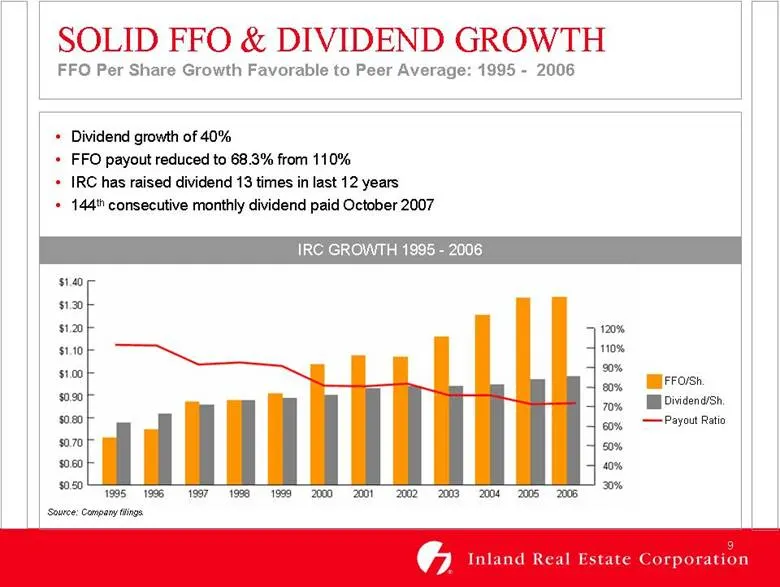
Dividend growth of 40% FFO payout reduced to 68.3% from 110% IRC has raised dividend 13 times in last 12 years 144th consecutive monthly dividend paid October 2007 Source: Company filings. SOLID FFO & DIVIDEND GROWTH FFO Per Share Growth Favorable to Peer Average: 1995 - 2006 IRC GROWTH 1995 - 2006
Slide 10: IRC Tenants — In-Demand & Diversified
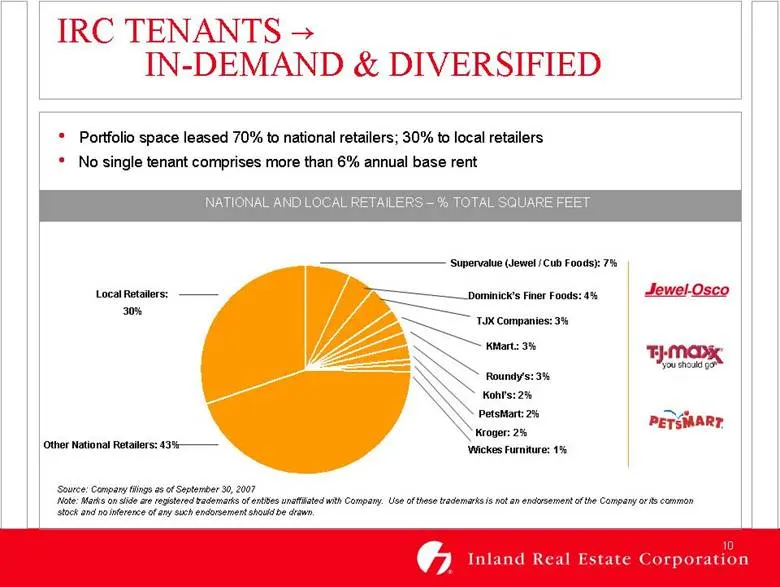
IRC TENANTS — IN-DEMAND & DIVERSIFIED Portfolio space leased 70% to national retailers; 30% to local retailers No single tenant comprises more than 6% annual base rent NATIONAL AND LOCAL RETAILERS – % TOTAL SQUARE FEET Source: Company filings as of September 30, 2007 Note: Marks on slide are registe
Slide 11: Demographics – Peer Group Comparison
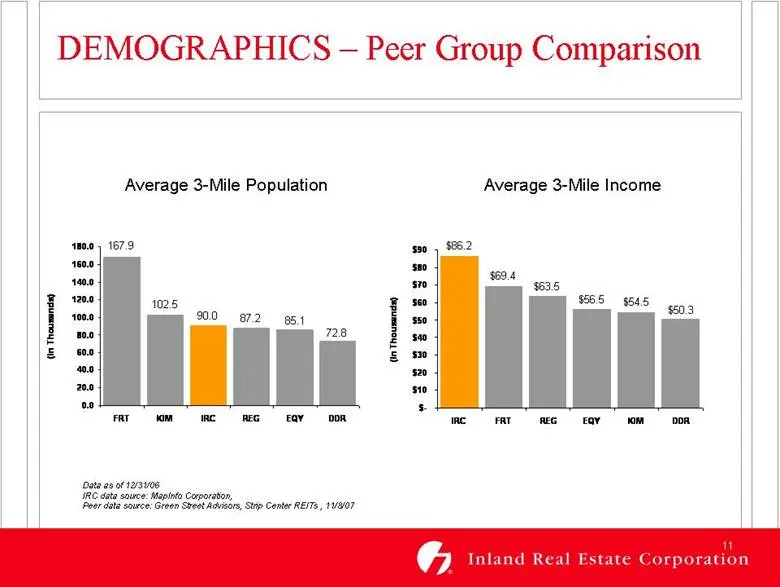
Average 3-Mile Population Average 3-Mile Income DEMOGRAPHICS – Peer Group Comparison Data as of 12/31/06 IRC data source: MapInfo Corporation, Peer data source: Green Street Advisors, Strip Center REITs , 11/8/07 72.8 85.1 87.2 90.0 102.5 167.9 0.0 20.0 40.0 60.0 80.0 100.0 120.0 140.0 160.0 180.0 F
Slide 12: Stable Lease Rollover
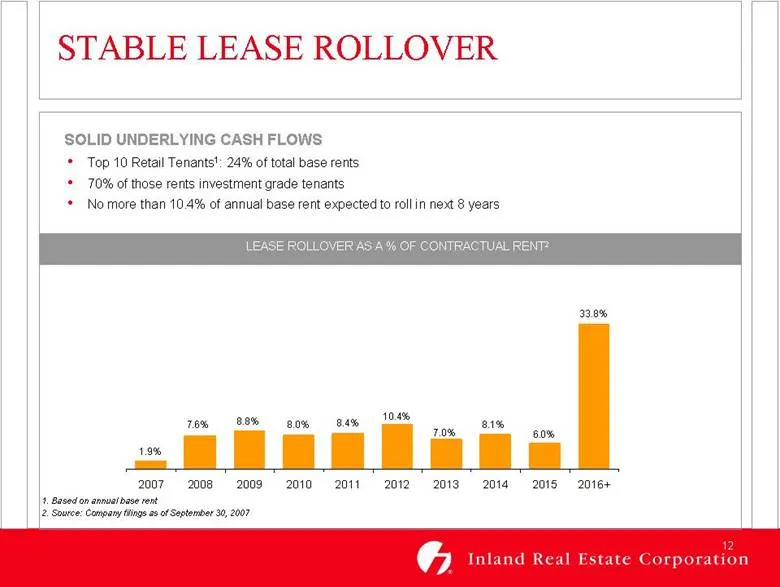
STABLE LEASE ROLLOVER LEASE ROLLOVER AS A % OF CONTRACTUAL RENT2 1. Based on annual base rent 2. Source: Company filings as of September 30, 2007 33.8% 6.0% 8.1% 7.0% 10.4% 8.4% 8.0% 8.8% 7.6% 1.9% 2007 2008 2009 2010 2011 2012 2013 2014 2015 2016+ SOLID UNDERLYING CASH FLOWS Top 10 Retail Tenants1:
Slide 13: Leasing Efficiencies
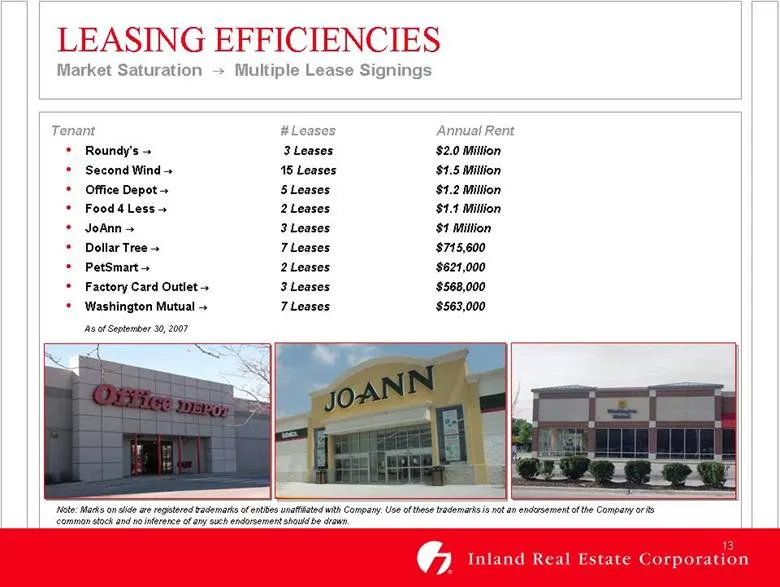
LEASING EFFICIENCIES Market Saturation — Multiple Lease Signings Note: Marks on slide are registered trademarks of entities unaffiliated with Company. Use of these trademarks is not an endorsement of the Company or its common stock and no inference of any such endorsement should be drawn. As of Sept
Slide 14: Rental Rate Growth
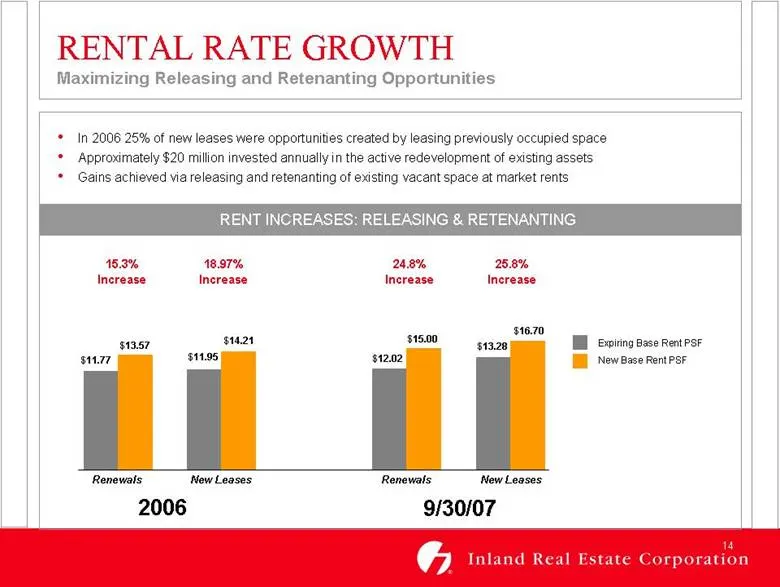
RENTAL RATE GROWTH In 2006 25% of new leases were opportunities created by leasing previously occupied space Approximately $20 million invested annually in the active redevelopment of existing assets Gains achieved via releasing and retenanting of existing vacant space at market rents RENT INCREASES
Slide 15: Critical Mass Has Its Benefits
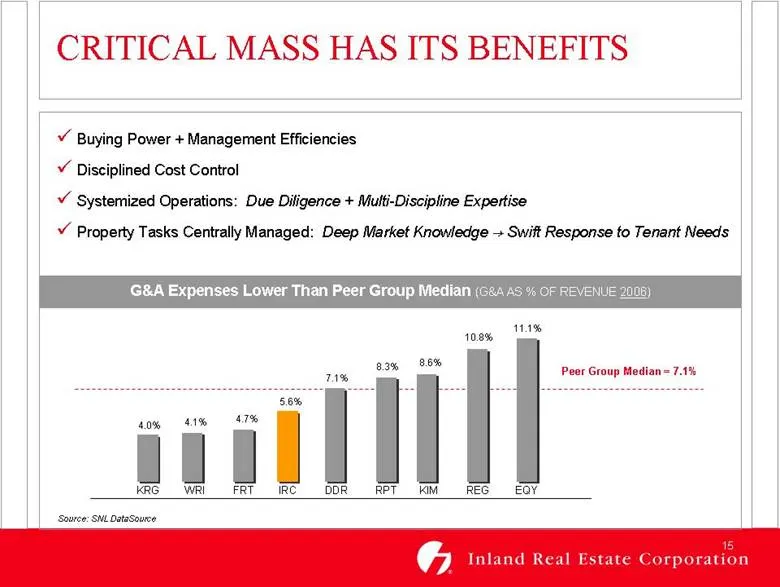
Peer Group Median = 7.1% Source: SNL DataSource CRITICAL MASS HAS ITS BENEFITS Buying Power + Management Efficiencies Disciplined Cost Control Systemized Operations: Due Diligence + Multi-Discipline Expertise Property Tasks Centrally Managed: Deep Market Knowledge — Swift Response to Tenant Needs G&
Slide 16: Acquisitions Criteria
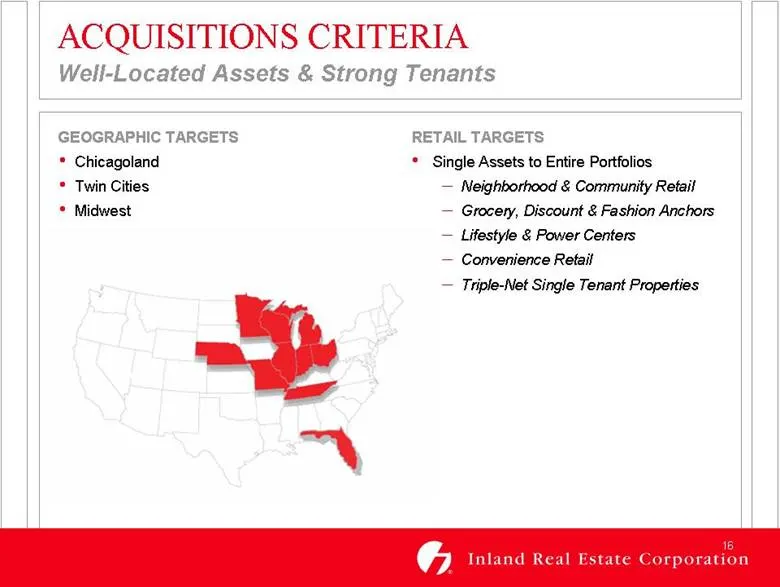
ACQUISITIONS CRITERIA Well-Located Assets & Strong Tenants RETAIL TARGETS Single Assets to Entire Portfolios Neighborhood & Community Retail Grocery, Discount & Fashion Anchors Lifestyle & Power Centers Convenience Retail Triple-Net Single Tenant Properties GEOGRAPHIC TARGETS Chicagoland Twin Cities
Slide 17: Acquisition Opportunities Drive Growth
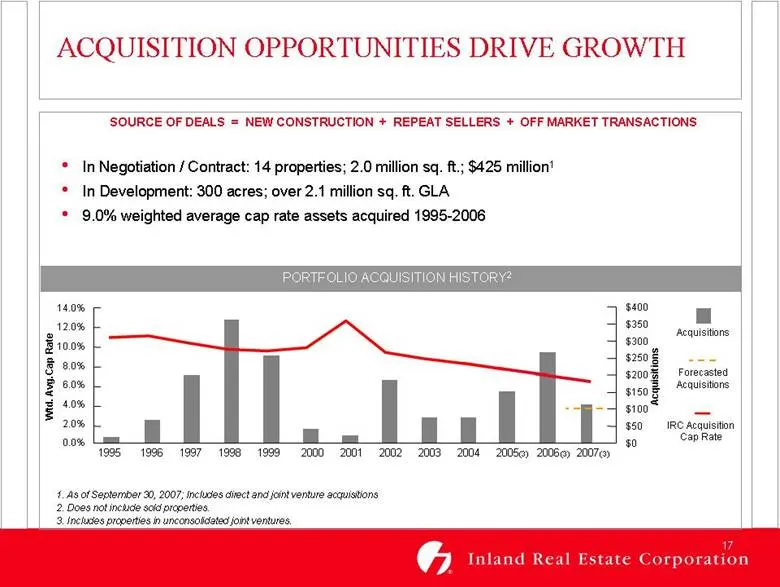
1. As of September 30, 2007; Includes direct and joint venture acquisitions 2. Does not include sold properties. 3. Includes properties in unconsolidated joint ventures. ACQUISITION OPPORTUNITIES DRIVE GROWTH PORTFOLIO ACQUISITION HISTORY2 14.0% 12.0% 10.0% 8.0% 6.0% 4.0% 2.0% 0.0% Acquisitions $400
Slide 18: Joint Ventures Build Value
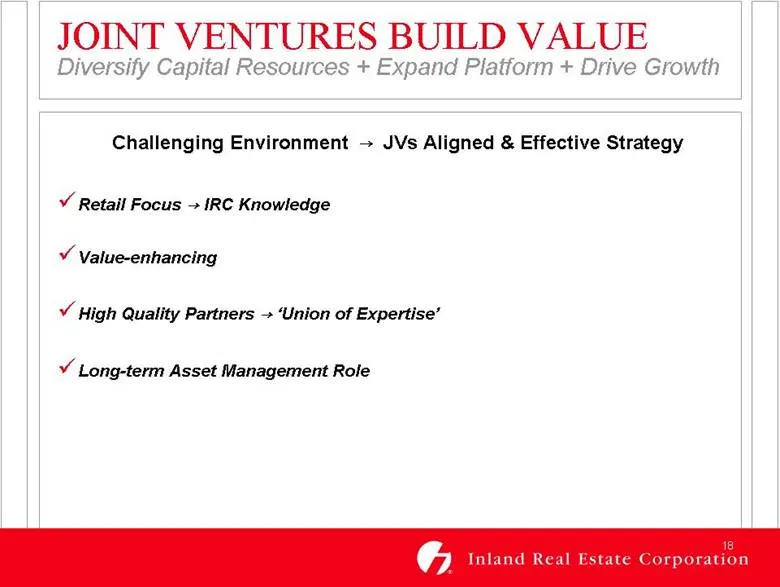
JOINT VENTURES BUILD VALUE Diversify Capital Resources + Expand Platform + Drive Growth Challenging Environment — JVs Aligned & Effective Strategy Retail Focus — IRC Knowledge Value-enhancing High Quality Partners — ‘Union of Expertise’ Long-term Asset Management Role
Slide 19: Joint Ventures Build Value: Asset-Based Joint Ventures
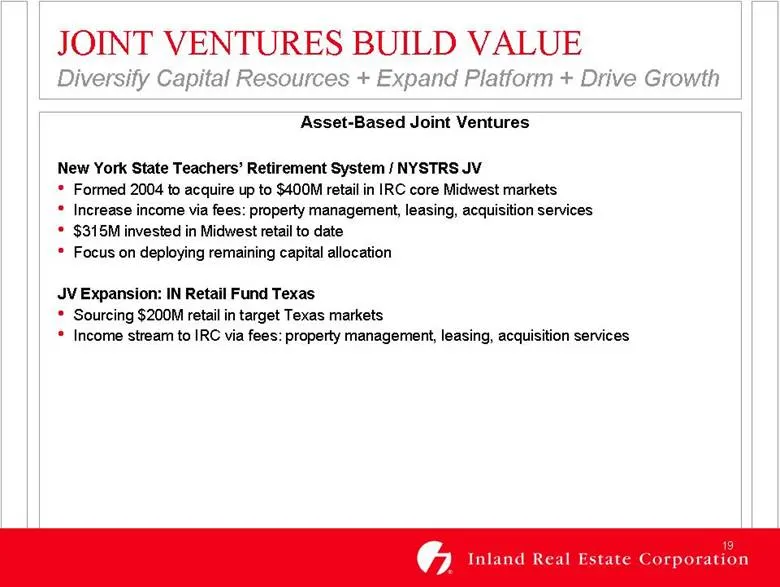
JOINT VENTURES BUILD VALUE Diversify Capital Resources + Expand Platform + Drive Growth Asset-Based Joint Ventures New York State Teachers’ Retirement System / NYSTRS JV Formed 2004 to acquire up to $400M retail in IRC core Midwest markets Increase income via fees: property management, leasing, acqu
Slide 20: Joint Ventures Build Value: Asset Management Joint Venture
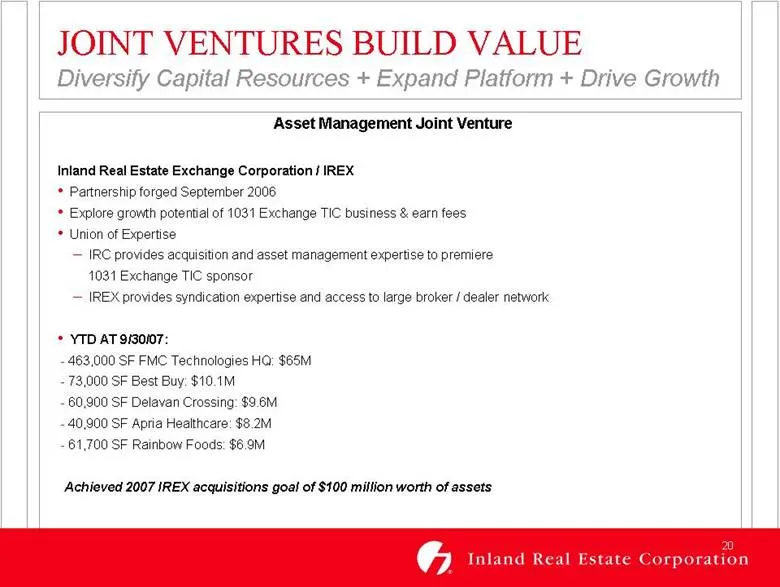
JOINT VENTURES BUILD VALUE Diversify Capital Resources + Expand Platform + Drive Growth Asset Management Joint Venture Inland Real Estate Exchange Corporation / IREX Partnership forged September 2006 Explore growth potential of 1031 Exchange TIC business & earn fees Union of Expertise IRC provides a
Slide 21: Joint Ventures Build Value: Development Joint Ventures
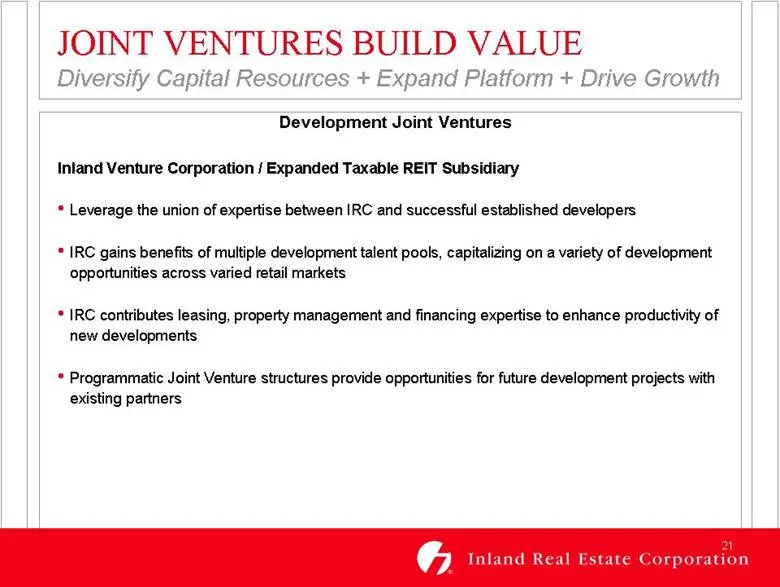
JOINT VENTURES BUILD VALUE Diversify Capital Resources + Expand Platform + Drive Growth Development Joint Ventures Inland Venture Corporation / Expanded Taxable REIT Subsidiary Leverage the union of expertise between IRC and successful established developers IRC gains benefits of multiple developmen
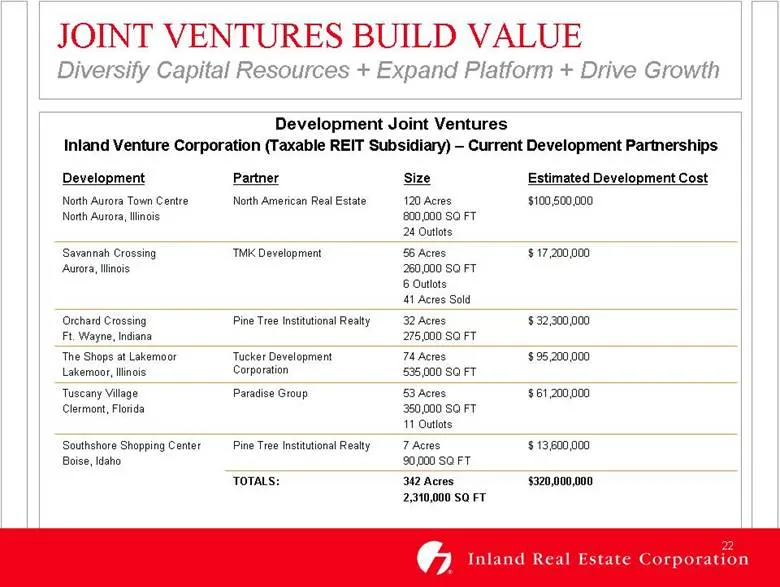
Slide 22: Current Development Partnerships
JOINT VENTURES BUILD VALUE Diversify Capital Resources + Expand Platform + Drive Growth Development Joint Ventures Inland Venture Corporation (Taxable REIT Subsidiary) – Current Development Partnerships $320,000,000 342 Acres 2,310,000 SQ FT TOTALS: $ 13,600,000 7 Acres 90,000 SQ FT Pine Tree Instit
Slide 23: IRC Today
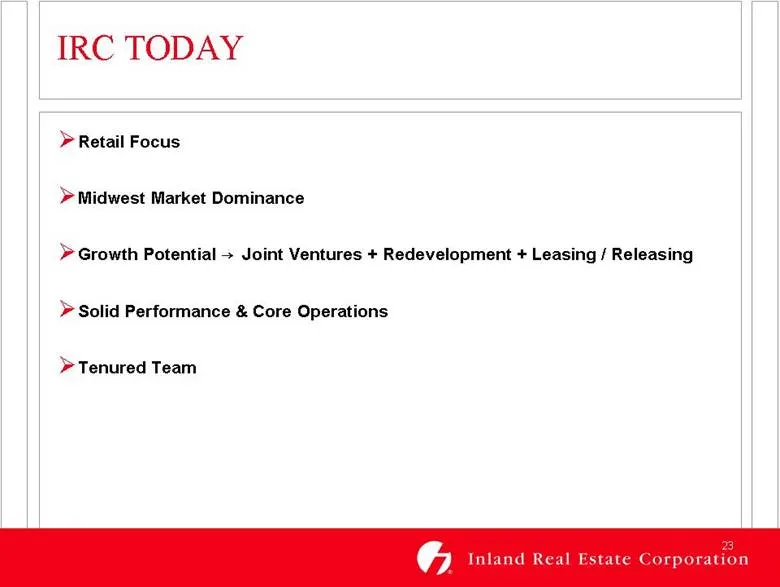
IRC TODAY Retail Focus Midwest Market Dominance Growth Potential — Joint Ventures + Redevelopment + Leasing / Releasing Solid Performance & Core Operations Tenured Team
Source: SEC EDGAR · 8-K filed Nov 14, 2007
More decks from Inland Real Estate Corp
 Investor Presentation (November 2015)30 slides · Nov 17, 2015
 Investor Presentation (September 2015)29 slides · Sep 16, 2015
 Investor Presentation (June 2015)29 slides · Jun 9, 2015
 Investor Presentation (May 2015)26 slides · May 15, 2015
 Investor Presentation (February 2015)26 slides · Feb 24, 2015
 Investor Presentation (November 2014)26 slides · Nov 5, 2014