Marubeni Corporation · TSE:8002
Marubeni — Q2 FY2009 Earnings Presentation
22 slides from Marubeni's earnings presentation, Nov 5, 2009
Slide 1: Briefing on Financial Results for the 2nd Quarter of FY2009
Briefing on Financial Results for the 2nd Quarter of FY2009 November 5, 2009 Marubeni Corporation
Slide 2: English translation notice and accounting changes
This document is an English translation of a statement written initially in Japanese. The original in Japanese should be considered the primary version. * Due to the changes of accounting standards, the Company has started to announce “Equity” which is the total of “Marubeni Corp. shareholders’ equi
Slide 3: Summary of Financial Results for the 2nd Quarter of FY2009
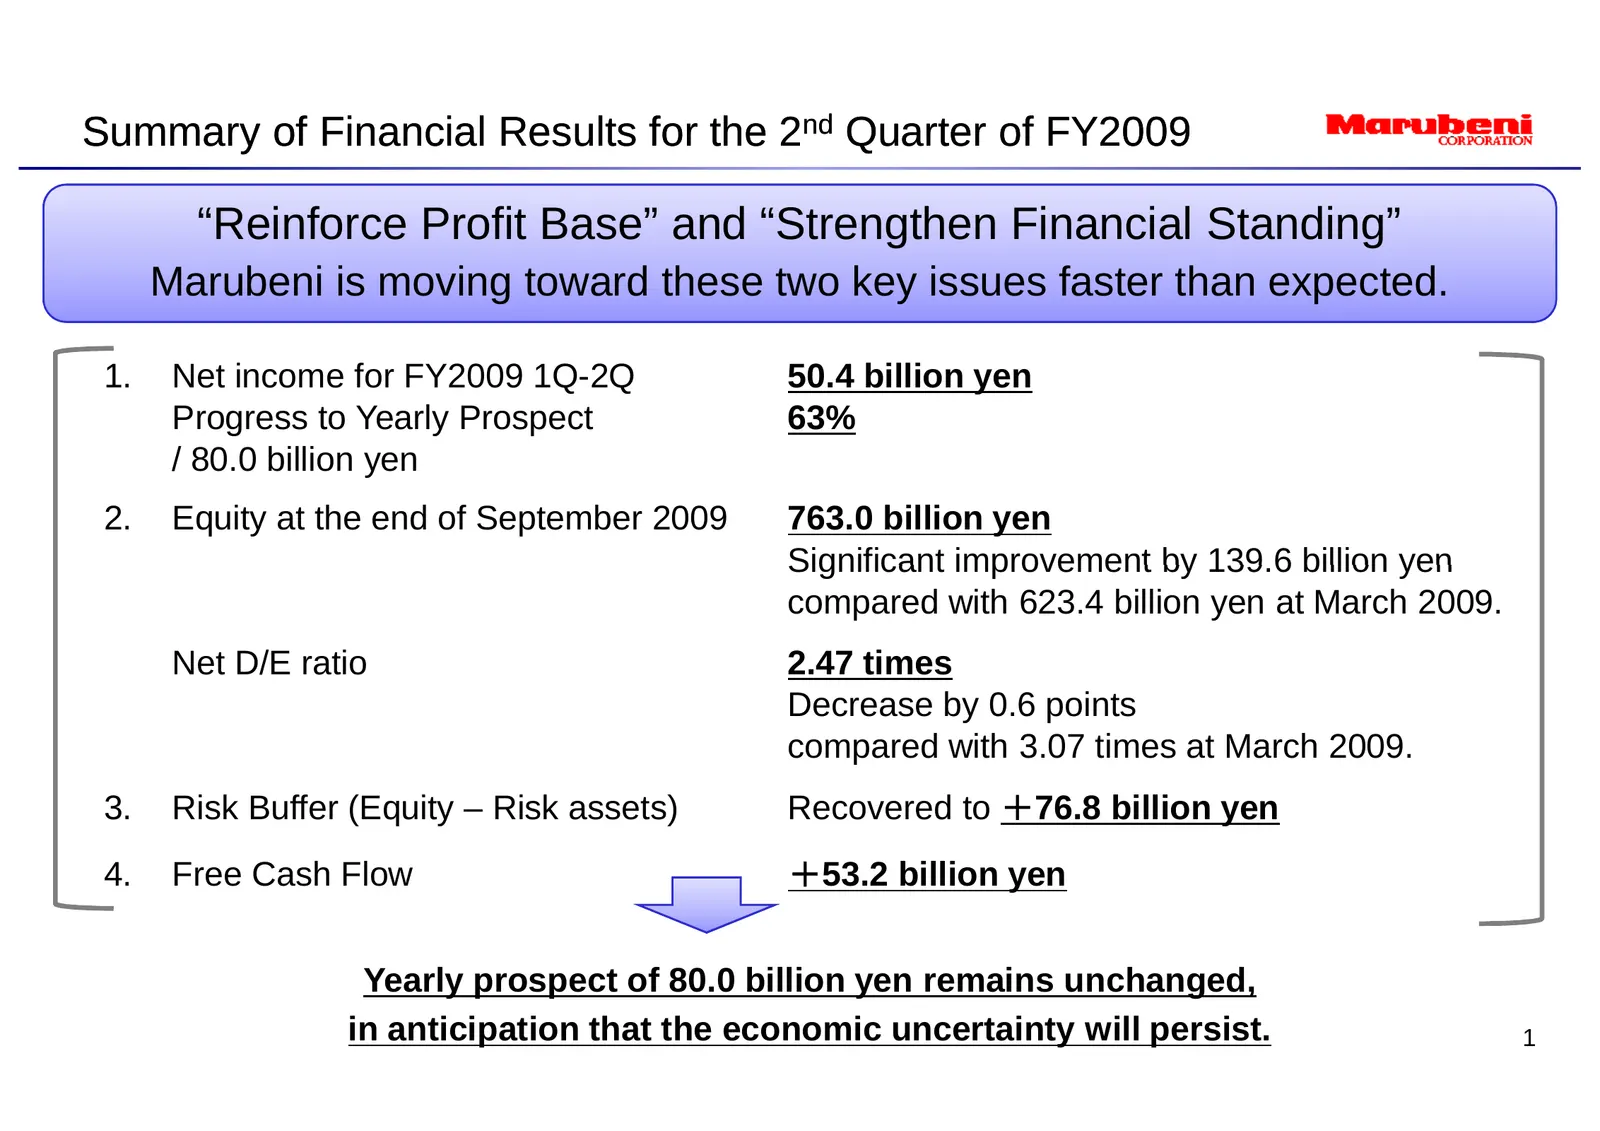
Summary of Financial Results for the 2nd Quarter of FY2009 “Reinforce Profit Base” and “Strengthen Financial Standing” Marubeni is moving toward these two key issues faster than expected. 1. Net income for FY2009 1Q-2Q 50.4 billion yen Progress to Yearly Prospect 63% / 80.0 billion yen 2. Equity at
Slide 4: Key issues of FY2009: Reinforce Profit Base
1. Key issues of FY2009① ( Reinforce Profit Base ) 2. Key y issues of FY2009②② ( Strengthen Financial Standing ) 3. Progress of SG2009 2
Slide 5: Business environment for Marubeni
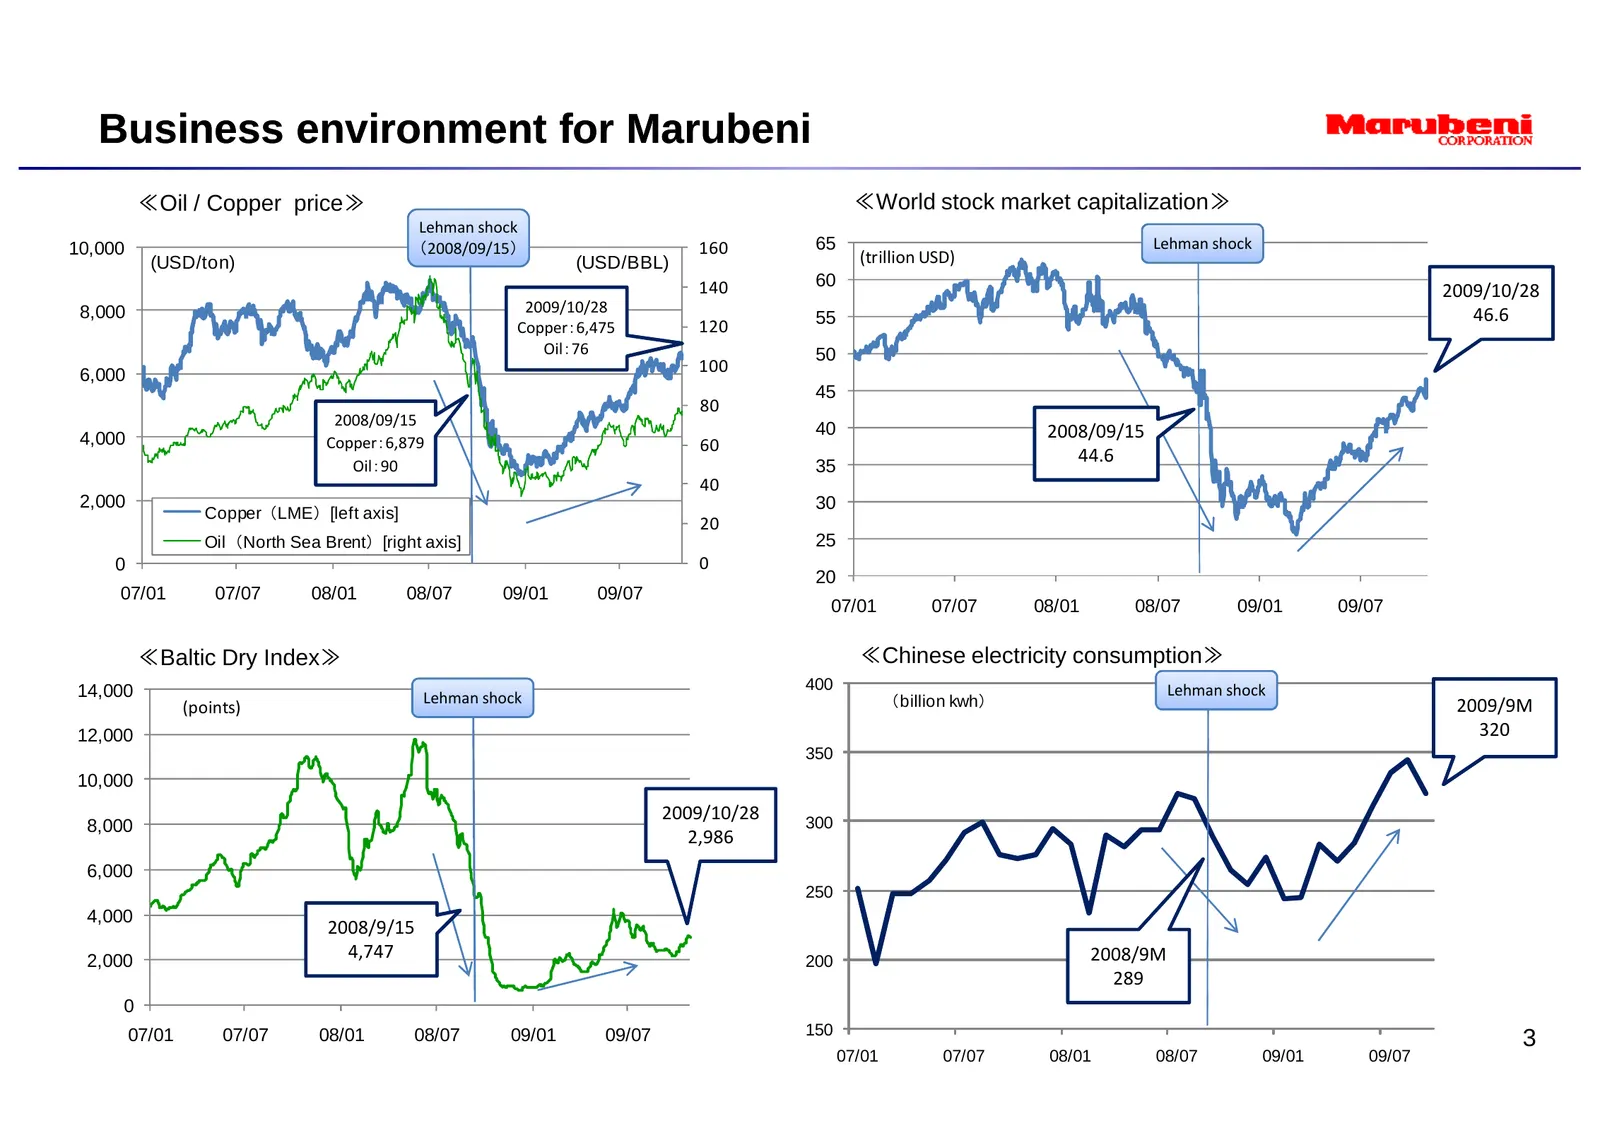
Business environment for Marubeni ≪Oil / Copper price≫ ≪World stock market capitalization≫ Lehman shock 10,000 (2008/09/15) 160 65 Lehman shock (USD/ton) (USD/BBL) (trillion USD) 140 60 2009/10/28 8,000 2009/10/28 55 46.6 Copper:6,475 120 Oil:76 50 6,000 100 45 80 2008/09/15 40 2008/09/15 4,000 Copp
Slide 6: Net Income
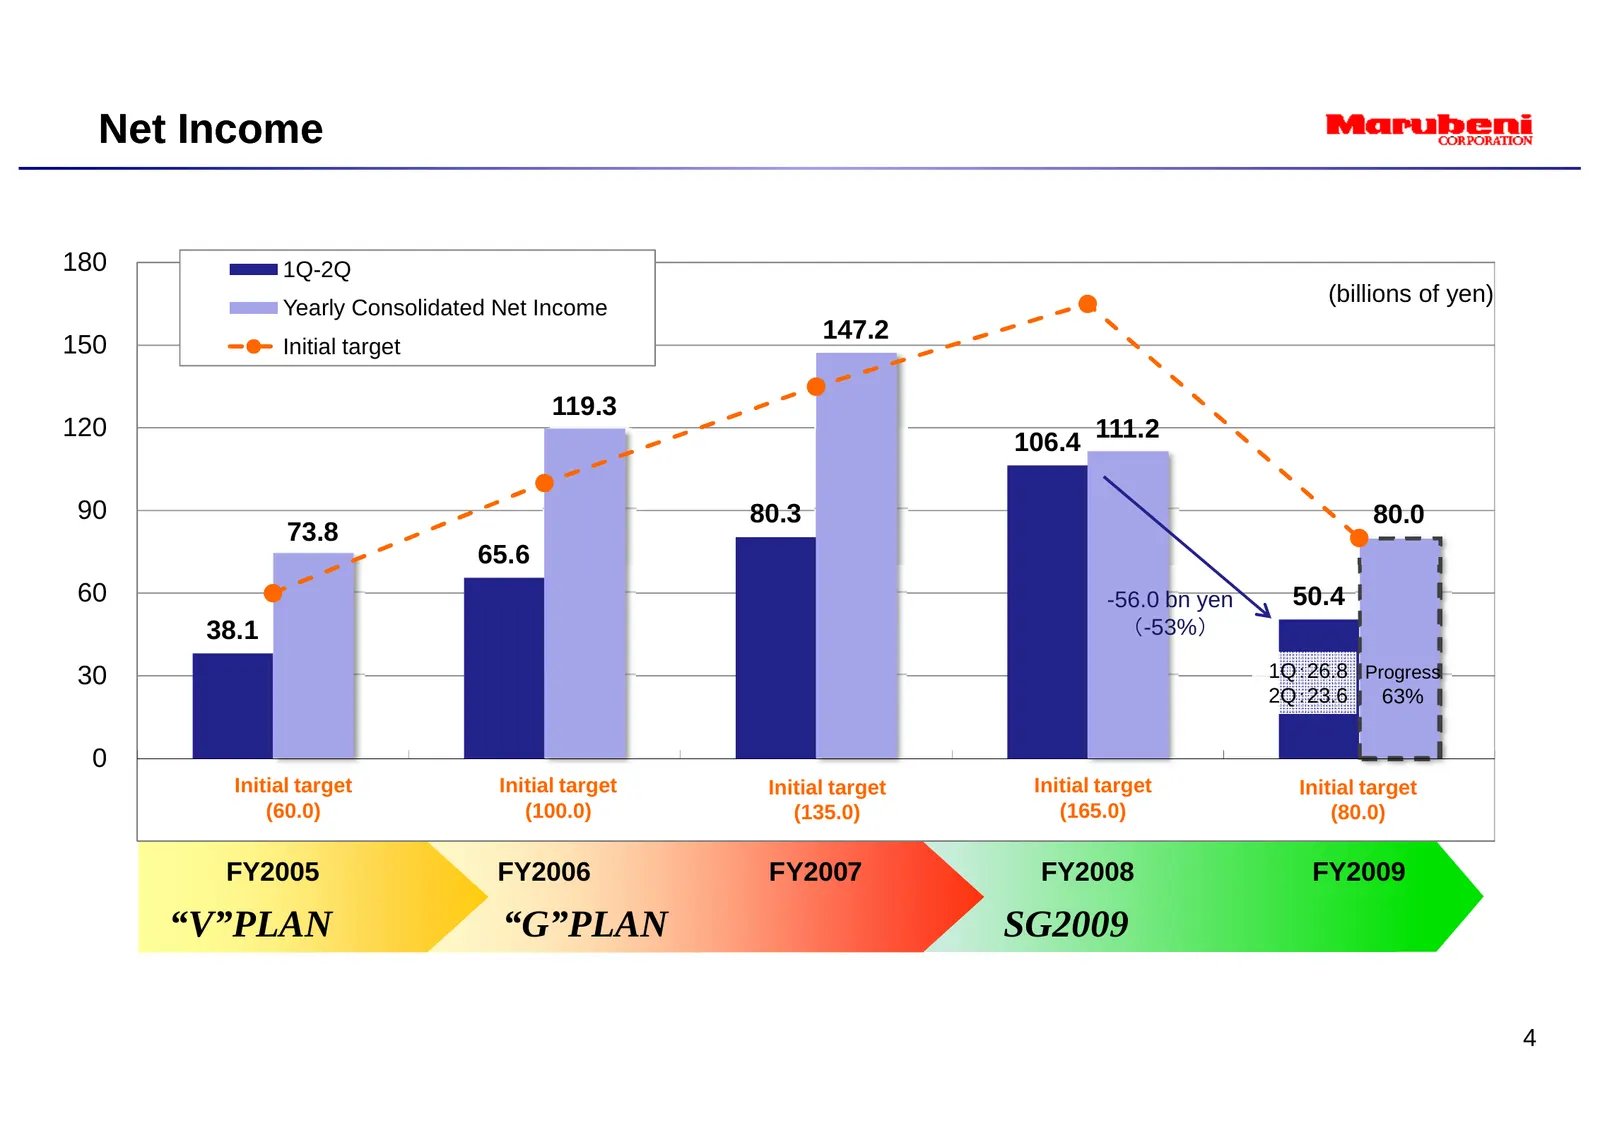
Net Income 180 1Q-2Q (billions of yen) Yearly Consolidated Net Income 147.2 150 Initial target 119.3 120 106.4 111.2 90 80.3 80.0 73.8 65.6 60 -56.0 bn yen 50.4 38.1 (-53%) 30 1Q:26.8 Progress 2Q:23.6 63% 0 Initial target Initial target Initial target Initial target Initial target (60.0) (100.0) (13
Slide 7: Adjusted Operating Profit & Core Earnings
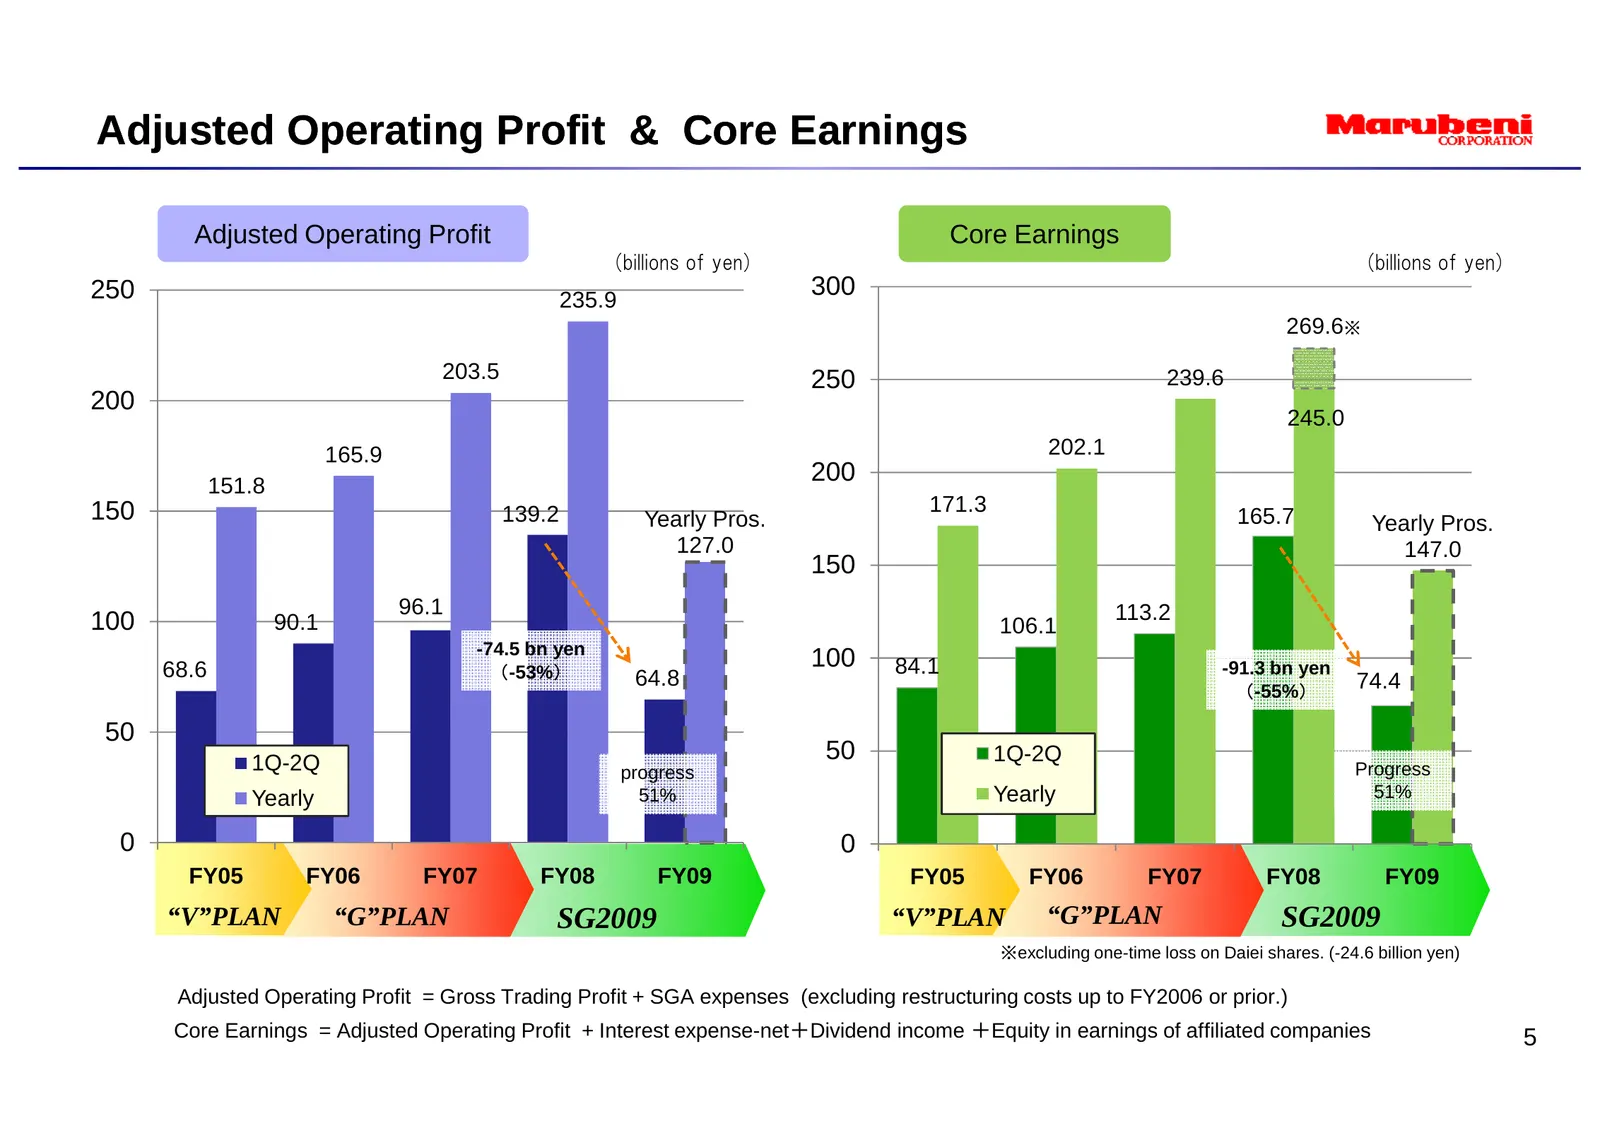
Adjusted Operating Profit & Core Earnings Adjusted Operating Profit Core Earnings (billions of yen) (billions of yen) 250 235.9 300 269.6※ 203.5 250 239.6 200 245.0 165.9 202.1 151.8 200 150 139.2 171.3 Yearly Pros. 165.7 Yearly Pros. 127.0 147.0 150 96.1 113.2 100 90.1 106.1 -74.5 bn yen 68.6 (-53%
Slide 8: Resources Ratio in Net Income
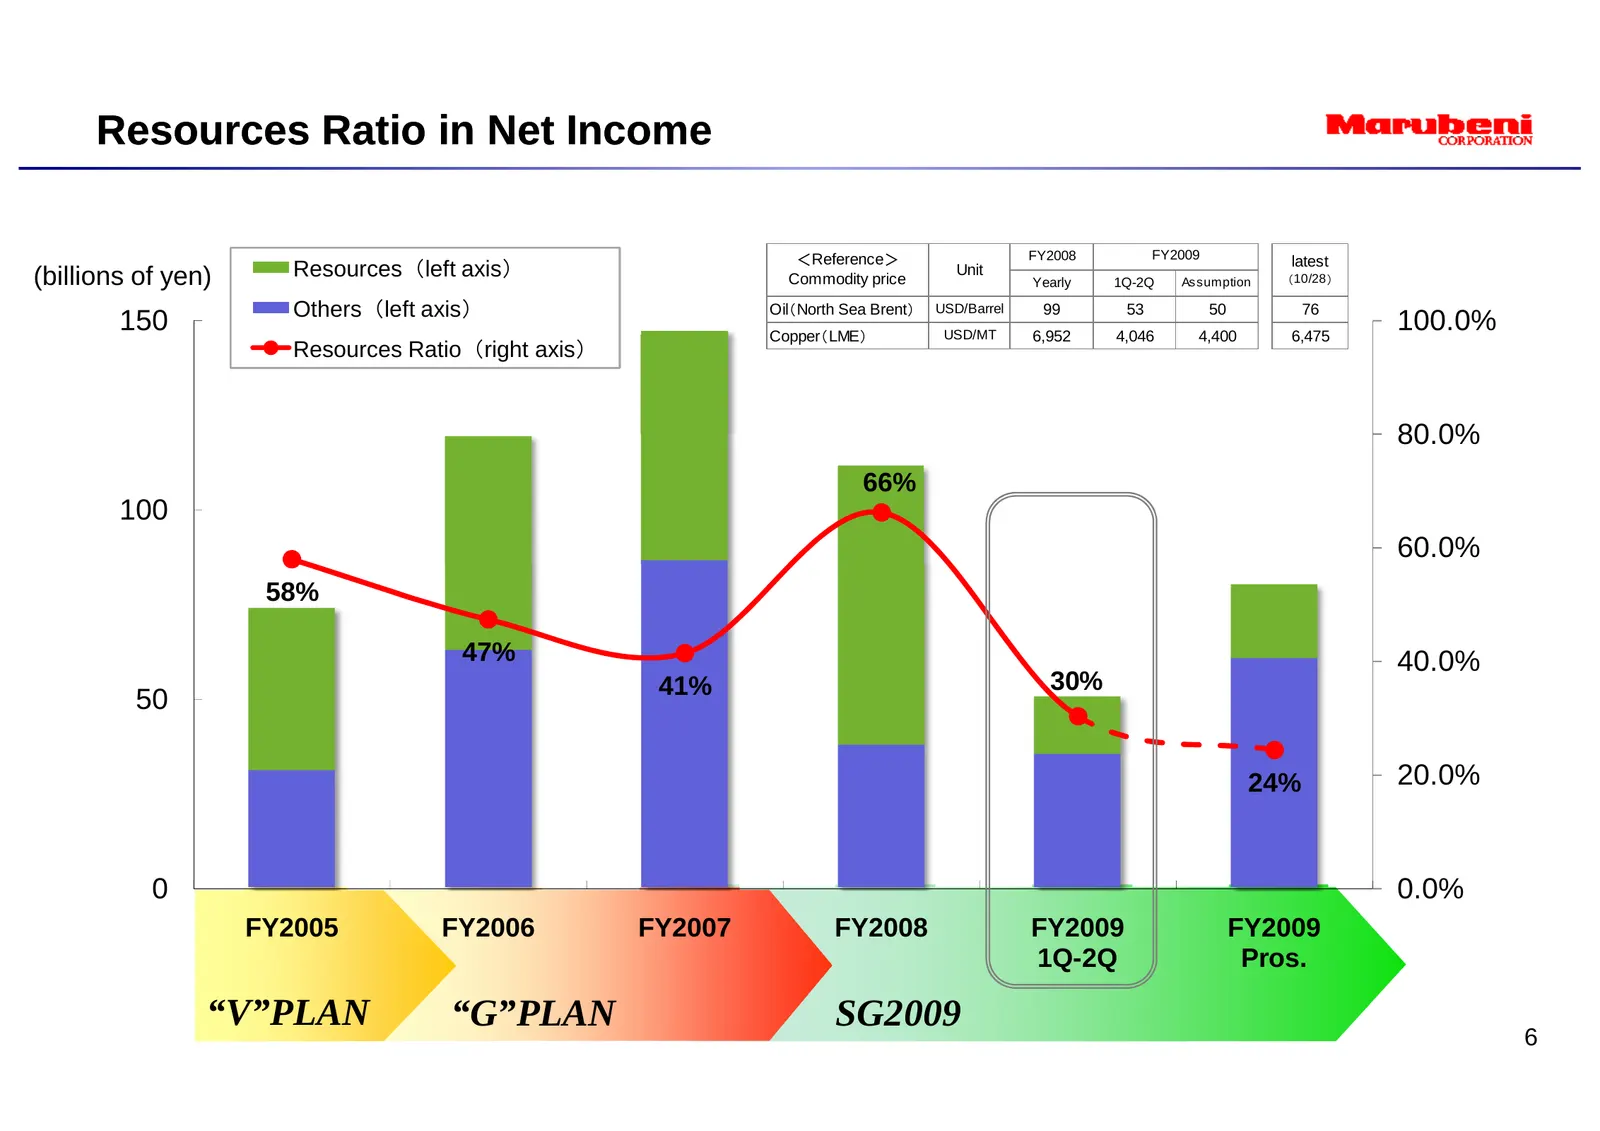
Resources Ratio in Net Income <Reference> FY2008 FY2009 latest (billions of yen) Resources(left axis) Commodity price Unit Yearly 1Q-2Q Assumption (10/28 ) Others(left axis) Oil(North Sea Brent) USD/Barrel 99 53 50 76 150 Copper(LME) USD/MT 6,952 4,046 4,400 6,475 100.0% Resources Ratio(right axis)
Slide 9: Earnings Structure & Business Portfolio
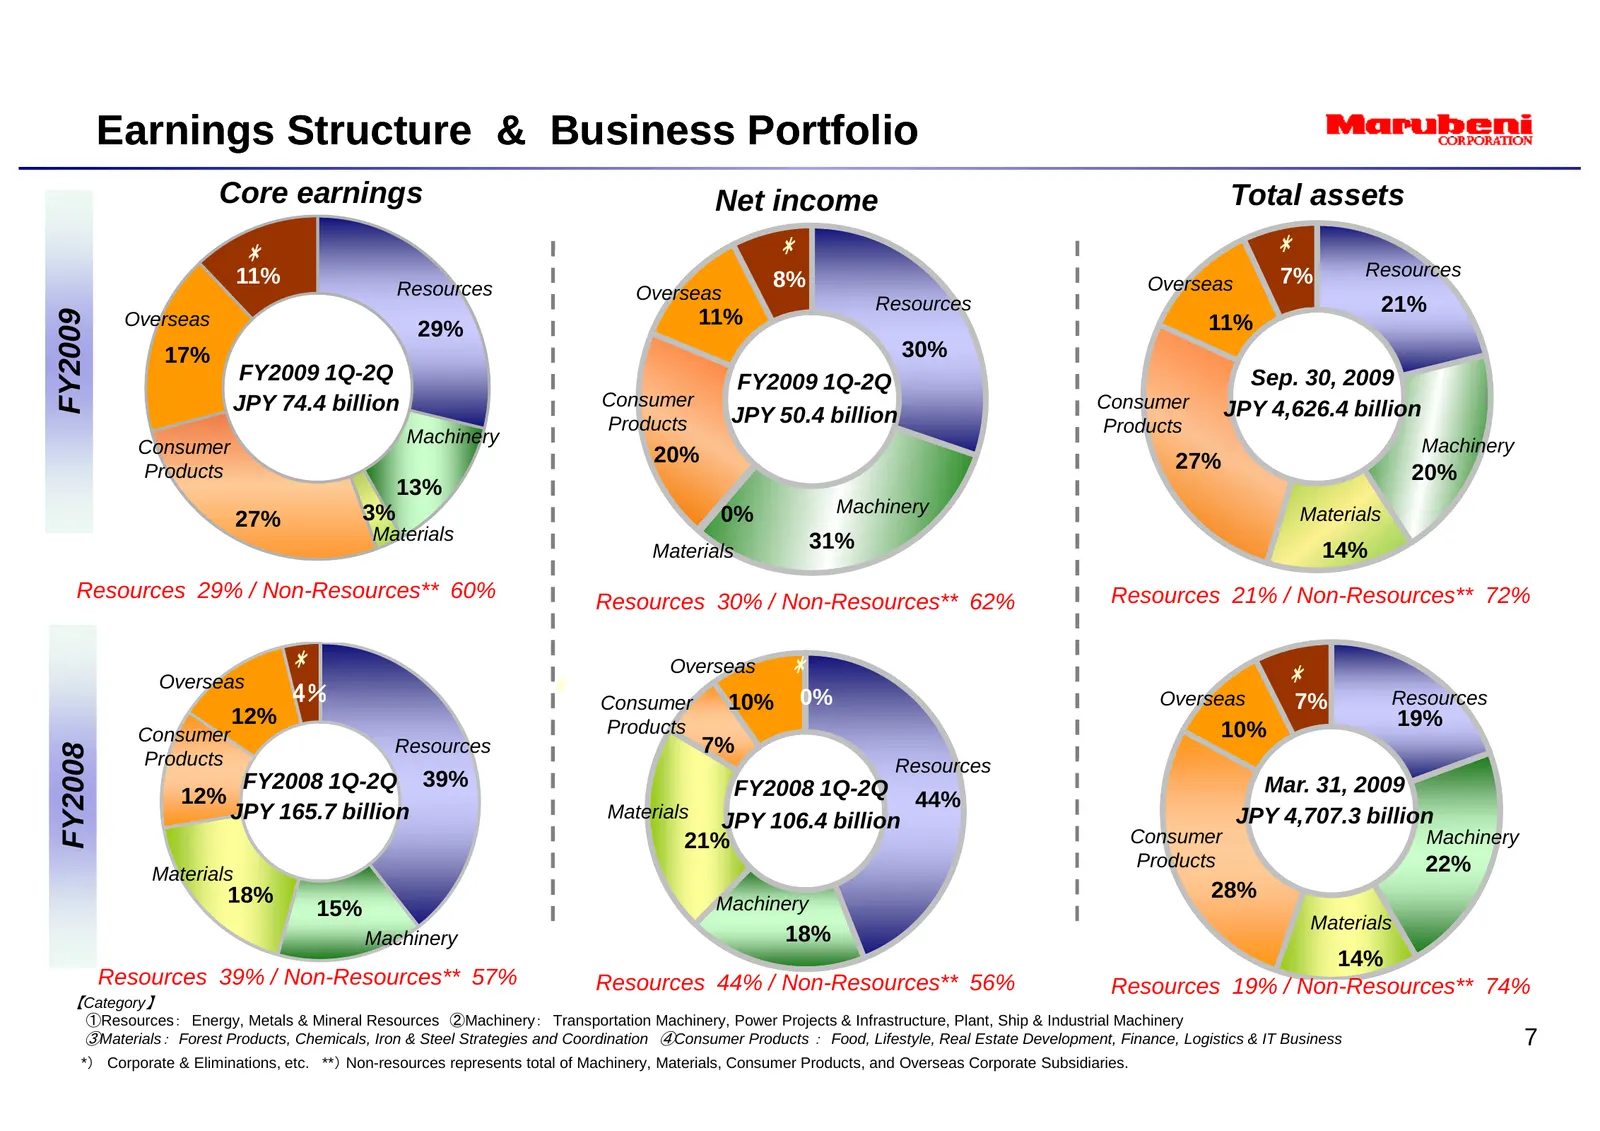
Earnings Structure & Business Portfolio Core earnings Net income Total assets * * * 11% 7% Resources Resources 8% Overseas Overseas Resources 21% FY2009 Overseas 11% 11% 29% 17% 30% FY2009 1Q-2Q FY2009 1Q-2Q Sep. 30, 2009 JPY 74.4 billion Consumer Consumer JPY 4,626.4 billion Products JPY 50.4 billi
Slide 10: Key issues of FY2009: Strengthen Financial Standing
1. Key issues of FY2009① ( Reinforce Profit Base ) 2. Key y issues of FY2009②② ( Strengthen Financial Standing ) 3. Progress of SG2009 8
Slide 11: Equity and Net D/E Ratio
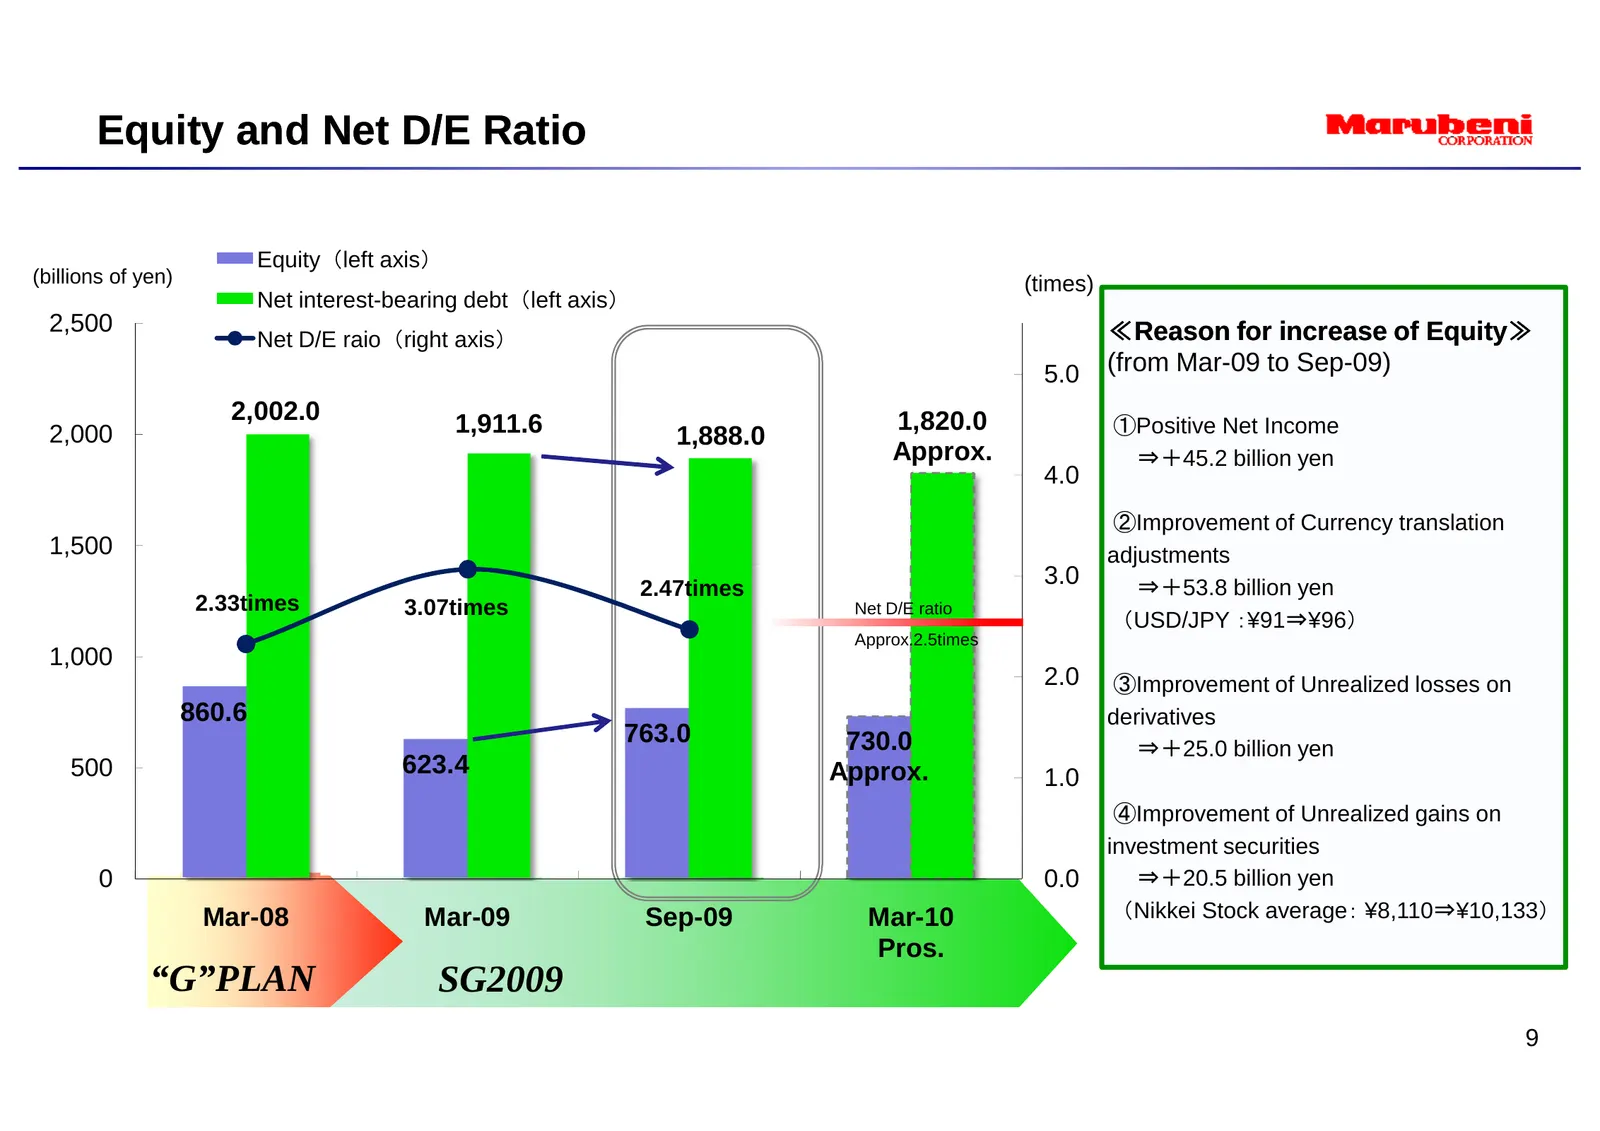
Equity and Net D/E Ratio Equity(left axis) (billions of yen) (times) Net interest-bearing debt(left axis) 2,500 ≪Reason for increase of Equity≫ Equity≫ Net D/E raio(right axis) 5.0 (from Mar-09 to Sep-09) 2,002.0 1,911.6 1,820.0 2,000 1,888.0 ①Positive Net Income Approx. ⇒+45.2 billion yen 4.0 ②Impr
Slide 12: Cash Flows
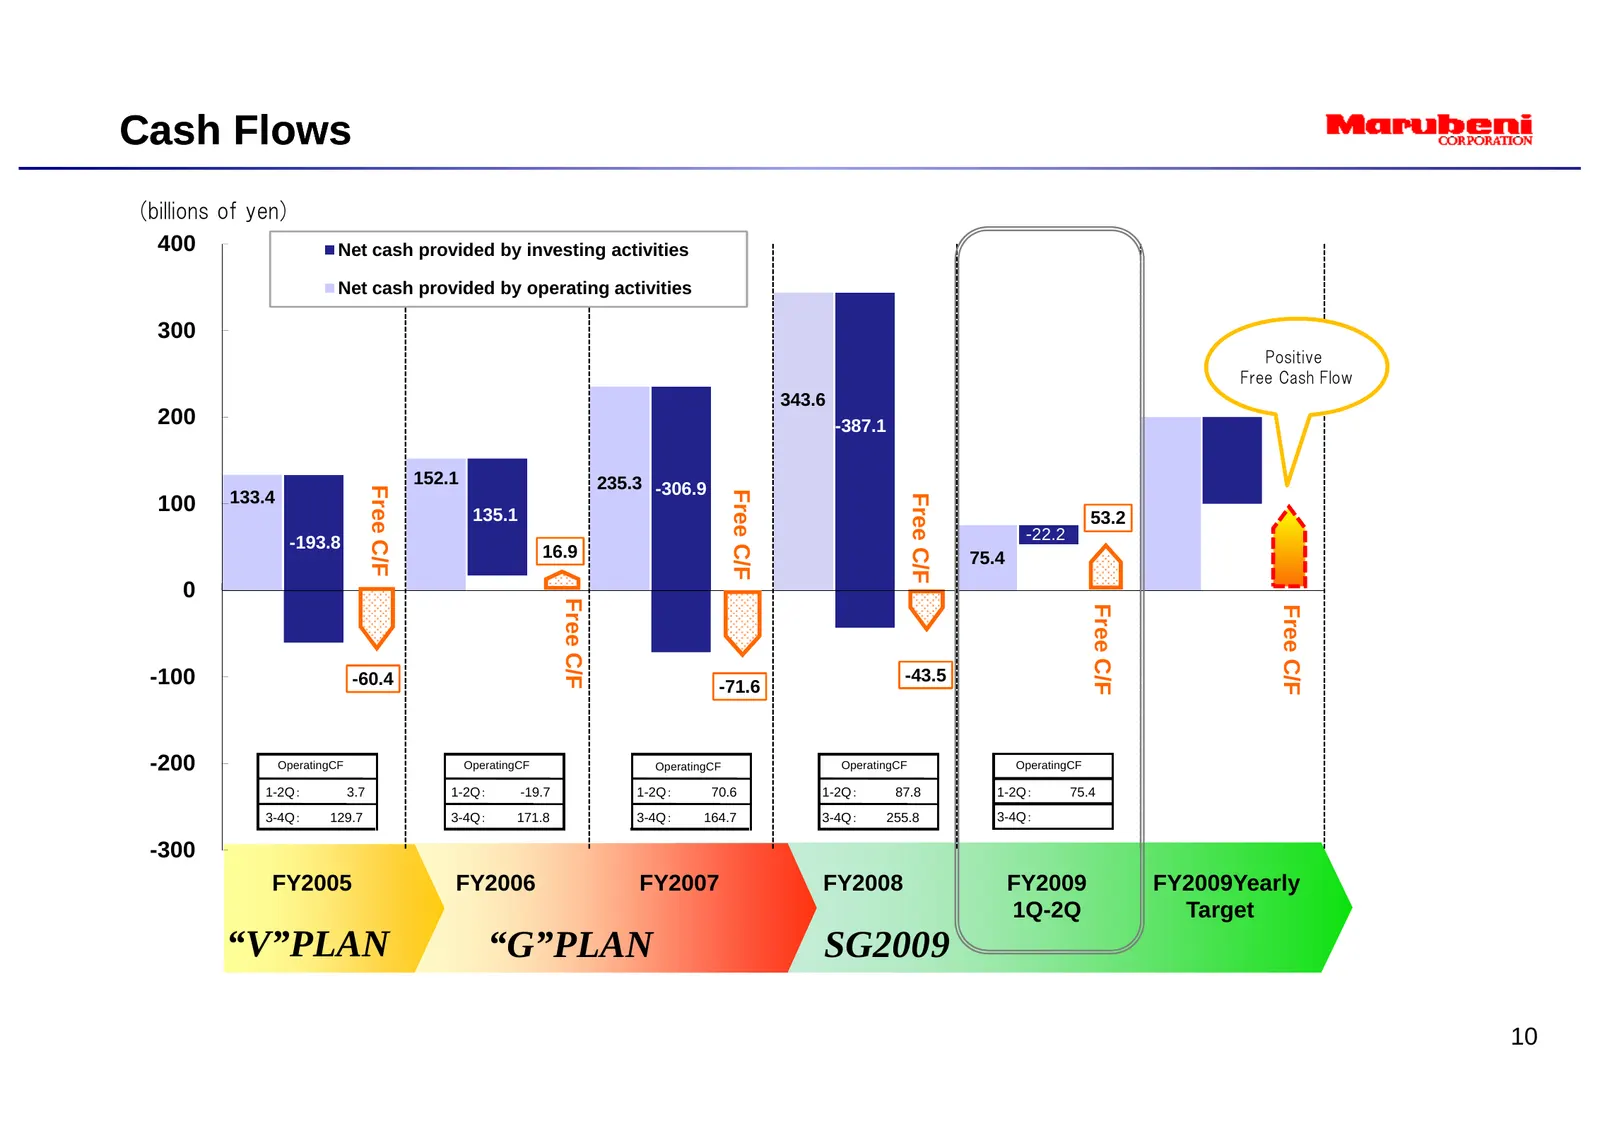
Cash Flows (billions of yen) 400 Net cash provided by investing activities Net cash provided by operating activities 300 Positive Free Cash Flow 343.6 200 -387.1 152.1 235.3 -306.9 Free C/F Free C//F 133.4 Free C//F 100 135.1 53.2 -193.8 -22.2 16.9 75.4 F 0 Free C/F Free C/F Free C/F -100 -60.4 -71.
Slide 13: Equity and Net Risk Assets
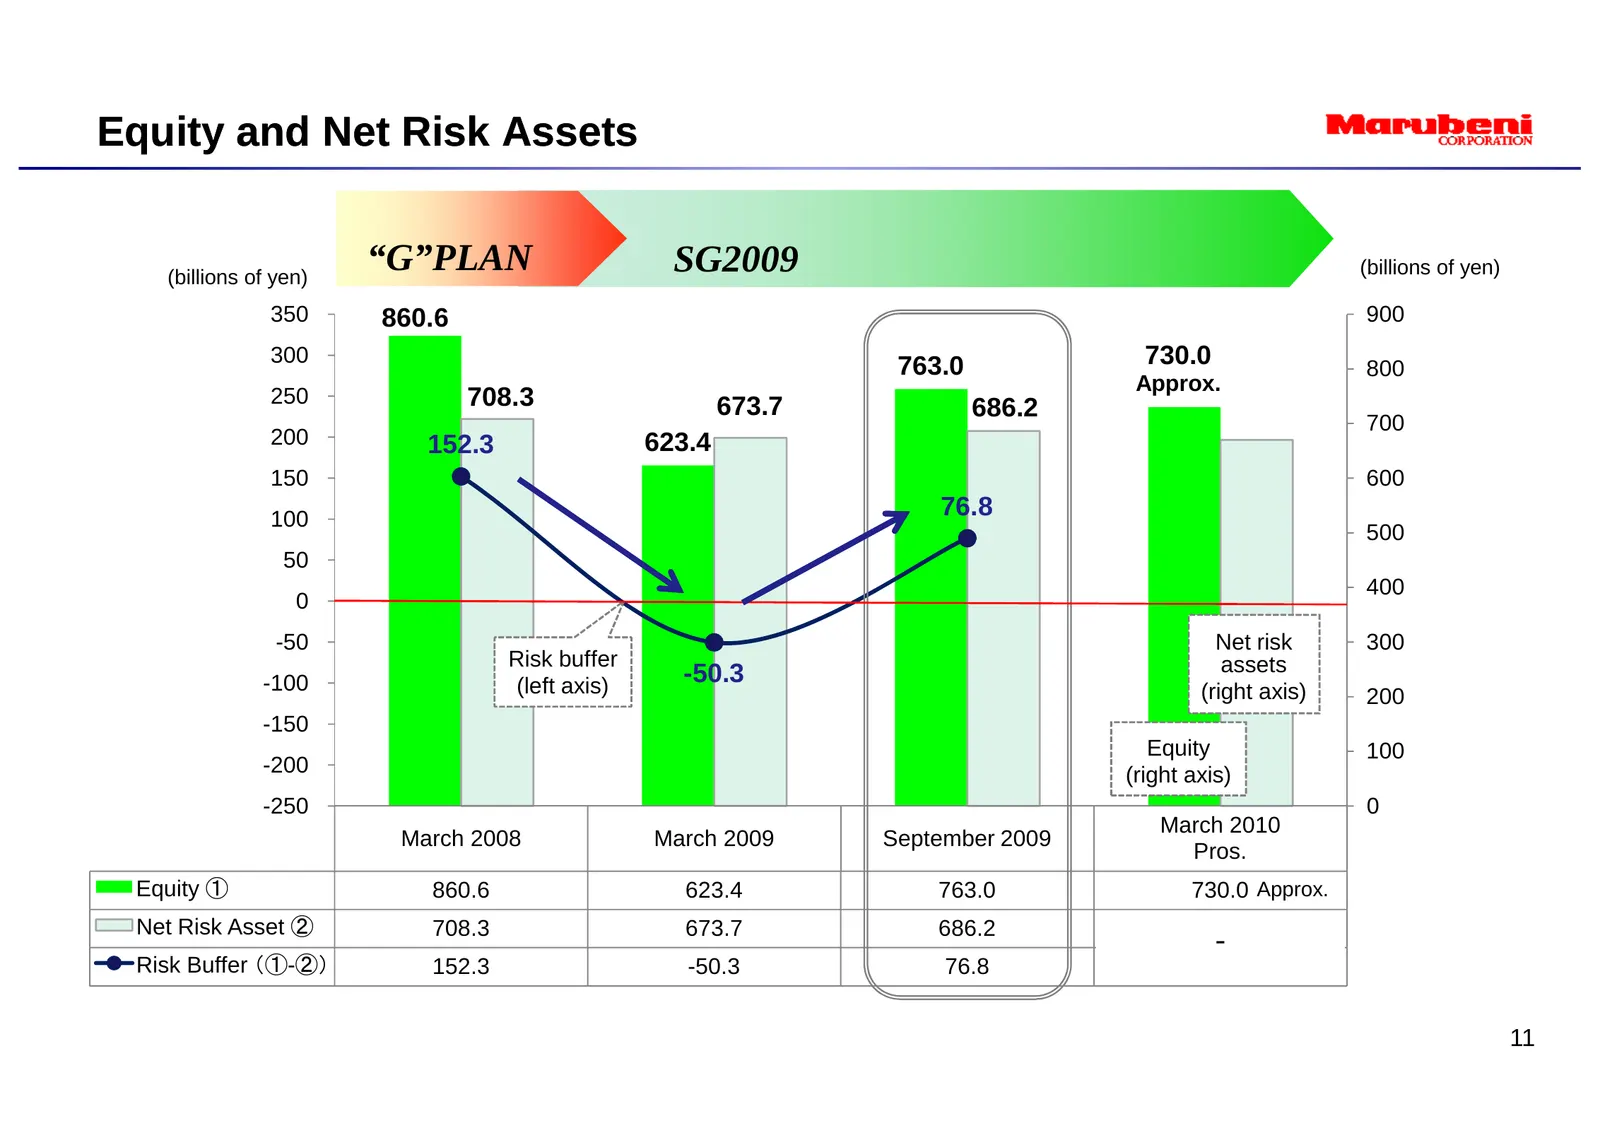
Equity and Net Risk Assets (billions of yen) “G”PLAN SG2009 (billions of yen) 350 860.6 900 300 763.0 730.0 800 Approx. 250 708.3 673.7 686.2 700 200 152.3 623.4 150 600 100 76.8 500 50 400 0 -50 Net risk 300 Risk buffer assets -100 (left axis) -50.3 (right axis) 200 -150 Equity 100 -200 (right axis
Slide 14: Progress of SG2009
1. Key issues of FY2009① ( Reinforce Profit Base ) 2. Key y issues of FY2009②② ( Strengthen Financial Standing ) 3. Progress of SG2009 12
Slide 15: Progress of SG2009
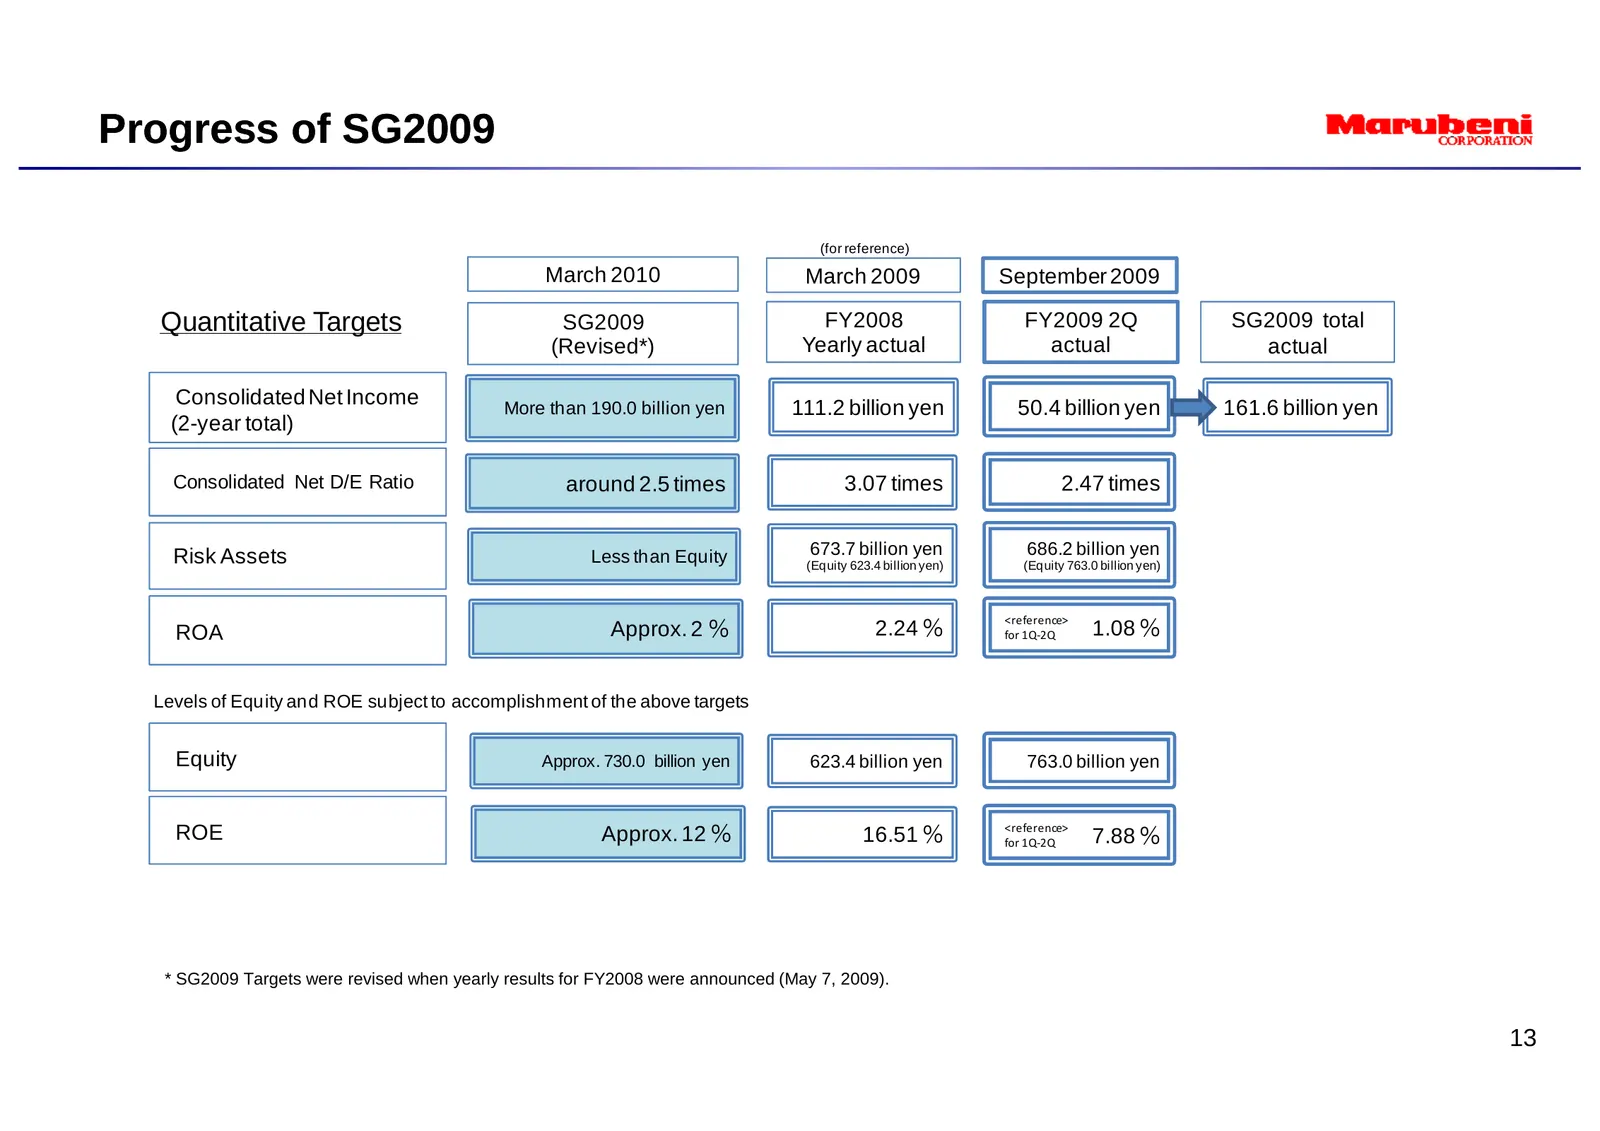
Progress of SG2009 (for reference) March 2010 March 2009 September 2009 Quantitative Targets SG2009 FY2008 FY2009 2Q SG2009 total (Revised*) Yearly actual actual actual Consolidated Net Income More than 190.0 billion yen 111.2 billion yen 50.4 billion yen 161.6 billion yen (2-year total) Consolidate
Slide 16: New Investments
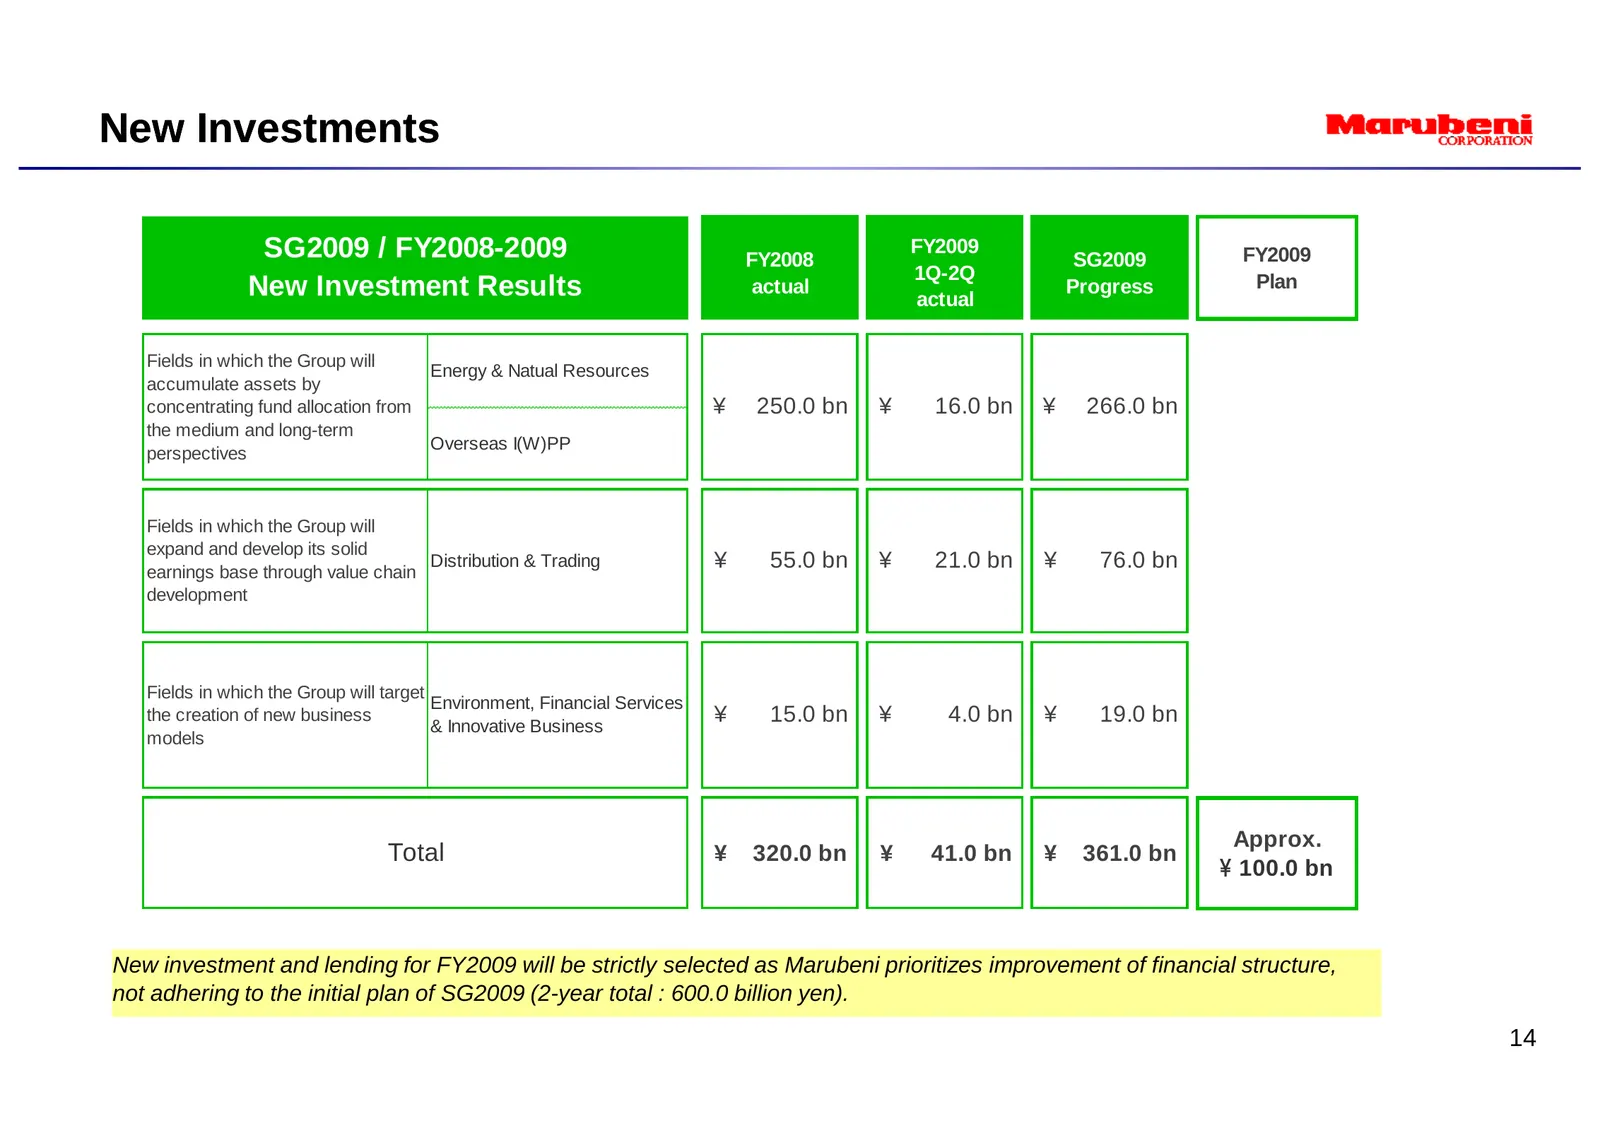
New Investments SG2009 / FY2008-2009 FY2008 FY2009 SG2009 FY2009 1Q-2Q Plan New Investment Results actual actual Progress Fields in which the Group will Energy & Natual Resources accumulate assets by concentrating fund allocation from ¥ 250.0 bn ¥ 16.0 bn ¥ 266.0 bn the medium and long-term Overseas
Slide 17: TOPICS①: Water and power projects
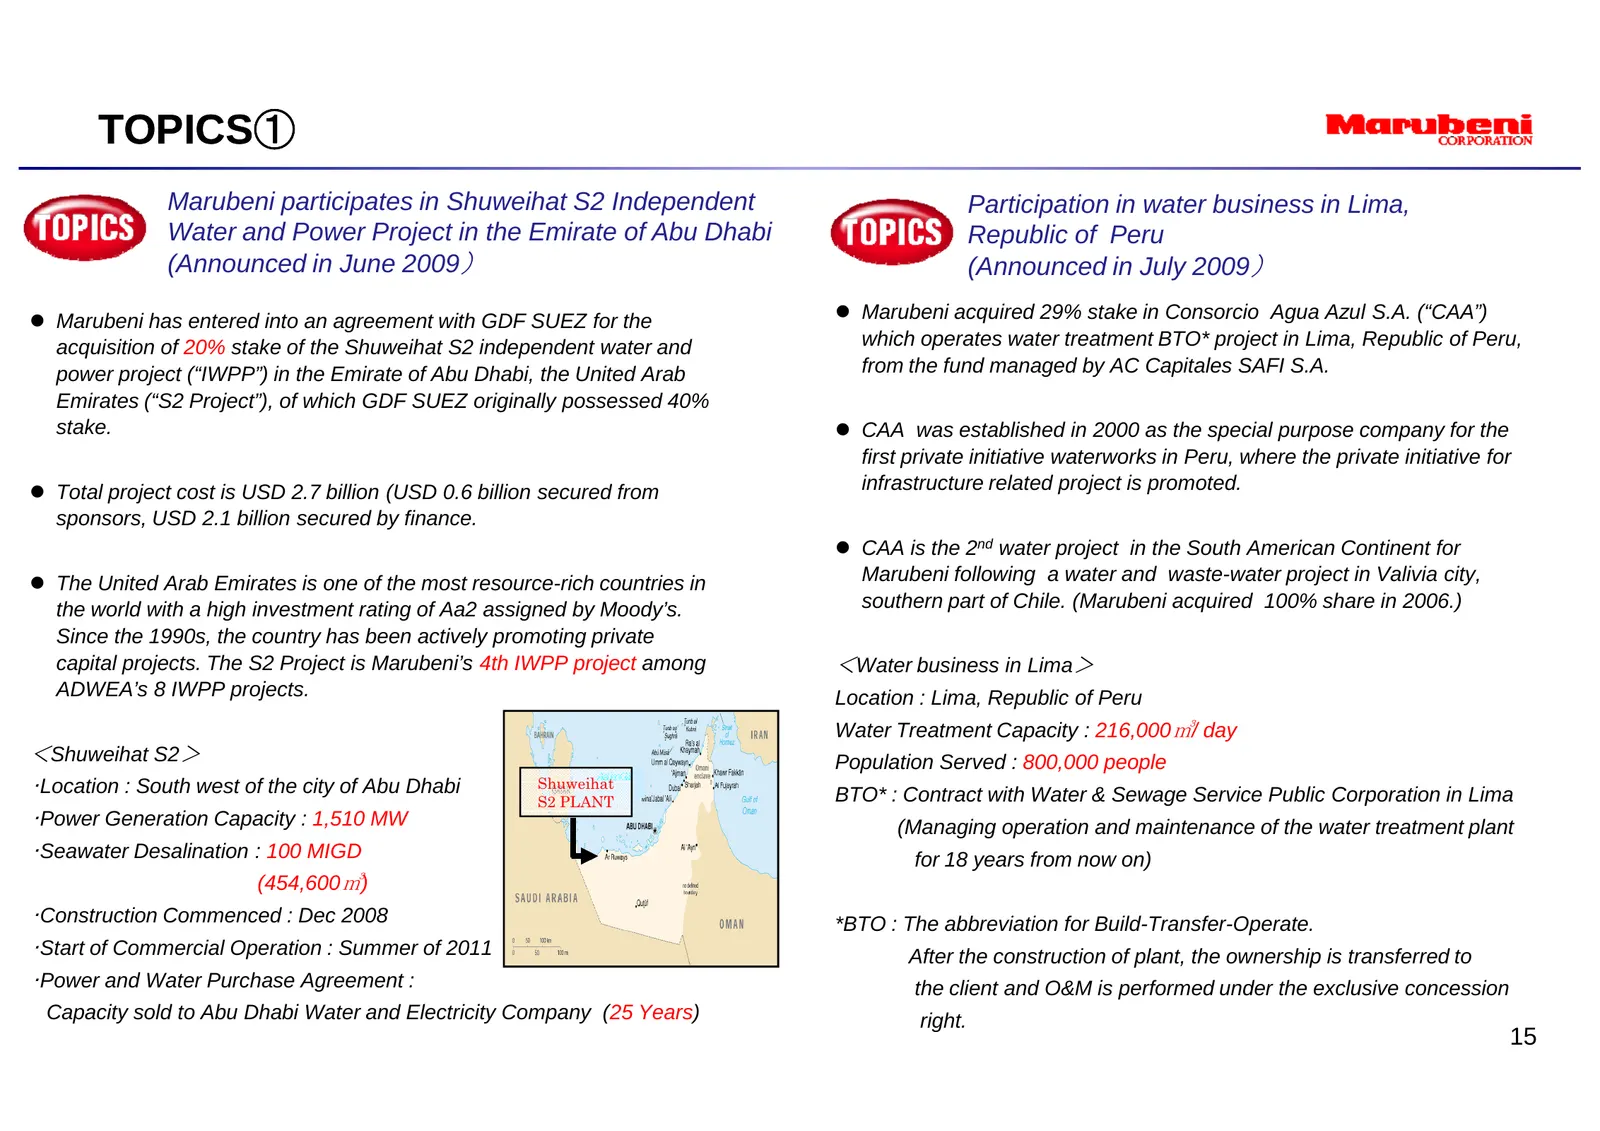
① TOPICS① TOPICS Marubeni participates in Shuweihat S2 Independent Participation in water business in Lima, Water and Power Project in the Emirate of Abu Dhabi Republic of Peru (Announced in June 2009) (Announced in July 2009) z Marubeni has entered into an agreement with GDF SUEZ for the z Marubeni
Slide 18: TOPICS②: Progress of Grain Trade Strategy
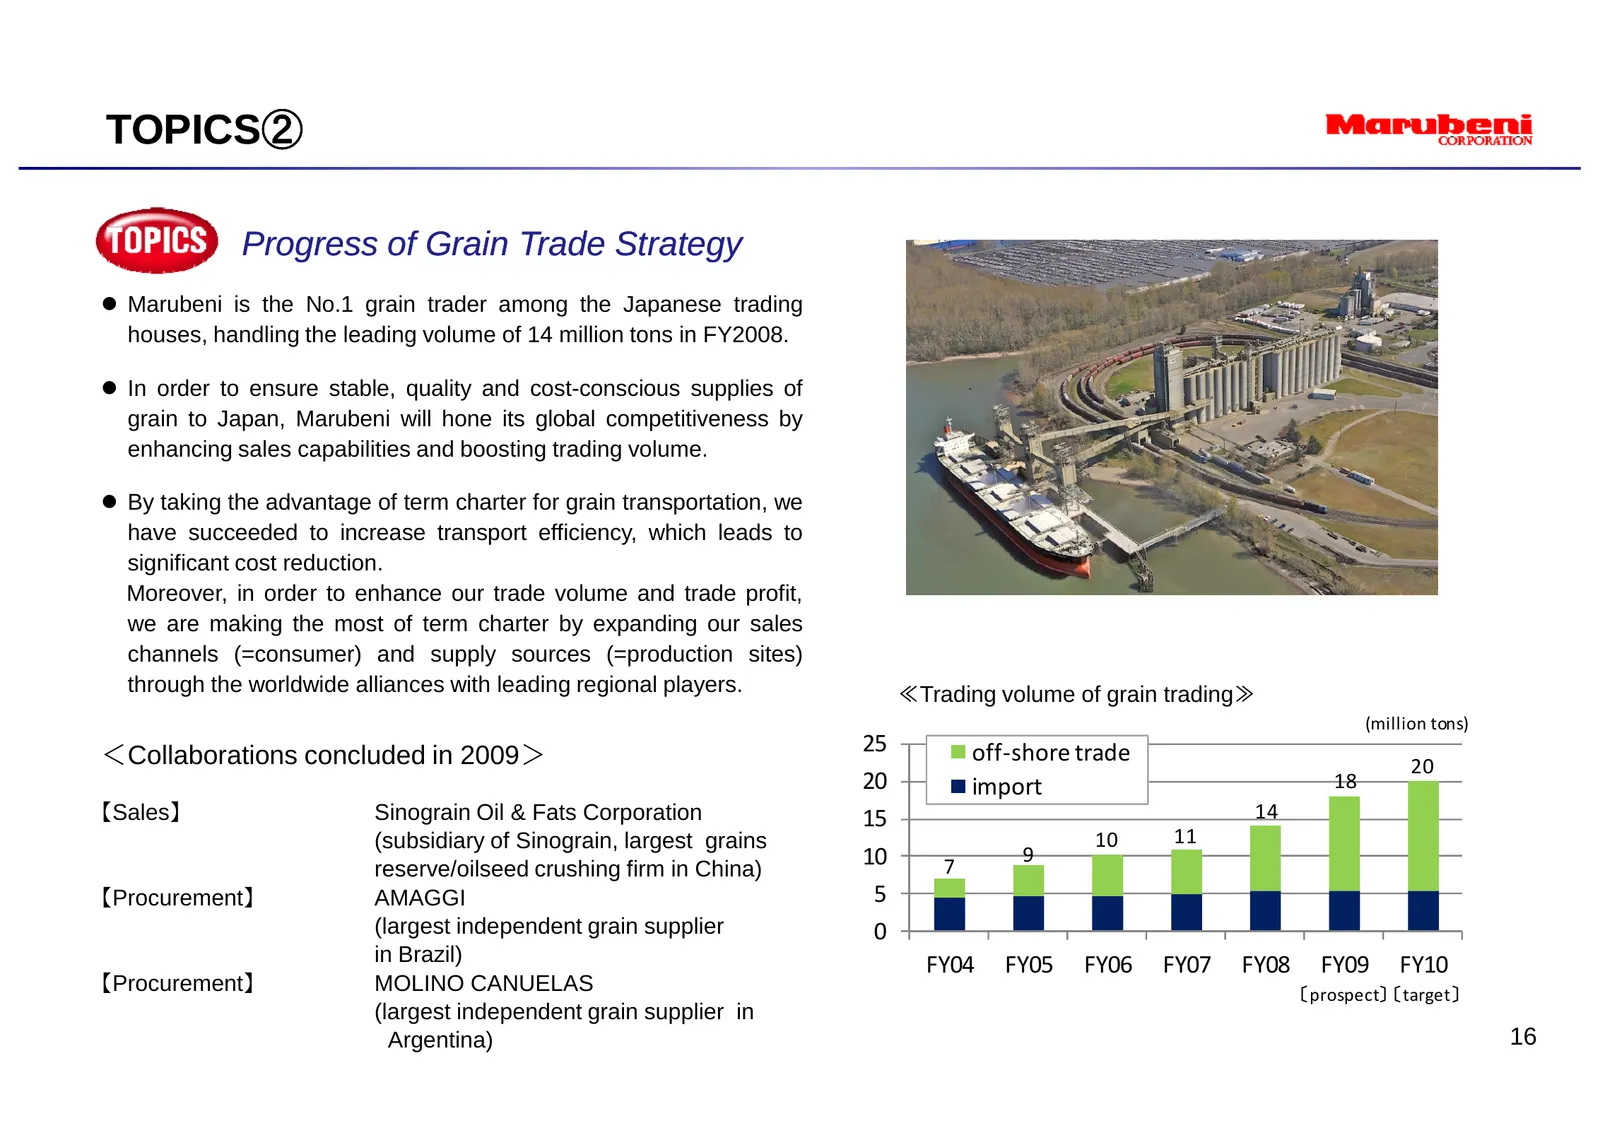
② TOPICS② TOPICS Progress of Grain Trade Strategy z Marubeni is the No.1 grain trader among the Japanese trading houses, handling the leading volume of 14 million tons in FY2008. z In order to ensure stable, quality and cost-conscious supplies of grain to Japan, Marubeni will hone its global competi
Slide 19: TOPICS③: Complete Sellout in Shanghai Housing Projects
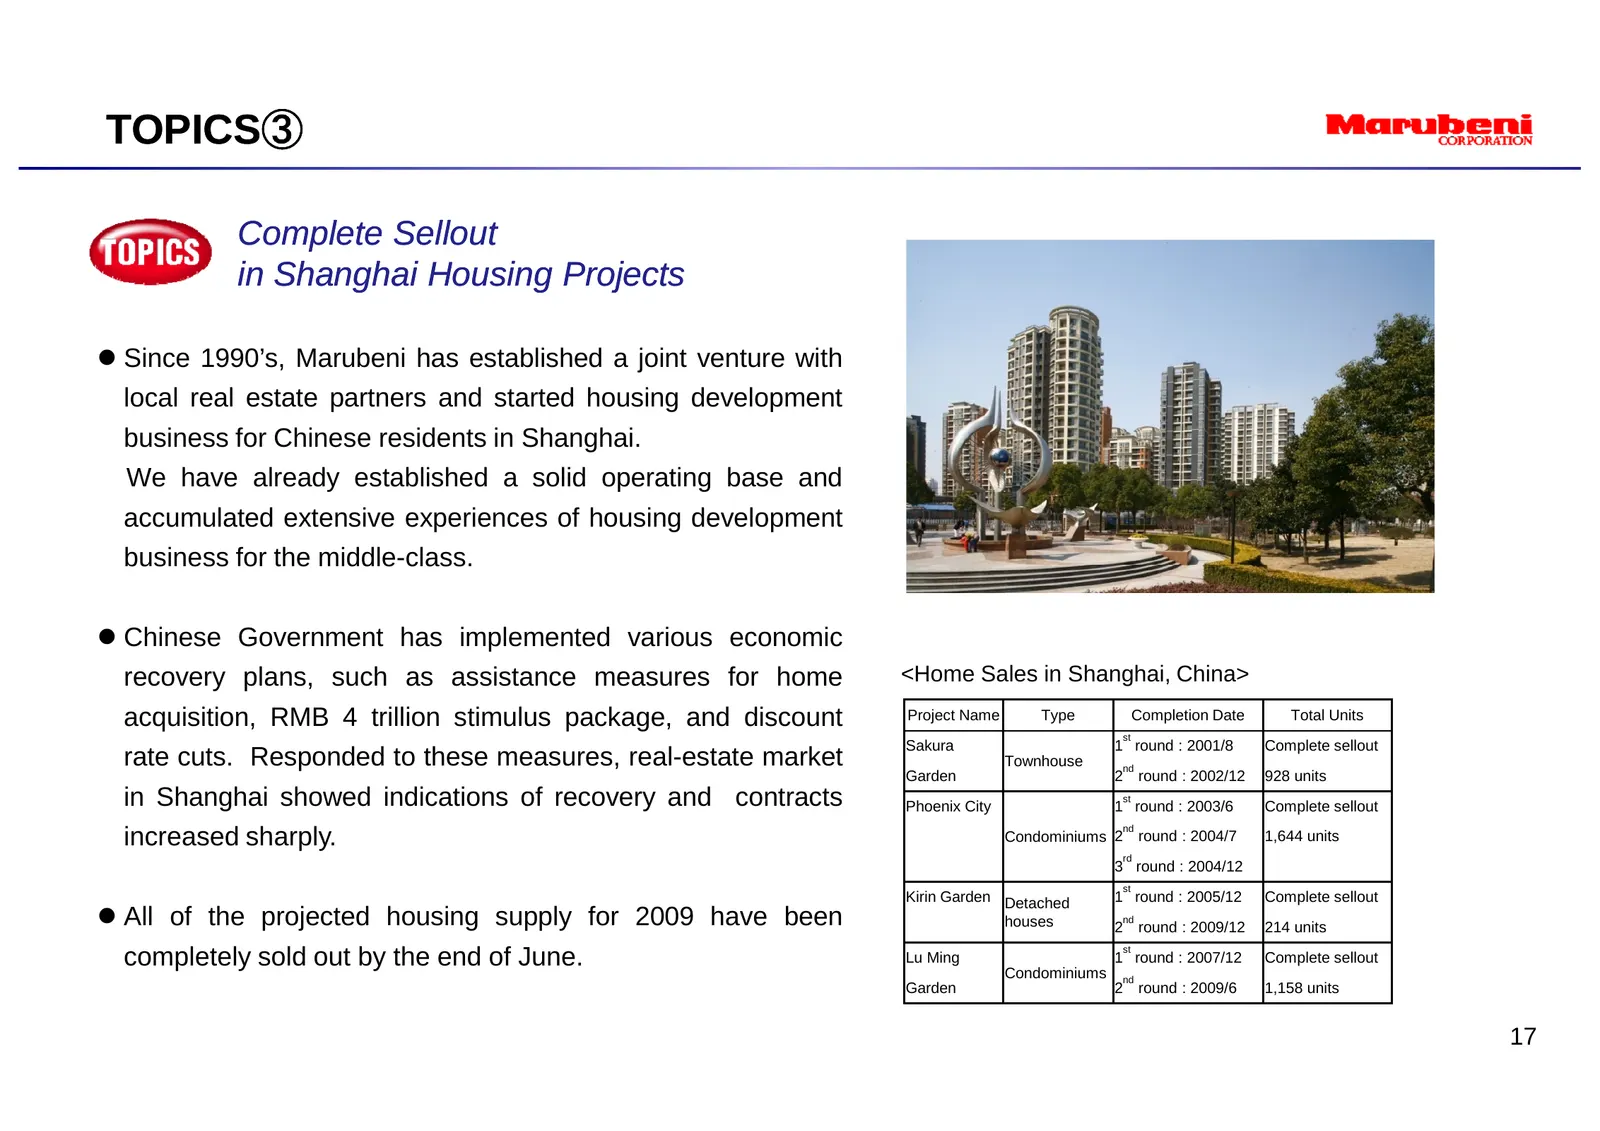
③ TOPICS③ TOPICS Complete Sellout in Shanghai Housing Projects z Since 1990’s, Marubeni has established a joint venture with local real estate partners and started housing development business for Chinese residents in Shanghai. We have already established a solid operating base and accumulated exten
Slide 20: FY2009 1Q-2Q Financial Highlights
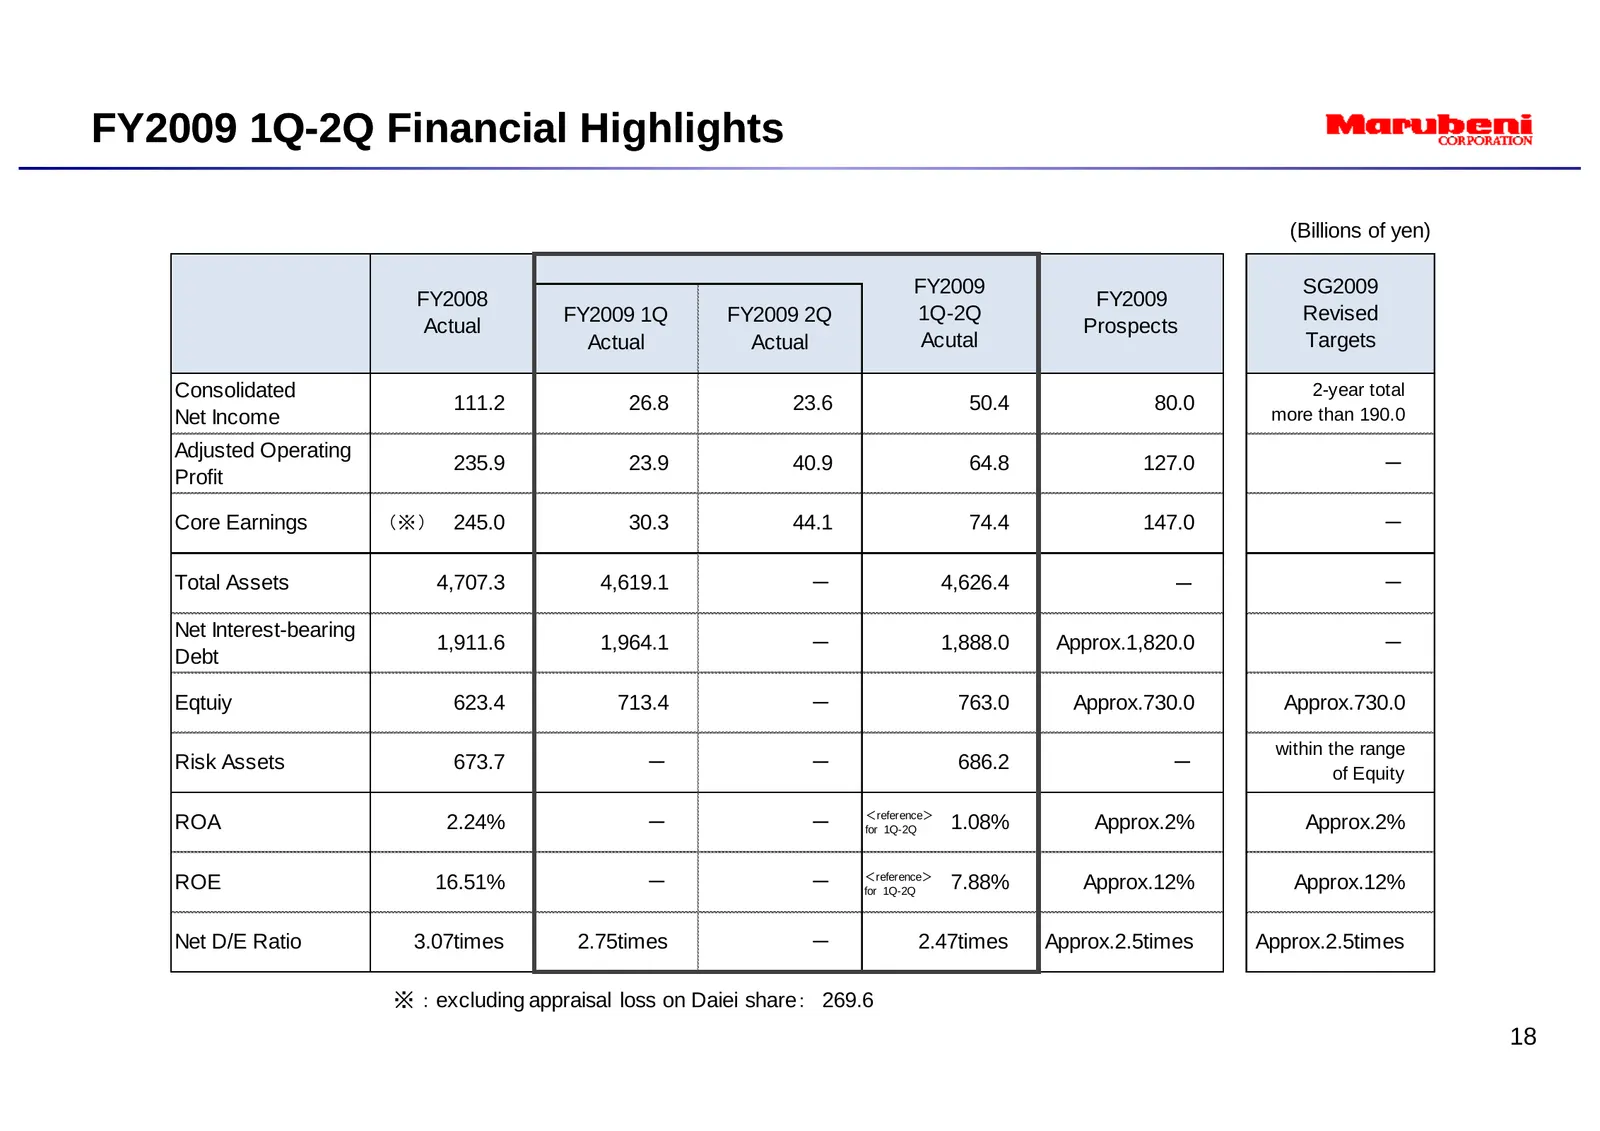
FY2009 1Q- 1Q-2Q Financial Highlights (Billions of yen) FY2009 SG2009 FY2008 FY2009 FY2009 1Q FY2009 2Q 1Q-2Q Revised Actual Prospects Actual Actual Acutal Targets Consolidated 2-year total 111.2 26.8 23.6 50.4 80.0 more than 190.0 Net Income Adjusted Operating 235.9 23.9 40.9 64.8 127.0 - Profit Co
Slide 21: Reference: Net Income by Segment
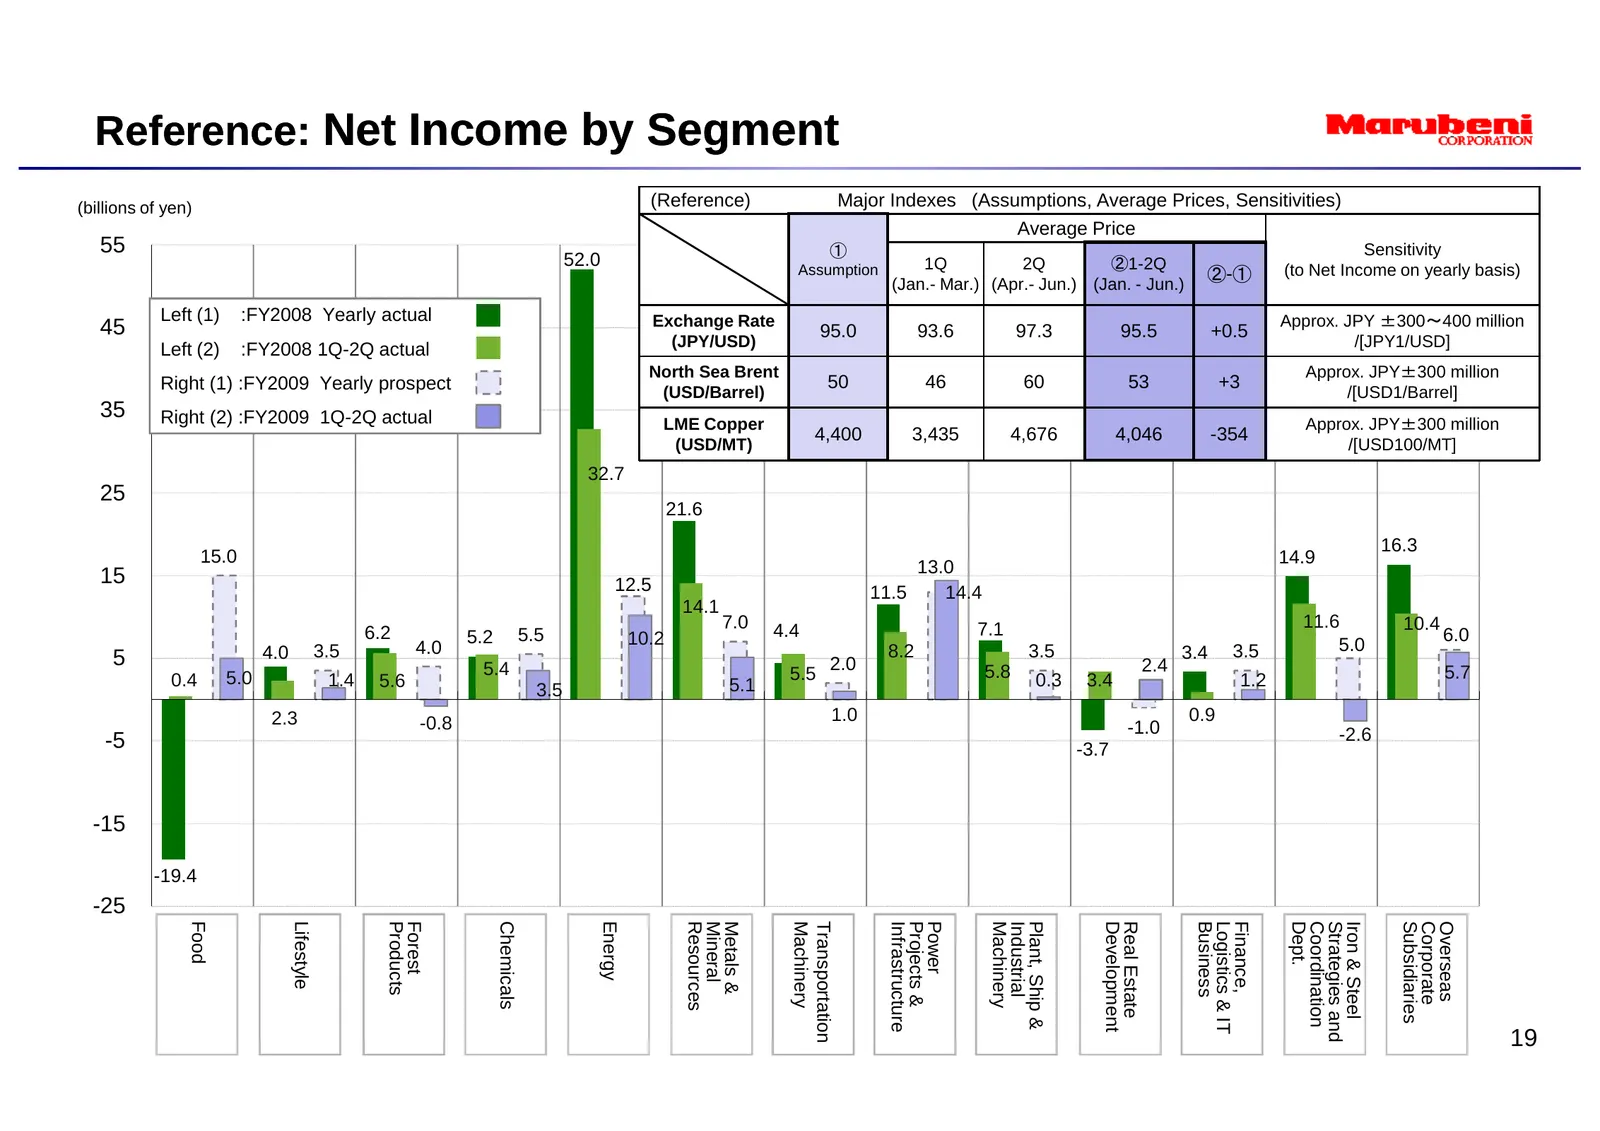
Reference: Net Income by Segment (billions of yen) (Reference) Major Indexes (Assumptions, Average Prices, Sensitivities) Average Price 55 ① Sensitivity 52.0 1Q 2Q ②1-2Q Assumption ②-① (to Net Income on yearly basis) (Jan.- Mar.) (Apr.- Jun.) (Jan. - Jun.) Left (1) :FY2008 Yearly actual Exchange Rat
Slide 22: Disclaimer Regarding Forward-Looking Statements
DISCLAIMER REGARDING FORWARD-LOOKING STATEMENTS THIS DOCUMENT CONTAINS FORWARD-LOOKING STATEMENTS ABOUT THE PERFORMANCE OF MARUBENI AND ITS GROUP COMPANIES, BASED ON MANAGEMENT'S ASSUMPTIONS IN LIGHT OF CURRENT INFORMATION. THE FOLLOWING FACTORS MAY THEREFORE INFLUENCE ACTUAL RESULTS. THESE FACTORS
Source: Internet Archive copy of marubeni.com
More decks from Marubeni Corporation
 Investor Day (September 2026)64 slides · Sep 9, 2026
 Investor Presentation (June 2026)13 slides · June 2026
 ESG Presentation (December 2019)14 slides · Dec 5, 2019
 FY2013 Earnings Presentation36 slides · May 13, 2013
 FY2012 Earnings Presentation29 slides · May 10, 2012
 Q3 FY2012/3 Earnings Presentation21 slides · Feb 2, 2012