Marubeni Corporation · TSE:8002
Marubeni — FY2012 Earnings Presentation
29 slides from Marubeni's earnings presentation, May 10, 2012
Slide 1: Briefing on Financial Results for FY2012/3
Briefing on Financial Results for FY2012/3 May 10, 2012 Marubeni Corporation 0
Slide 2: Agenda
Agenda Ⅰ. FY2012/3 Results ・・・ p2 Key Factors of FY2012/3 Results Business Environment Analysis Earnings Power and Structure Balance Sheets & Cash Flows Ⅱ. Progress of SG‐12 ・・・p16 Progress of SG‐12 Key Measures Copyright 2012 Marubeni Corporation 1
Slide 3: I. FY2012/3 Results
Ⅰ. FY2012/3 Results Key Factors of FY2012/3 Results Business Environment Analysis Earnings Power and Structure Balance Sheets & Cash Flows Copyright 2012 Marubeni Corporation 2
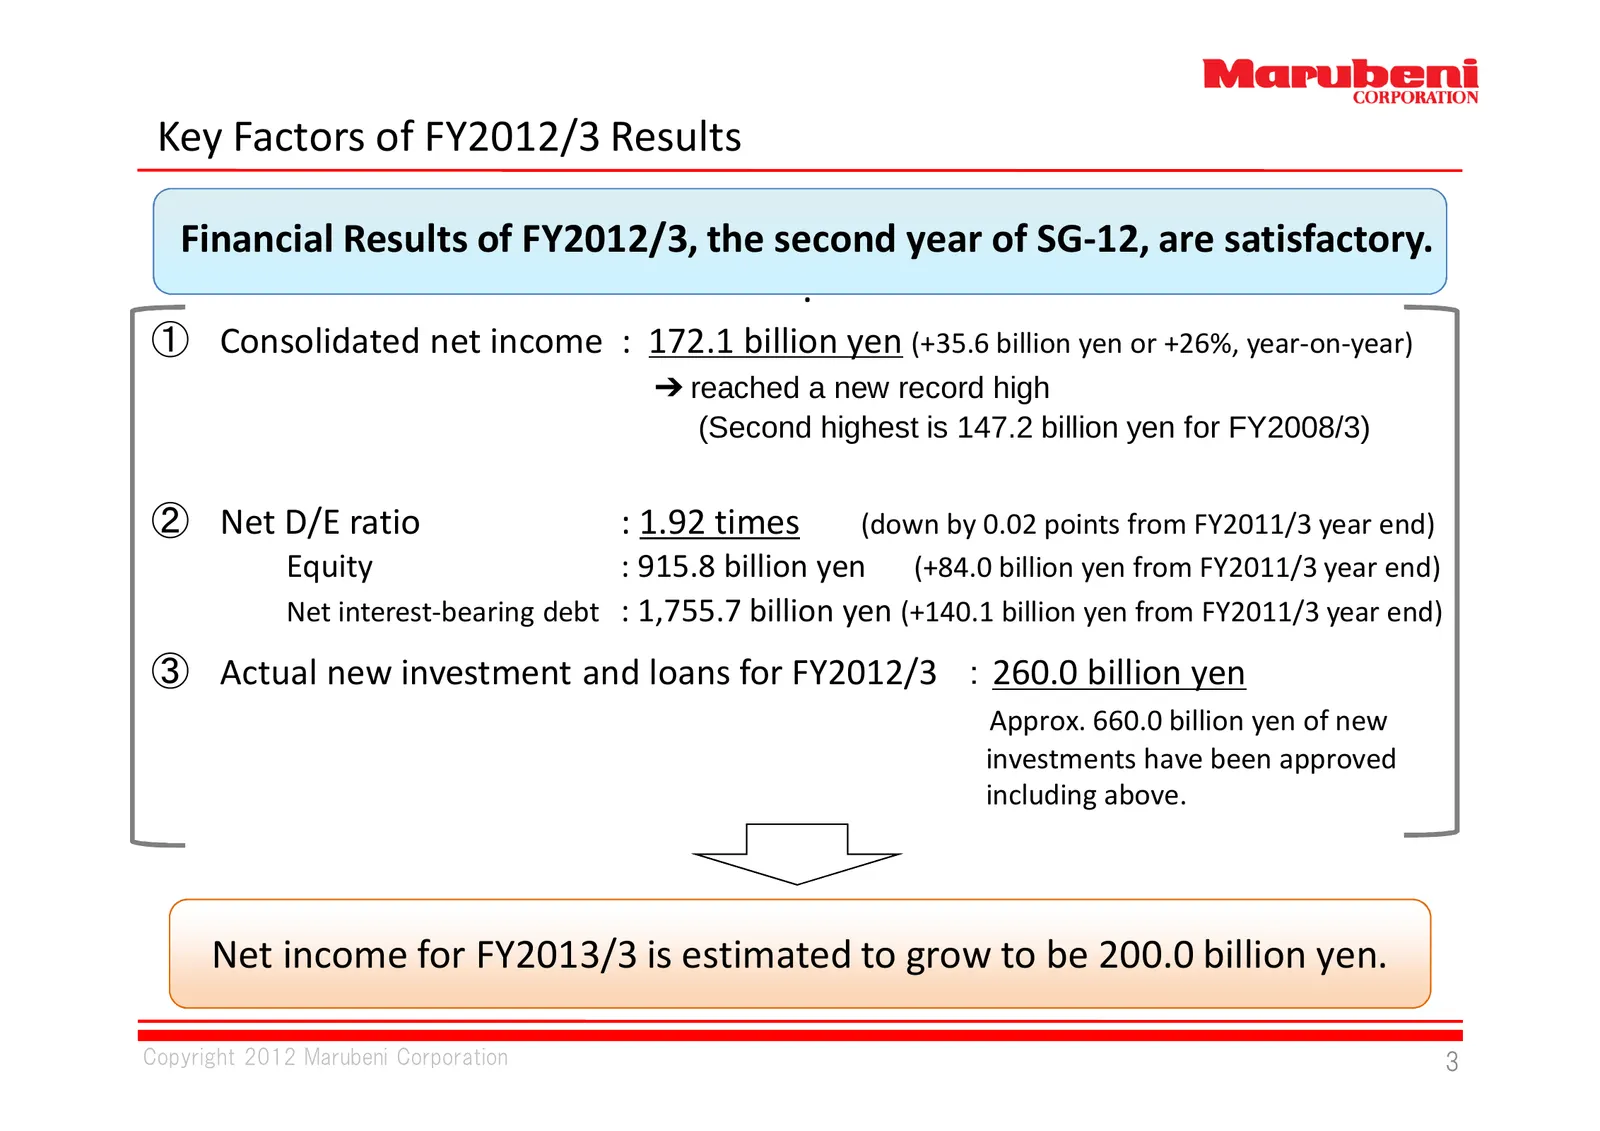
Slide 4: Key Factors of FY2012/3 Results
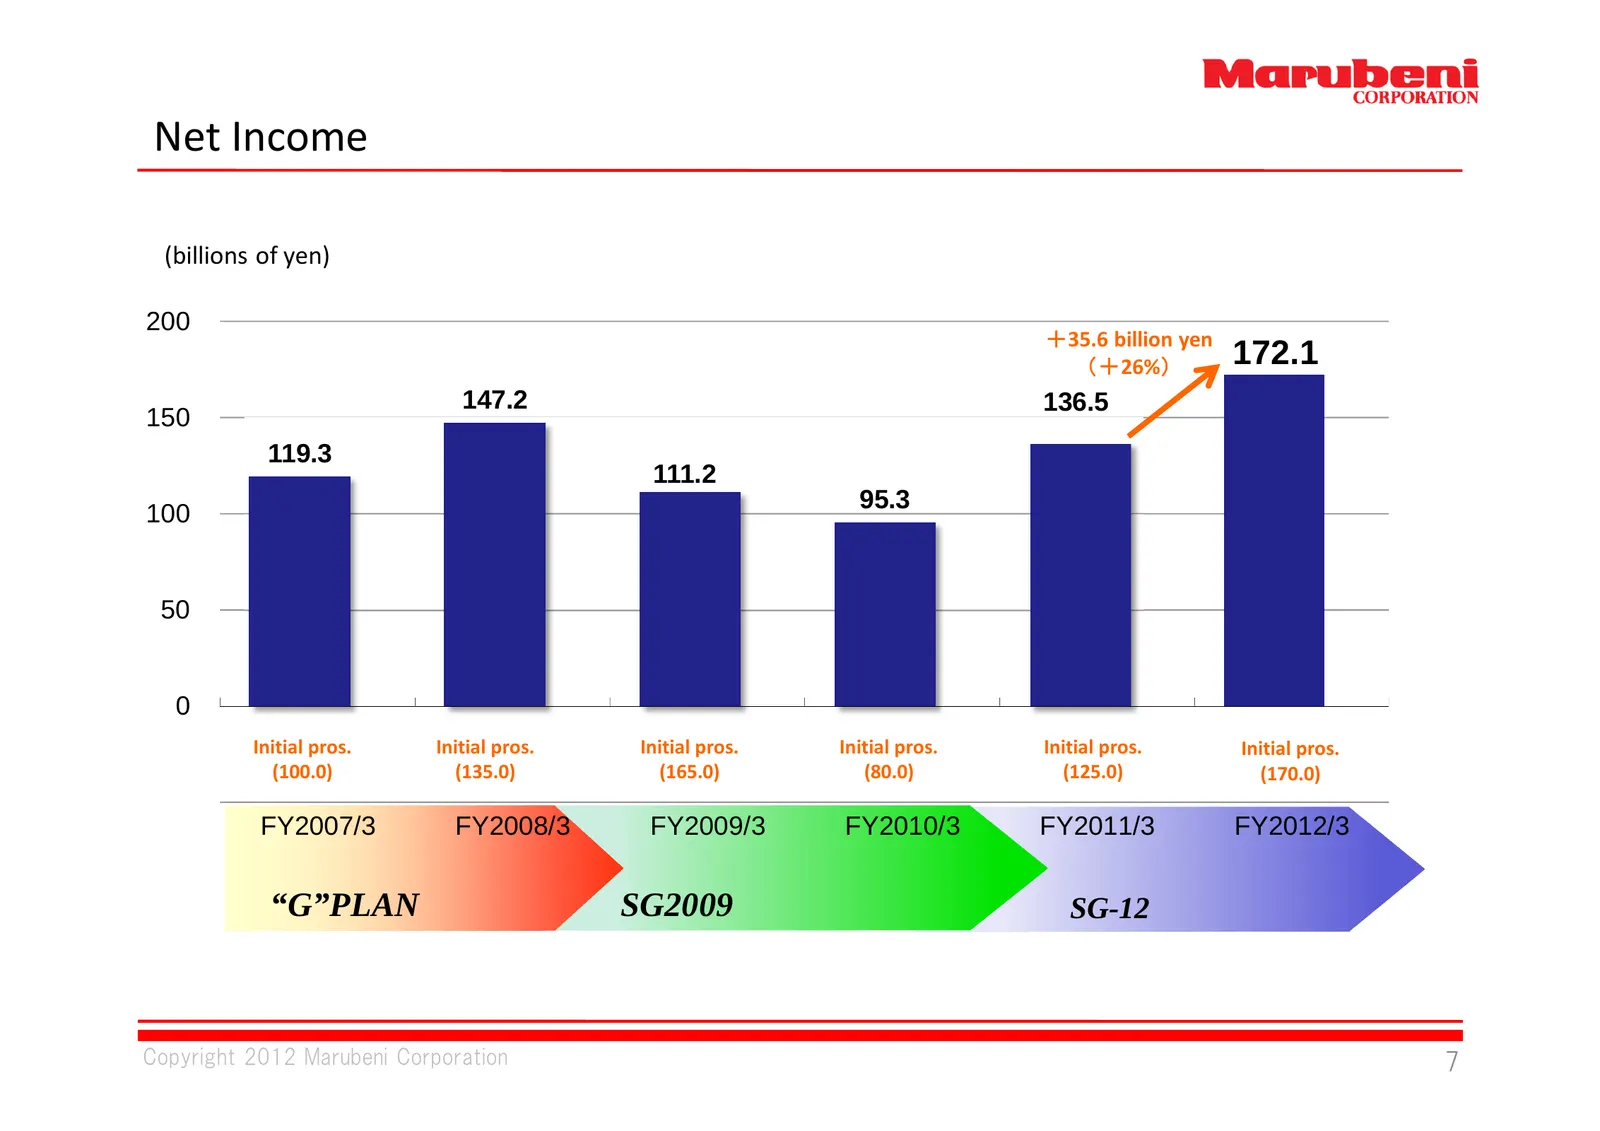
Key Factors of FY2012/3 Results Financial Results of FY2012/3, the second year of SG‐12, are satisfactory. . ① Consolidated net income : 172.1 billion yen (+35.6 billion yen or +26%, year‐on‐year) ➔ reached a new record high (Second highest is 147.2 billion yen for FY2008/3) ② Net D/E ratio : 1.92 t
Slide 5: I. FY2012/3 Results
Ⅰ. FY2012/3 Results Key Factors of FY2012/3 Results Business Environment Analysis Earnings Power and Structure Balance Sheets & Cash Flows Copyright 2012 Marubeni Corporation 4
Slide 6: Business Environment Analysis
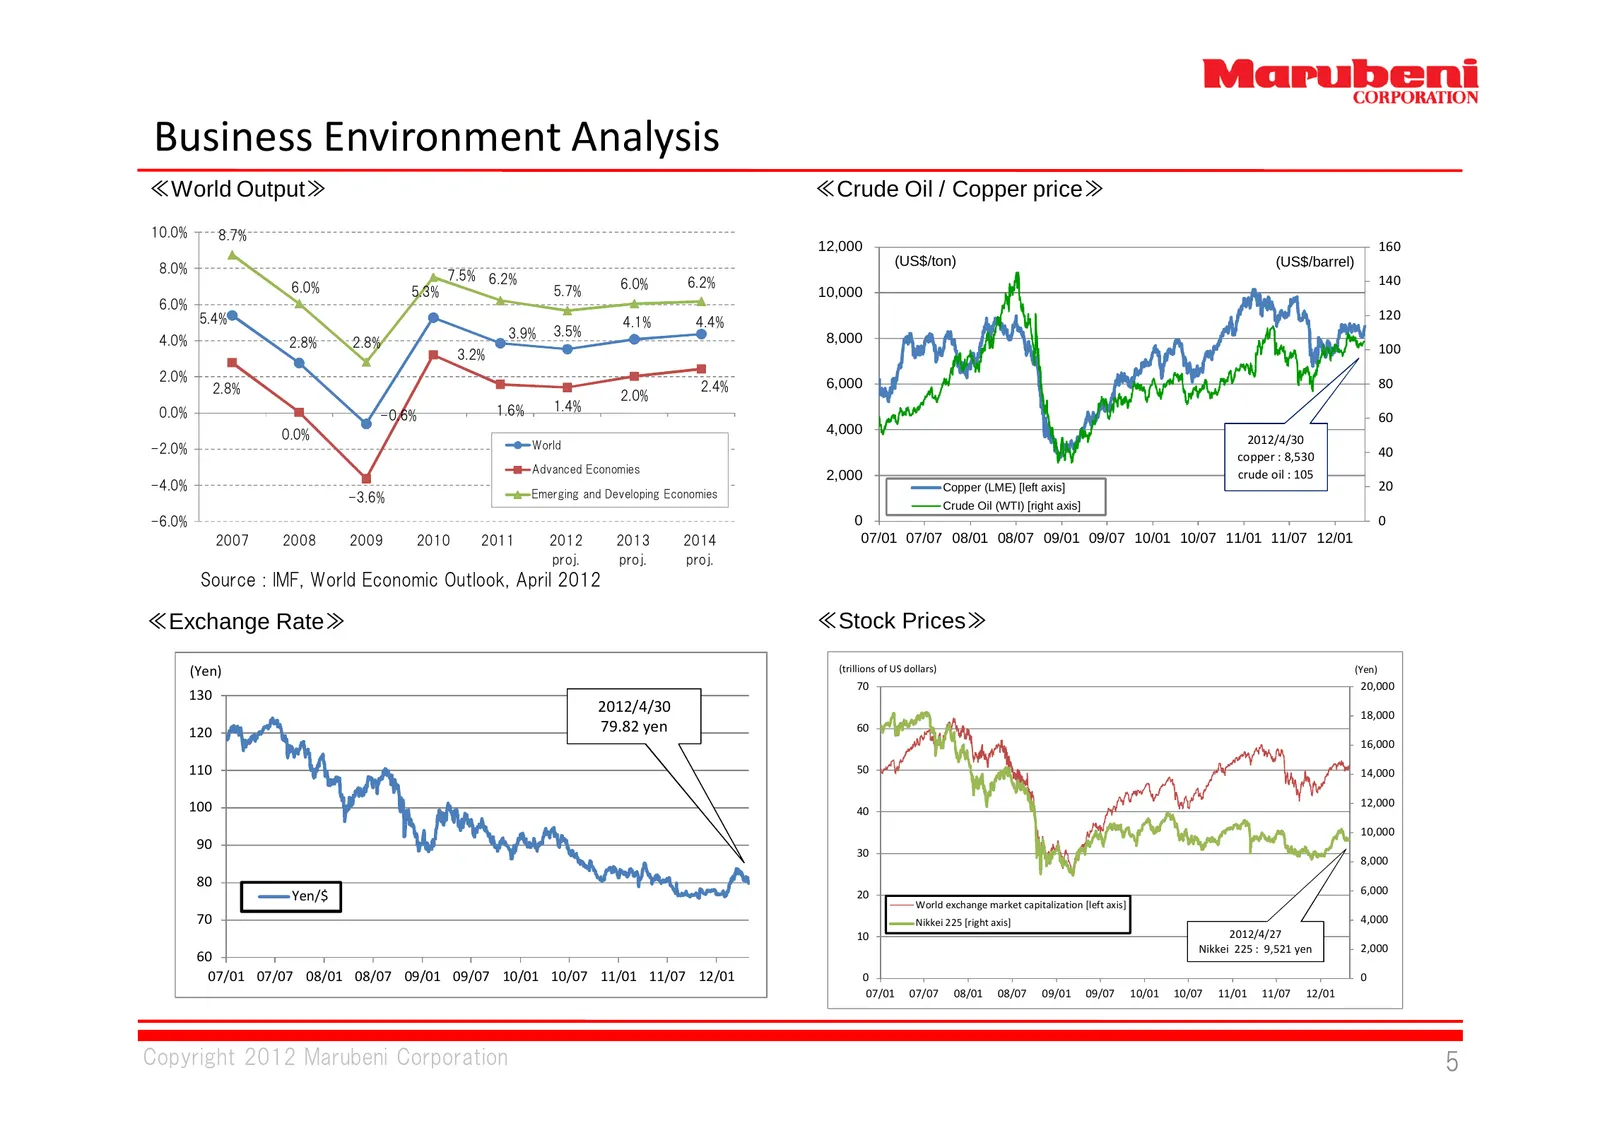
Business Environment Analysis ≪World Output≫ ≪Crude Oil / Copper price≫ 10.0% 8.7% 12,000 160 (US$/ton) (US$/barrel) 8.0% 7.5% 6.2% 6.2% 140 6.0% 6.0% 5.3% 5.7% 10,000 6.0% 5.4% 120 4.1% 4.4% 3.9% 3.5% 8,000 4.0% 2.8% 2.8% 3.2% 100 2.0% 6,000 80 2.8% 2.4% 2.0% 0.0% 1.6% 1.4% -0.6% 60 0.0% 4,000 Worl
Slide 7: I. FY2012/3 Results
Ⅰ. FY2012/3 Results Key Factors of FY2012/3 Results Business Environment Analysis Earnings Power and Structure Balance Sheets & Cash Flows Copyright 2012 Marubeni Corporation 6
Slide 8: Net Income
Net Income (billions of yen) 200 +35.6 billion yen (+26%) 172.1 147.2 136.5 150 119.3 111.2 95.3 100 50 0 Initial pros. Initial pros. Initial pros. Initial pros. Initial pros. Initial pros. (100.0) (135.0) (165.0) (80.0) (125.0) (170.0) -50 FY2007/3 FY2008/3 FY2009/3 FY2010/3 FY2011/3 FY2012/3 “G”PL
Slide 9: Adjusted Operating Profit and Core Earnings
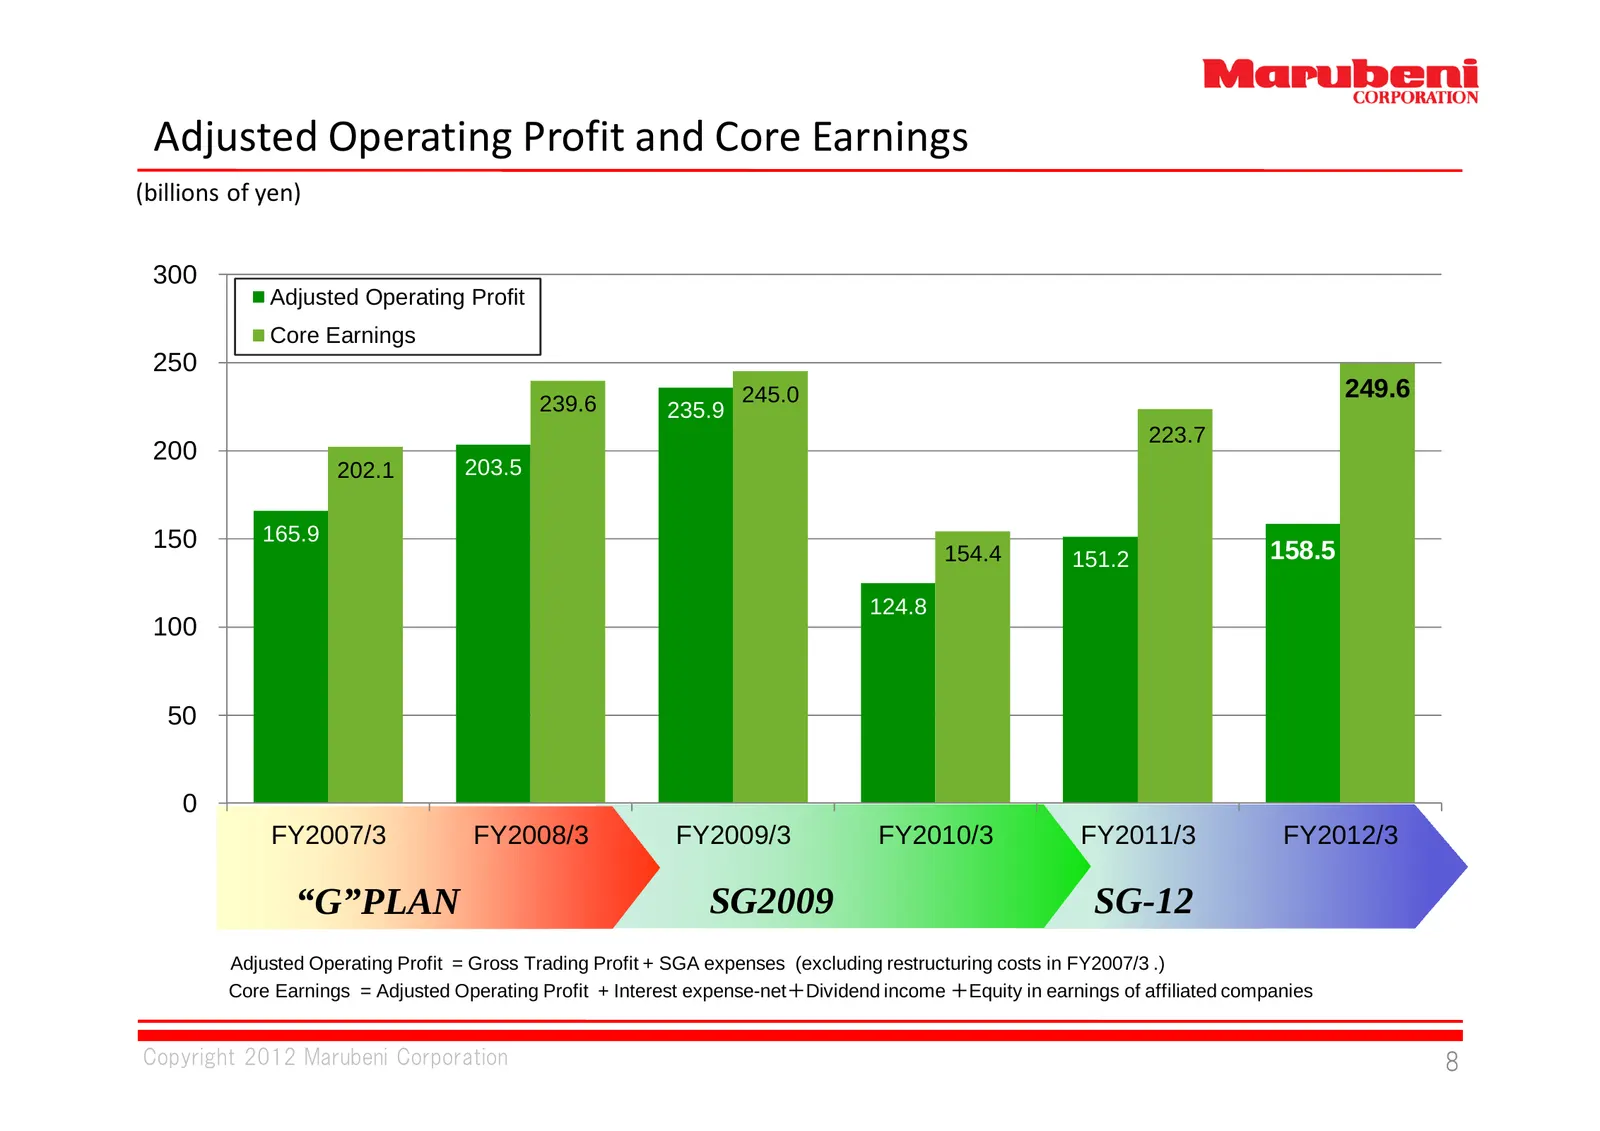
Adjusted Operating Profit and Core Earnings (billions of yen) 300 Adjusted Operating Profit Core Earnings 250 245.0 249.6 239.6 235.9 223.7 200 202.1 203.5 150 165.9 154.4 151.2 158.5 124.8 100 50 0 FY2007/3 FY2008/3 FY2009/3 FY2010/3 FY2011/3 FY2012/3 “G”PLAN SG2009 SG-12 Adjusted Operating Profit
Slide 10: Earnings Structure and Business Portfolio
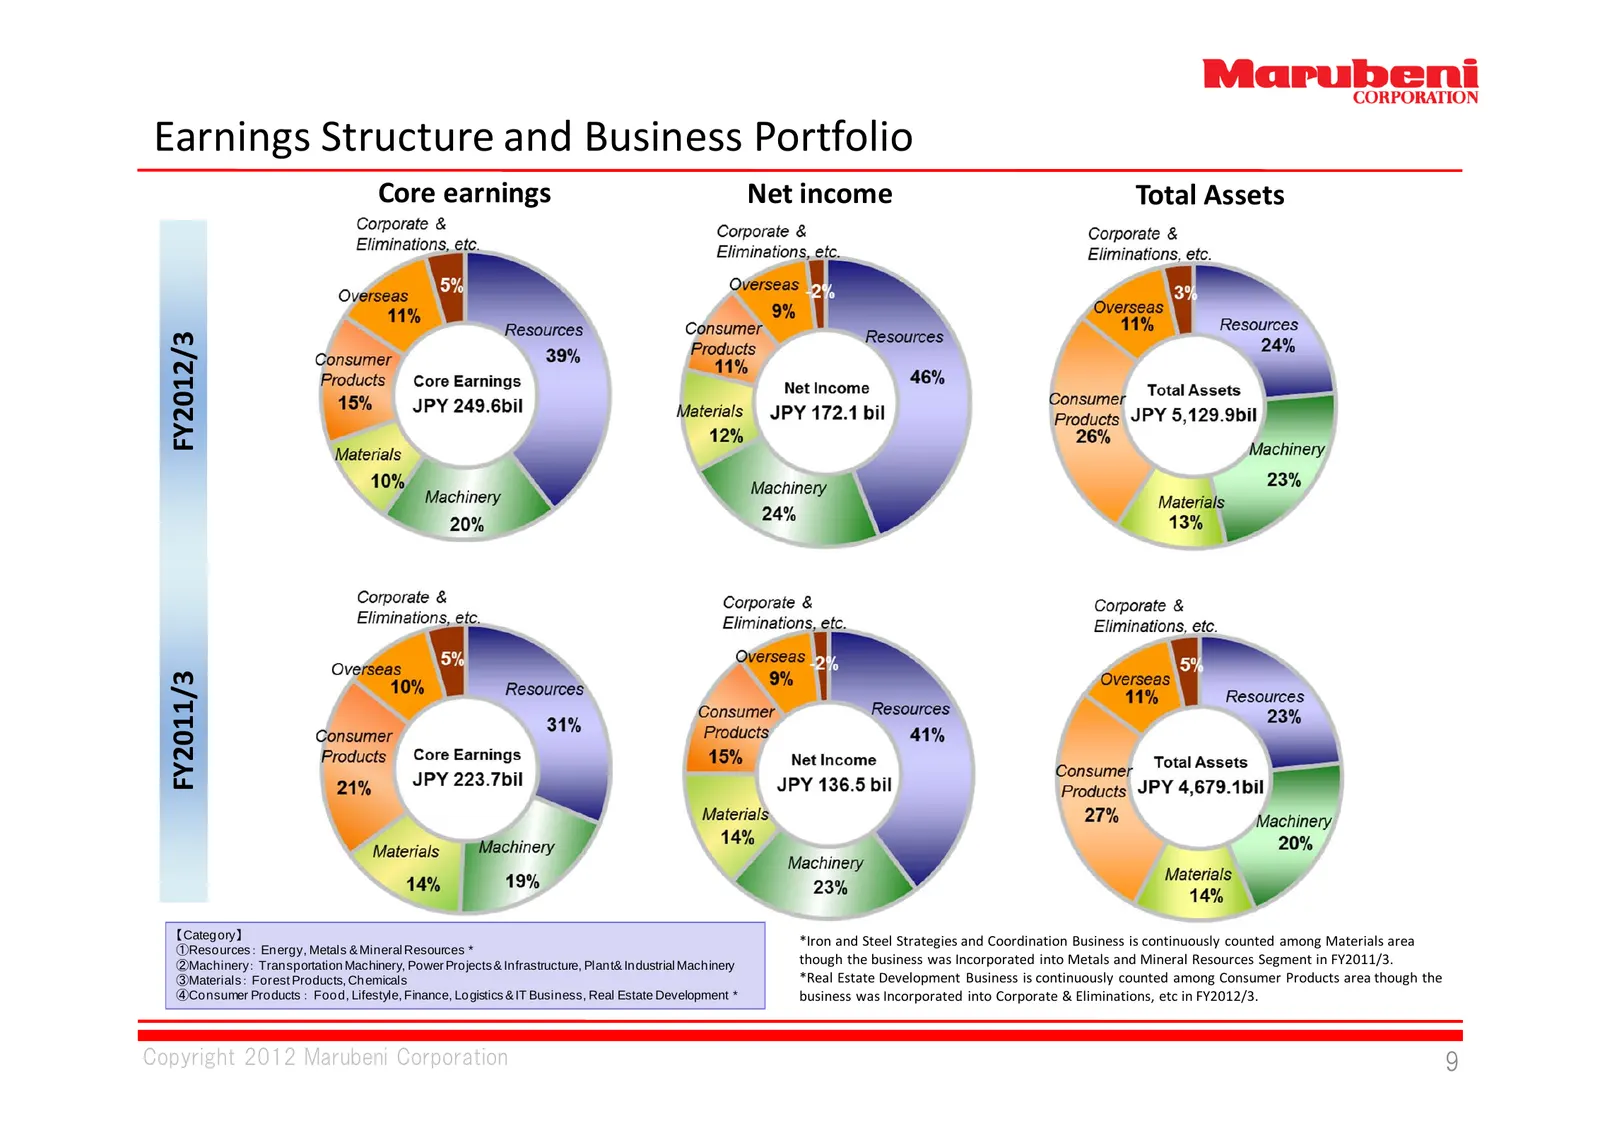
Earnings Structure and Business Portfolio FY2012/3 FY2011/3 Core earnings Net income Total Assets 【Category】 *Iron and Steel Strategies and Coordination Business is continuously counted among Materials area ①Resources: Energy, Metals & Mineral Resources * ②Machinery: Transportation Machinery, Power
Slide 11: Net Income by Operating Segment for FY2011/3 & FY2012/3
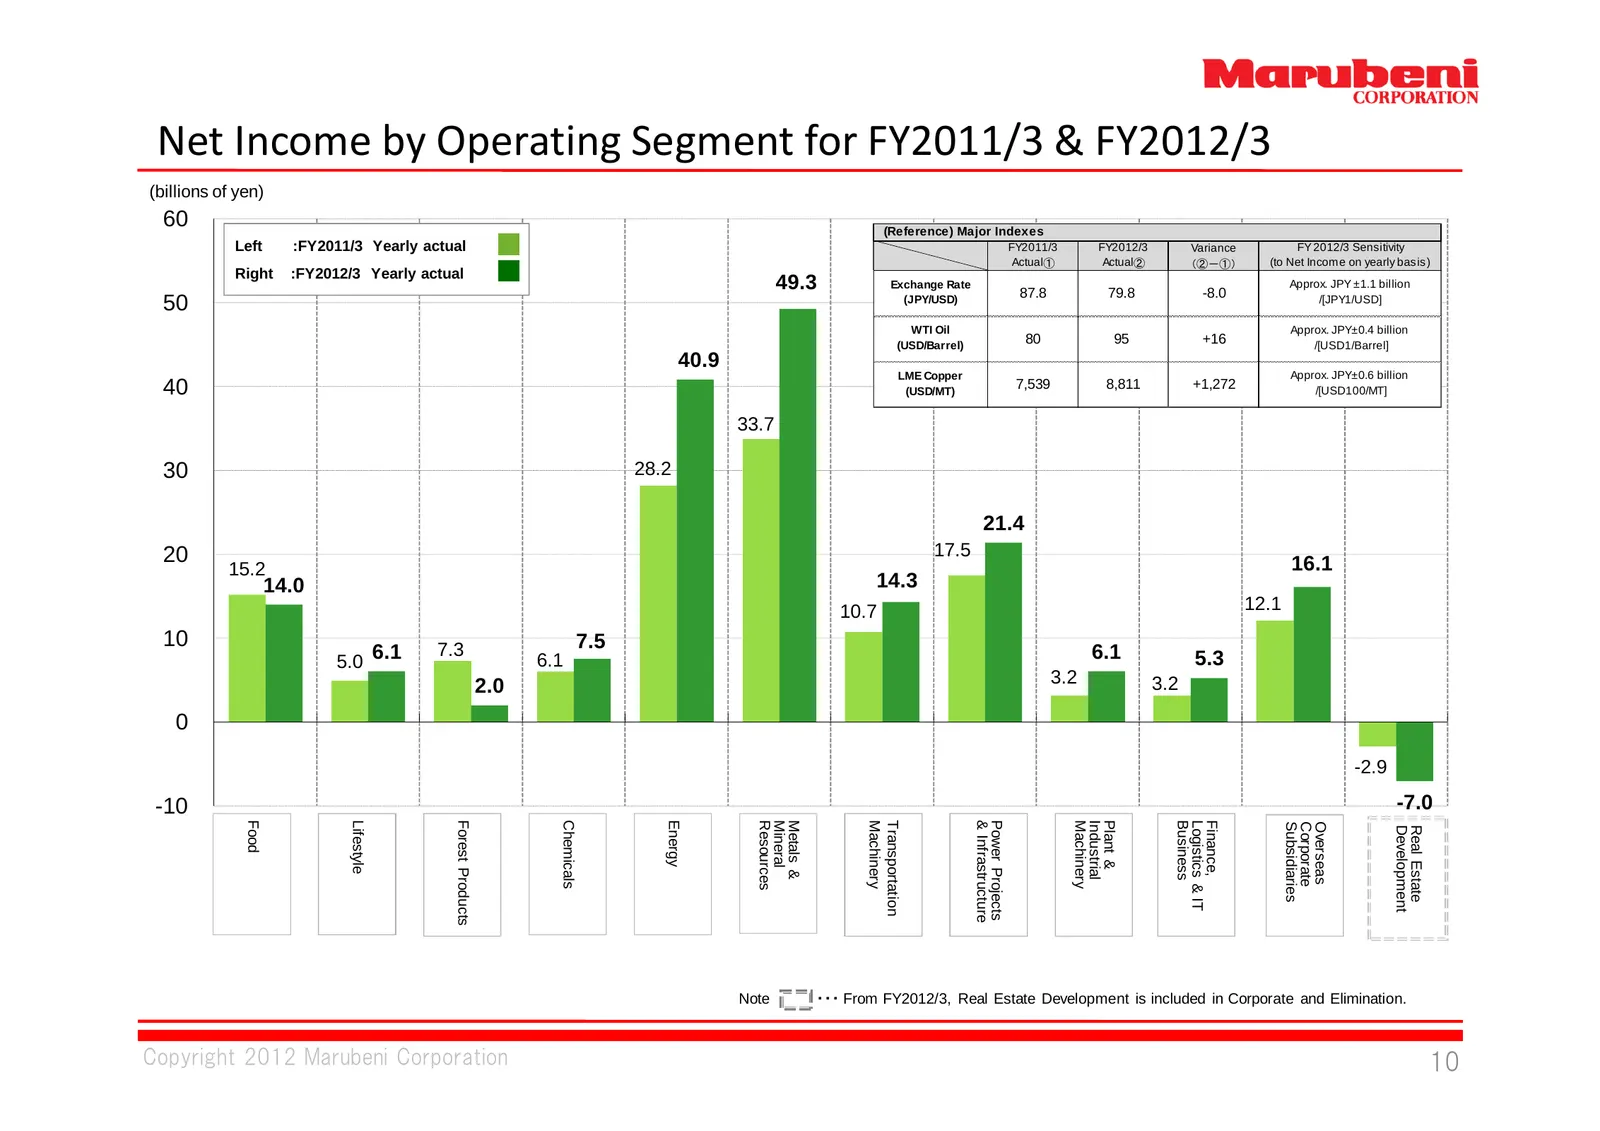
Net Income by Operating Segment for FY2011/3 & FY2012/3 (billions of yen) 60 (Reference) Major Indexes Left :FY2011/3 Yearly actual FY2011/3 FY2012/3 Variance FY 2012/3 Sensitivity Actual① Actual② (②-①) (to Net Income on yearly basis) Right :FY2012/3 Yearly actual 49.3 Exchange Rate 87.8 79.8 -8.0 A
Slide 12: I. FY2012/3 Results
Ⅰ. FY2012/3 Results Key Factors of FY2012/3 Results Business Environment Analysis Earnings Power and Structure Balance Sheets & Cash Flows Copyright 2012 Marubeni Corporation 11
Slide 13: Equity and Net D/E Ratio
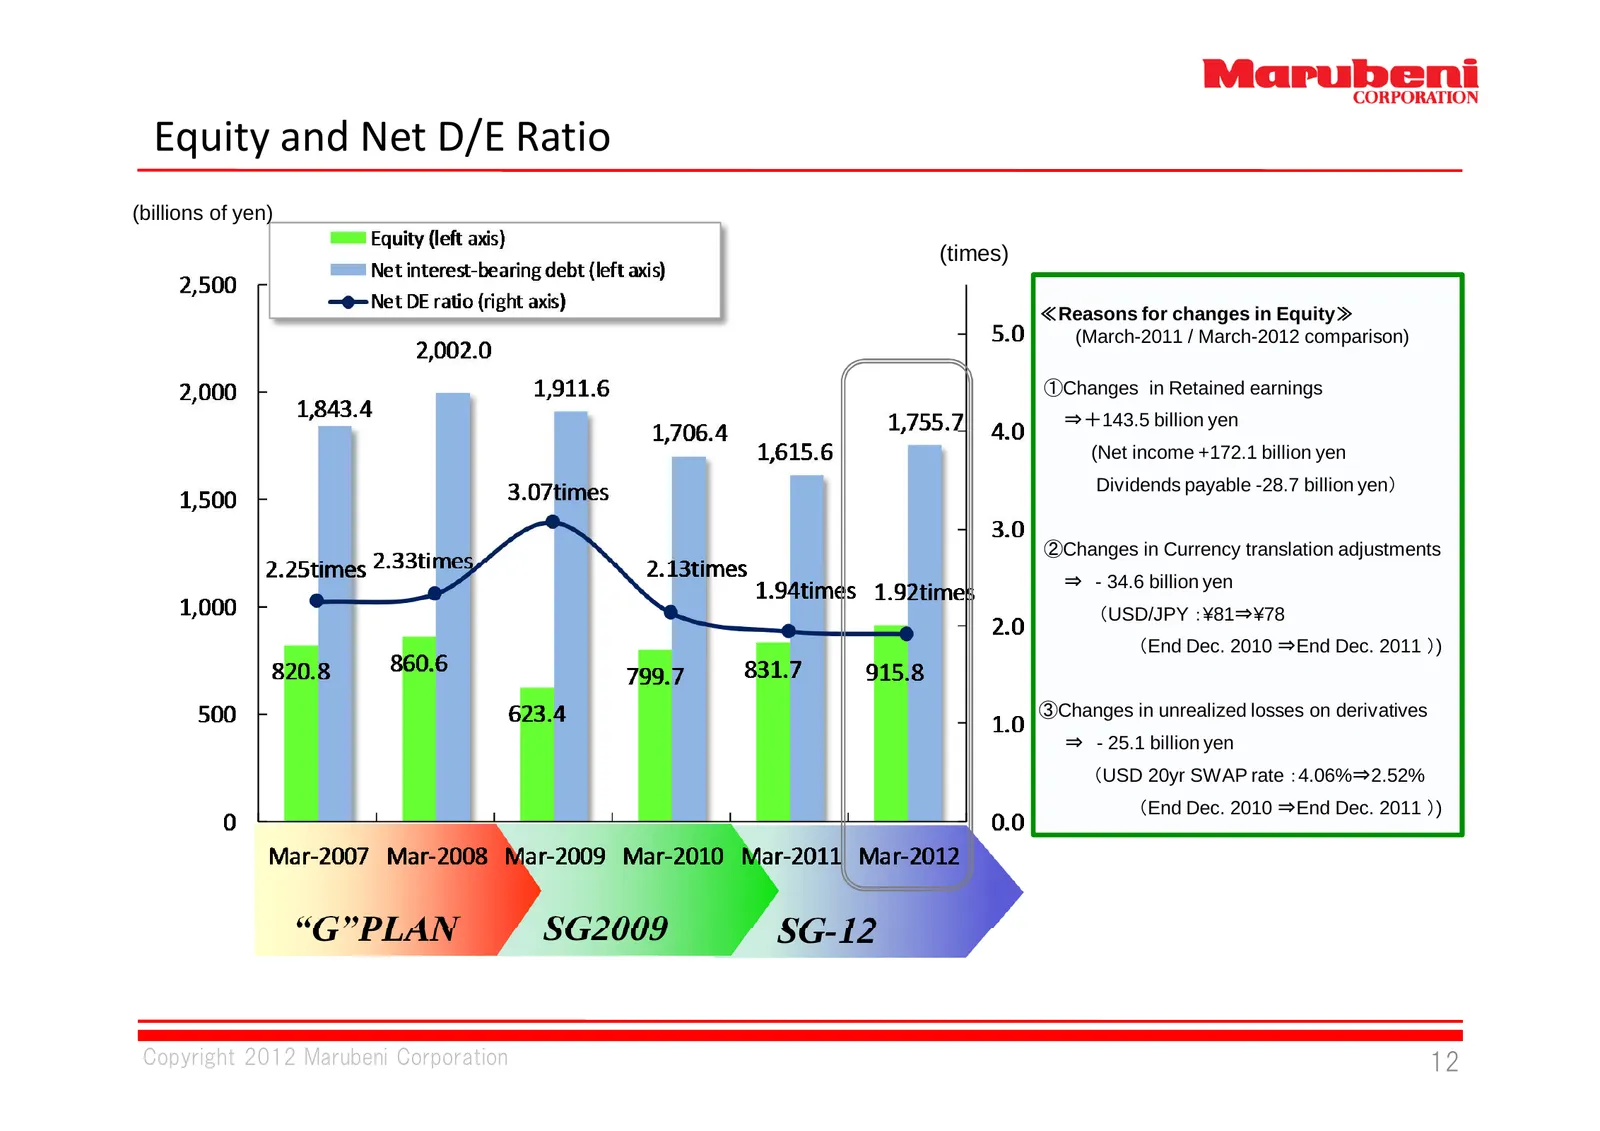
Equity and Net D/E Ratio (billions of yen) (times) ≪Reasons for changes in Equity≫ (March-2011 / March-2012 comparison) ①Changes in Retained earnings ⇒+143.5 billion yen (Net income +172.1 billion yen Dividends payable -28.7 billion yen) ②Changes in Currency translation adjustments ⇒ - 34.6 billion
Slide 14: Cash Flows
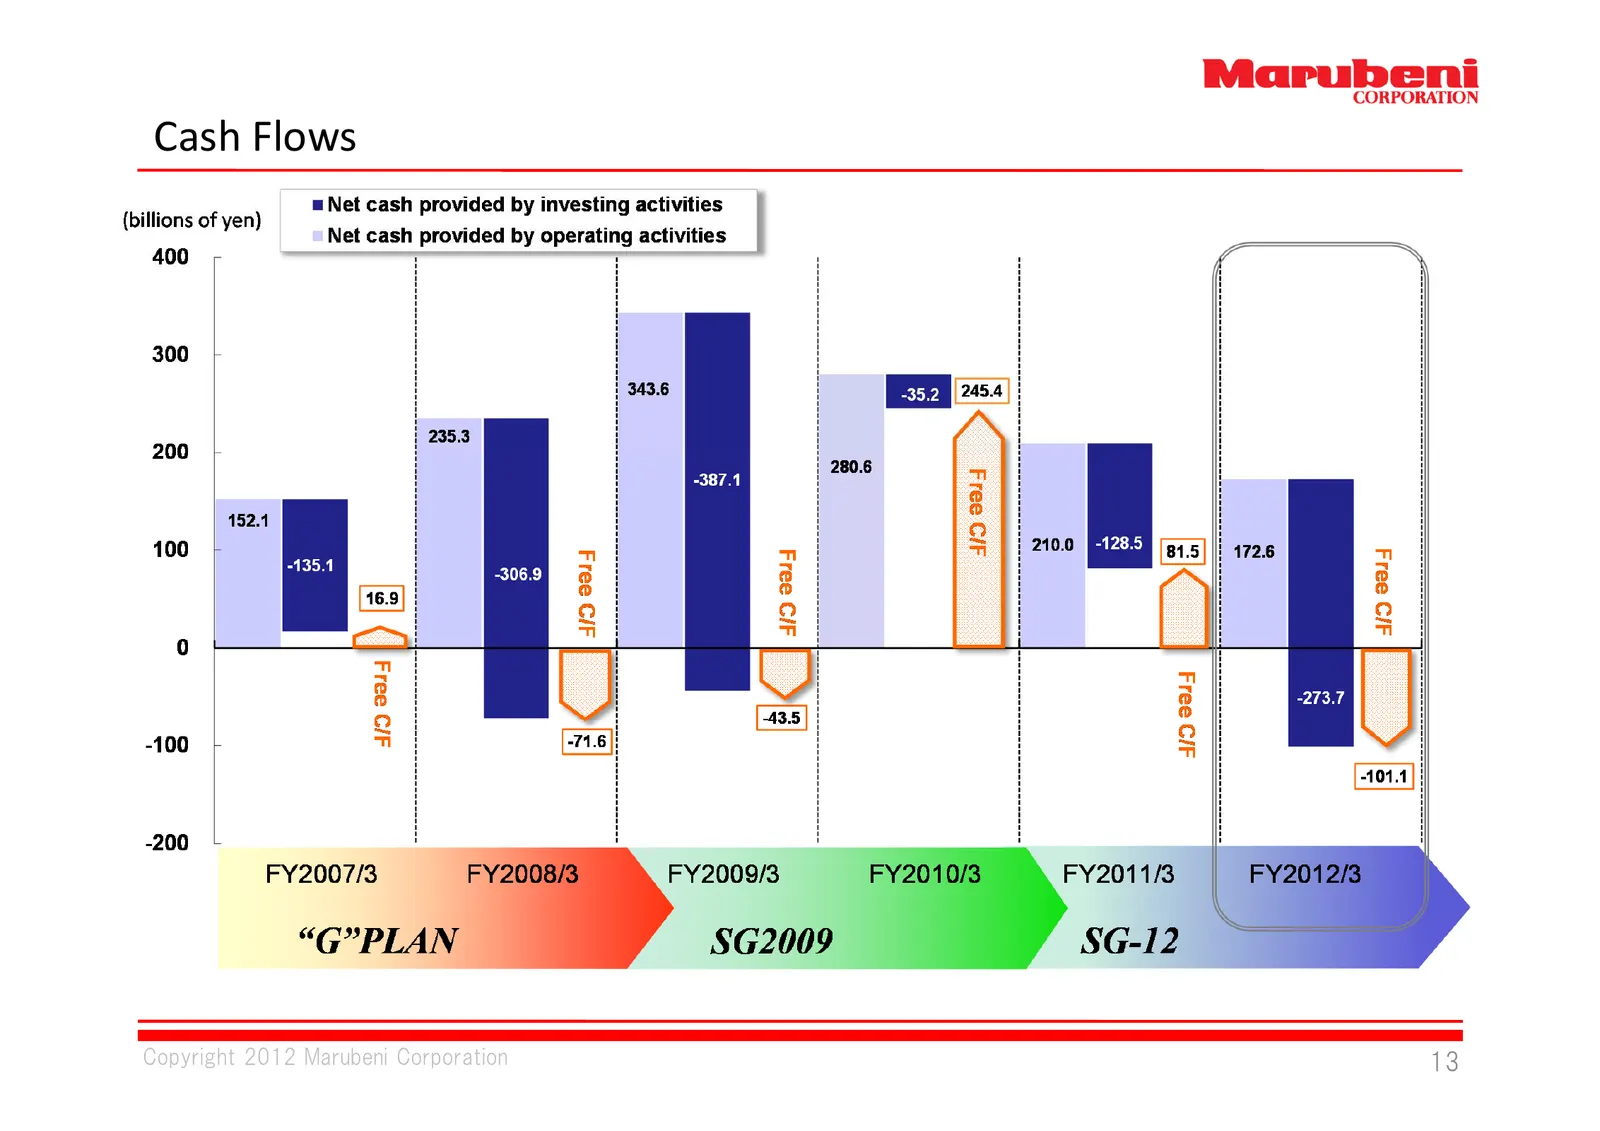
Cash Flows Copyright 2012 Marubeni Corporation 13
Slide 15: Equity and Risk Assets
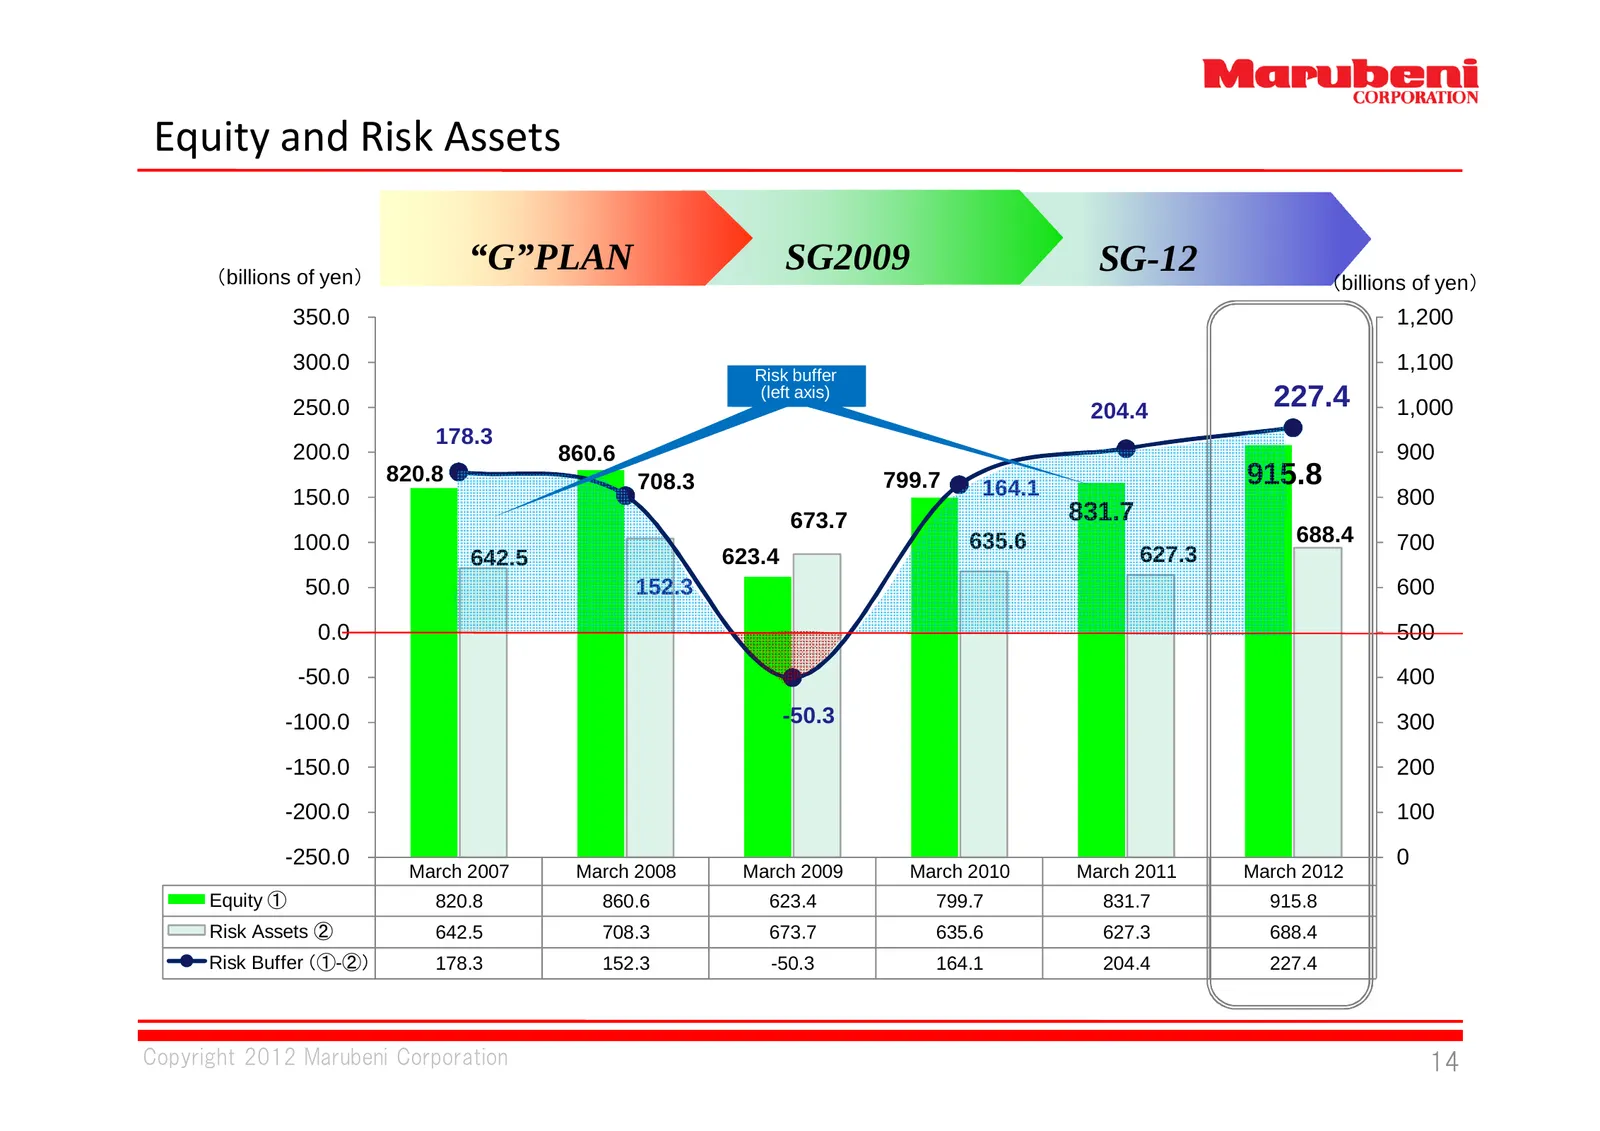
Equity and Risk Assets (billions of yen) “G”PLAN SG2009 SG-12 (billions of yen) 350.0 1,200 300.0 1,100 Risk Risk buffer buffer 250.0 (left (left axis) axis) 204.4 227.4 1,000 178.3 200.0 860.6 900 820.8 708.3 799.7 164.1 915.8 150.0 800 673.7 831.7 100.0 635.6 688.4 700 642.5 623.4 627.3 50.0 152.3
Slide 16: ROE and ROA
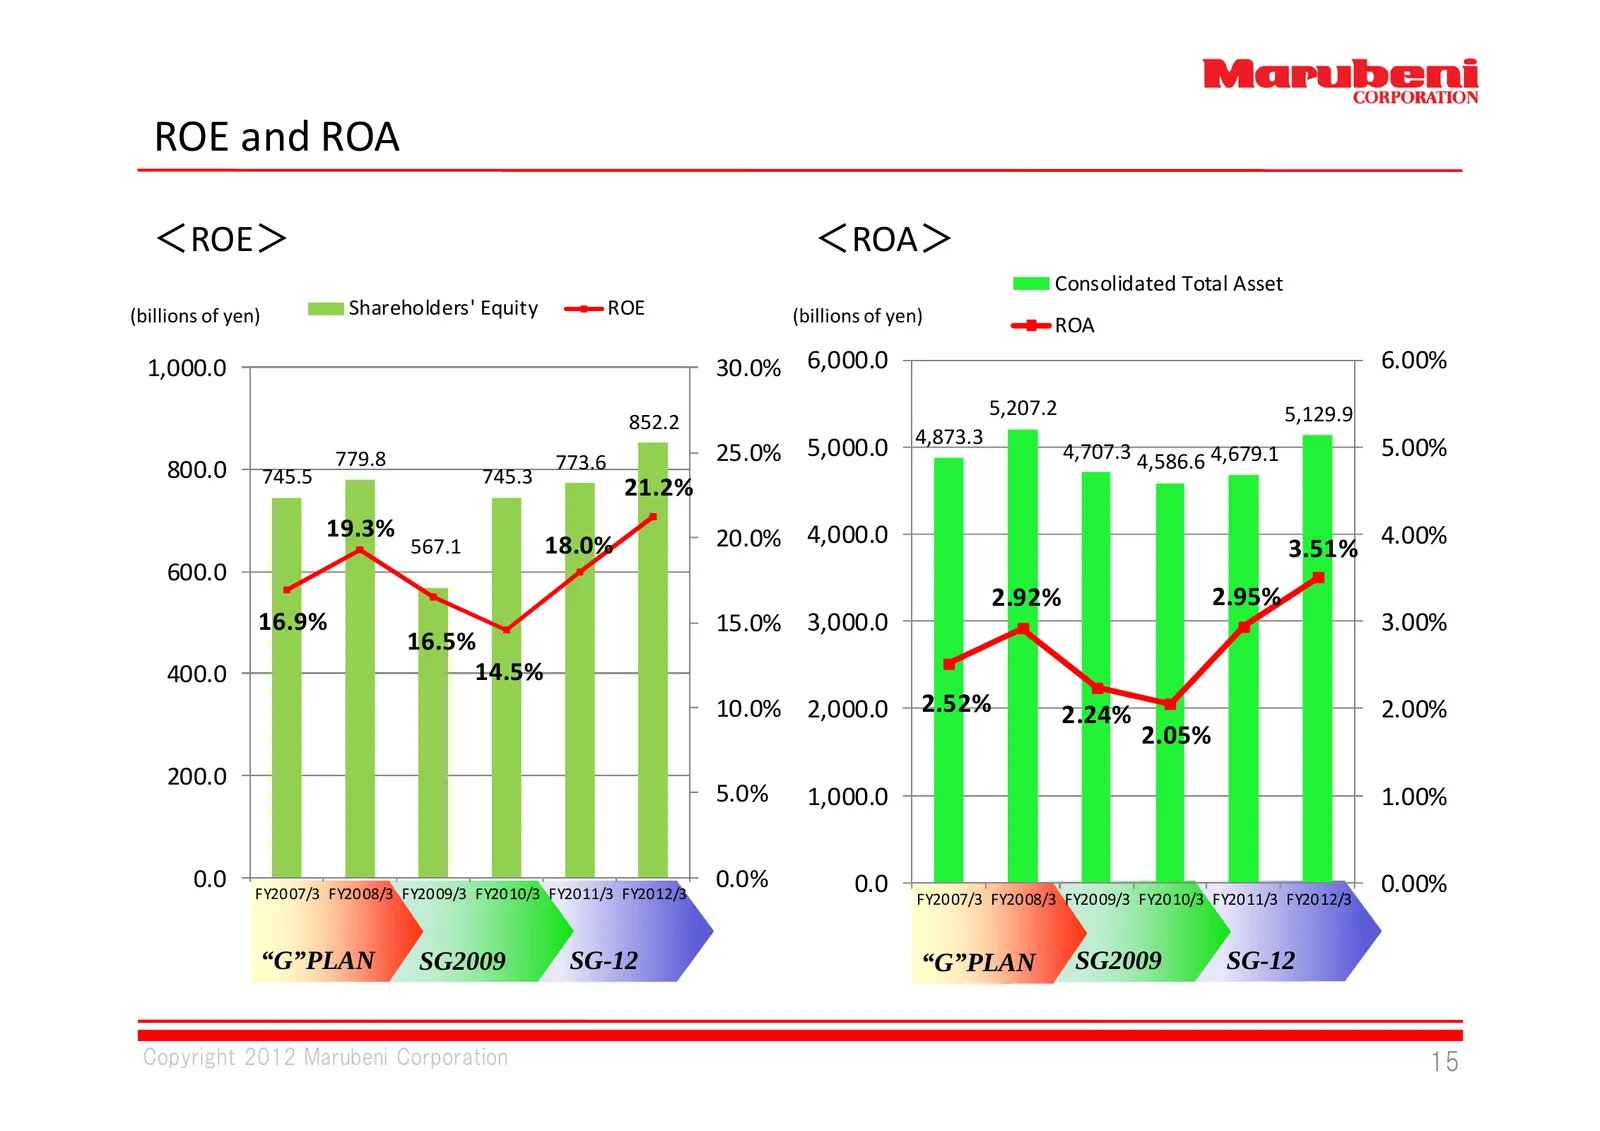
ROE and ROA <ROE> <ROA> Consolidated Total Asset (billions of yen) Shareholders' Equity ROE (billions of yen) ROA 1,000.0 30.0% 6,000.0 6.00% 5,207.2 5,129.9 852.2 4,873.3 779.8 773.6 25.0% 5,000.0 4,707.3 4,586.6 4,679.1 5.00% 800.0 745.5 745.3 21.2% 19.3% 20.0% 4,000.0 4.00% 567.1 18.0% 3.51% 600.
Slide 17: II. Progress of SG-12
Ⅱ. Progress of SG‐12 Copyright 2012 Marubeni Corporation 16
Slide 18: Progress of SG-12
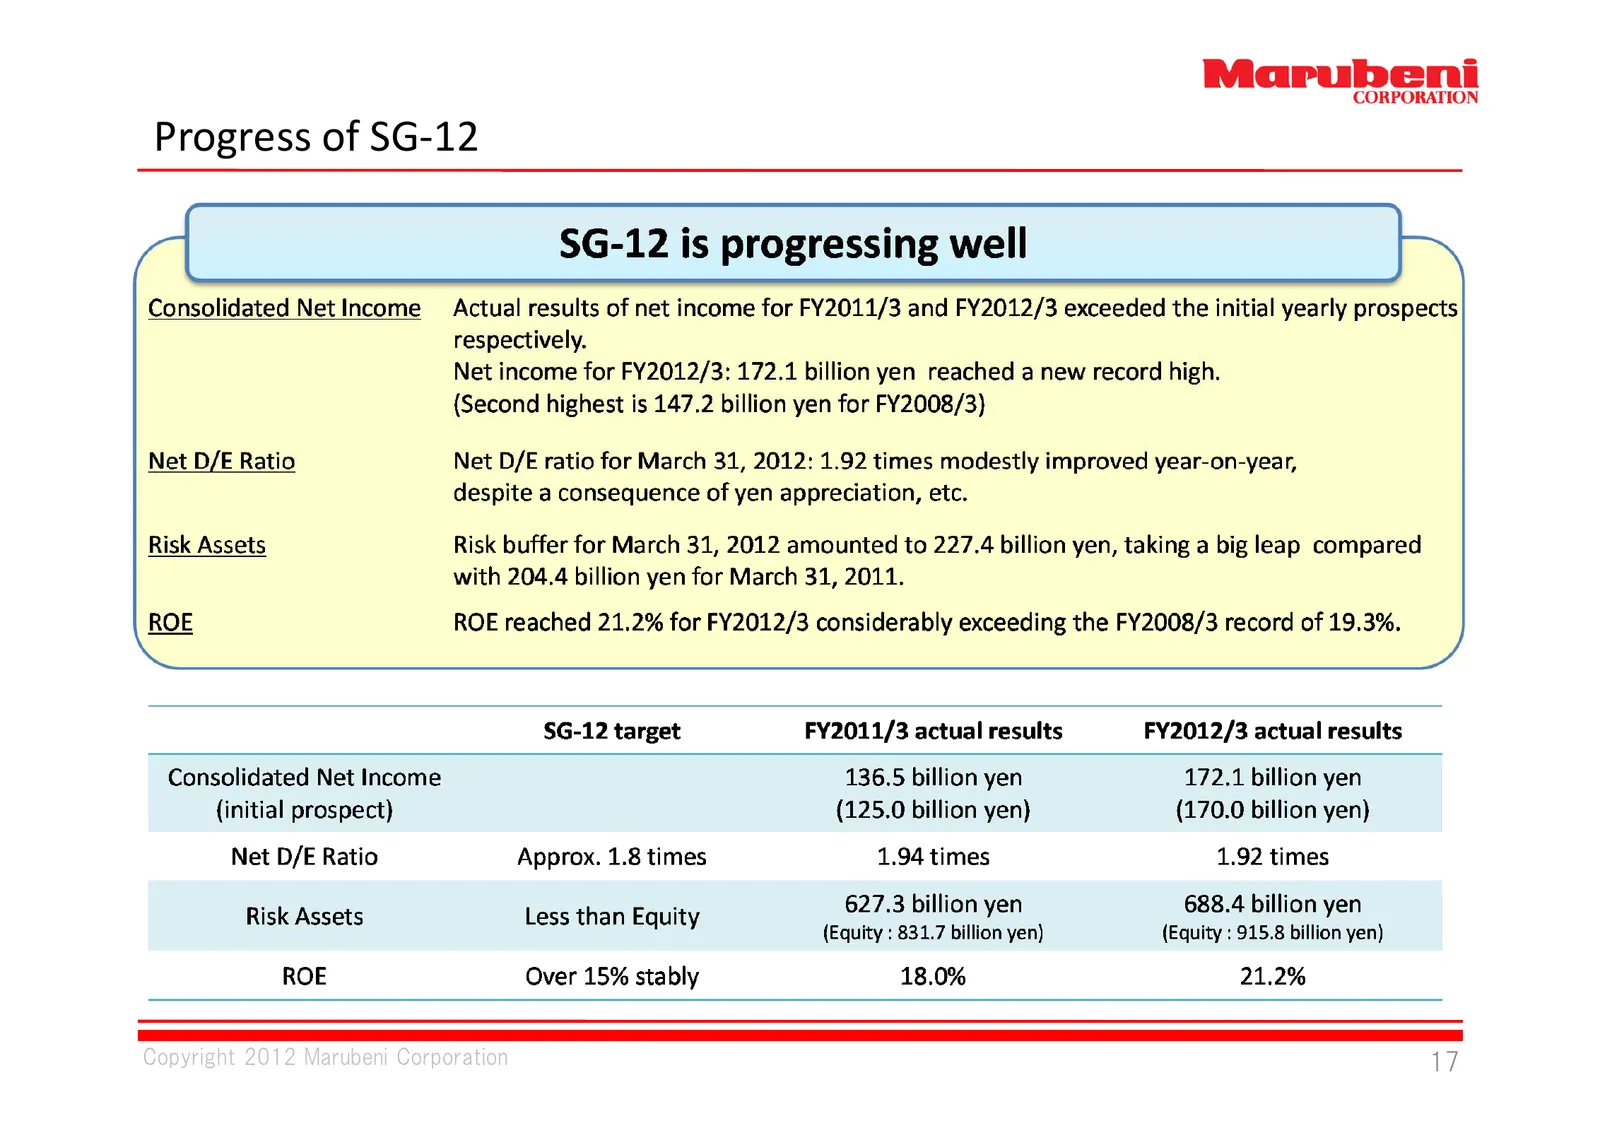
Progress of SG‐12 Copyright 2012 Marubeni Corporation 17
Slide 19: Priority Allocation of Management Resources
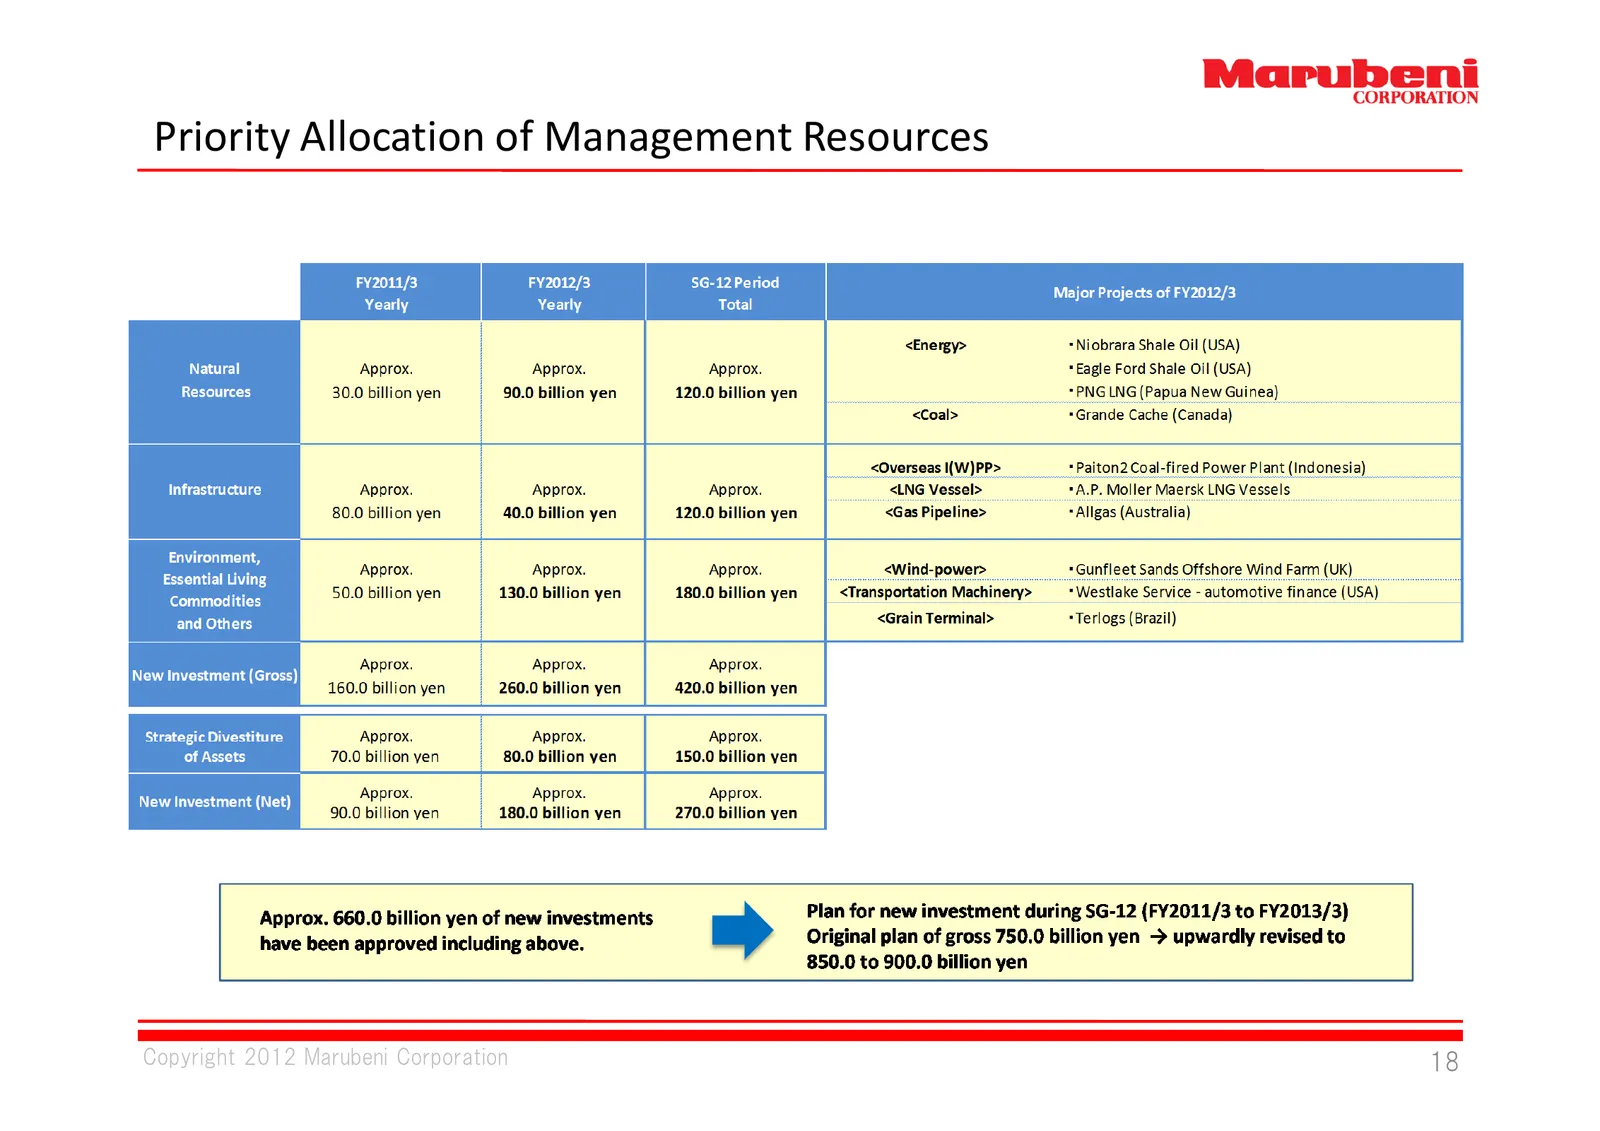
Priority Allocation of Management Resources Copyright 2012 Marubeni Corporation 18
Slide 20: Major Projects: Metals & Mineral Resources
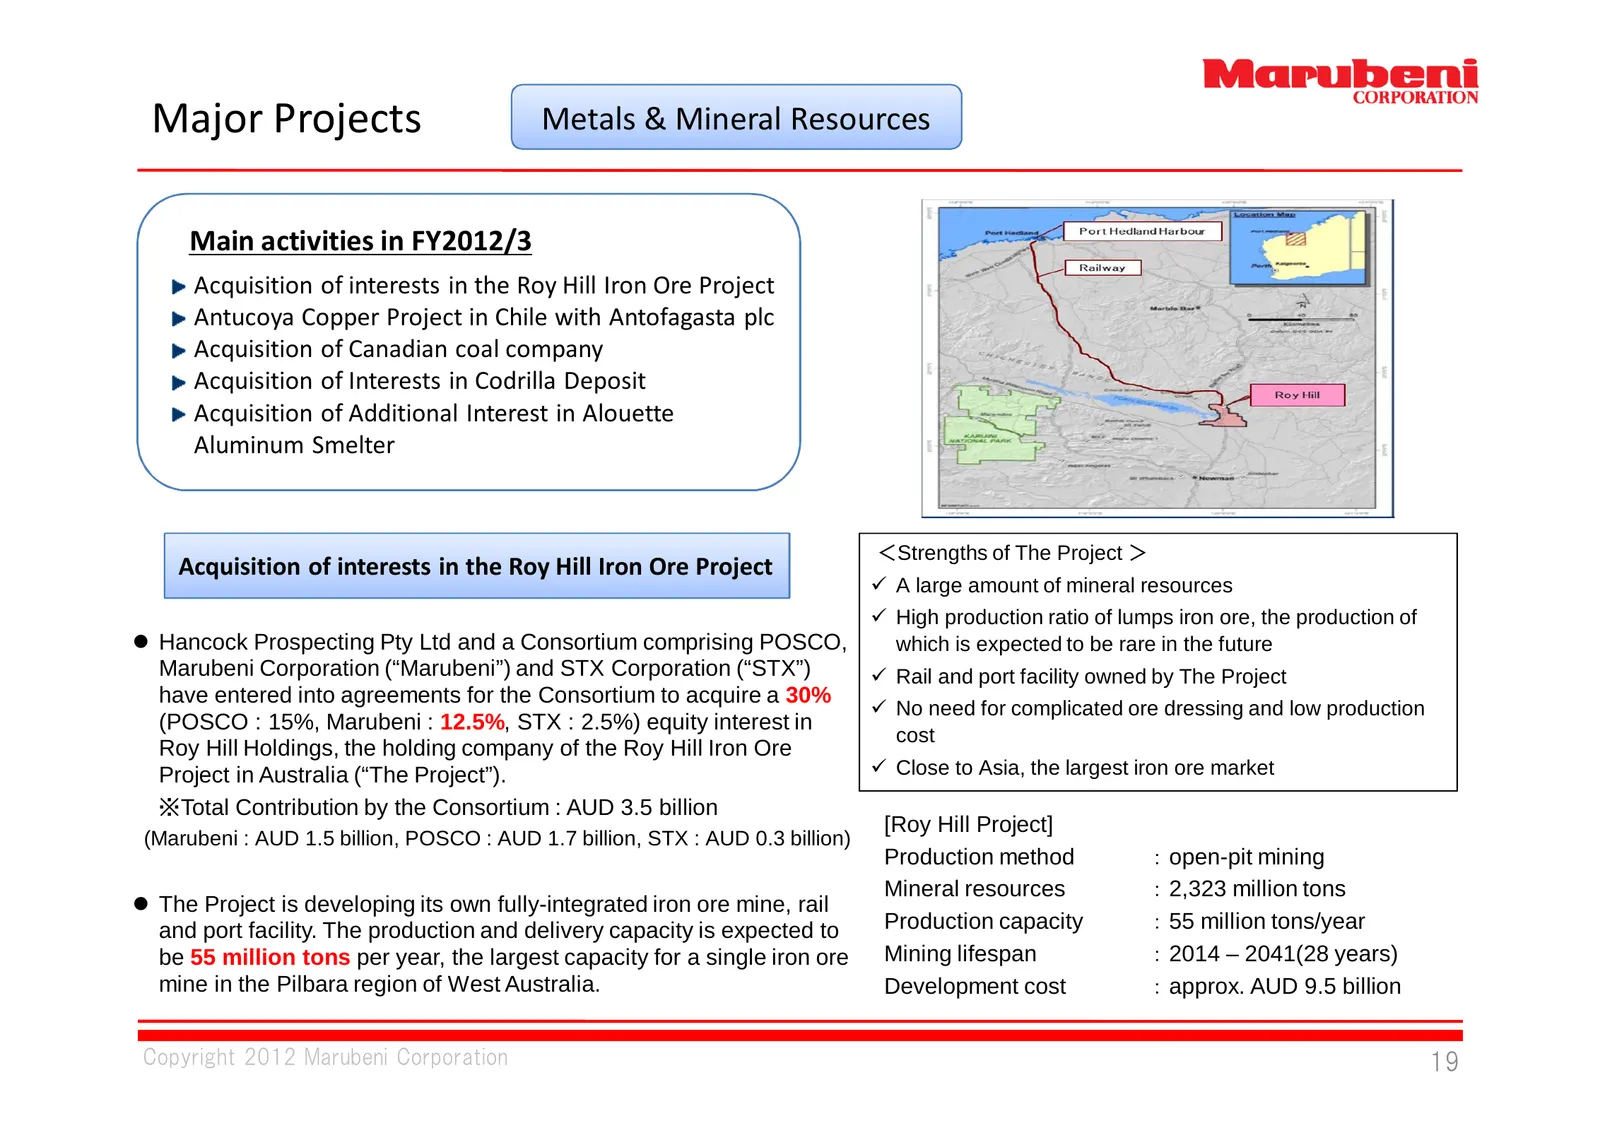
Major Projects Metals & Mineral Resources Main activities in FY2012/3 Acquisition of interests in the Roy Hill Iron Ore Project Antucoya Copper Project in Chile with Antofagasta plc Acquisition of Canadian coal company Acquisition of Interests in Codrilla Deposit Acquisition of Additional Interest i
Slide 21: Major Projects: Metals & Mineral Resources
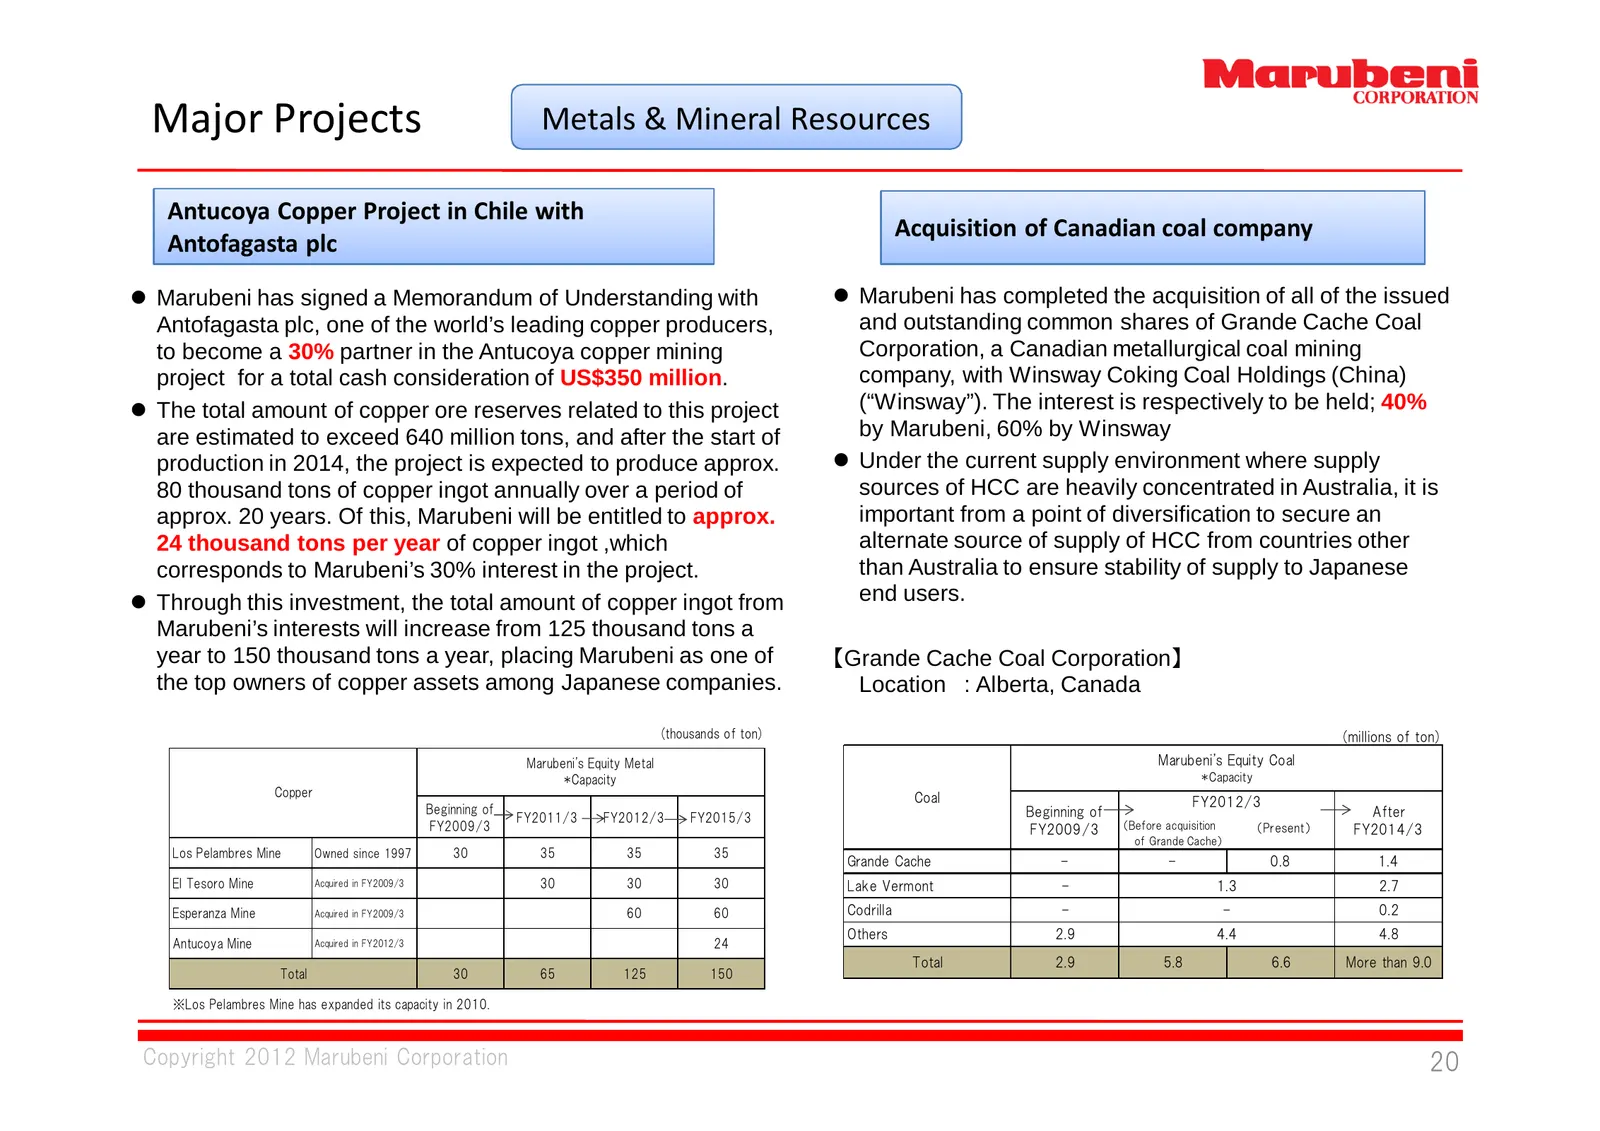
Major Projects Metals & Mineral Resources Antucoya Copper Project in Chile with Acquisition of Canadian coal company Antofagasta plc Marubeni has signed a Memorandum of Understanding with Marubeni has completed the acquisition of all of the issued Antofagasta plc, one of the world’s leading copp
Slide 22: Major Projects: Energy
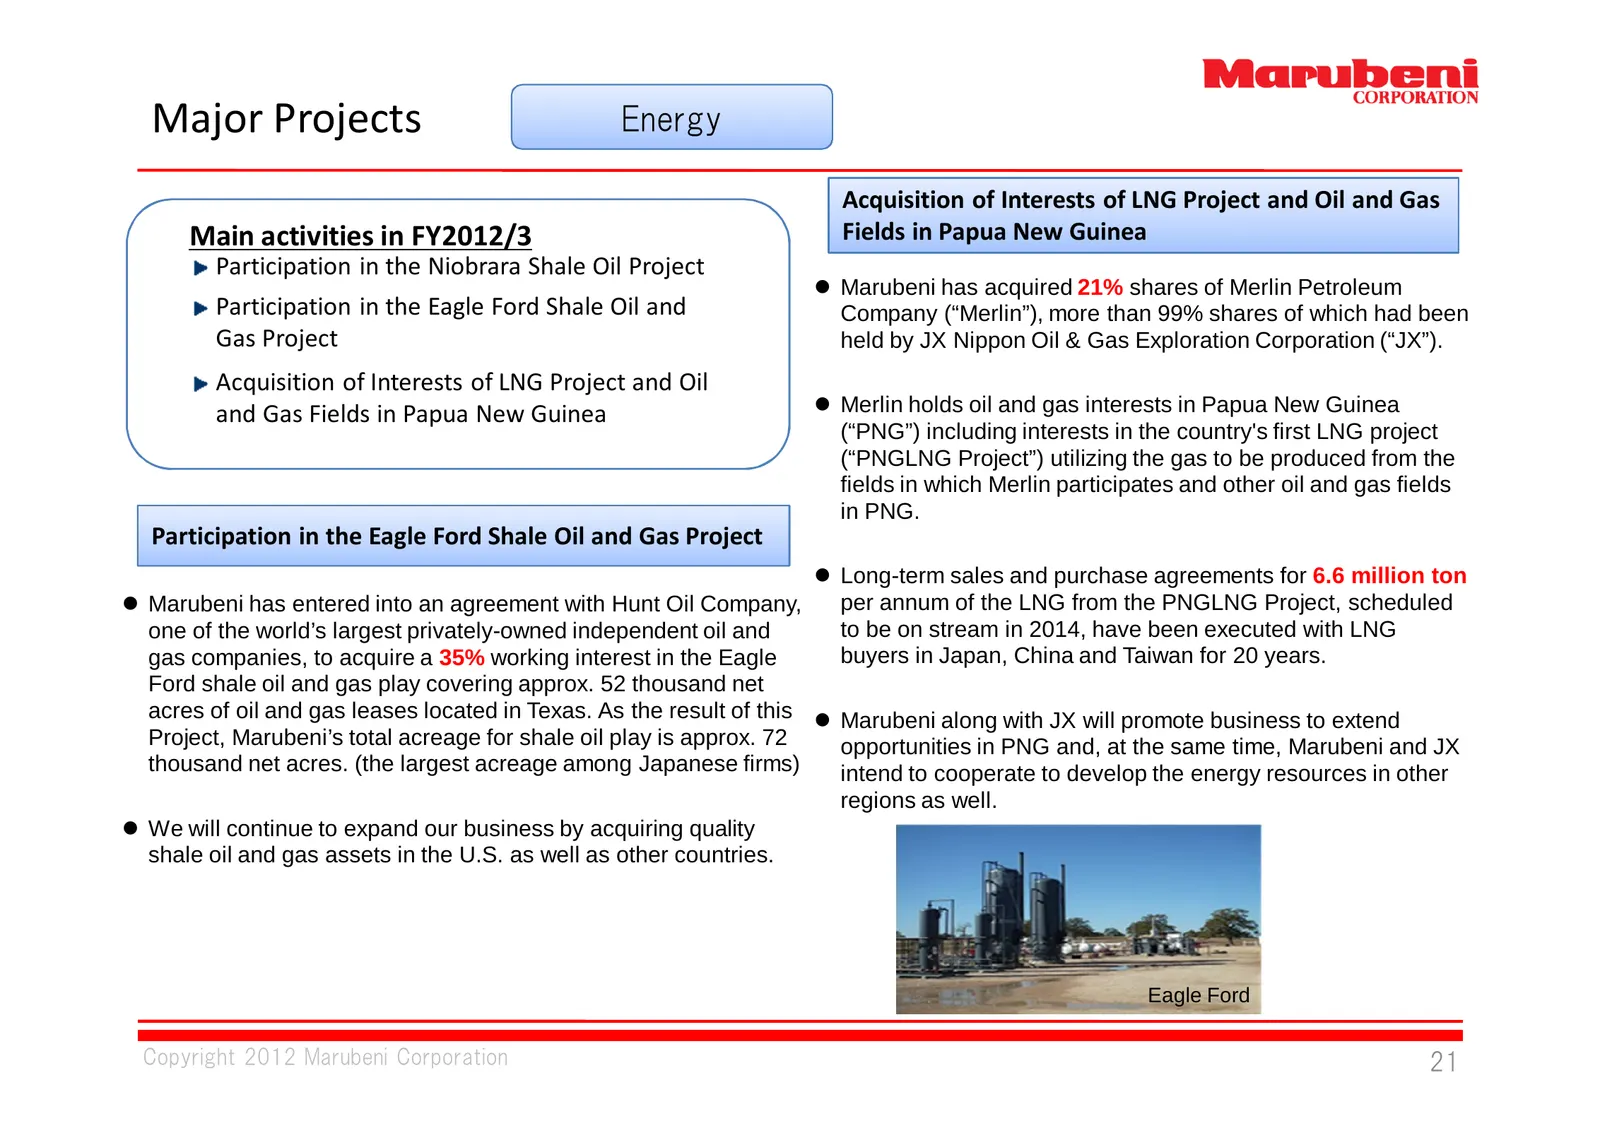
Major Projects Energy Acquisition of Interests of LNG Project and Oil and Gas Main activities in FY2012/3 Fields in Papua New Guinea Participation in the Niobrara Shale Oil Project Marubeni has acquired 21% shares of Merlin Petroleum Participation in the Eagle Ford Shale Oil and Company (“Merlin”)
Slide 23: Major Projects: Power Projects
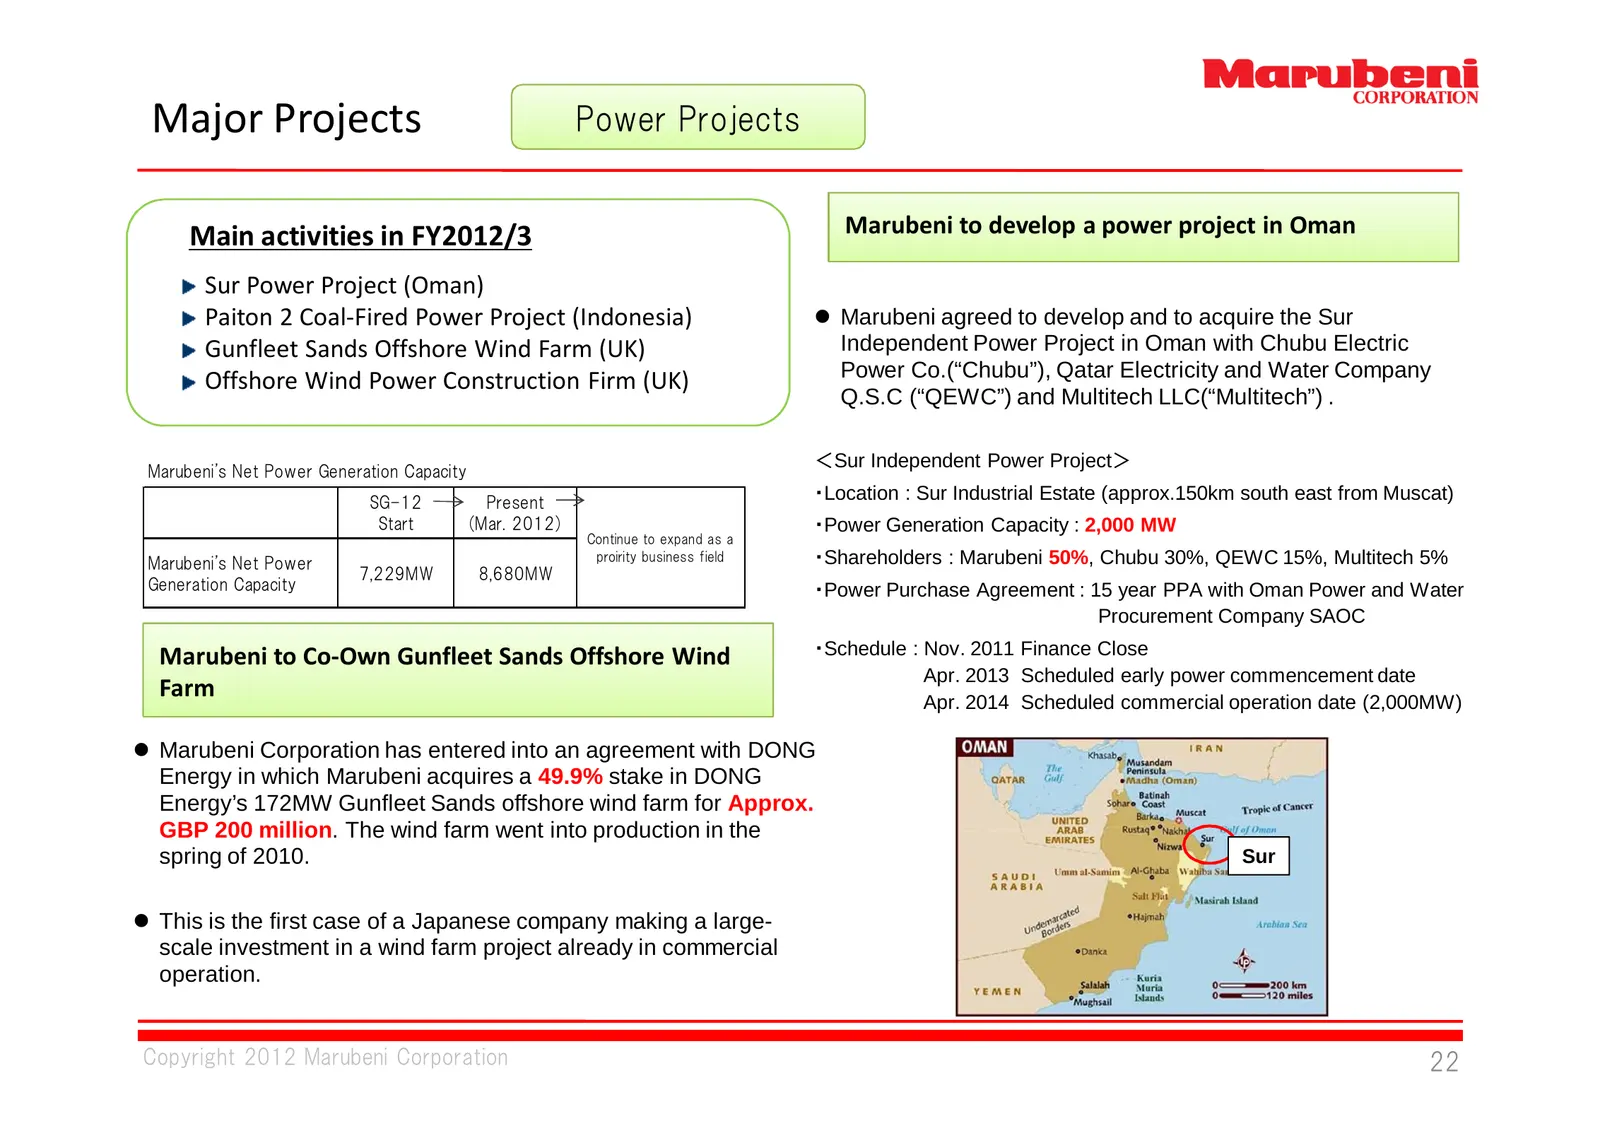
Major Projects Power Projects Main activities in FY2012/3 Marubeni to develop a power project in Oman Sur Power Project (Oman) Paiton 2 Coal‐Fired Power Project (Indonesia) Marubeni agreed to develop and to acquire the Sur Gunfleet Sands Offshore Wind Farm (UK) Independent Power Project in Oman wi
Slide 24: Major Projects: Transportation Machinery Business
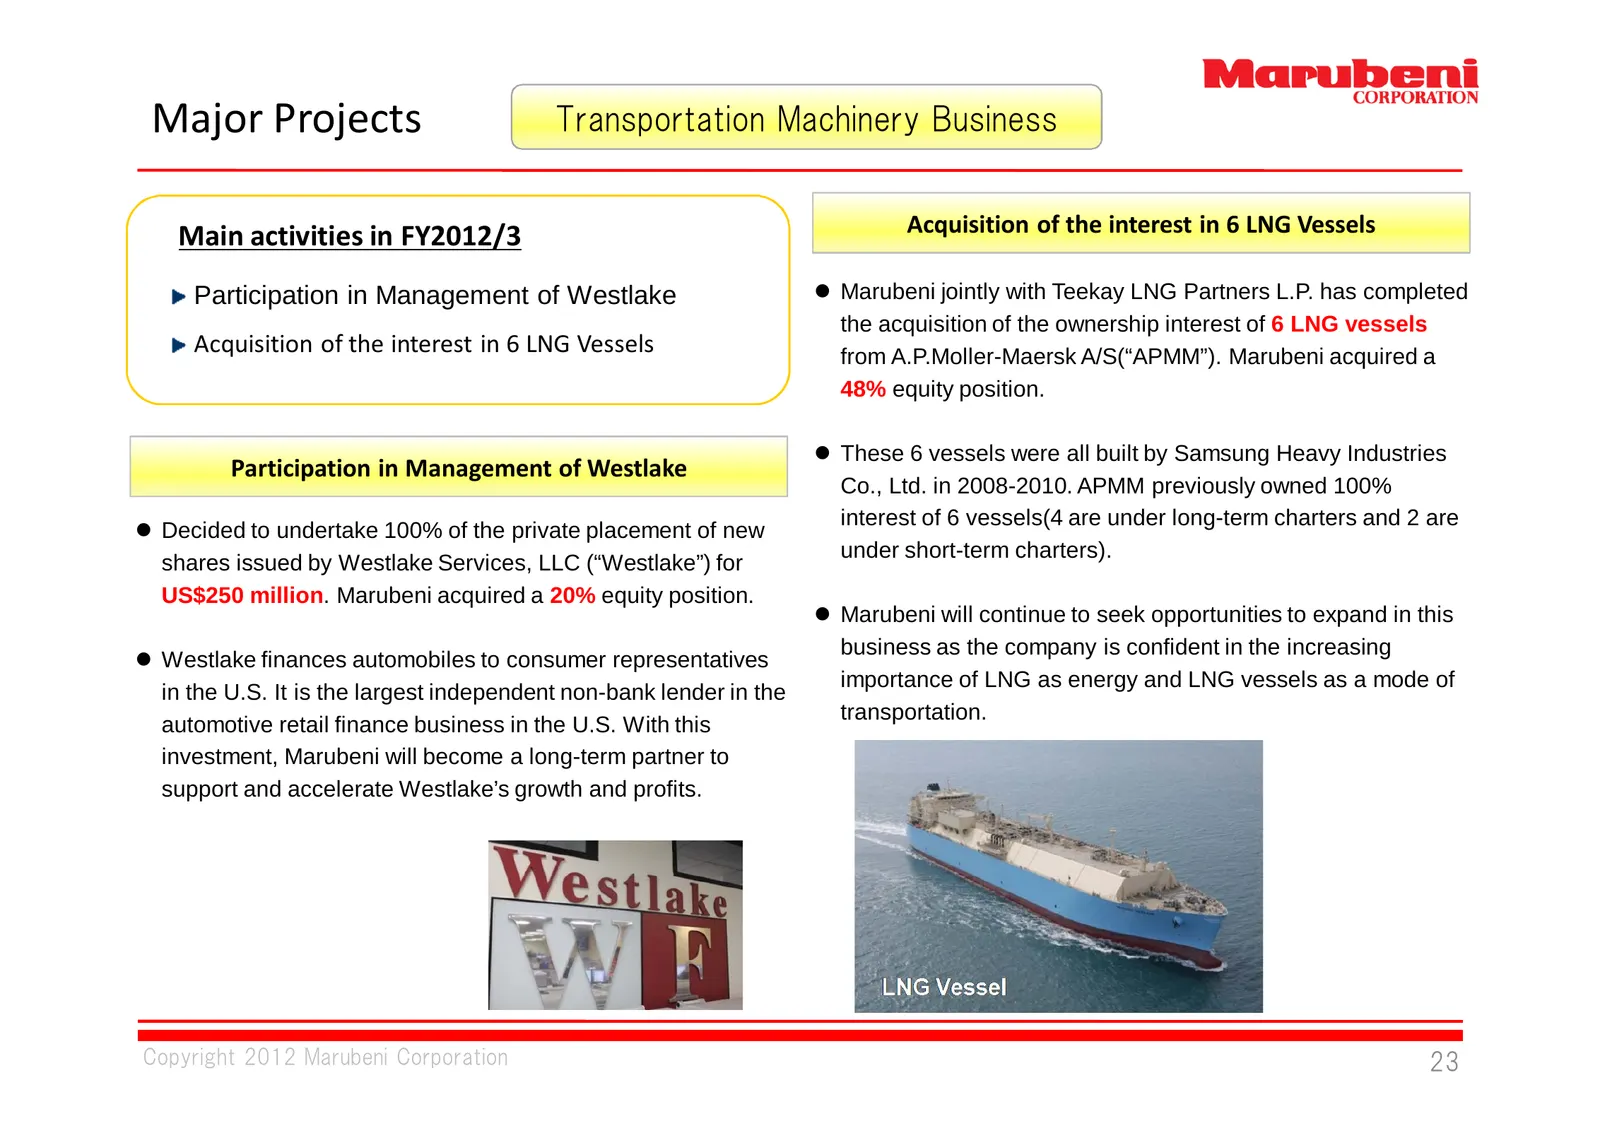
Major Projects Transportation Machinery Business Acquisition of the interest in 6 LNG Vessels Main activities in FY2012/3 Participation in Management of Westlake Marubeni jointly with Teekay LNG Partners L.P. has completed the acquisition of the ownership interest of 6 LNG vessels Acquisition of t
Slide 25: Major Projects: Grain Business
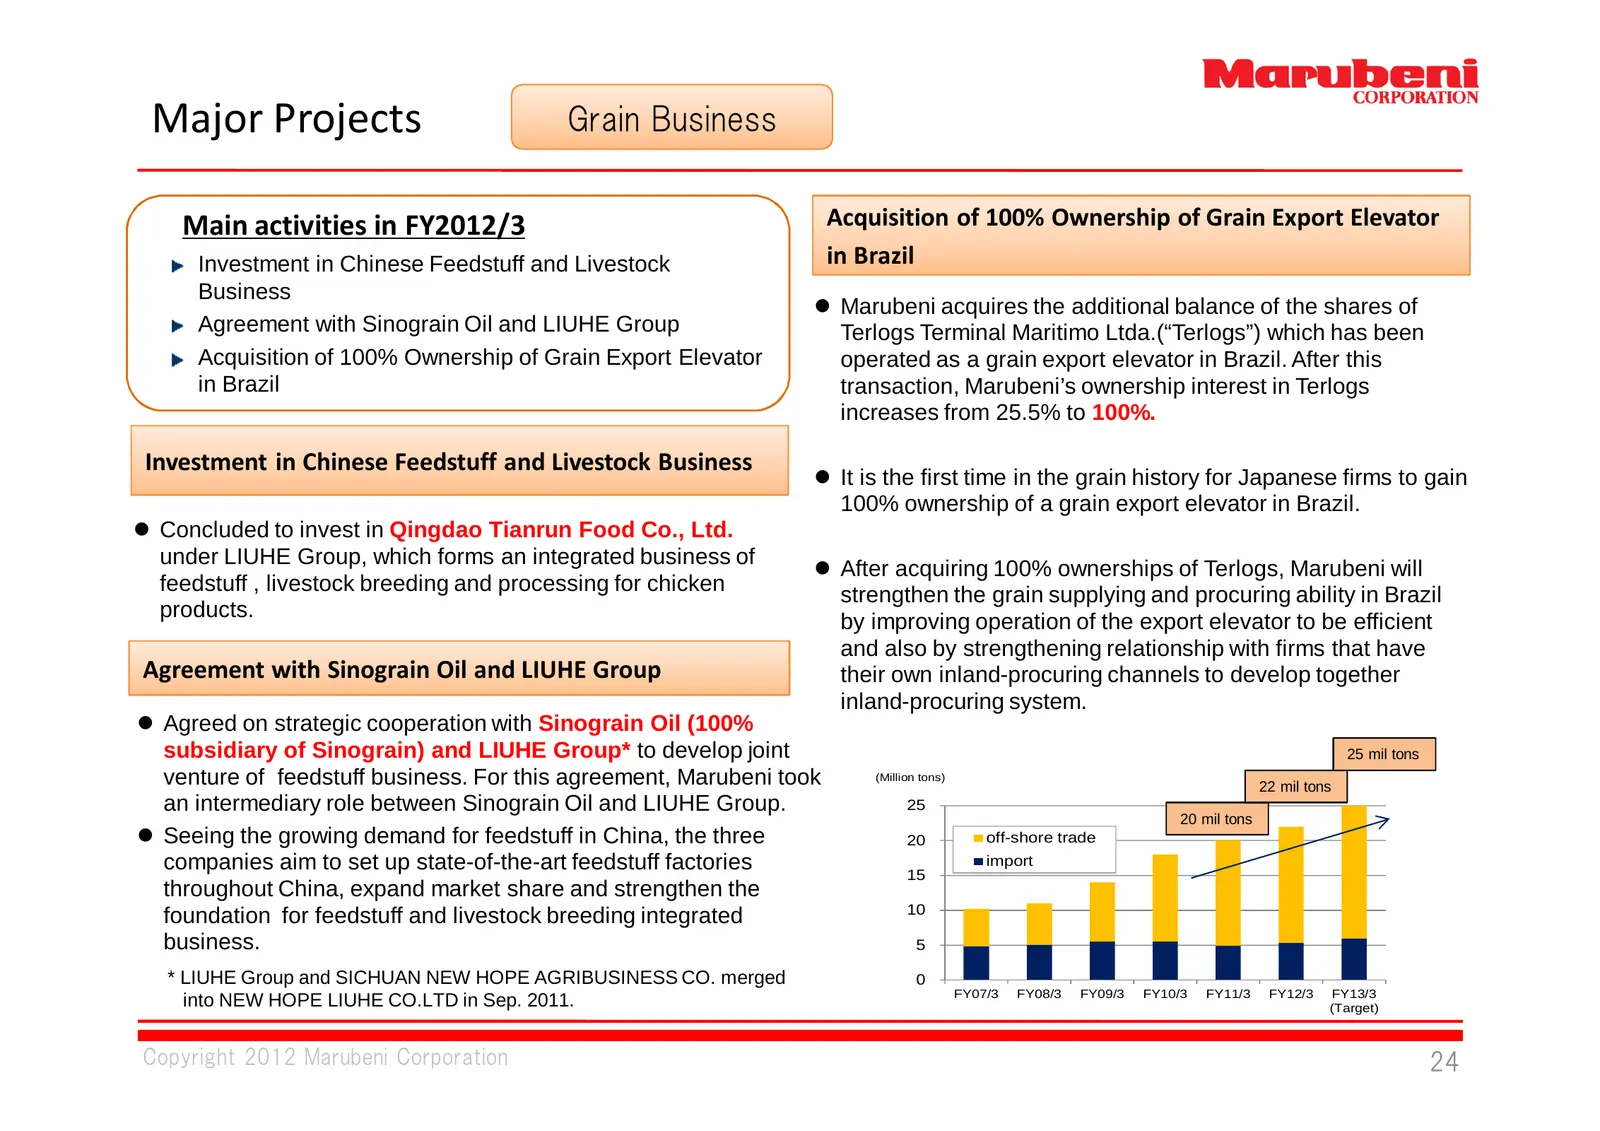
Major Projects Grain Business Main activities in FY2012/3 Acquisition of 100% Ownership of Grain Export Elevator Investment in Chinese Feedstuff and Livestock in Brazil Business Marubeni acquires the additional balance of the shares of Agreement with Sinograin Oil and LIUHE Group Terlogs Terminal
Slide 26: Prospects for FY2013/3
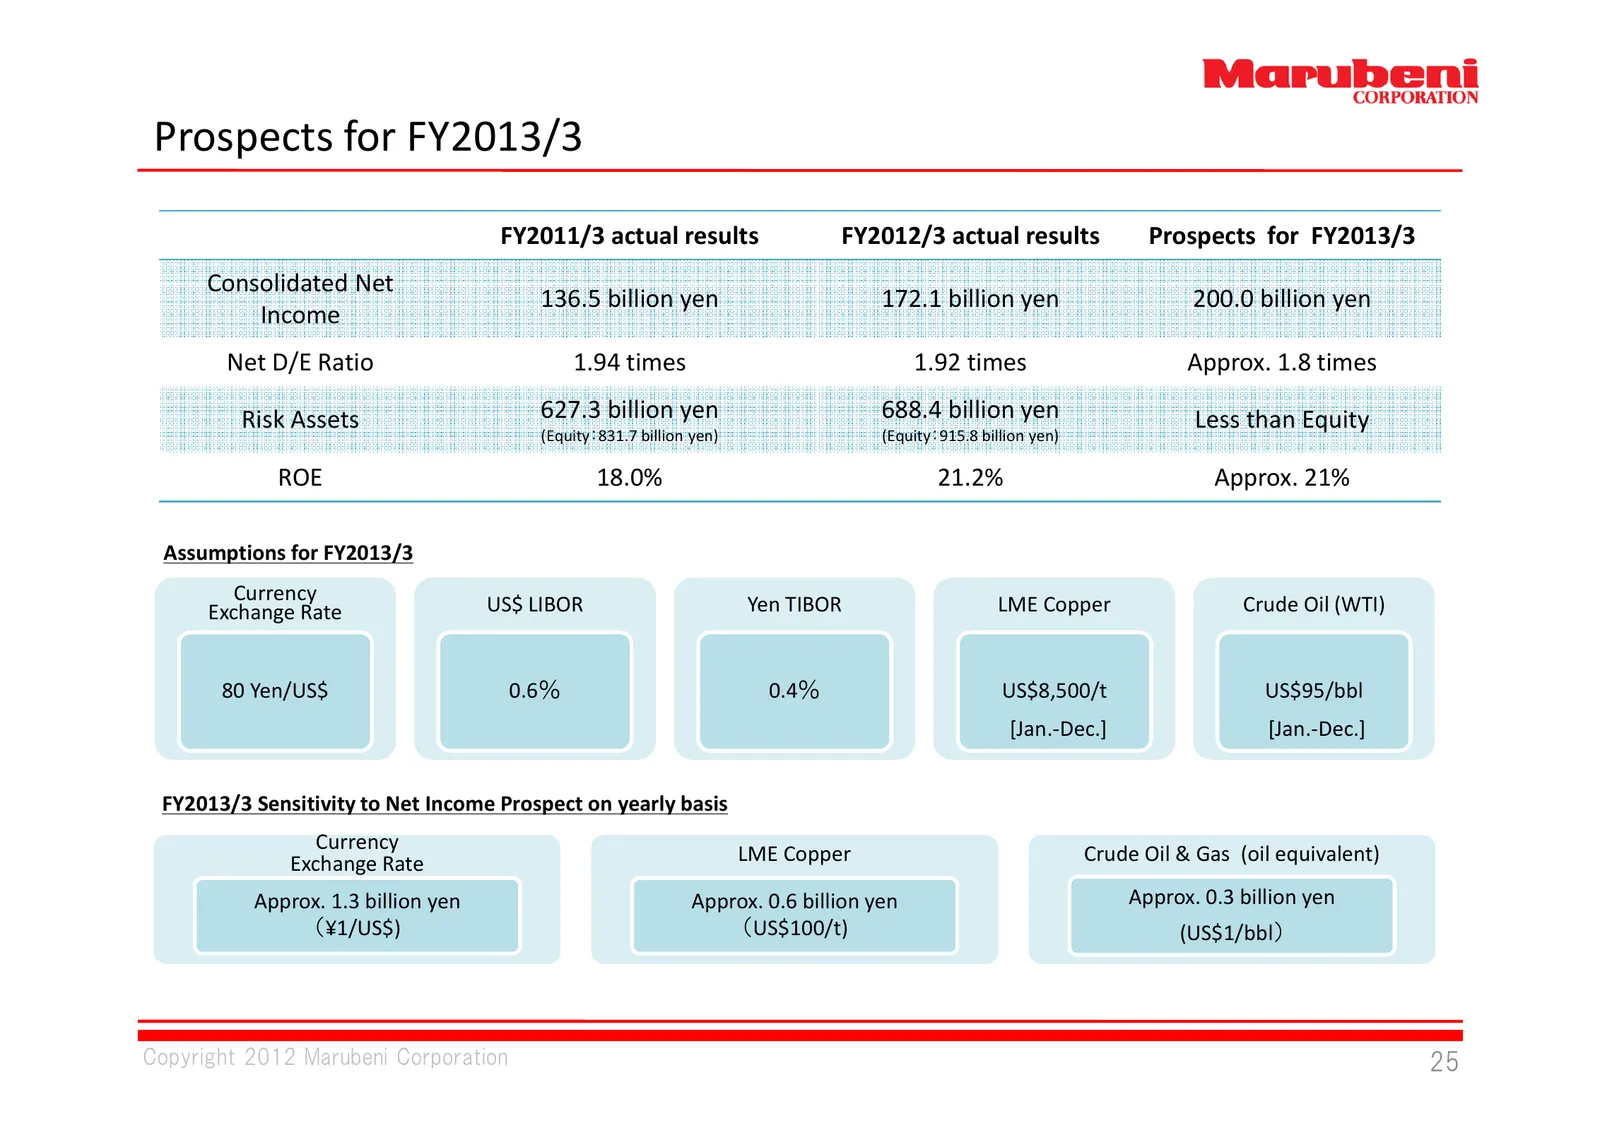
Prospects for FY2013/3 FY2011/3 actual results FY2012/3 actual results Prospects for FY2013/3 Consolidated Net 136.5 billion yen 172.1 billion yen 200.0 billion yen Income Net D/E Ratio 1.94 times 1.92 times Approx. 1.8 times Risk Assets 627.3 billion yen 688.4 billion yen Less than Equity (Equity:8
Slide 27: Net Income and Resource Ratio
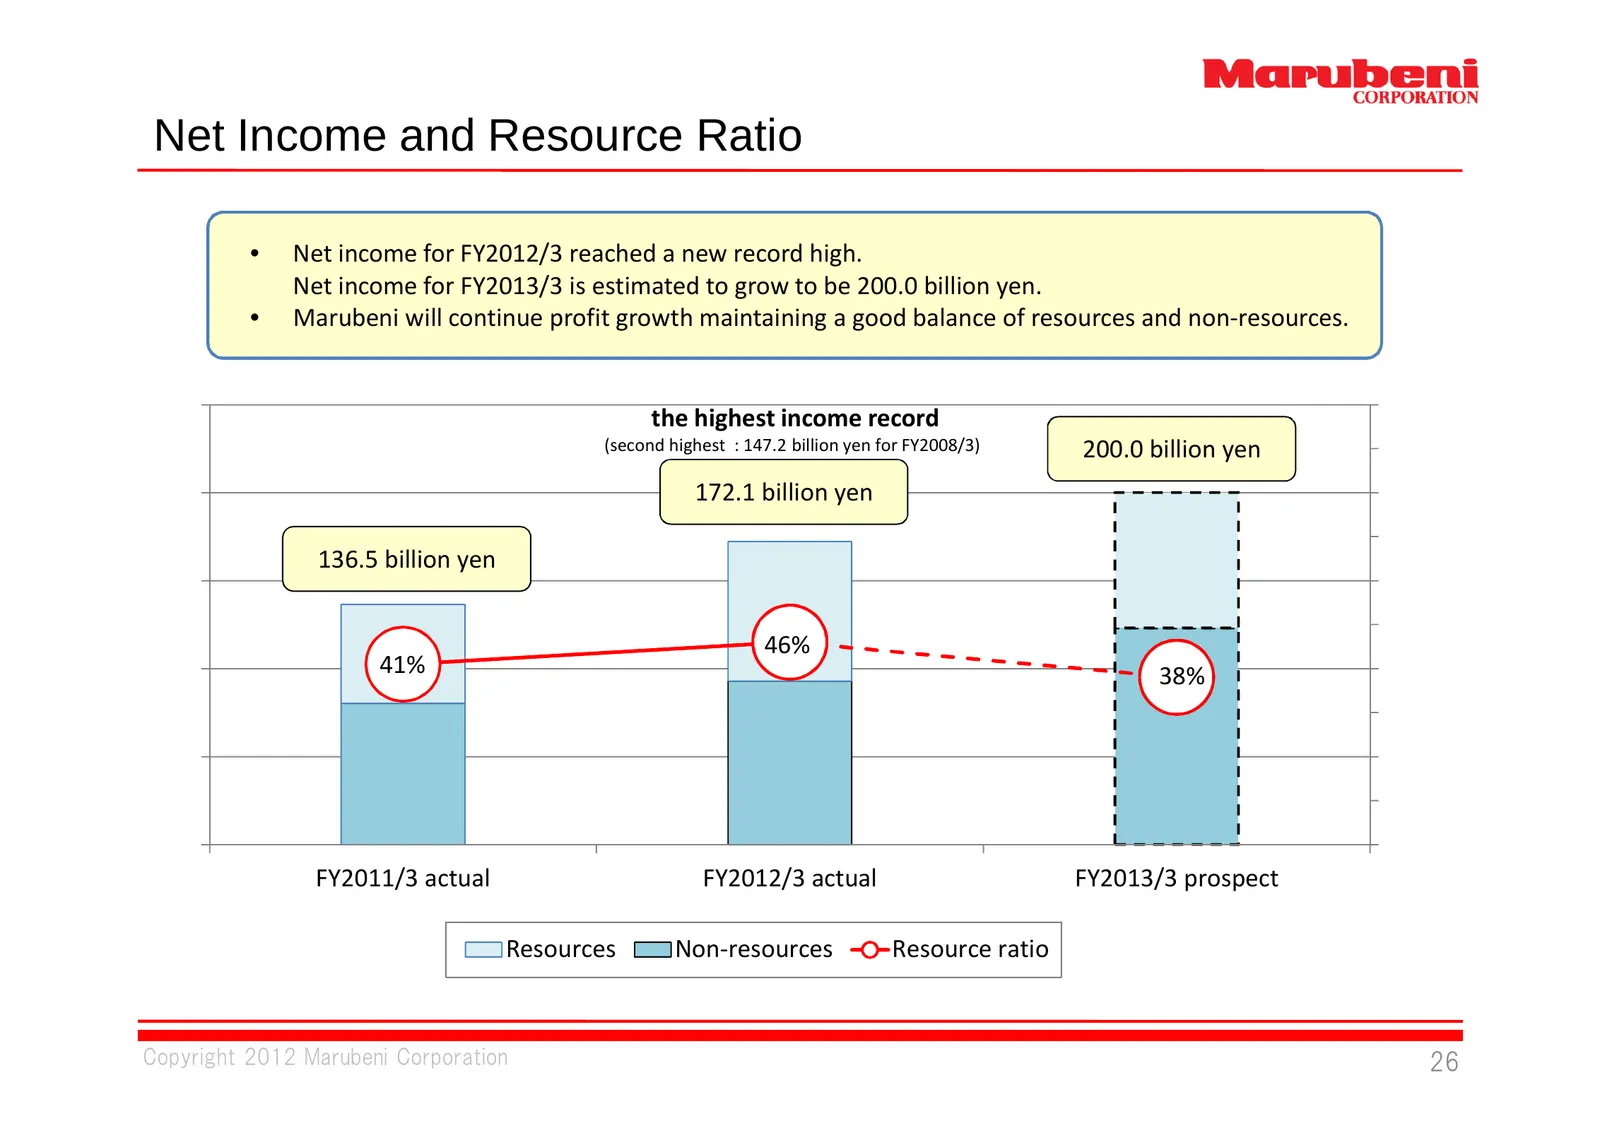
Net Income and Resource Ratio • Net income for FY2012/3 reached a new record high. Net income for FY2013/3 is estimated to grow to be 200.0 billion yen. • Marubeni will continue profit growth maintaining a good balance of resources and non‐resources. the highest income record (second highest : 147.2
Slide 28: Prospects of Net Income by Operating Segment for FY2013/3
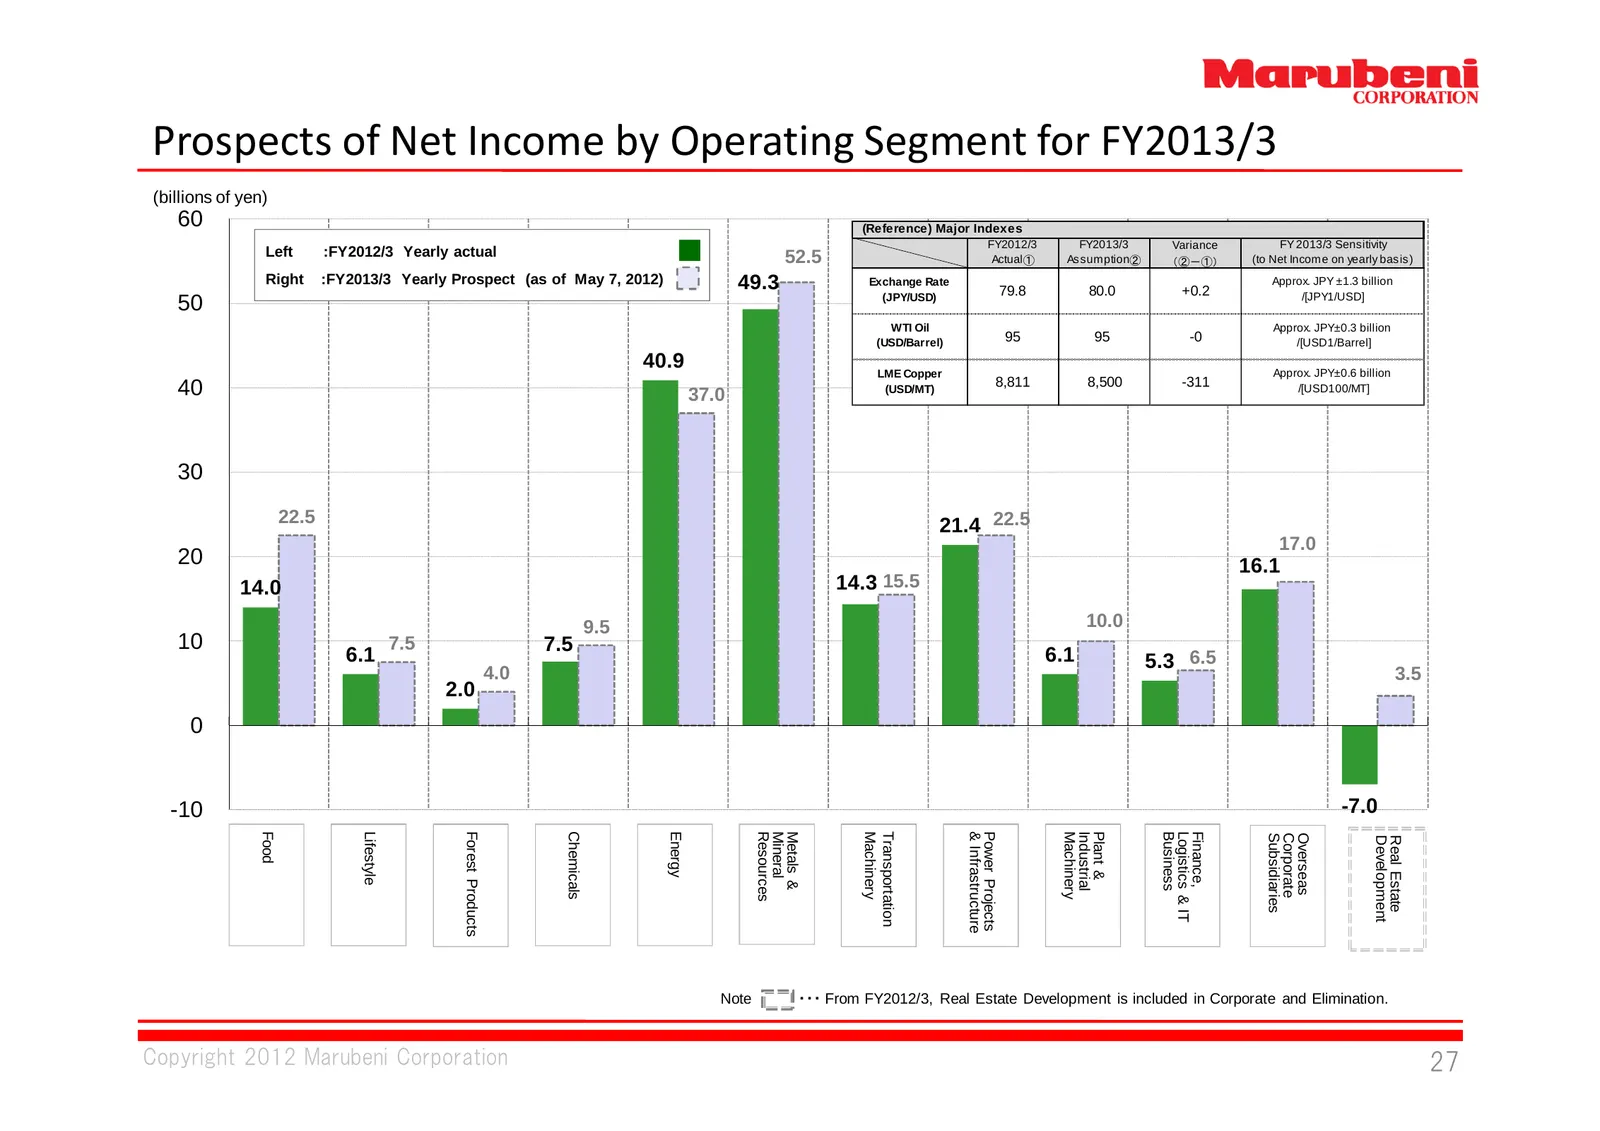
Prospects of Net Income by Operating Segment for FY2013/3 (billions of yen) 60 (Reference) Major Indexes FY2012/3 FY2013/3 Variance FY 2013/3 Sensitivity Left :FY2012/3 Yearly actual 52.5 Actual ① Assumption② (to Net Income on yearly basis) (②-①) Right :FY2013/3 Yearly Prospect (as of May 7, 2012) 4
Slide 29: Disclaimer Regarding Forward-Looking Statements
DISCLAIMER REGARDING FORWARD-LOOKING STATEMENTS THIS DOCUMENT CONTAINS FORWARD-LOOKING STATEMENTS ABOUT THE PERFORMANCE OF MARUBENI AND ITS GROUP COMPANIES, BASED ON MANAGEMENT'S ASSUMPTIONS IN LIGHT OF CURRENT INFORMATION. THE FOLLOWING FACTORS MAY THEREFORE INFLUENCE ACTUAL RESULTS. THESE FACTORS
Source: Internet Archive copy of marubeni.com
More decks from Marubeni Corporation
 Investor Day (September 2026)64 slides · Sep 9, 2026
 Investor Presentation (June 2026)13 slides · June 2026
 ESG Presentation (December 2019)14 slides · Dec 5, 2019
 FY2013 Earnings Presentation36 slides · May 13, 2013
 Q3 FY2012/3 Earnings Presentation21 slides · Feb 2, 2012
 FY2010 Earnings Presentation32 slides · May 9, 2011