Sysmex Corporation · TSE:6869
Sysmex — FY2006 Earnings Presentation
41 slides from Sysmex's earnings presentation, May 2007
Slide 1: Business Results FY2006
A Unique & Global Healthcare Testing Company Business Results FY2006 Financial Highlights and Mid-term Plan Hisashi Ietsugu President and CEO
Slide 2: New Corporate Philosophy
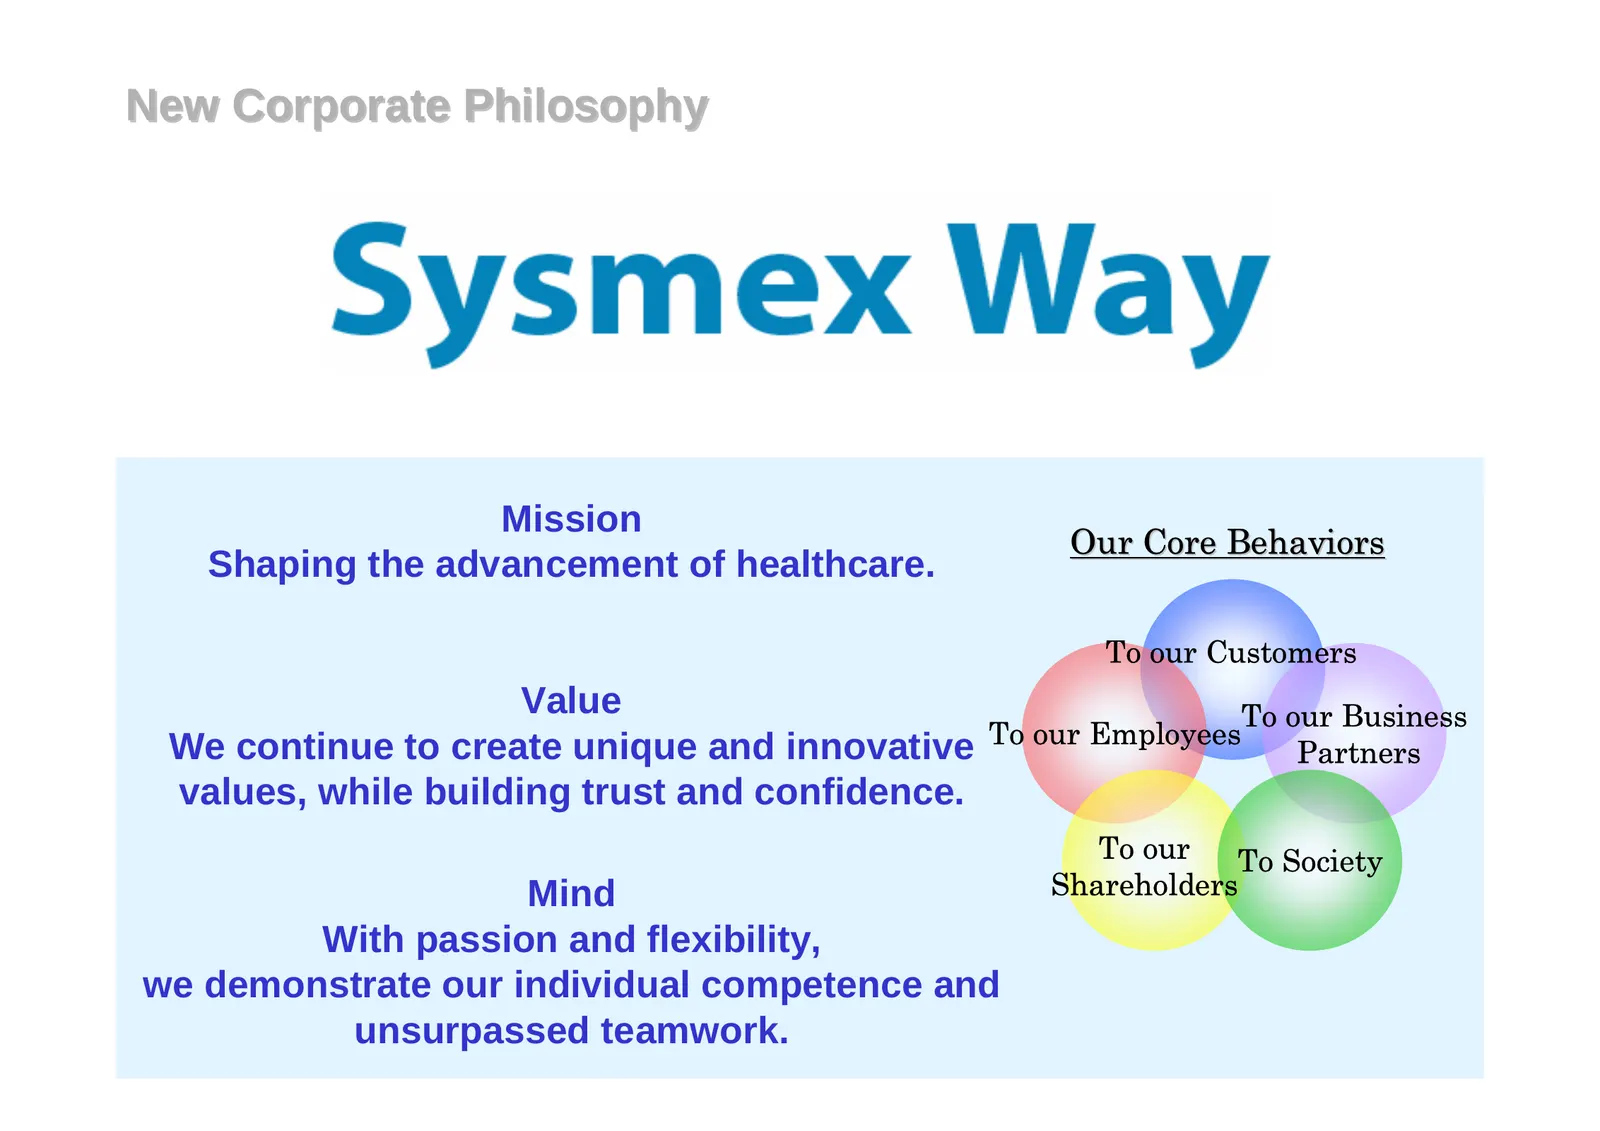
New Corporate Philosophy Mission Our Core Behaviors Shaping the advancement of healthcare. To our Customers Value To our Business We continue to create unique and innovative To our Employees Partners values, while building trust and confidence. To our To Society Mind Shareholders With passion and fl
Slide 3: Our Core Behaviors
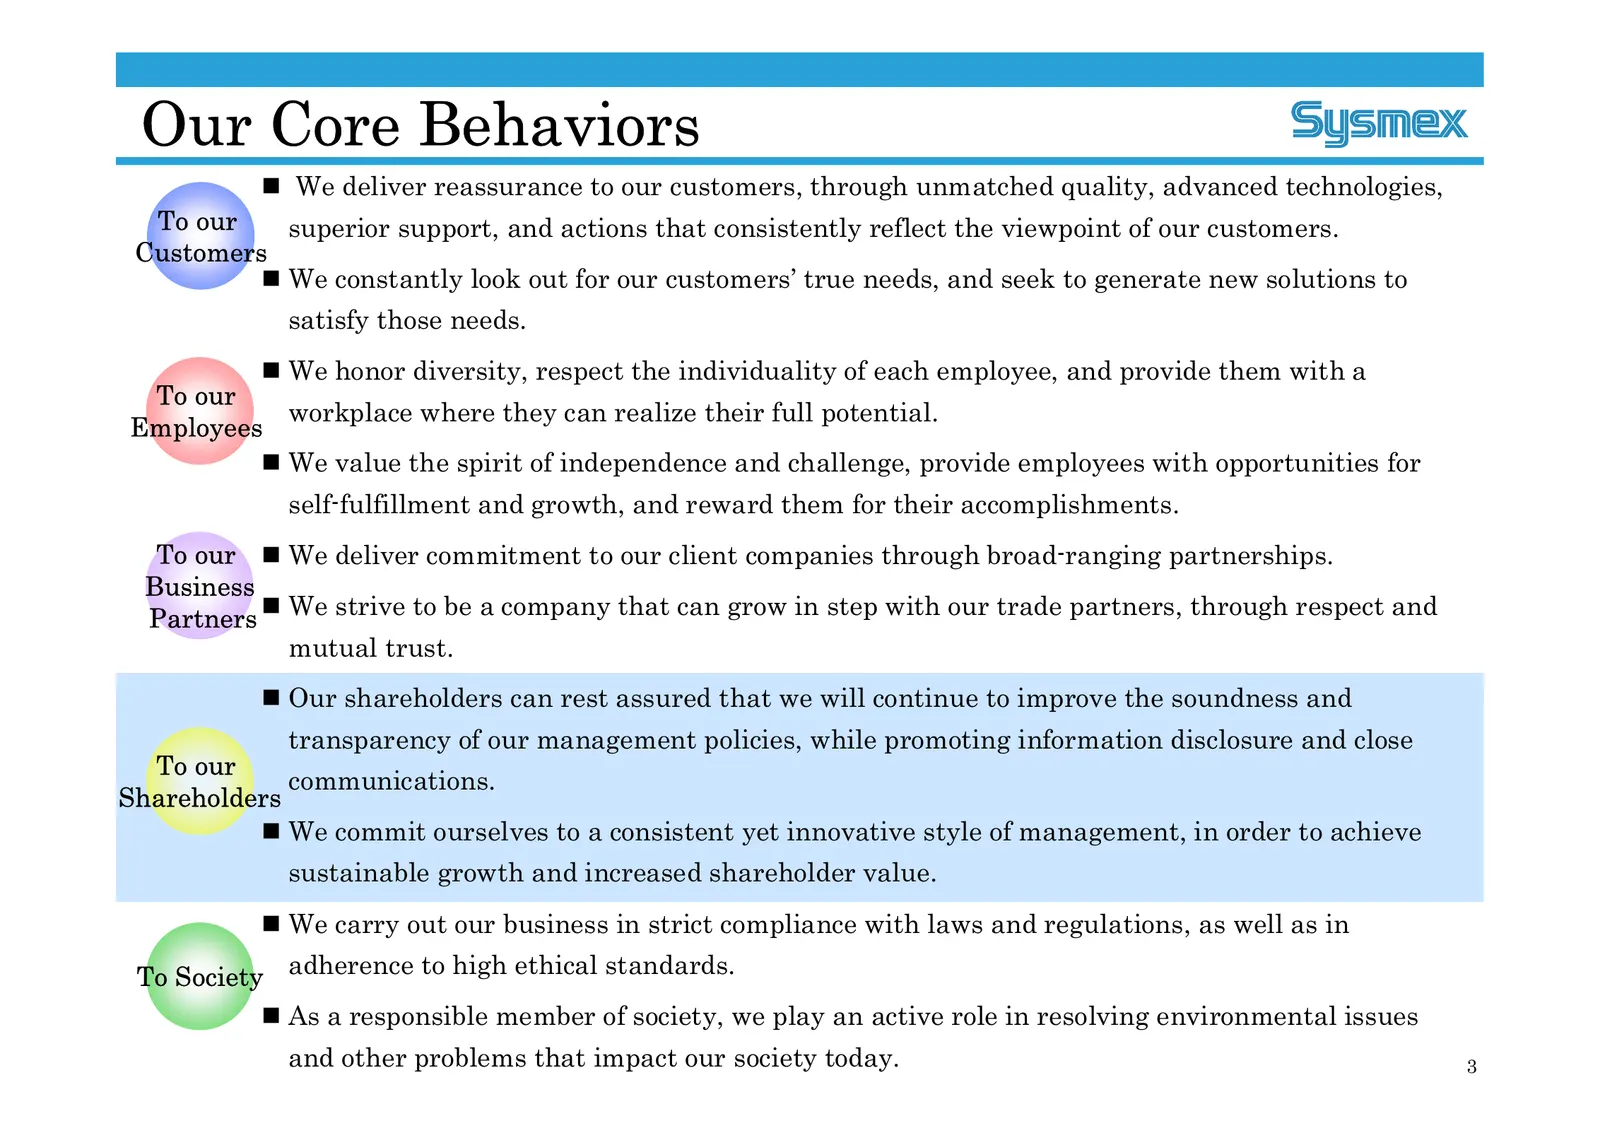
Our Core Behaviors We deliver reassurance to our customers, through unmatched quality, advanced technologies, To our superior support, and actions that consistently reflect the viewpoint of our customers. Customers We constantly look out for our customers’ true needs, and seek to generate new so
Slide 4: Contents
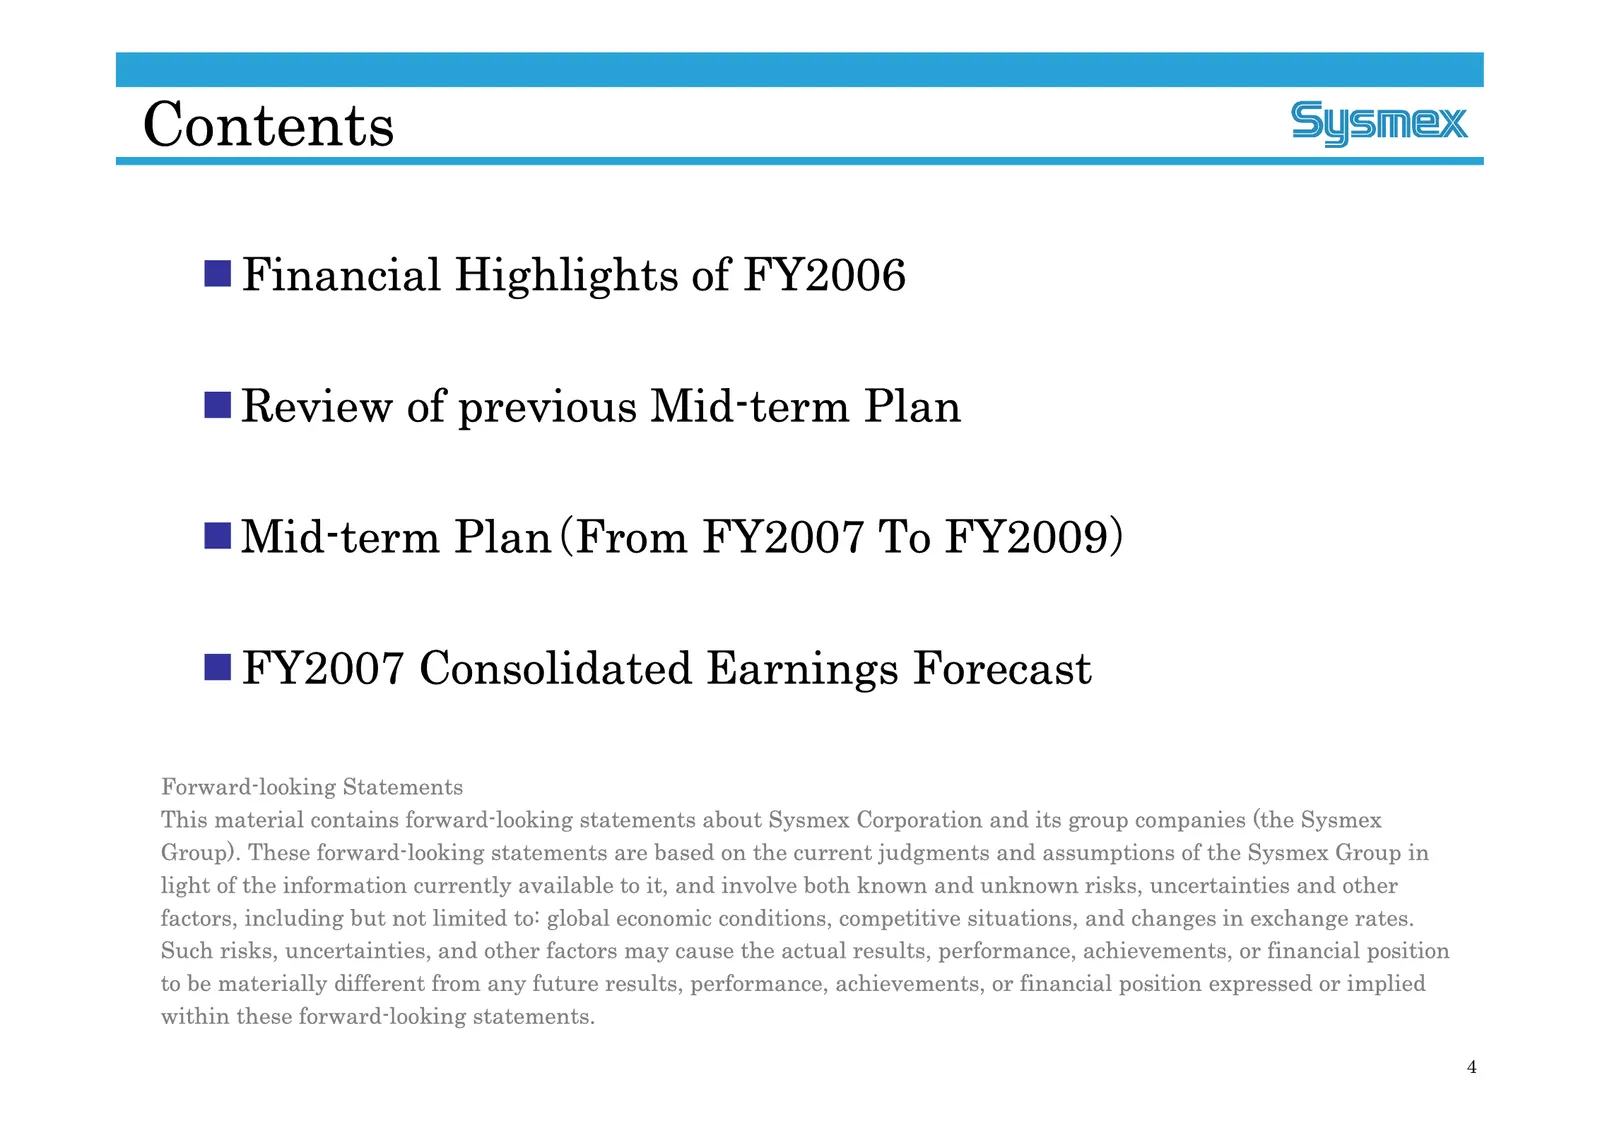
Contents Financial Highlights of FY2006 Review of previous Mid-term Plan Mid-term Plan(From FY2007 To FY2009) FY2007 Consolidated Earnings Forecast Forward-looking Statements This material contains forward-looking statements about Sysmex Corporation and its group companies (the Sysmex Group)
Slide 5: Financial Highlights of FY2006
Financial Highlights of FY2006 •Financial Highlights •Breakdown of Net Sales and Ordinary Income •Breakdown of Balance Sheet •Consolidated Cash Flow •Geographic Segment Information •Projected Dividend for FY2006 •Dividend Policy A Unique & Global Healthcare Testing Company
Slide 6: Financial Highlights
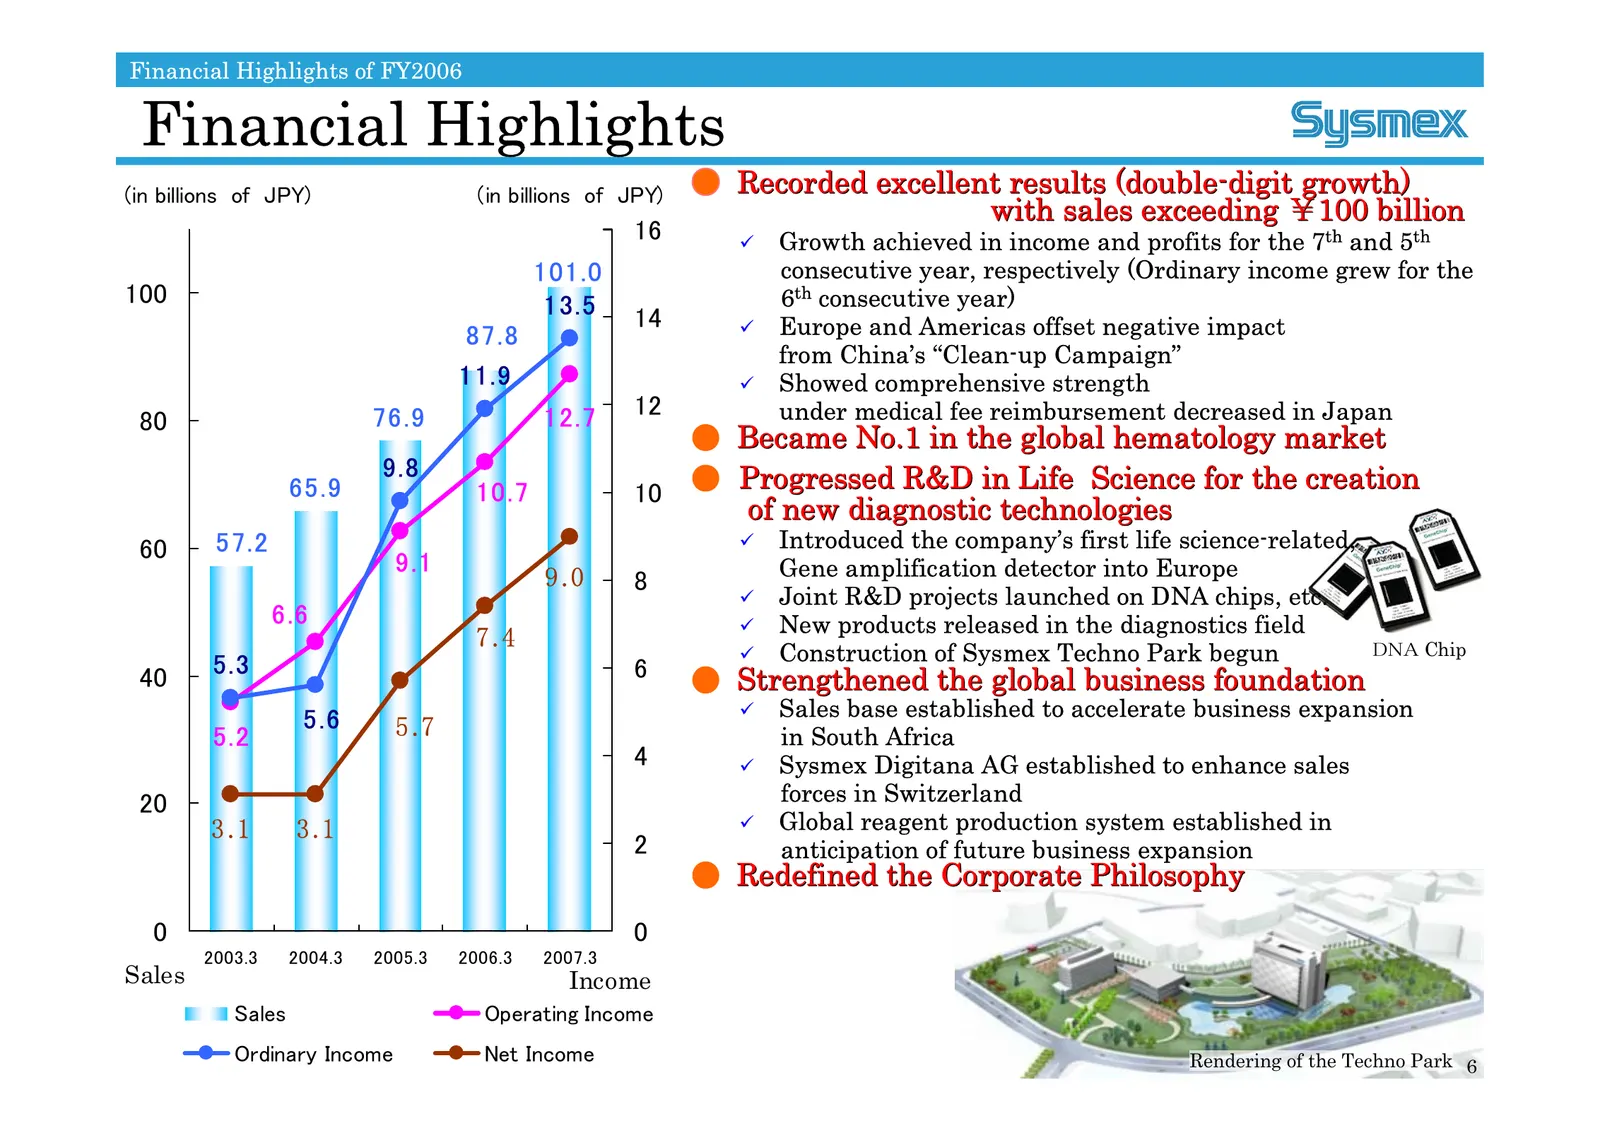
Financial Highlights of FY2006 Financial Highlights (in billions of JPY) (in billions of JPY) Recorded excellent results (double- (double-digit growth) growth) with sales exceeding ¥100 billion 16 9 Growth achieved in income and profits for the 7th and 5th 101.0 consecutive year, respectively (Ordin
Slide 7: Breakdown of Net Sales and Ordinary Income
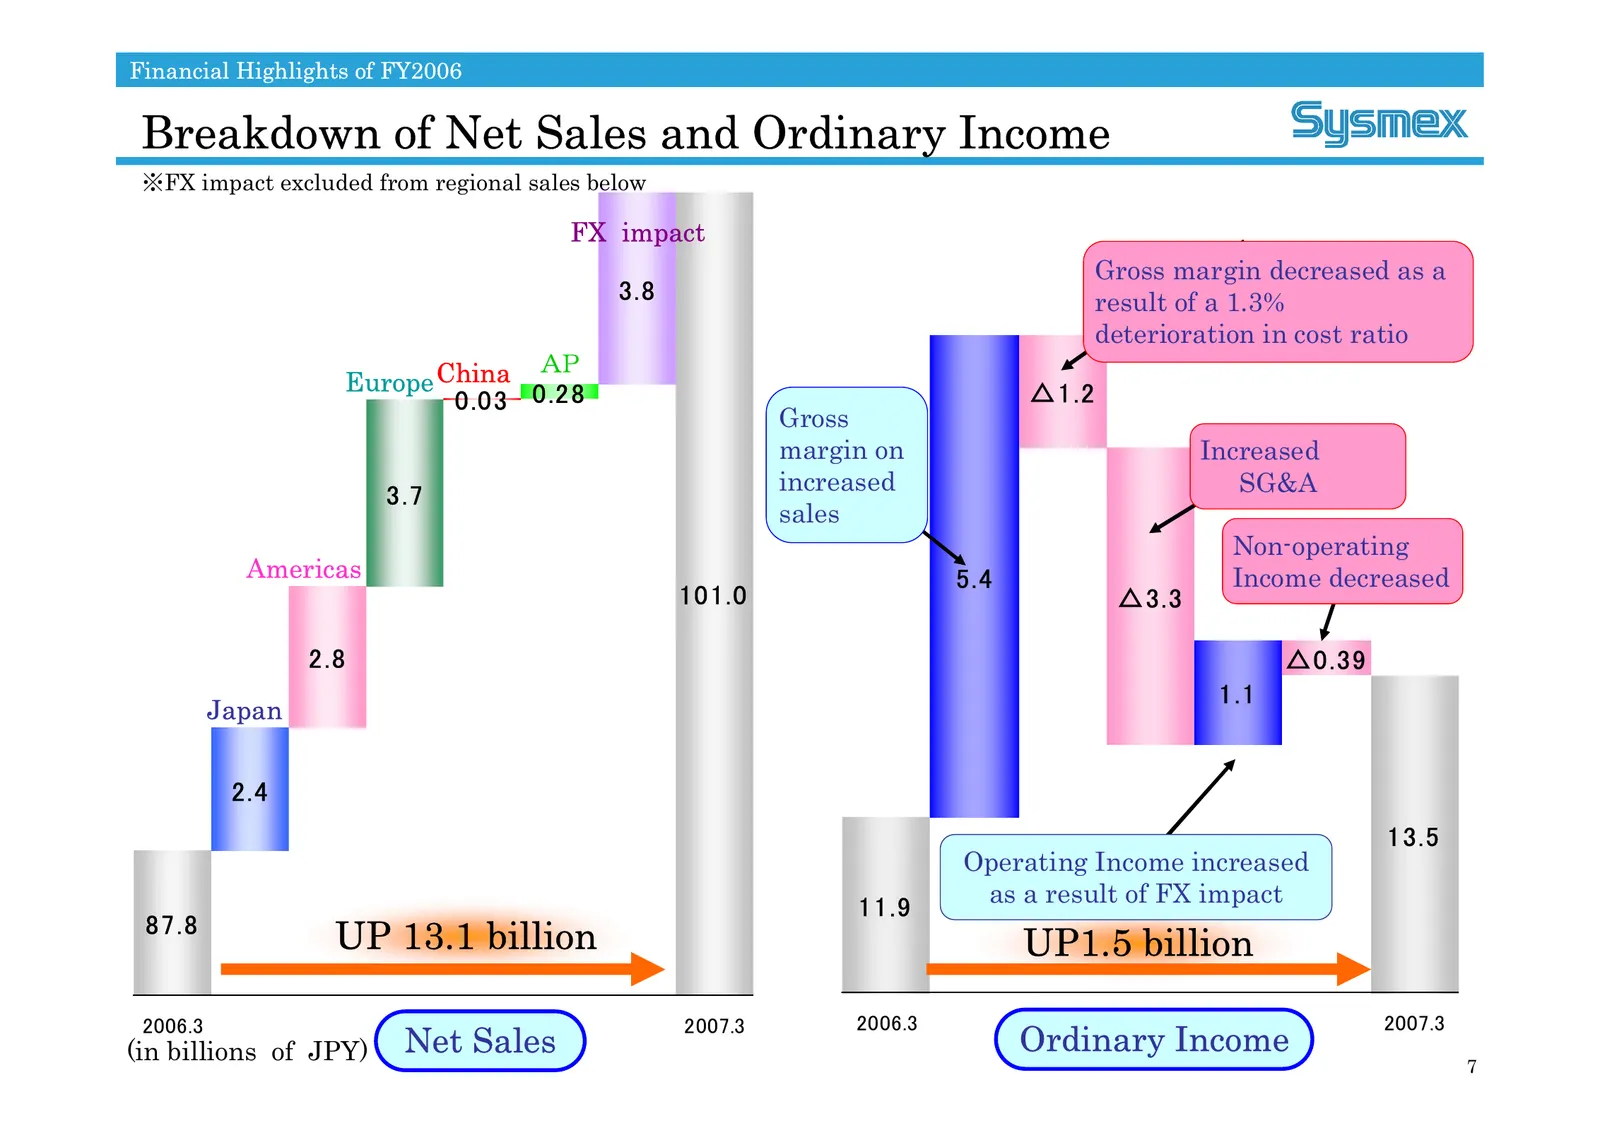
Financial Highlights of FY2006 Breakdown of Net Sales and Ordinary Income ※FX impact excluded from regional sales below FX impact Gross margin decreased as a 3.8 result of a 1.3% deterioration in cost ratio AP Europe China 0.28 △1.2 0.03 Gross margin on Increased increased SG&A 3.7 sales Non-operati
Slide 8: Breakdown of Balance Sheet
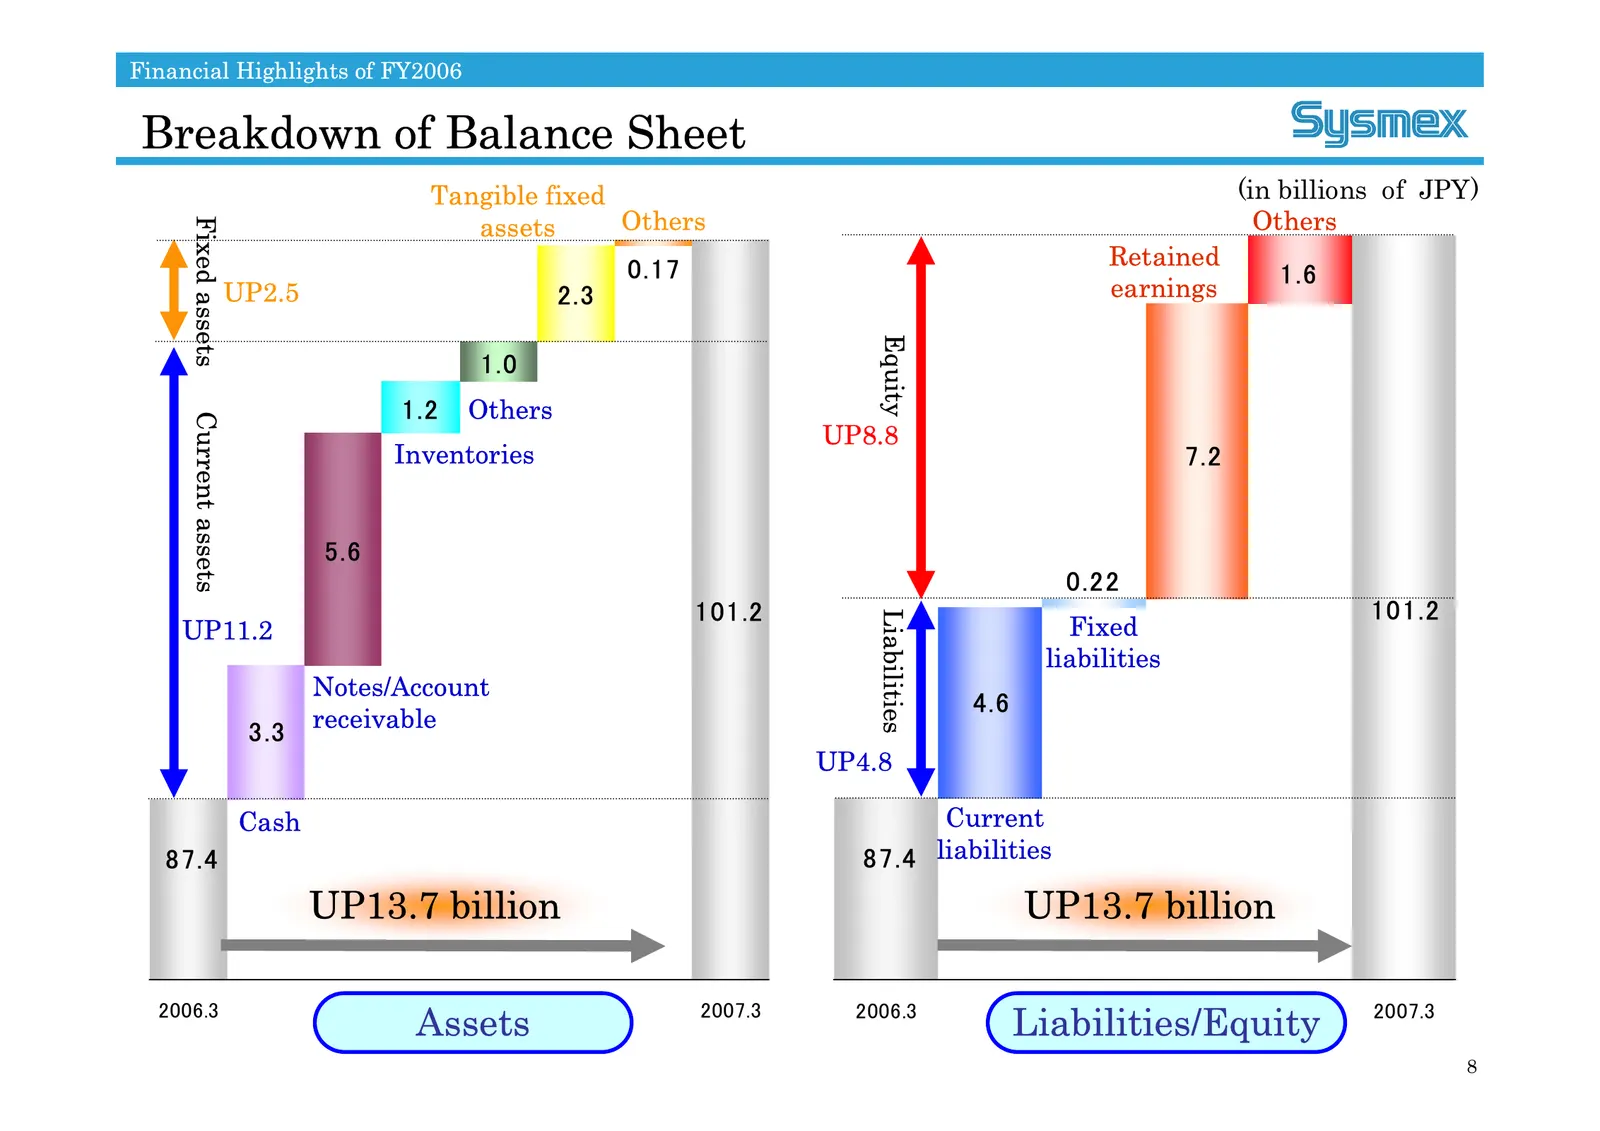
Financial Highlights of FY2006 Breakdown of Balance Sheet Tangible fixed (in billions of JPY) assets Others Others Fixed assets 0.17 Retained earnings 1.6 UP2.5 2.3 Equity 1.0 1.2 Others Current assets UP8.8 Inventories 7.2 5.6 0.22 101.2 101.2 Liabilities UP11.2 Fixed liabilities Notes/Account 4.6
Slide 9: Consolidated Cash Flow
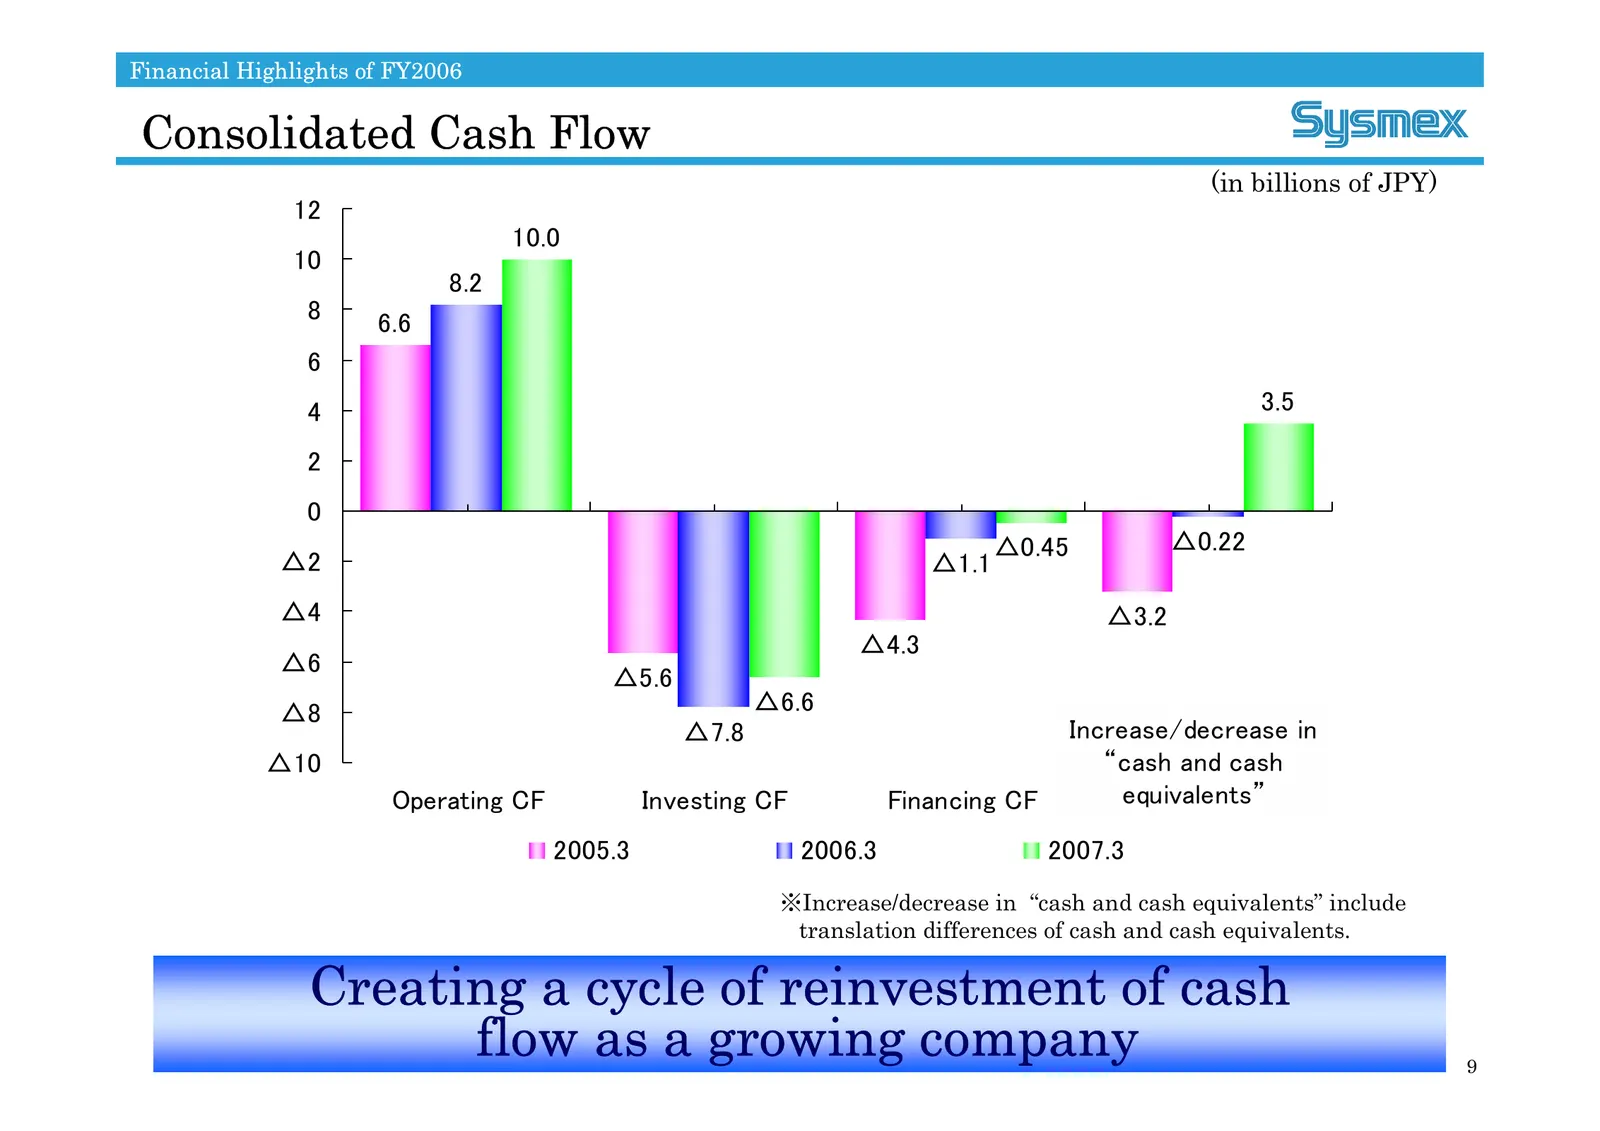
Financial Highlights of FY2006 Consolidated Cash Flow (in billions of JPY) 12 10.0 10 8.2 8 6.6 6 4 3.5 2 0 △0.45 △0.22 △2 △1.1 △4 △3.2 △4.3 △6 △5.6 △8 △6.6 △7.8 Increase/decrease in △10 “cash and cash Operating CF Investing CF Financing CF equivalents” 2005.3 2006.3 2007.3 ※Increase/decrease in “ca
Slide 10: Geographic Segment Information (Americas and Europe)
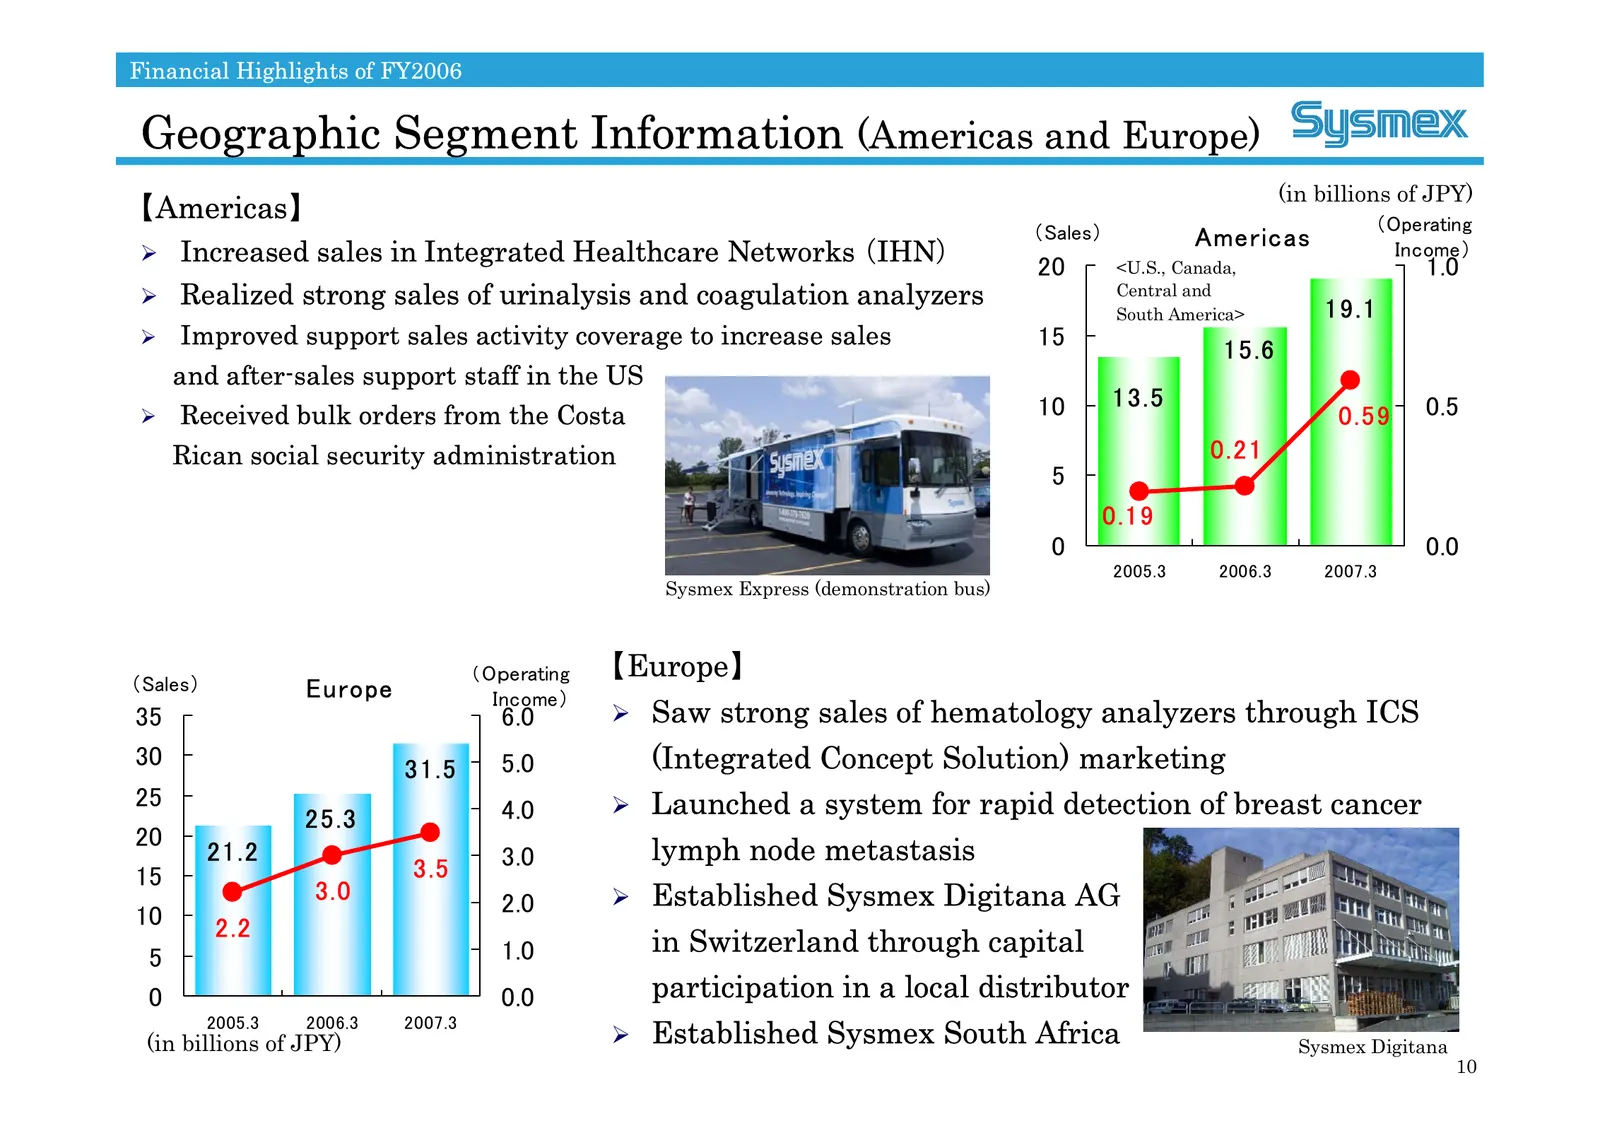
Financial Highlights of FY2006 Geographic Segment Information (Americas and Europe) (in billions of JPY) 【Americas】 (Operating (Sales) Americas ¾ Increased sales in Integrated Healthcare Networks (IHN) Income) 20 <U.S., Canada, 1.0 ¾ Realized strong sales of urinalysis and coagulation analyzers Cent
Slide 11: Geographic Segment Information (China and AP)
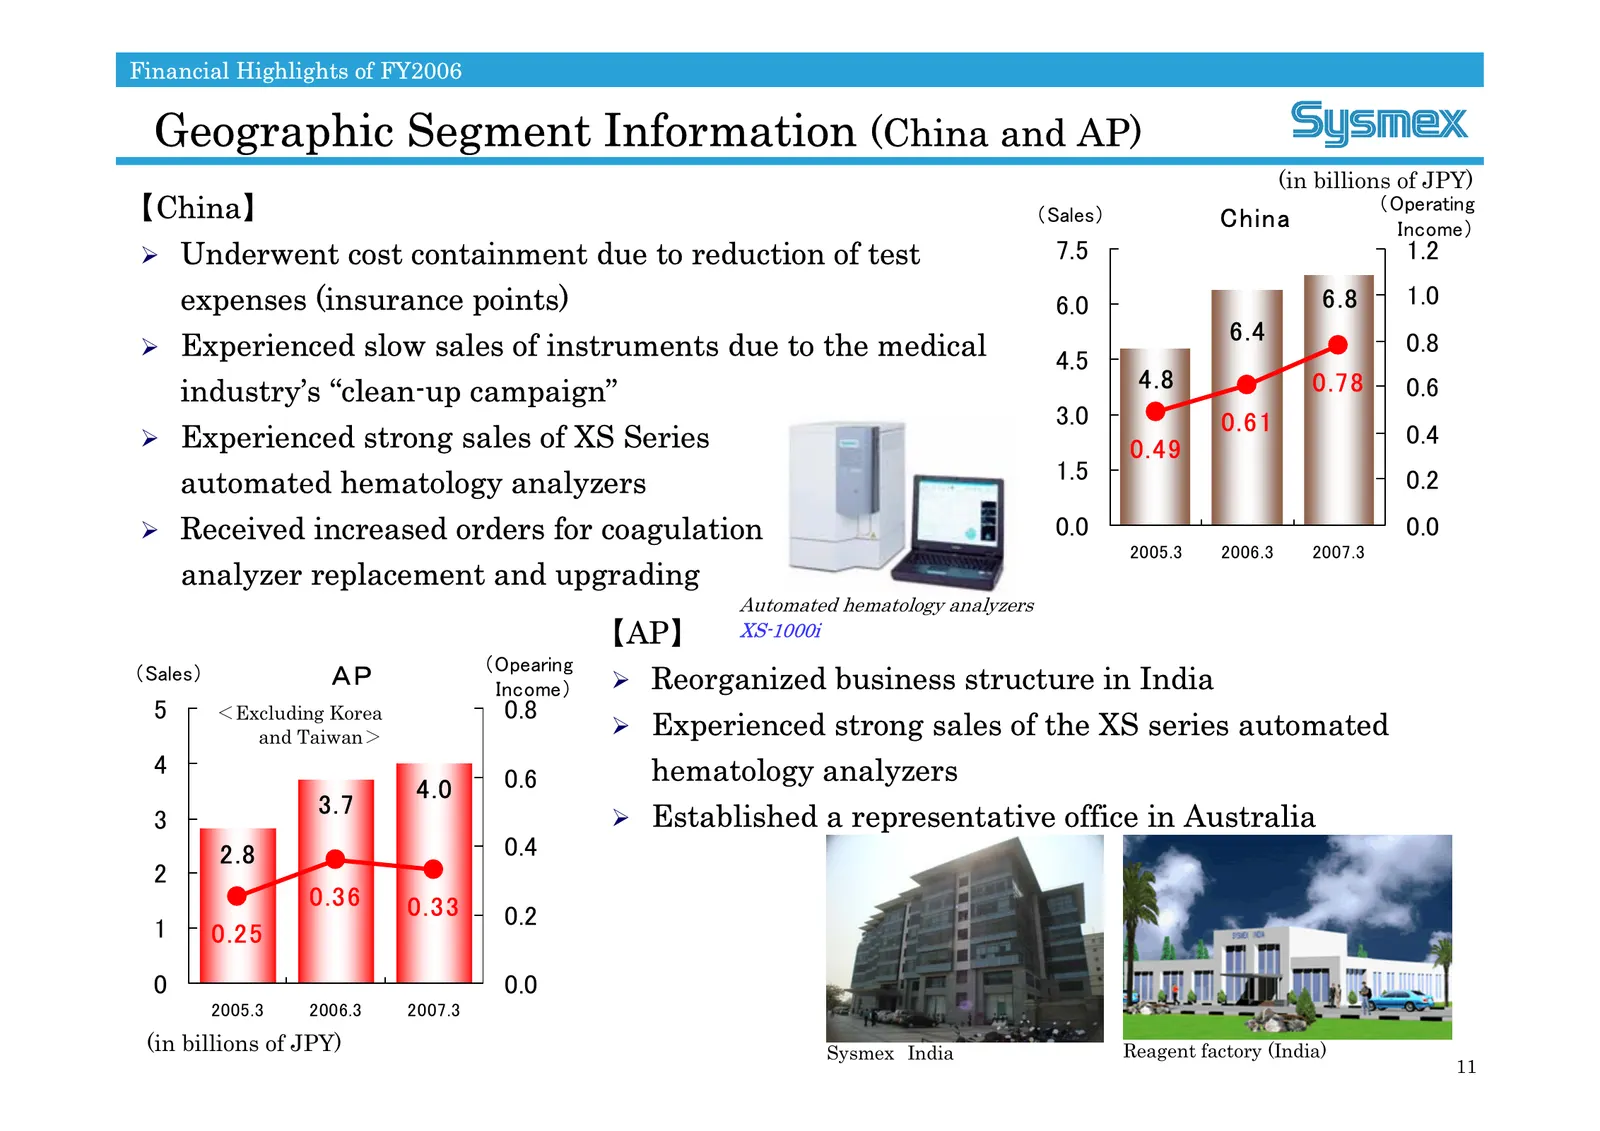
Financial Highlights of FY2006 Geographic Segment Information (China and AP) (in billions of JPY) 【China】 (Sales) China (Operating Income) ¾ Underwent cost containment due to reduction of test 7.5 1.2 expenses (insurance points) 6.0 6.8 1.0 6.4 ¾ Experienced slow sales of instruments due to the medi
Slide 12: Geographic Segment Information (Japan)
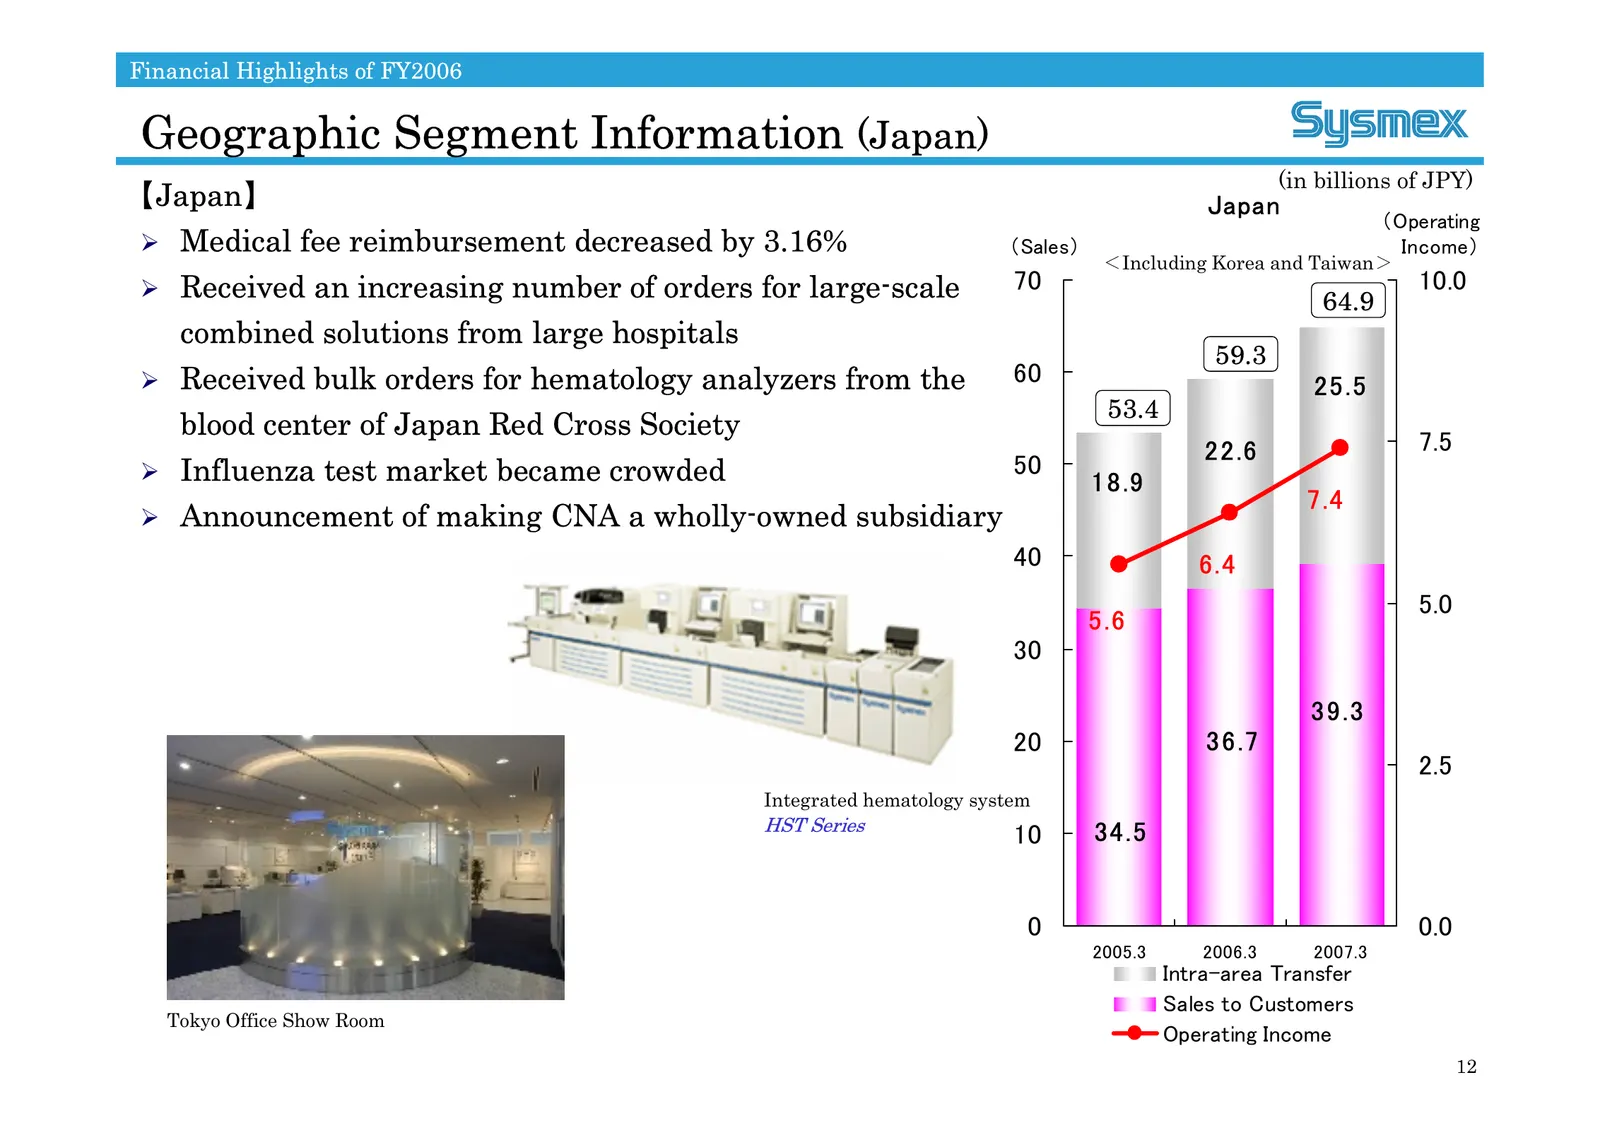
Financial Highlights of FY2006 Geographic Segment Information (Japan) (in billions of JPY) 【Japan】 Japan (Operating ¾ Medical fee reimbursement decreased by 3.16% (Sales) Income) <Including Korea and Taiwan> ¾ Received an increasing number of orders for large-scale 70 10.0 64.9 combined solutions fr
Slide 13: Projected Dividend for FY2006
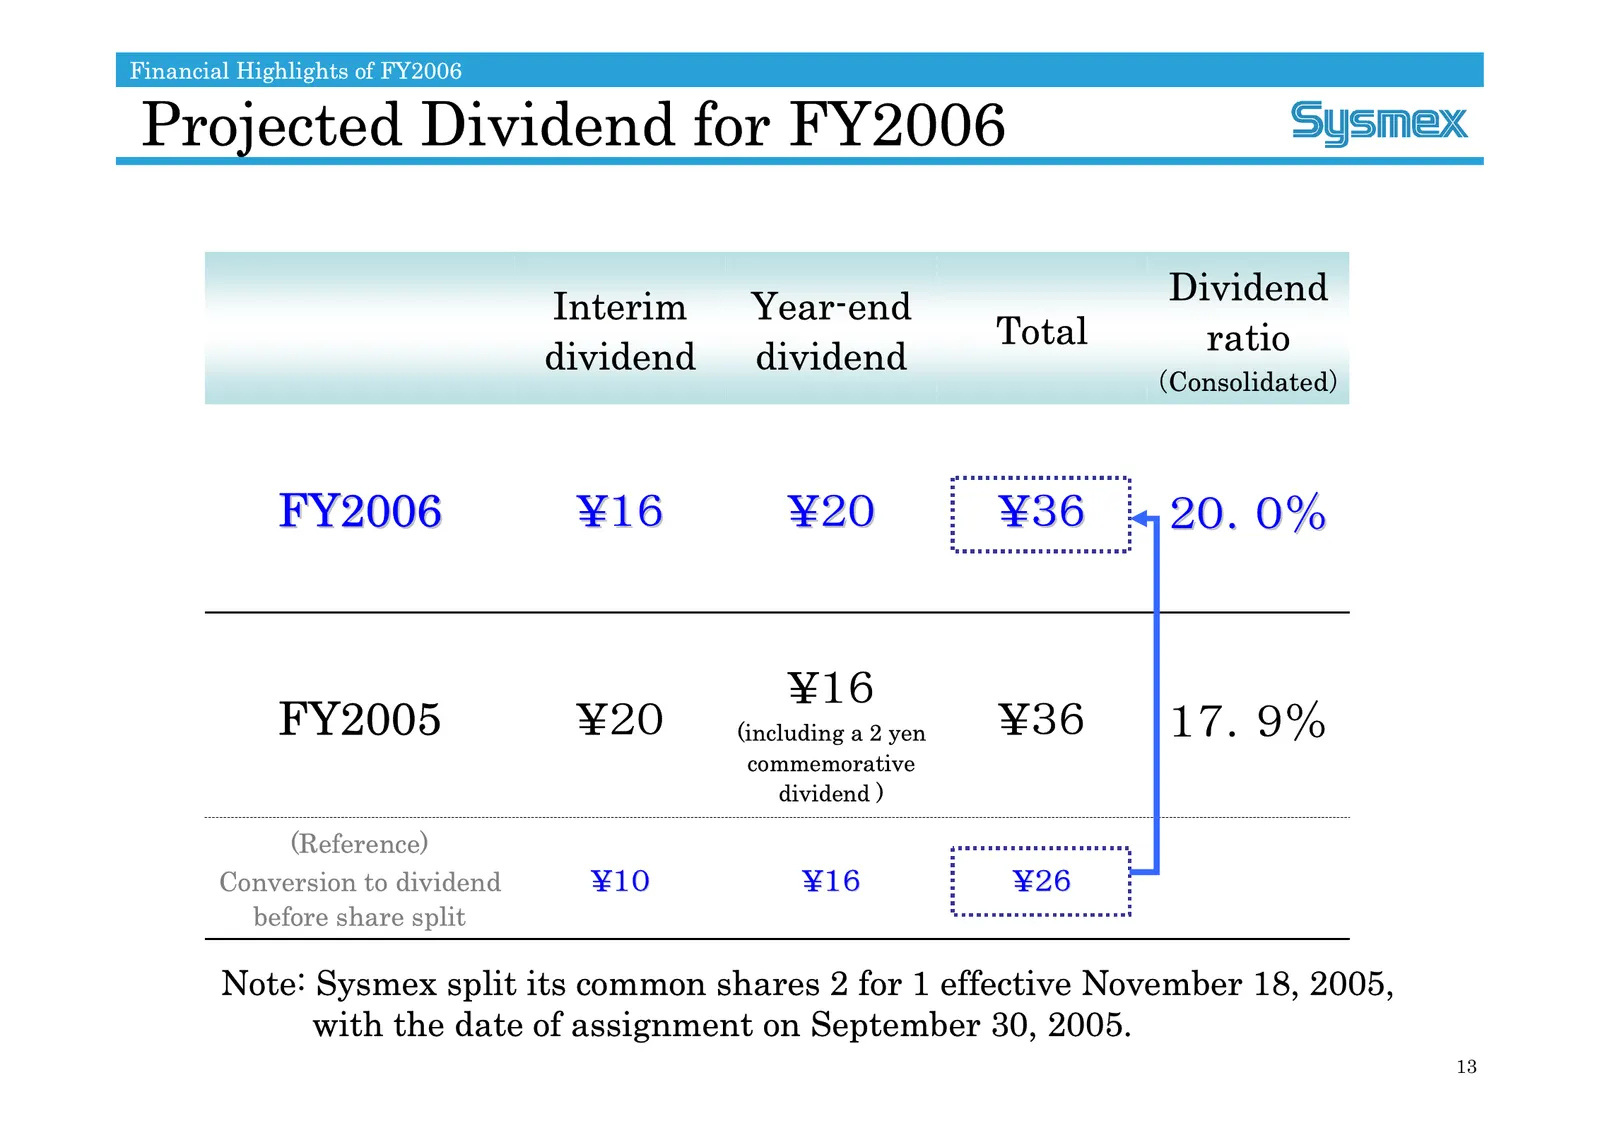
Financial Highlights of FY2006 Projected Dividend for FY2006 Dividend Interim Year-end Total ratio dividend dividend (Consolidated) FY2006 ¥16 ¥20 ¥36 20.0% ¥16 FY2005 ¥20 (including a 2 yen ¥36 17.9% commemorative dividend ) (Reference) Conversion to dividend ¥10 ¥16 ¥26 before share split Note: Sy
Slide 14: Dividend Policy
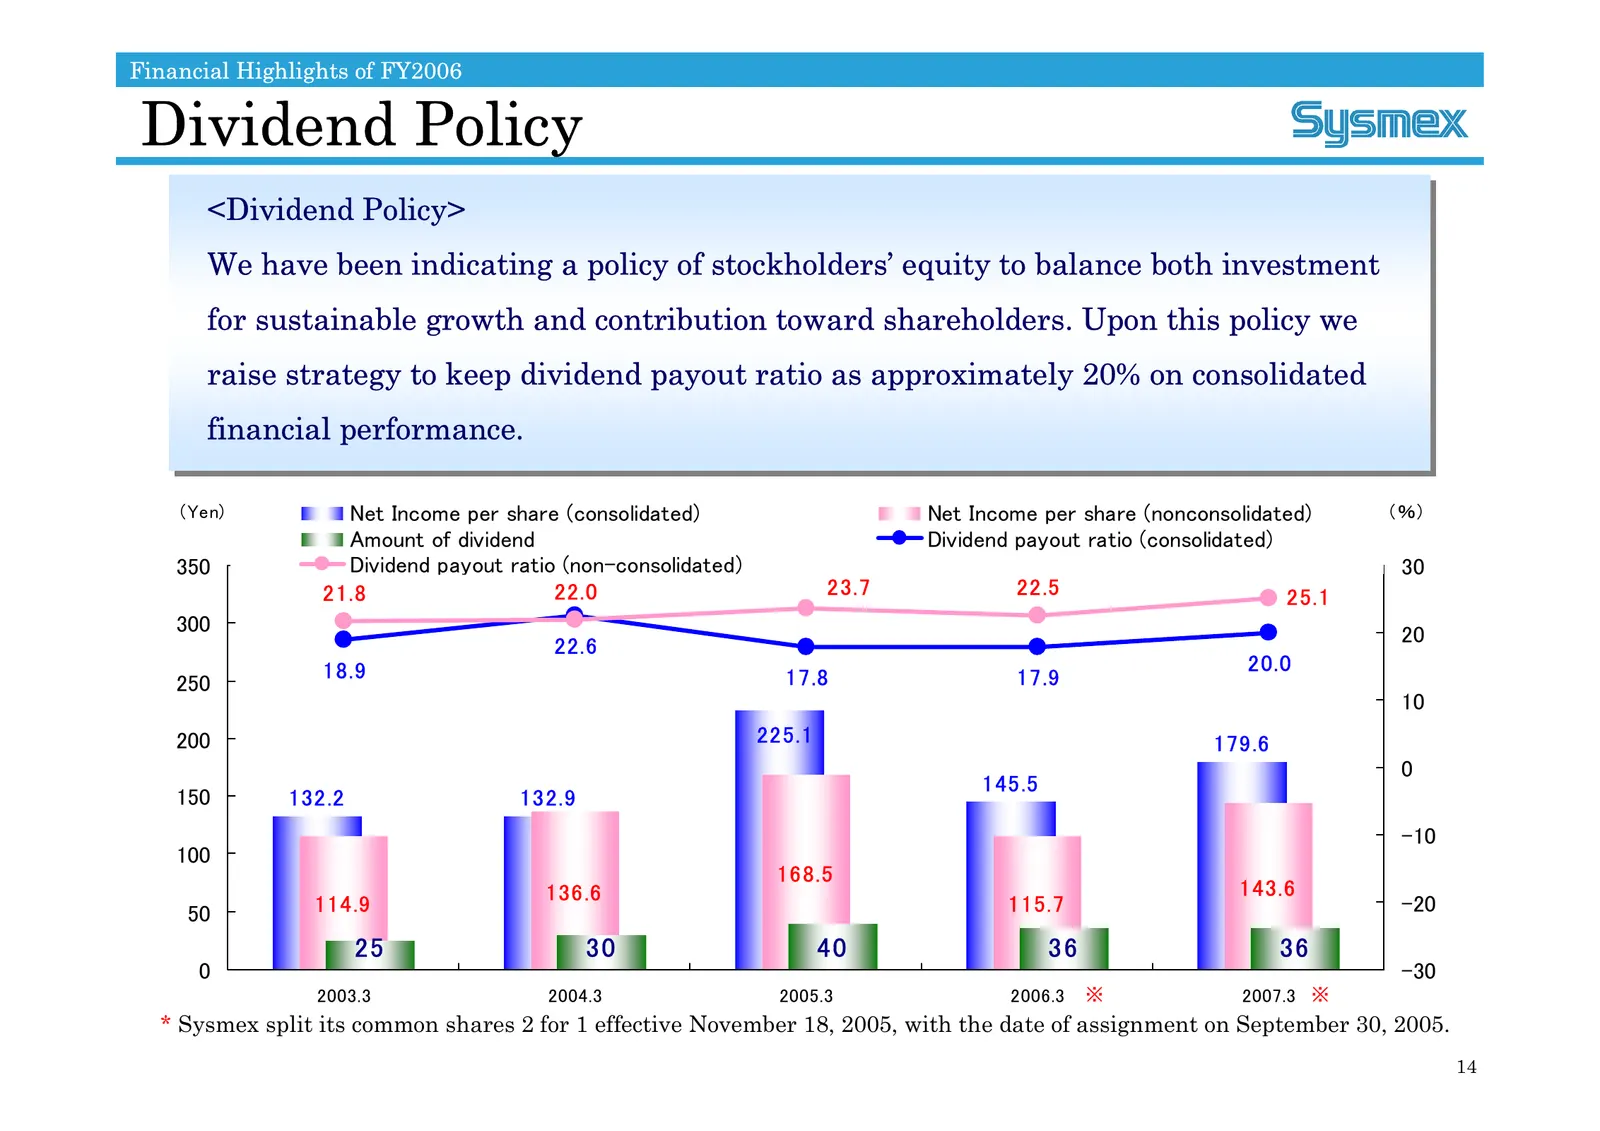
Financial Highlights of FY2006 Dividend Policy <Dividend <Dividend Policy> Policy> We We have have been been indicating indicating aa policy policy of of stockholders’ stockholders’ equity equity to to balance balance both both investment investment for for sustainable sustainable growth growth and
Slide 15: Review of previous Mid-term Plan
Review of previous Mid-term Plan (Announce on May, 2005) • Overview of Key objectives A Unique & Global Healthcare Testing Company
Slide 16: Overview of Key objectives
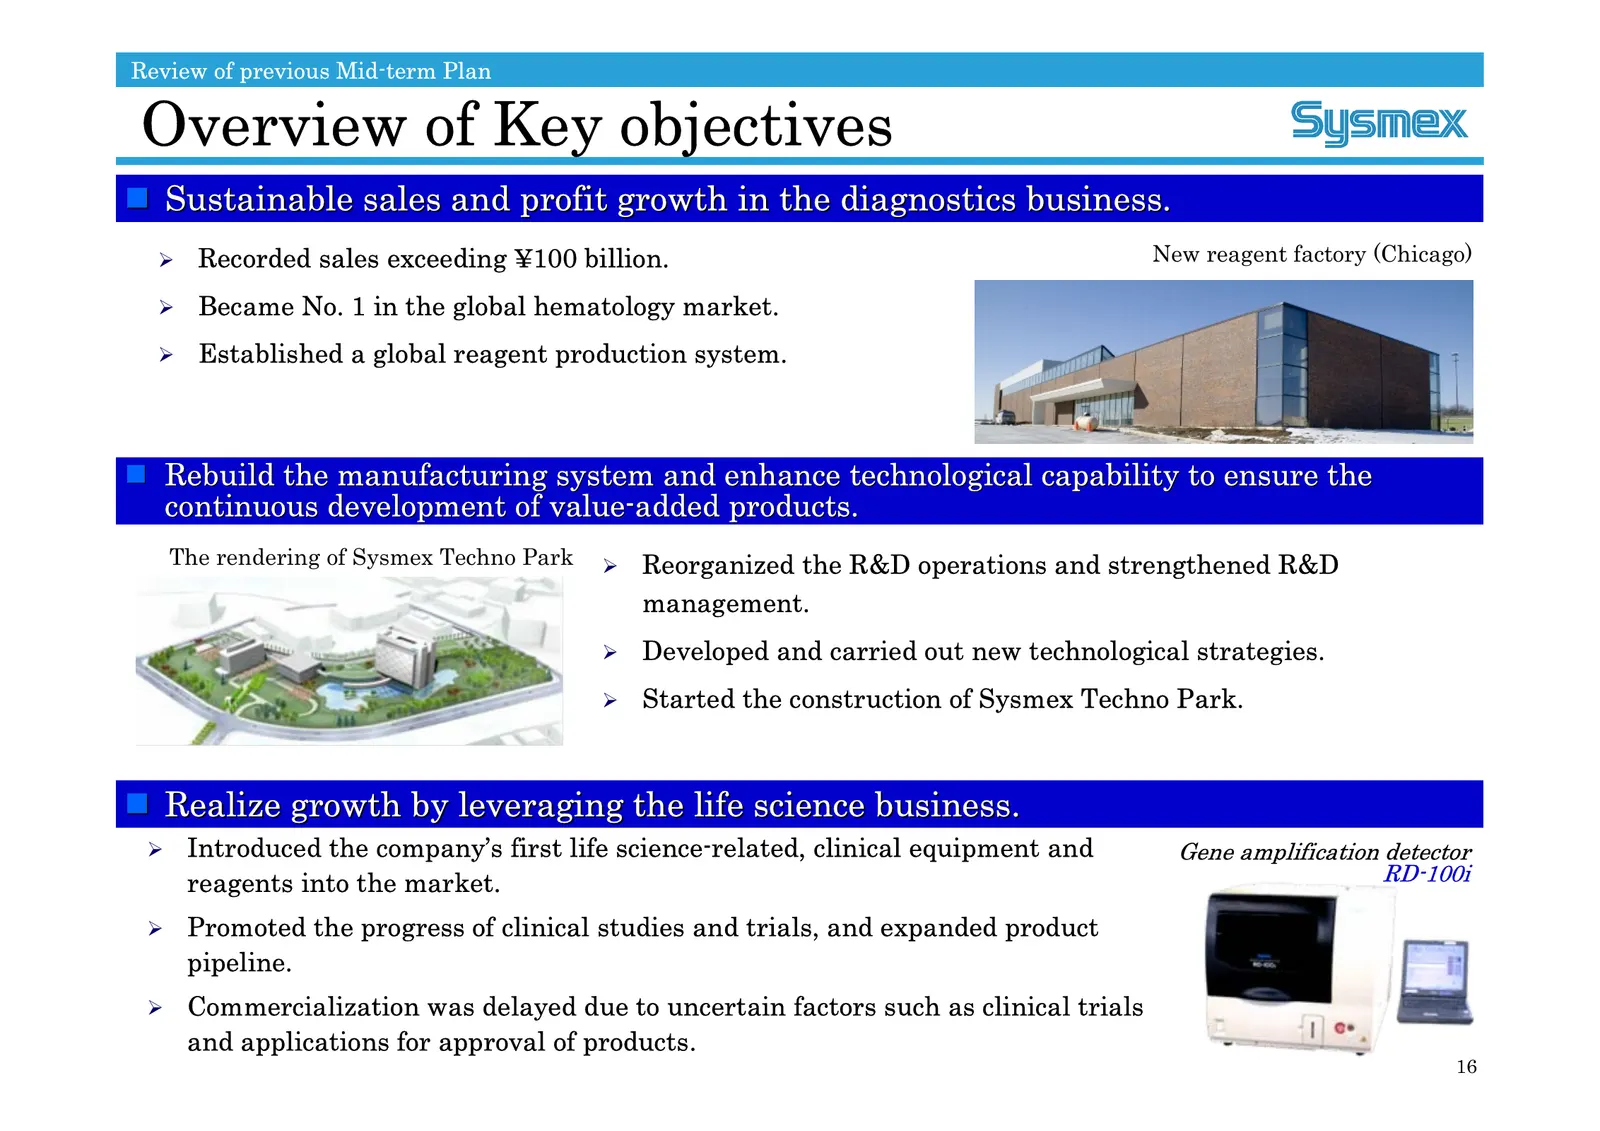
Review of previous Mid-term Plan Overview of Key objectives Sustainable sales and profit growth in the diagnostics business. ¾ Recorded sales exceeding ¥100 billion. New reagent factory (Chicago) ¾ Became No. 1 in the global hematology market. ¾ Established a global reagent production system. Re
Slide 17: Mid-term Plan (From FY2007 To FY2009)
Mid-term Plan(From FY2007 To FY2009) • Market Scenarios • Long-term Vision/ Fundamental Strategies • Mid- and Long-term Growth Scenario • Core Messages of the Mid-term Plan • Financial Targets and Key Objectives • Strategic Approaches • Segments by Geographic Financial Targets • Fundamental Strategi
Slide 18: Market Scenarios
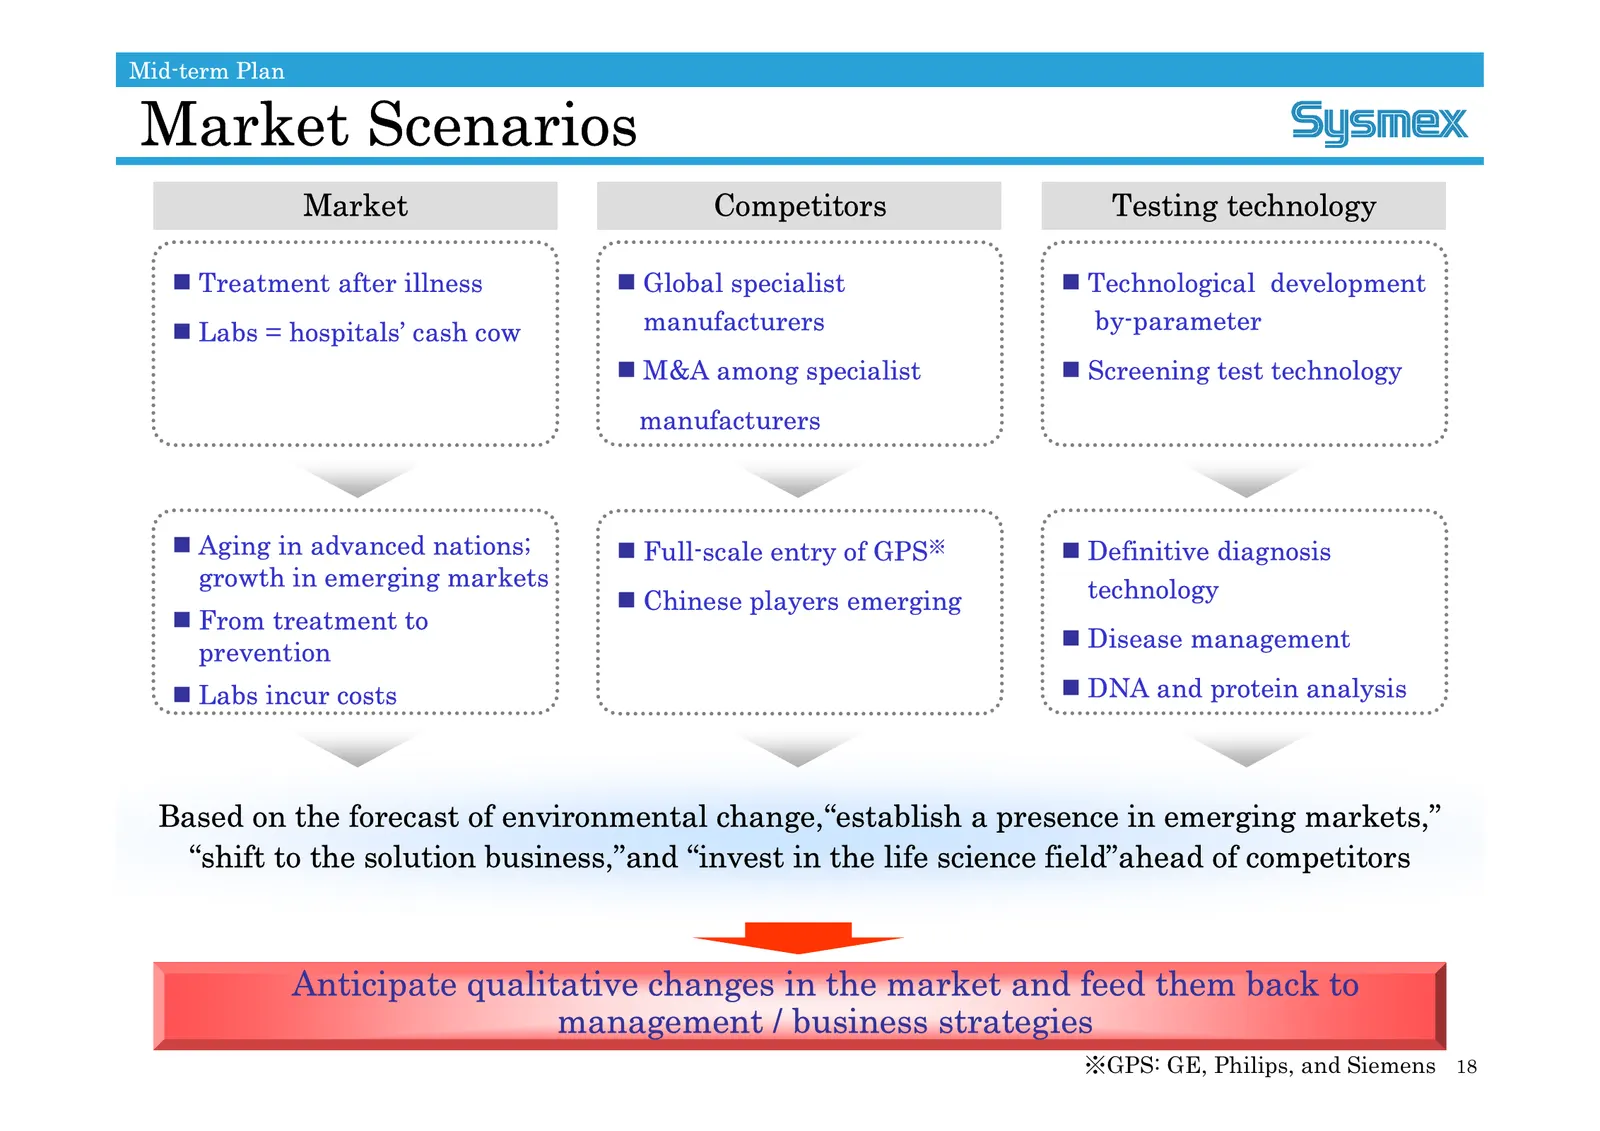
Mid-term Plan Market Scenarios Market Competitors Testing technology Treatment after illness Global specialist Technological development Labs = hospitals’ cash cow manufacturers by-parameter M&A among specialist Screening test technology manufacturers Aging in advanced nations; Full-
Slide 19: Long-term Vision/Fundamental Strategies
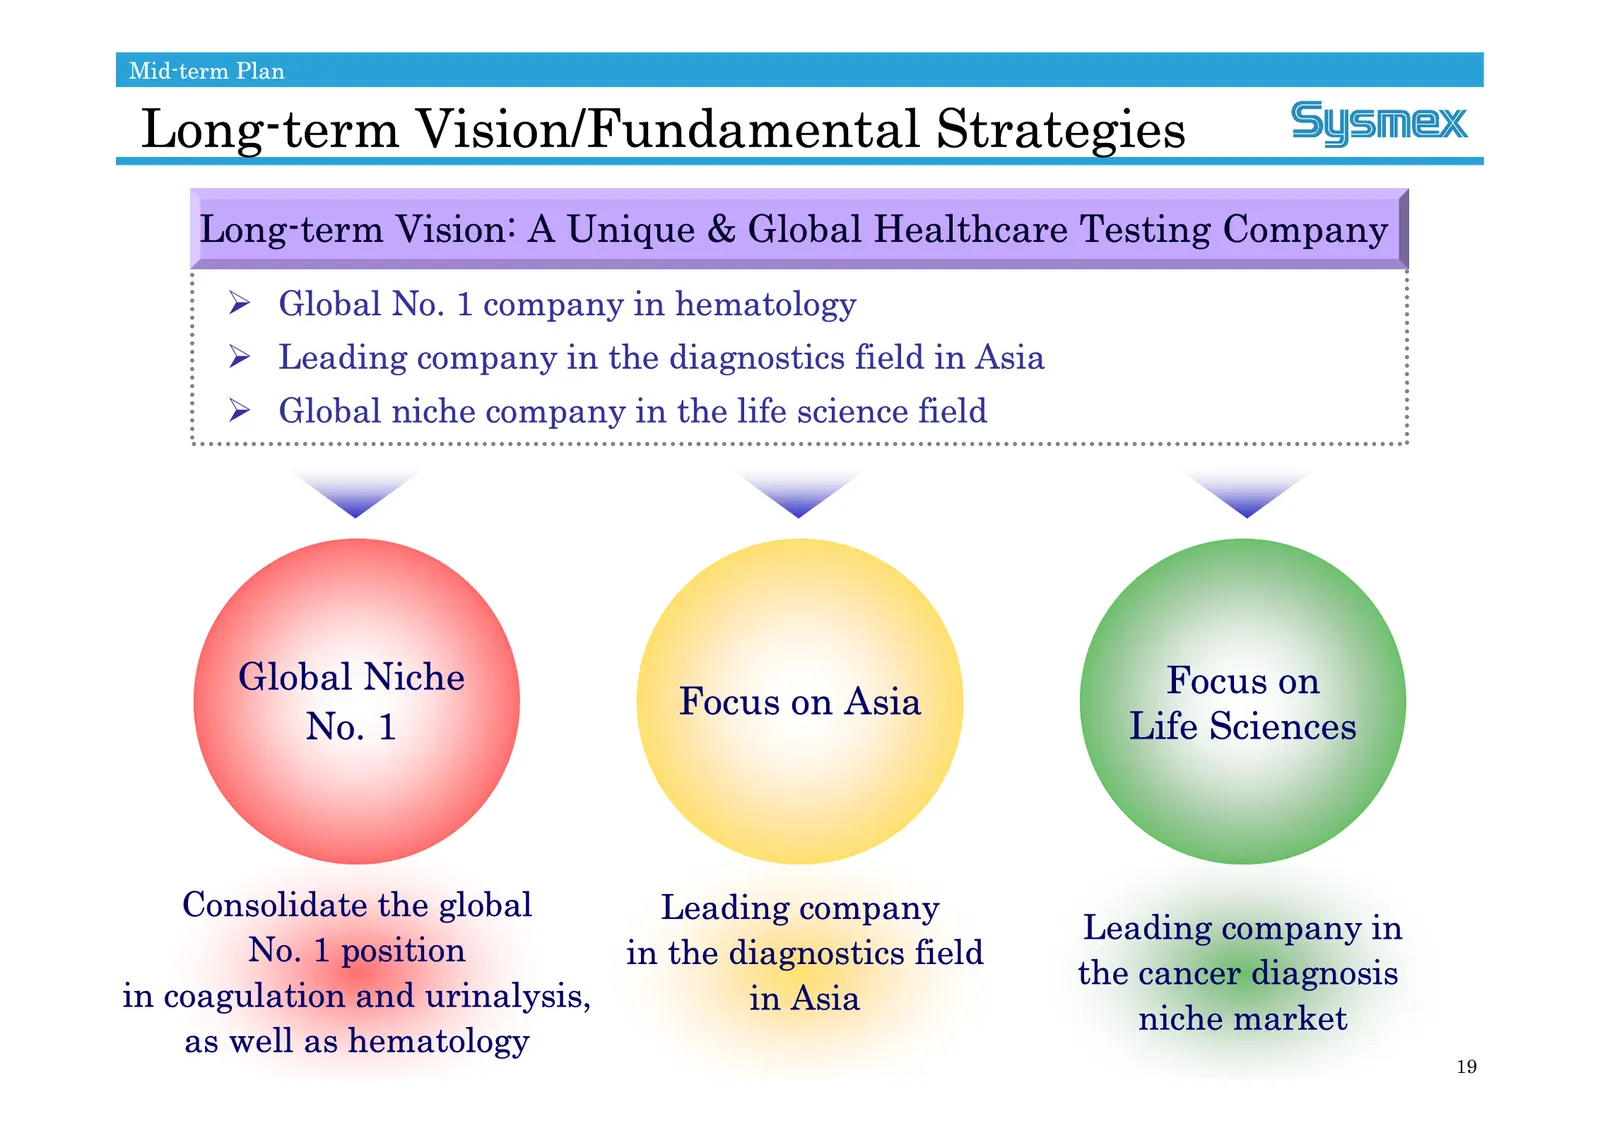
Mid-term Plan Long-term Vision/Fundamental Strategies Long-term Vision: A Unique & Global Healthcare Testing Company ¾ Global No. 1 company in hematology ¾ Leading company in the diagnostics field in Asia ¾ Global niche company in the life science field Global Niche Focus on Focus on Asia No. 1 Life
Slide 20: Mid- and Long-Term Growth Scenario
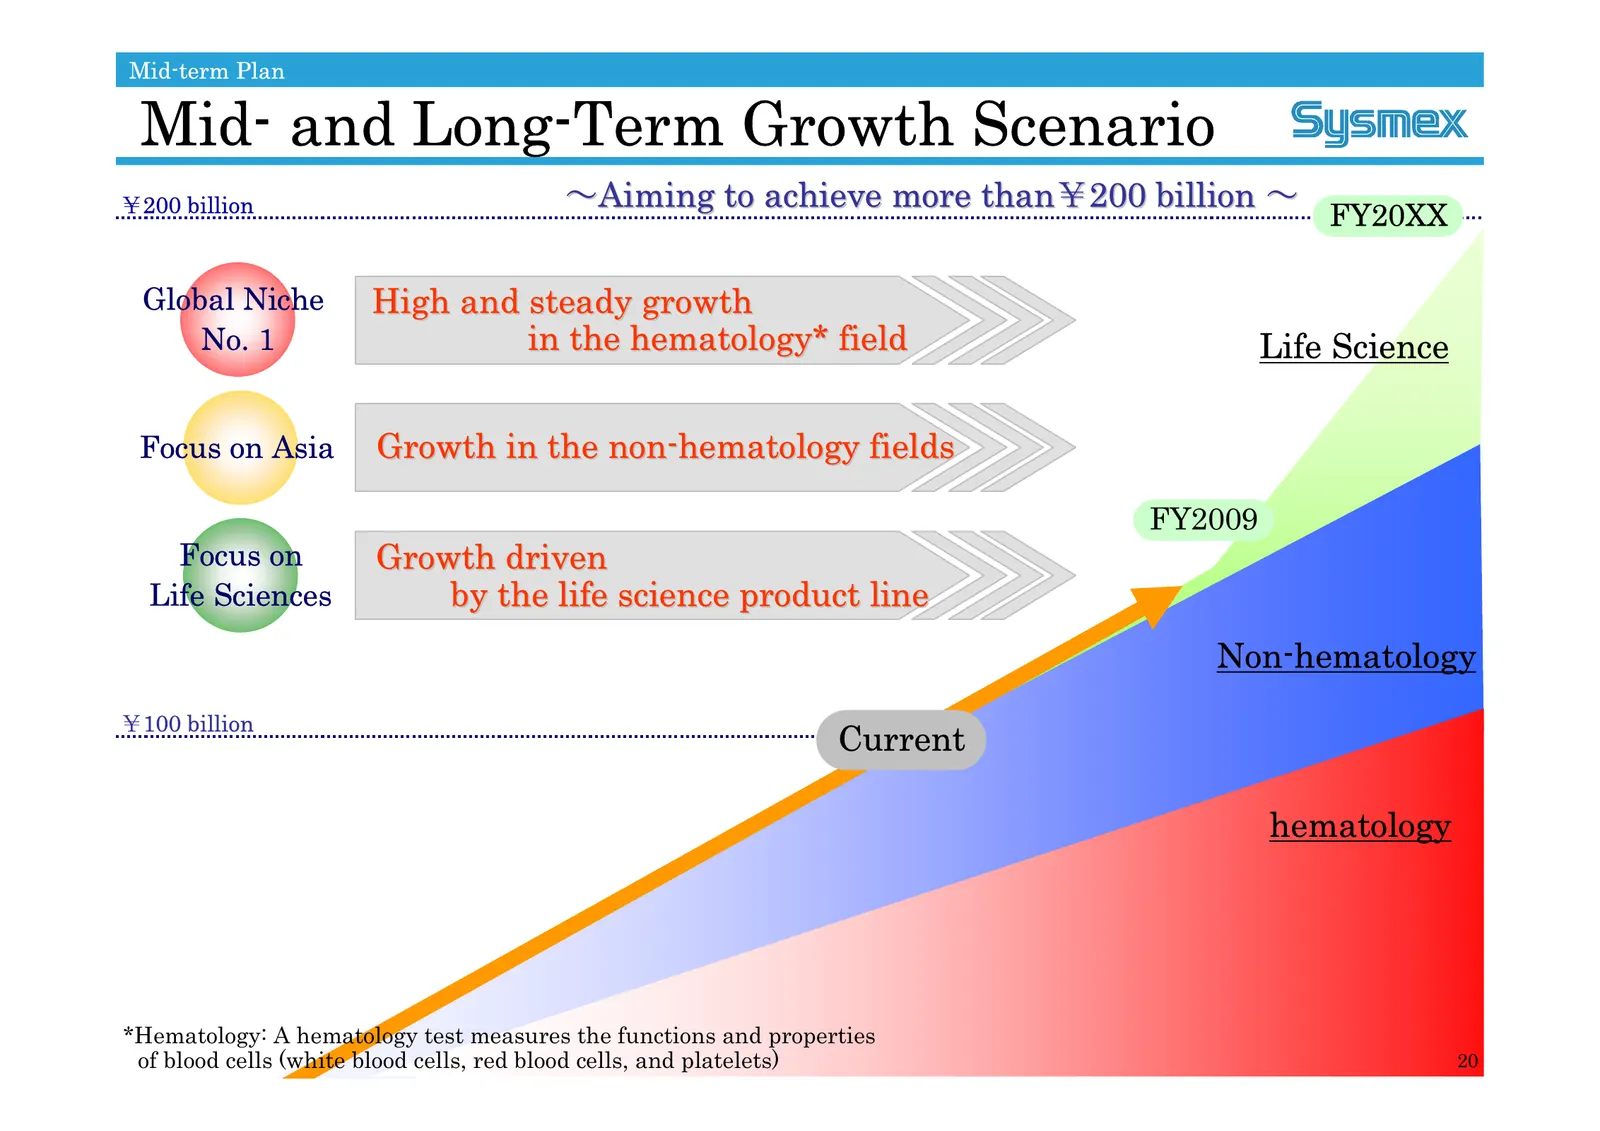
Mid-term Plan Mid- and Long-Term Growth Scenario ¥200 billion ~Aiming to achieve more than¥200 billion ~ FY20XX Global Niche High and steady growth No. 1 in the hematology* field Life Science Focus on Asia Growth in the non-hematology fields FY2009 Focus on Growth driven Life Sciences by the life sc
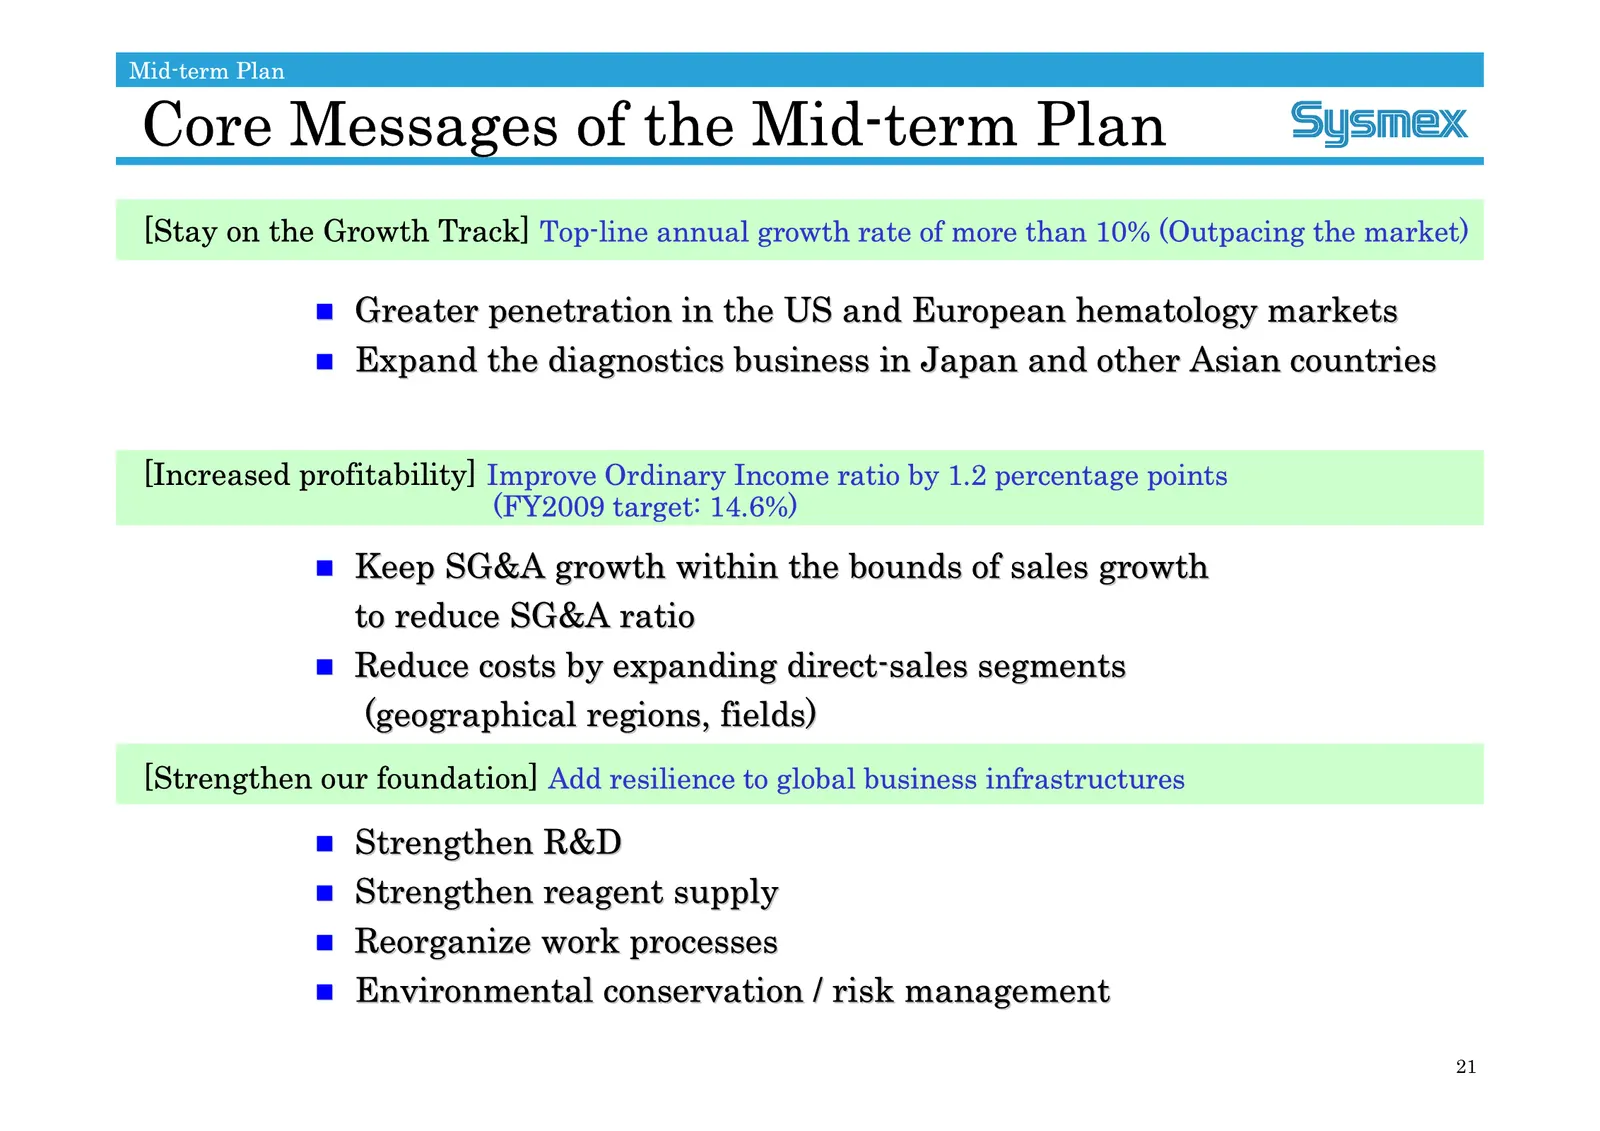
Slide 21: Core Messages of the Mid-term Plan
Mid-term Plan Core Messages of the Mid-term Plan [Stay on the Growth Track] Top-line annual growth rate of more than 10% (Outpacing the market) Greater penetration in the US and European hematology markets Expand the diagnostics business in Japan and other Asian countries [Increased profitabilit
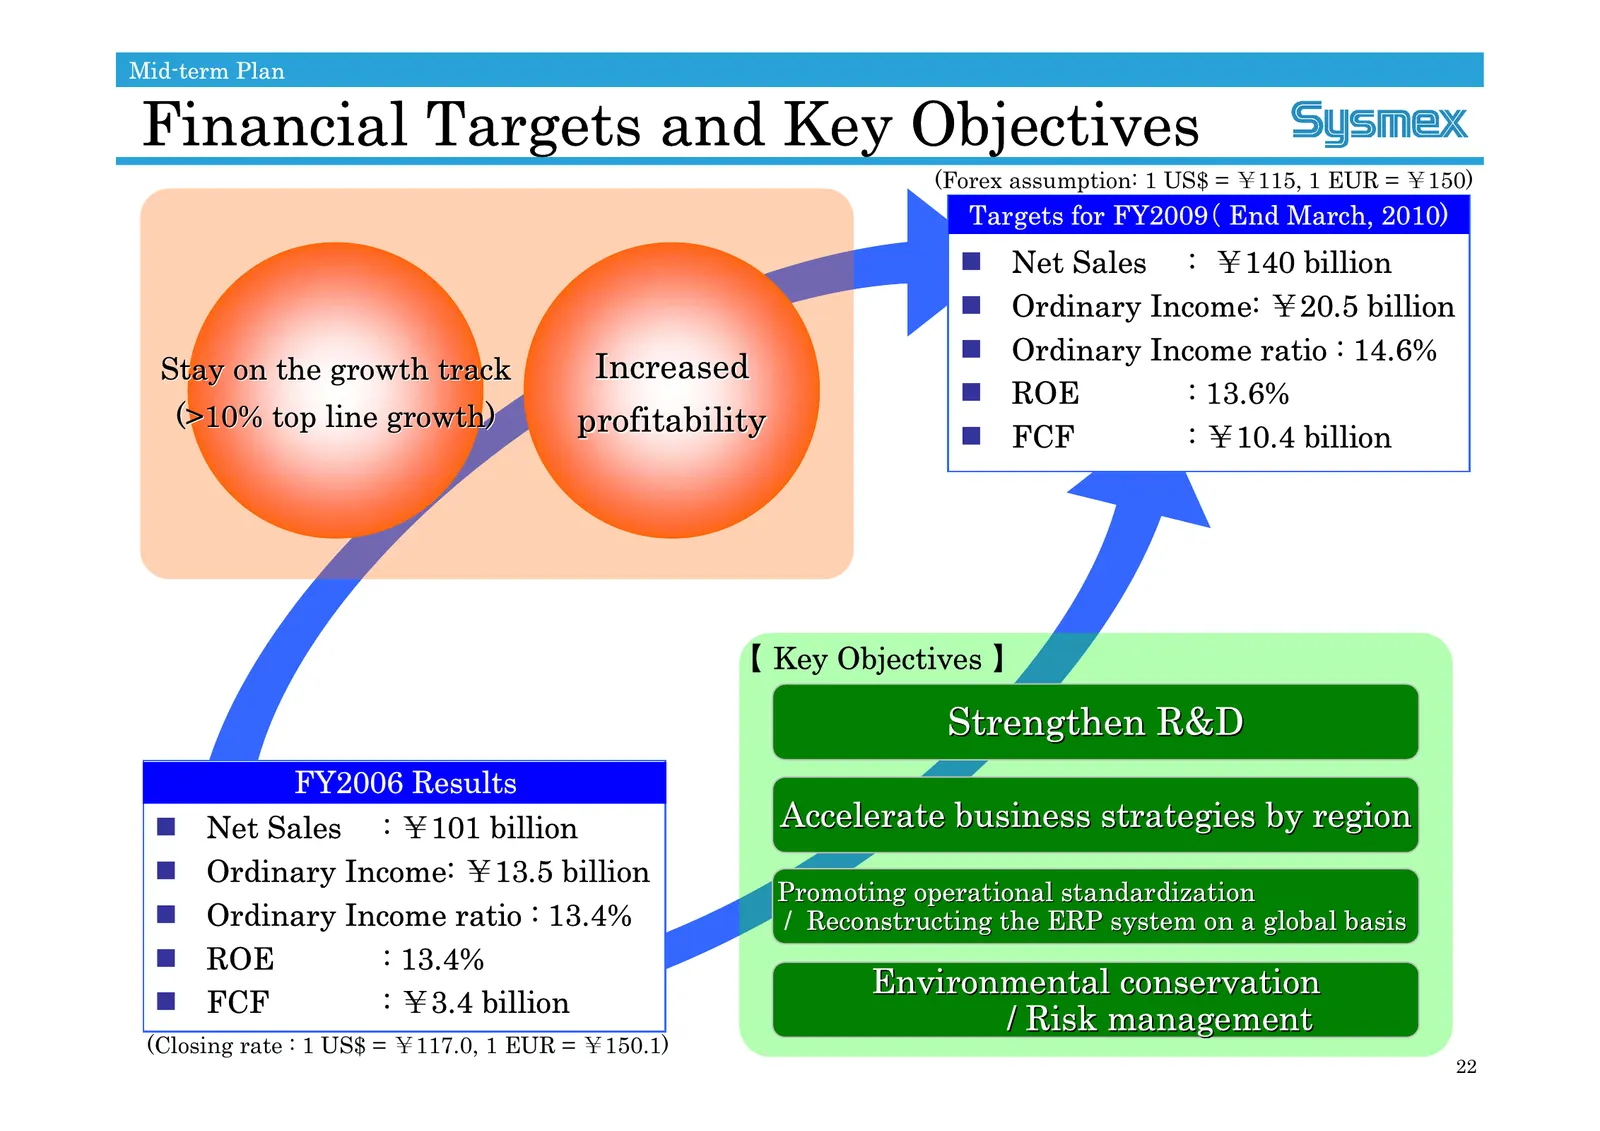
Slide 22: Financial Targets and Key Objectives
Mid-term Plan Financial Targets and Key Objectives (Forex assumption: 1 US$ = ¥115, 1 EUR = ¥150) Targets for FY2009( End March, 2010) Net Sales : ¥140 billion Ordinary Income: ¥20.5 billion Ordinary Income ratio : 14.6% Stay on the growth track Increased ROE : 13.6% (>10% top line growth) p
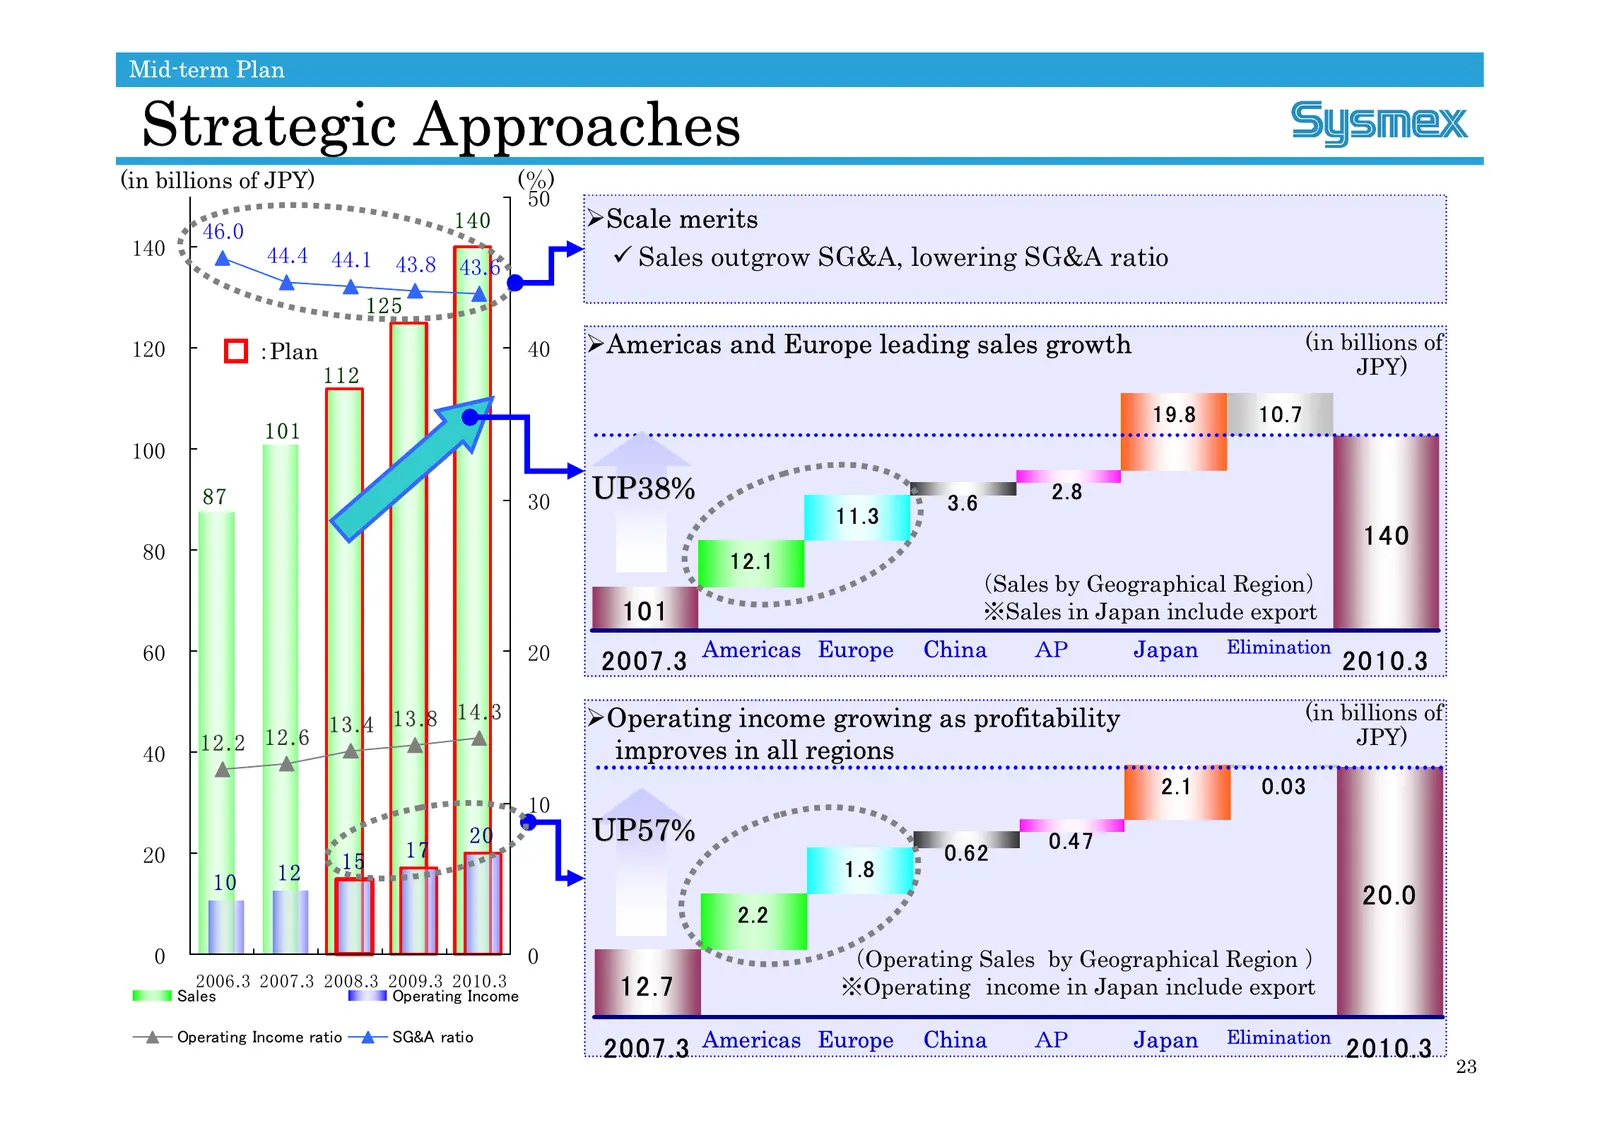
Slide 23: Strategic Approaches
Mid-term Plan Strategic Approaches (in billions of JPY) (%) 50 46.0 140 ¾Scale merits 140 44.4 9 Sales outgrow SG&A, lowering SG&A ratio 44.1 43.8 43.6 125 120 :Plan 40 ¾Americas and Europe leading sales growth (in billions of 112 JPY) 19.8 10.7 101 100 87 30 UP38% 3.6 2.8 11.3 140 80 12.1 (Sales by
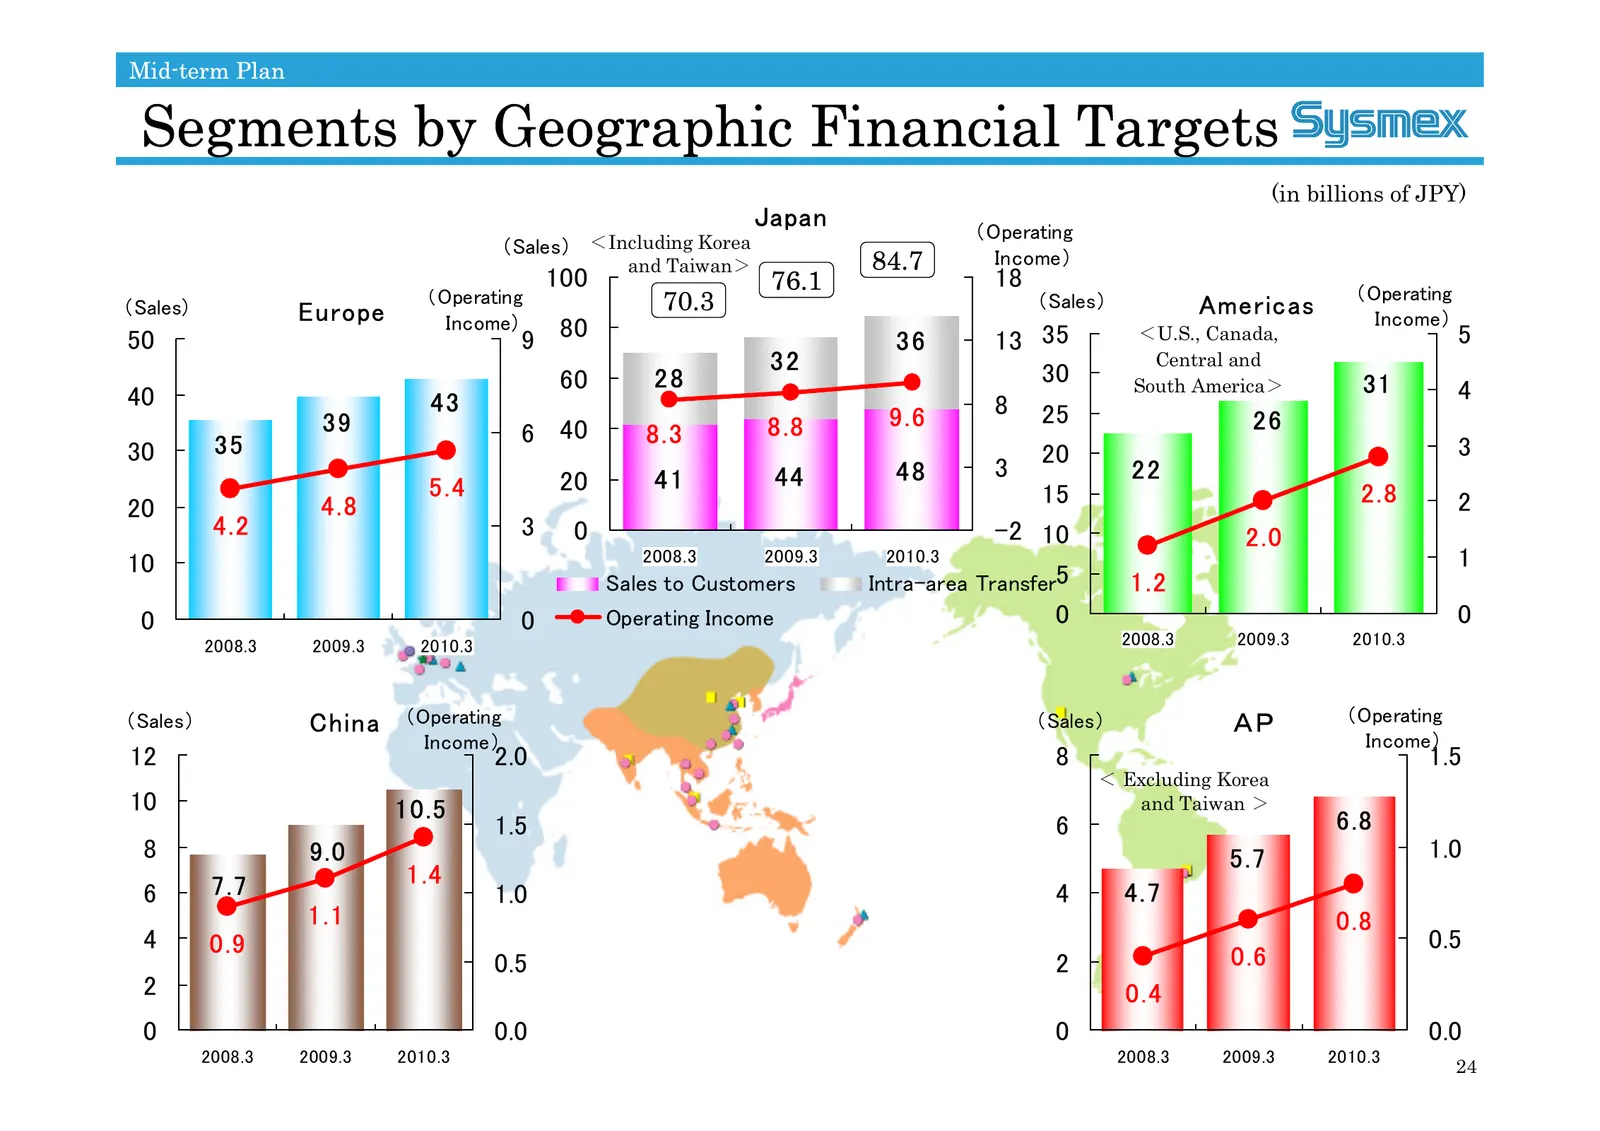
Slide 24: Segments by Geographic Financial Targets
Mid-term Plan Segments by Geographic Financial Targets (in billions of JPY) Japan (Operating (Sales) <Including Korea and Taiwan> 84.7 Income) 100 76.1 18 (Operating (Sales) Europe (Operating 70.3 (Sales) Americas Income) Income) 50 9 80 36 13 35 <U.S., Canada, 5 32 30 Central and 60 28 South Americ
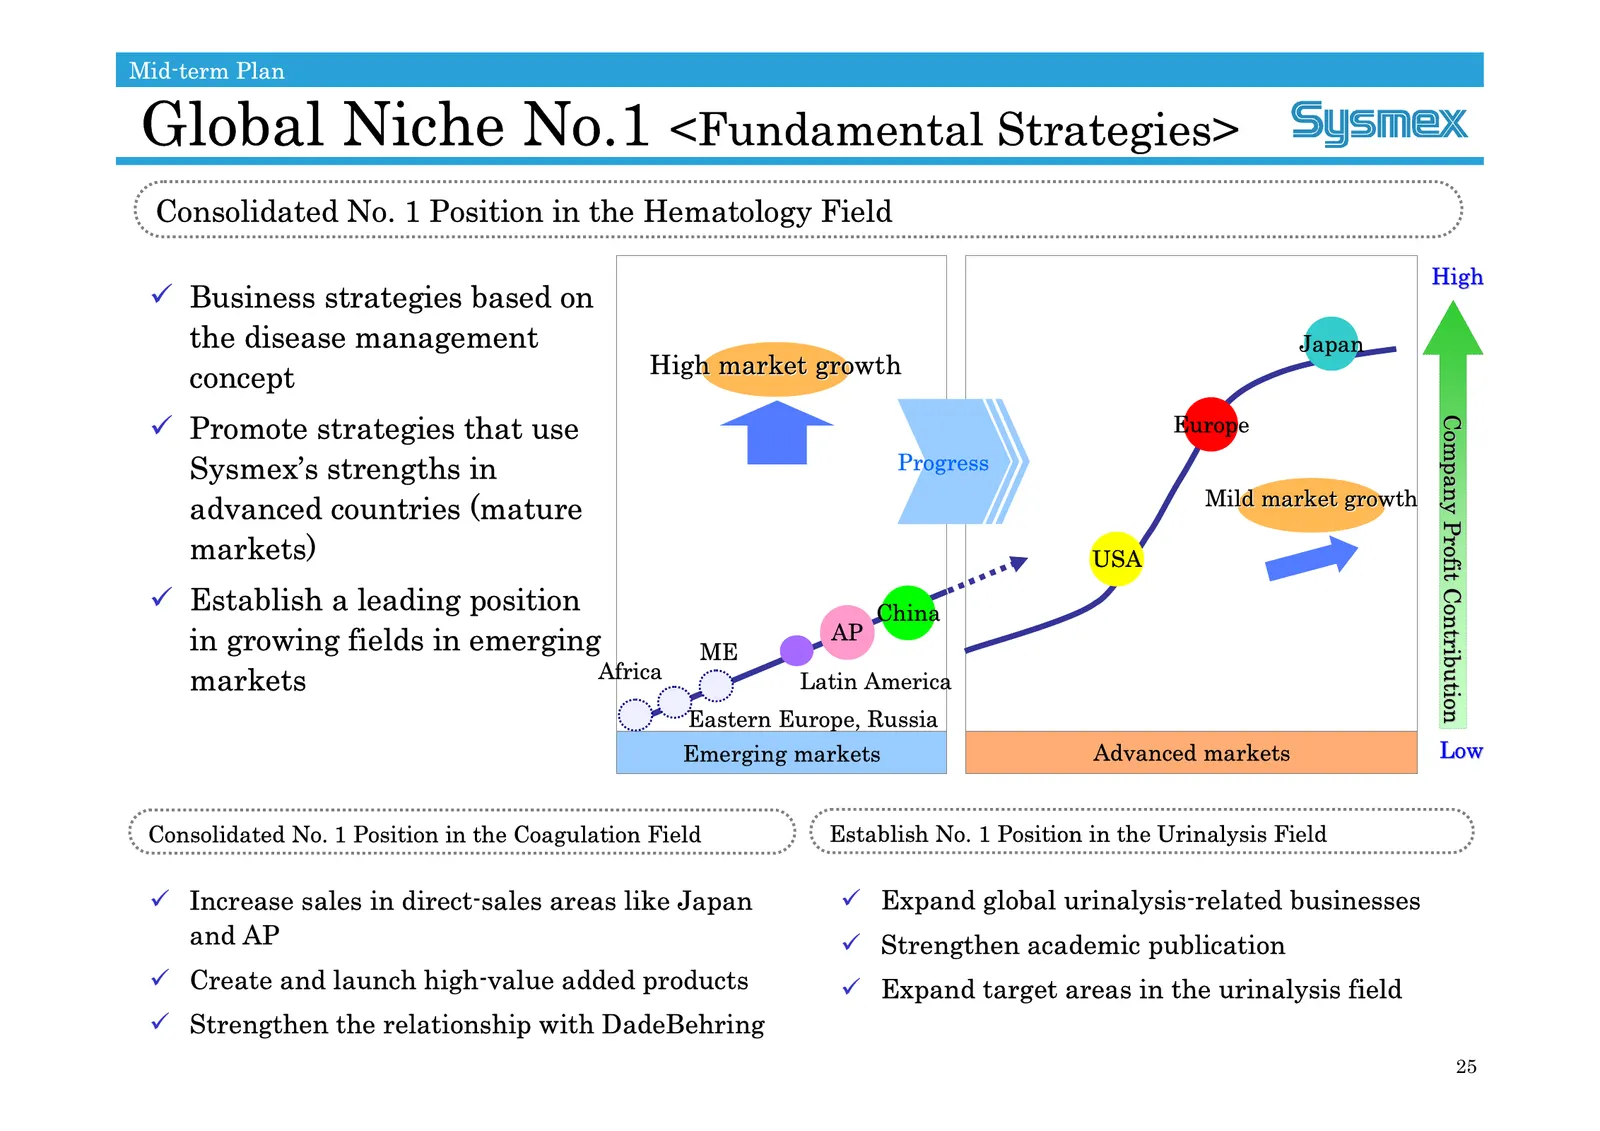
Slide 25: Global Niche No.1 Fundamental Strategies
Mid-term Plan Global Niche No.1 <Fundamental Strategies> Consolidated No. 1 Position in the Hematology Field High 9 Business strategies based on the disease management Japan High market growth concept 9 Promote strategies that use Europe Company Profit Contribution Sysmex’s strengths in Progress Mil
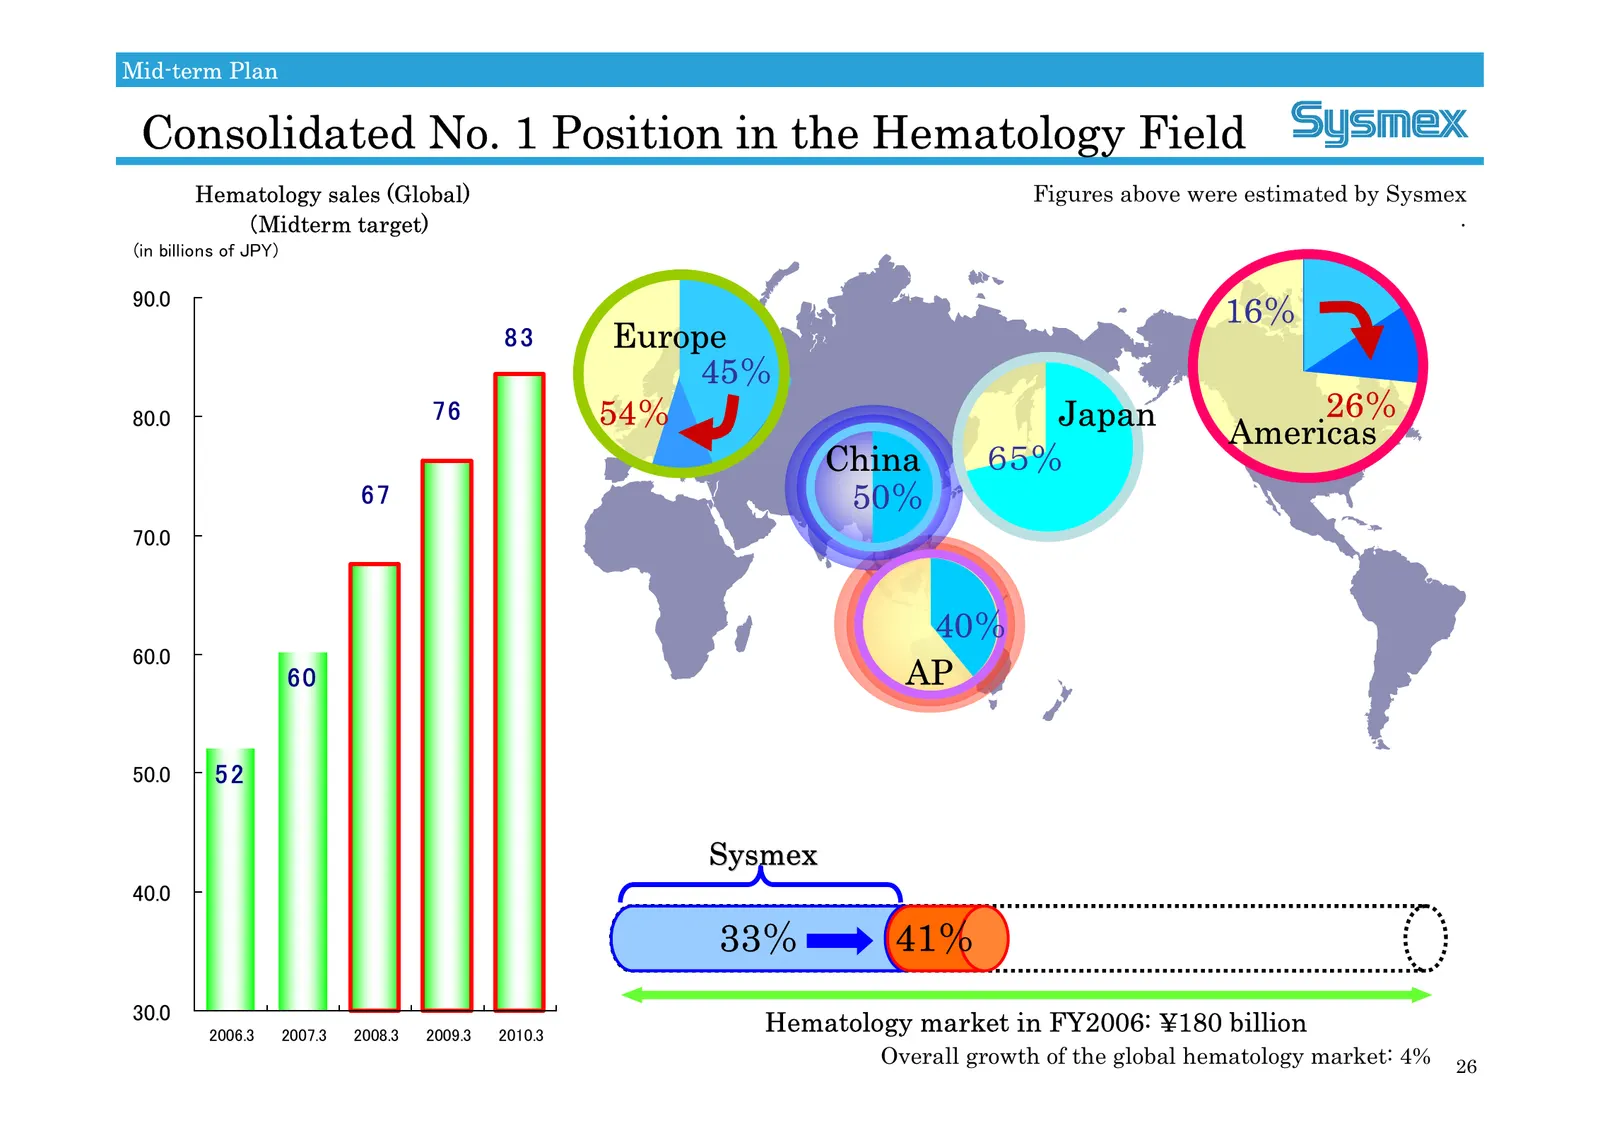
Slide 26: Consolidated No. 1 Position in the Hematology Field
Mid-term Plan Consolidated No. 1 Position in the Hematology Field Hematology sales (Global) Figures above were estimated by Sysmex (Midterm target) . (in billions of JPY) 90.0 16% 83 Europe 45% 80.0 76 54% Japan 26% Americas China 65% 67 50% 70.0 40% 60.0 60 AP 50.0 52 Sysmex 40.0 33% 41% 30.0 Hemat
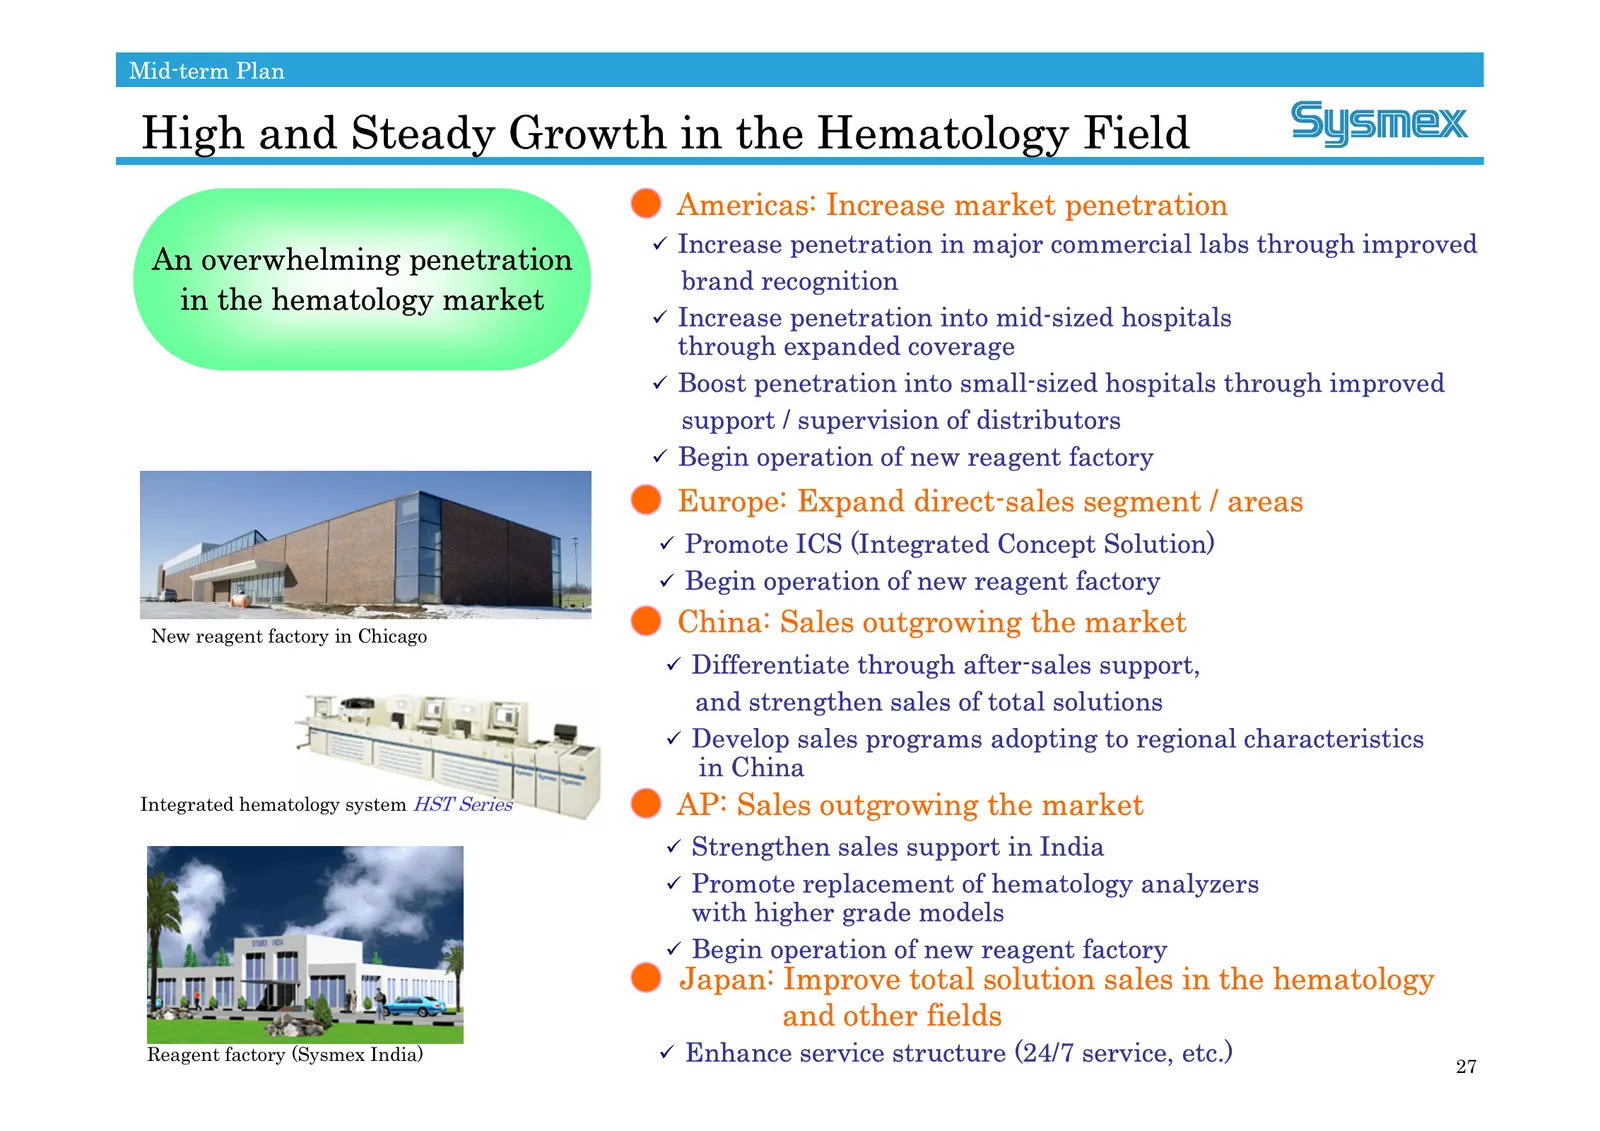
Slide 27: High and Steady Growth in the Hematology Field
Mid-term Plan High and Steady Growth in the Hematology Field Americas: Increase market penetration 9 Increase penetration in major commercial labs through improved An overwhelming penetration brand recognition in the hematology market 9 Increase penetration into mid-sized hospitals through expanded
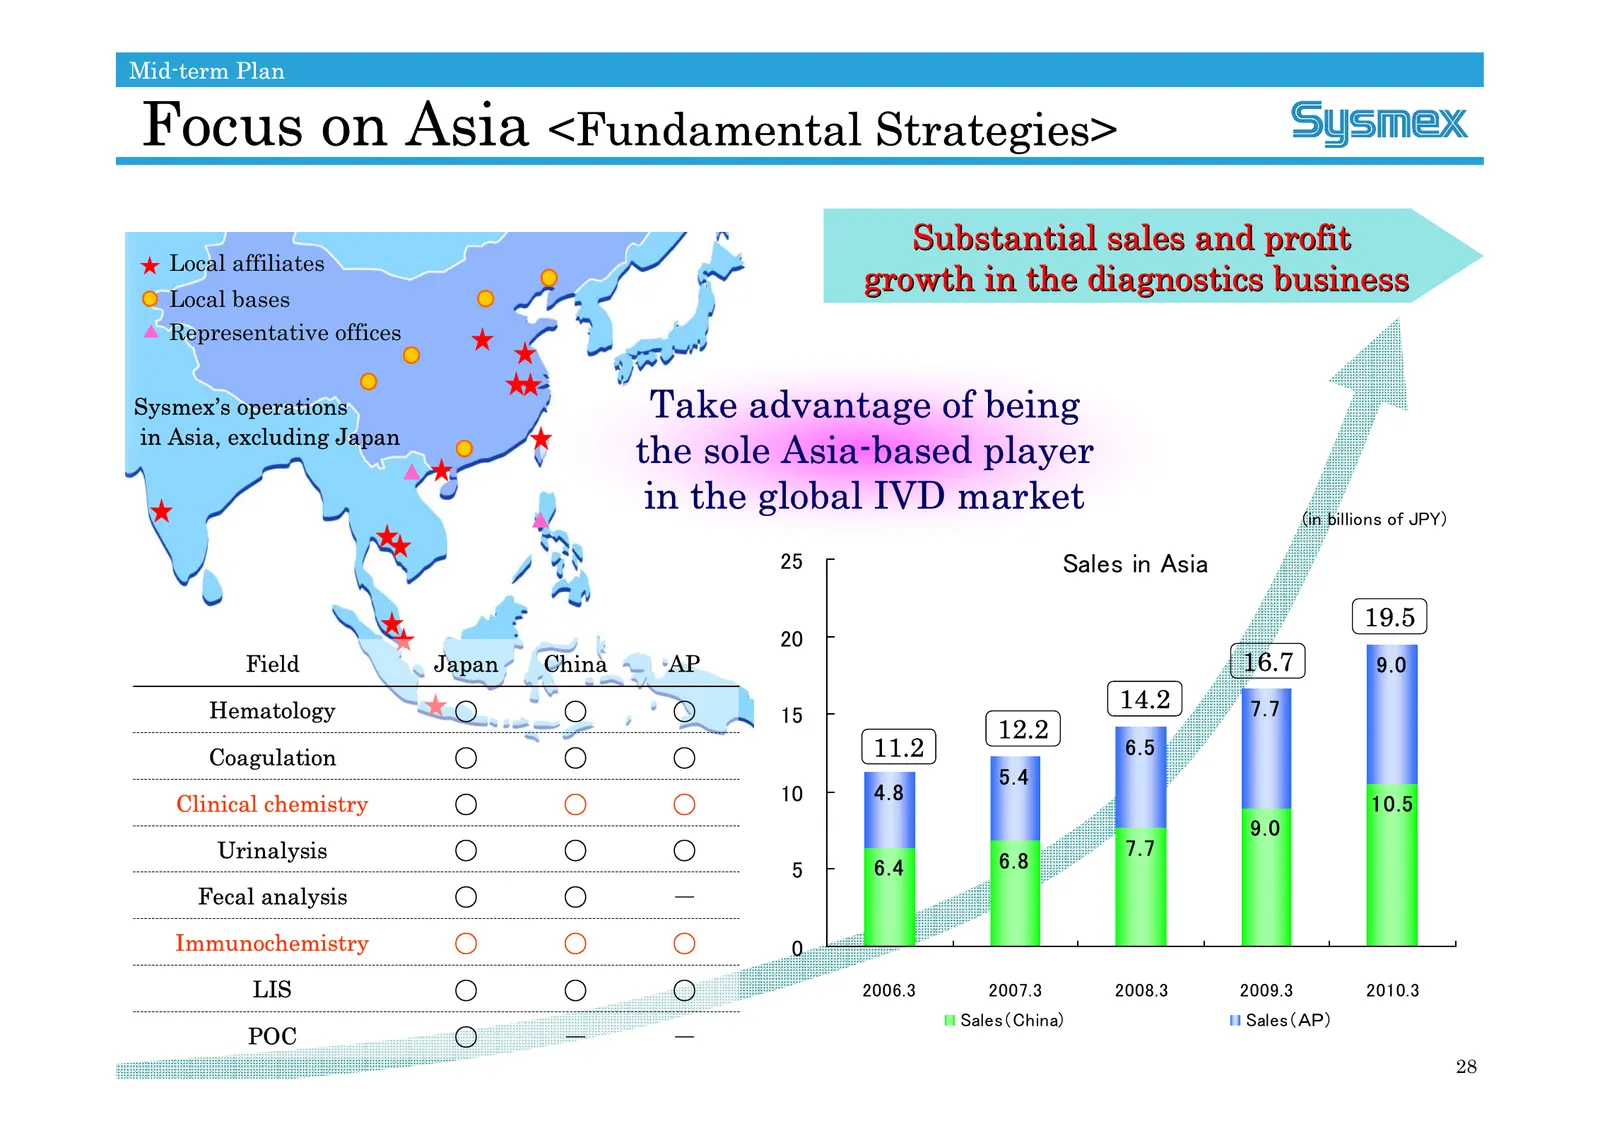
Slide 28: Focus on Asia
Mid-term Plan Focus on Asia <Fundamental Strategies> Substantial sales and profit Local affiliates growth in the diagnostics business Local bases Representative offices Sysmex’s operations Take advantage of being in Asia, excluding Japan the sole Asia-based player in the global IVD market (in billio
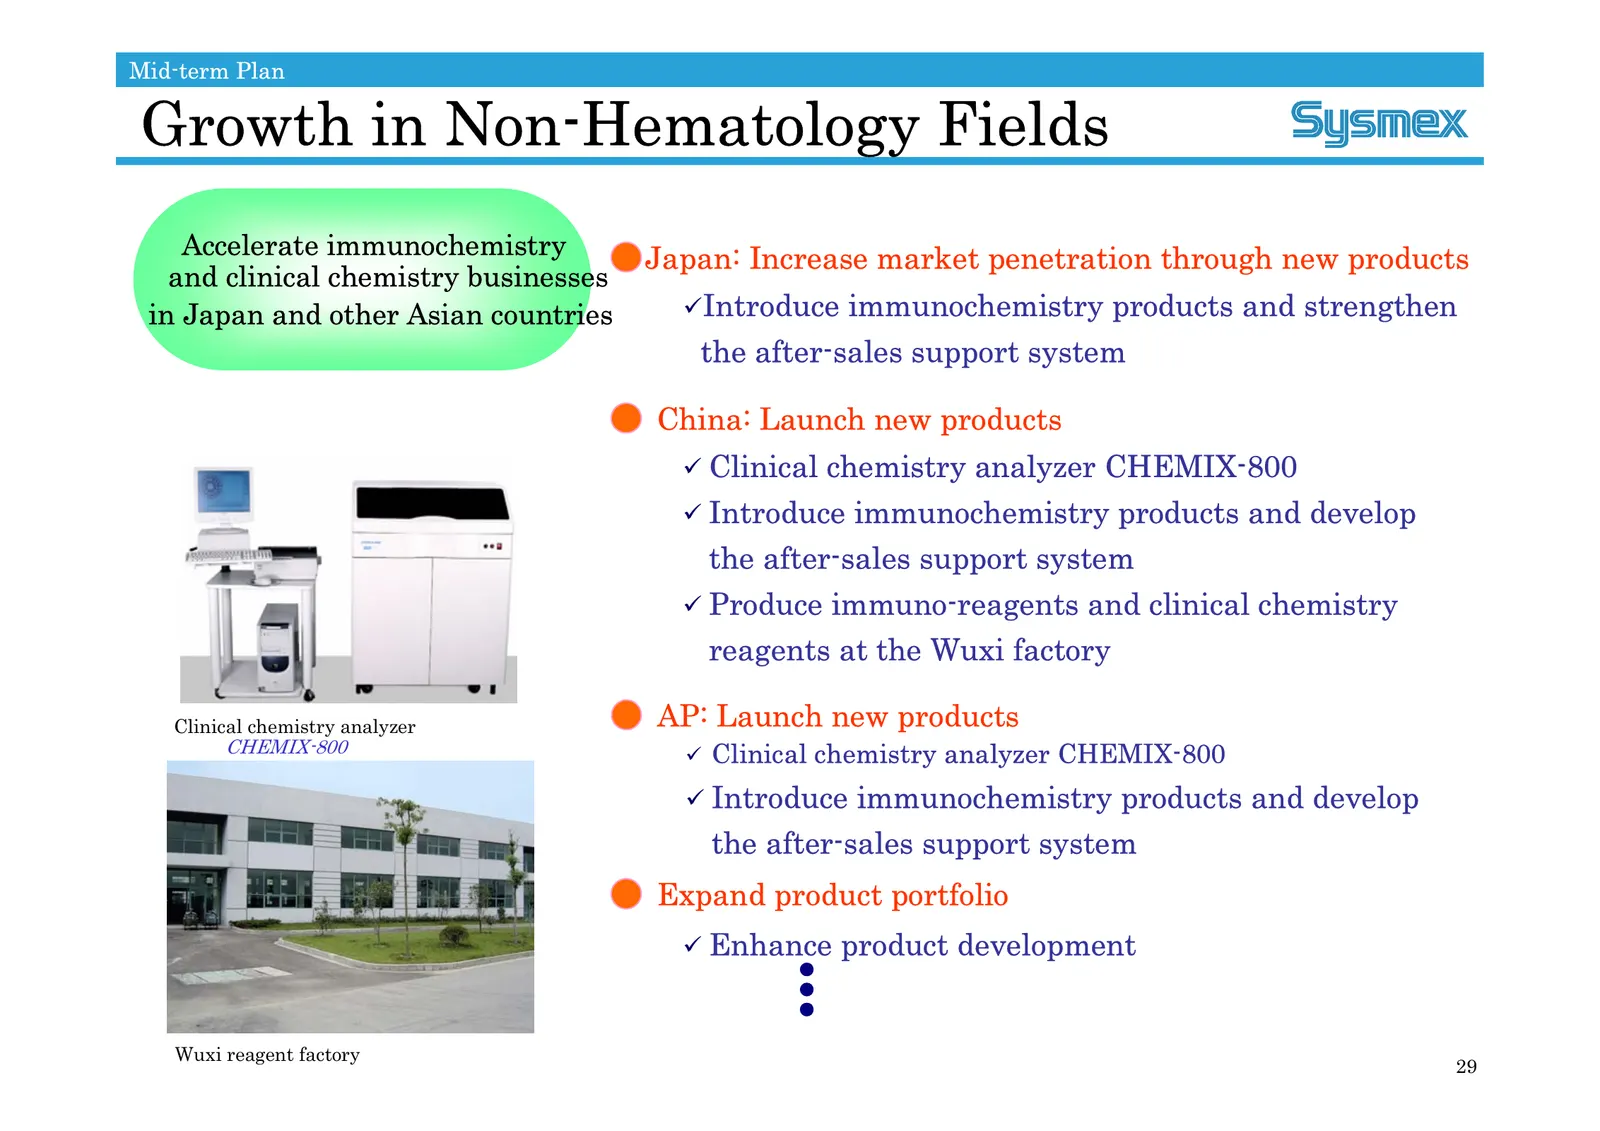
Slide 29: Growth in Non-Hematology Fields
Mid-term Plan Growth in Non-Hematology Fields Accelerate immunochemistry Japan: Increase market penetration through new products and clinical chemistry businesses in Japan and other Asian countries 9Introduce immunochemistry products and strengthen the after-sales support system China: Launch new pr
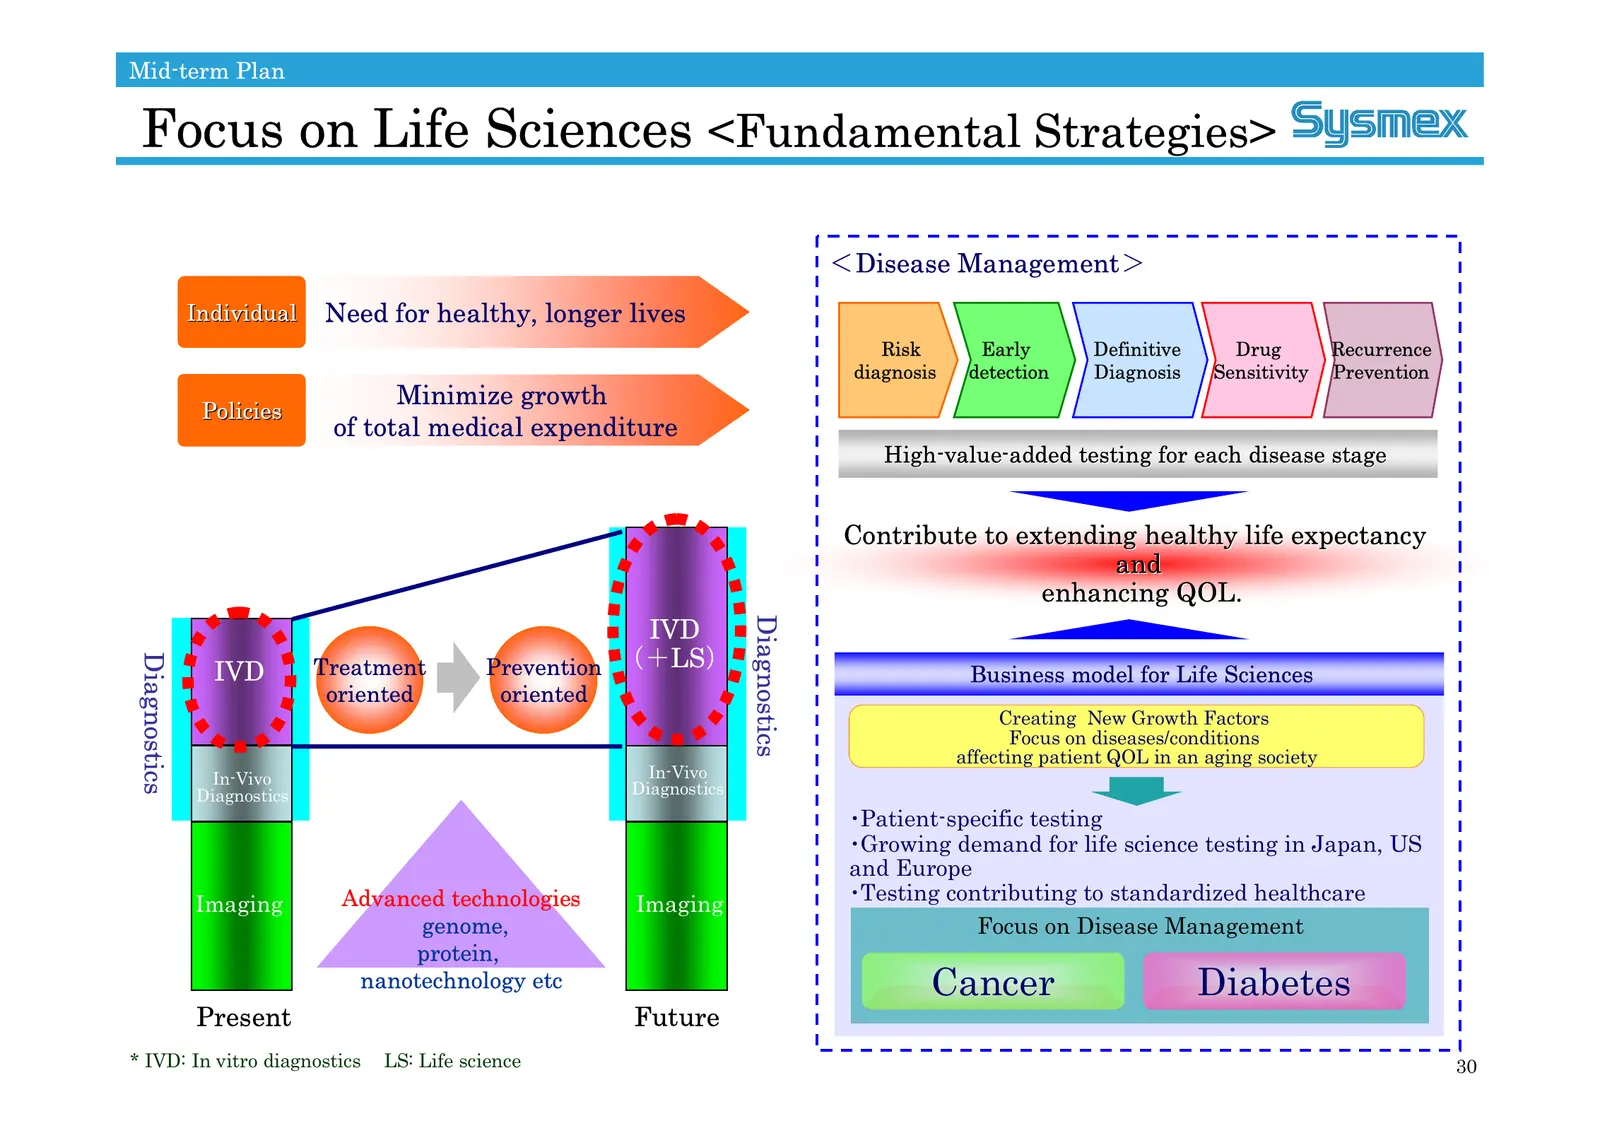
Slide 30: Focus on Life Sciences
Mid-term Plan Focus on Life Sciences <Fundamental Strategies> <Disease Management> Individual Need for healthy, longer lives Risk Early Definitive Drug Recurrence diagnosis detection Diagnosis Sensitivity Prevention Minimize growth Policies of total medical expenditure High- High-value- value-added
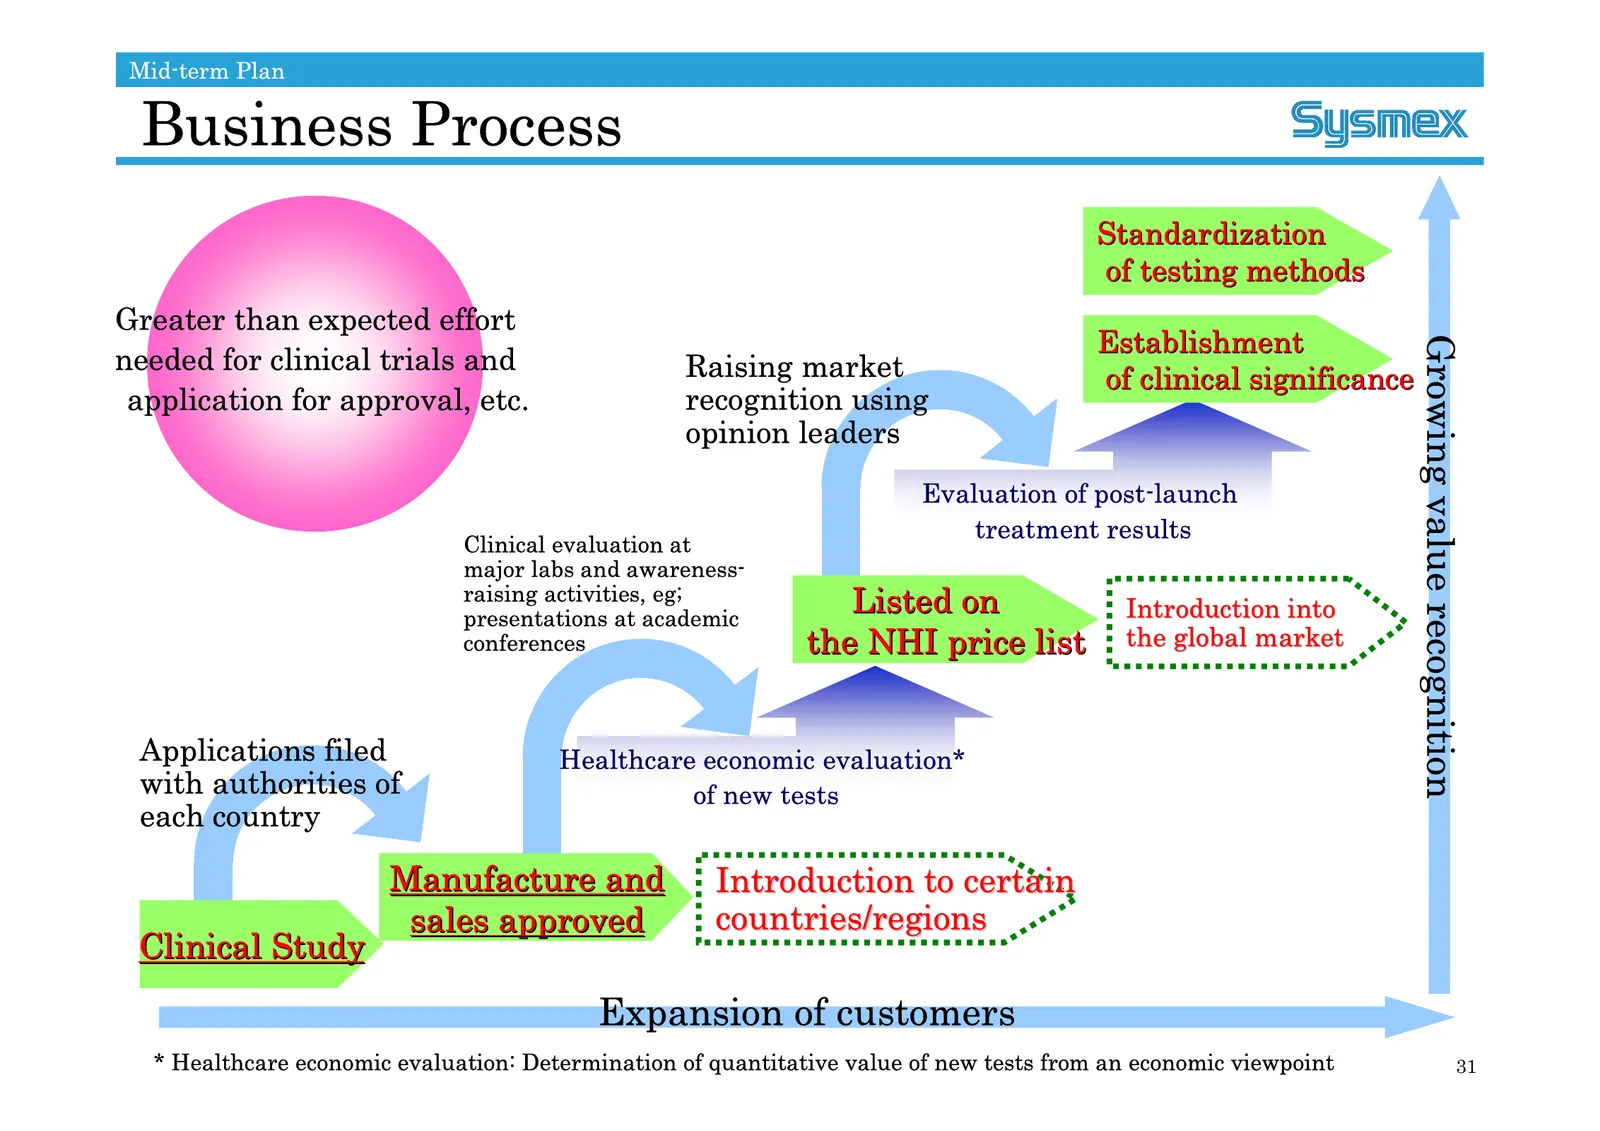
Slide 31: Business Process for new tests
Mid-term Plan Business Process Standardization of testing methods Greater than expected effort Establishment Growing value recognition needed for clinical trials and Raising market of clinical significance application for approval, etc. recognition using opinion leaders Evaluation of post-launch tre
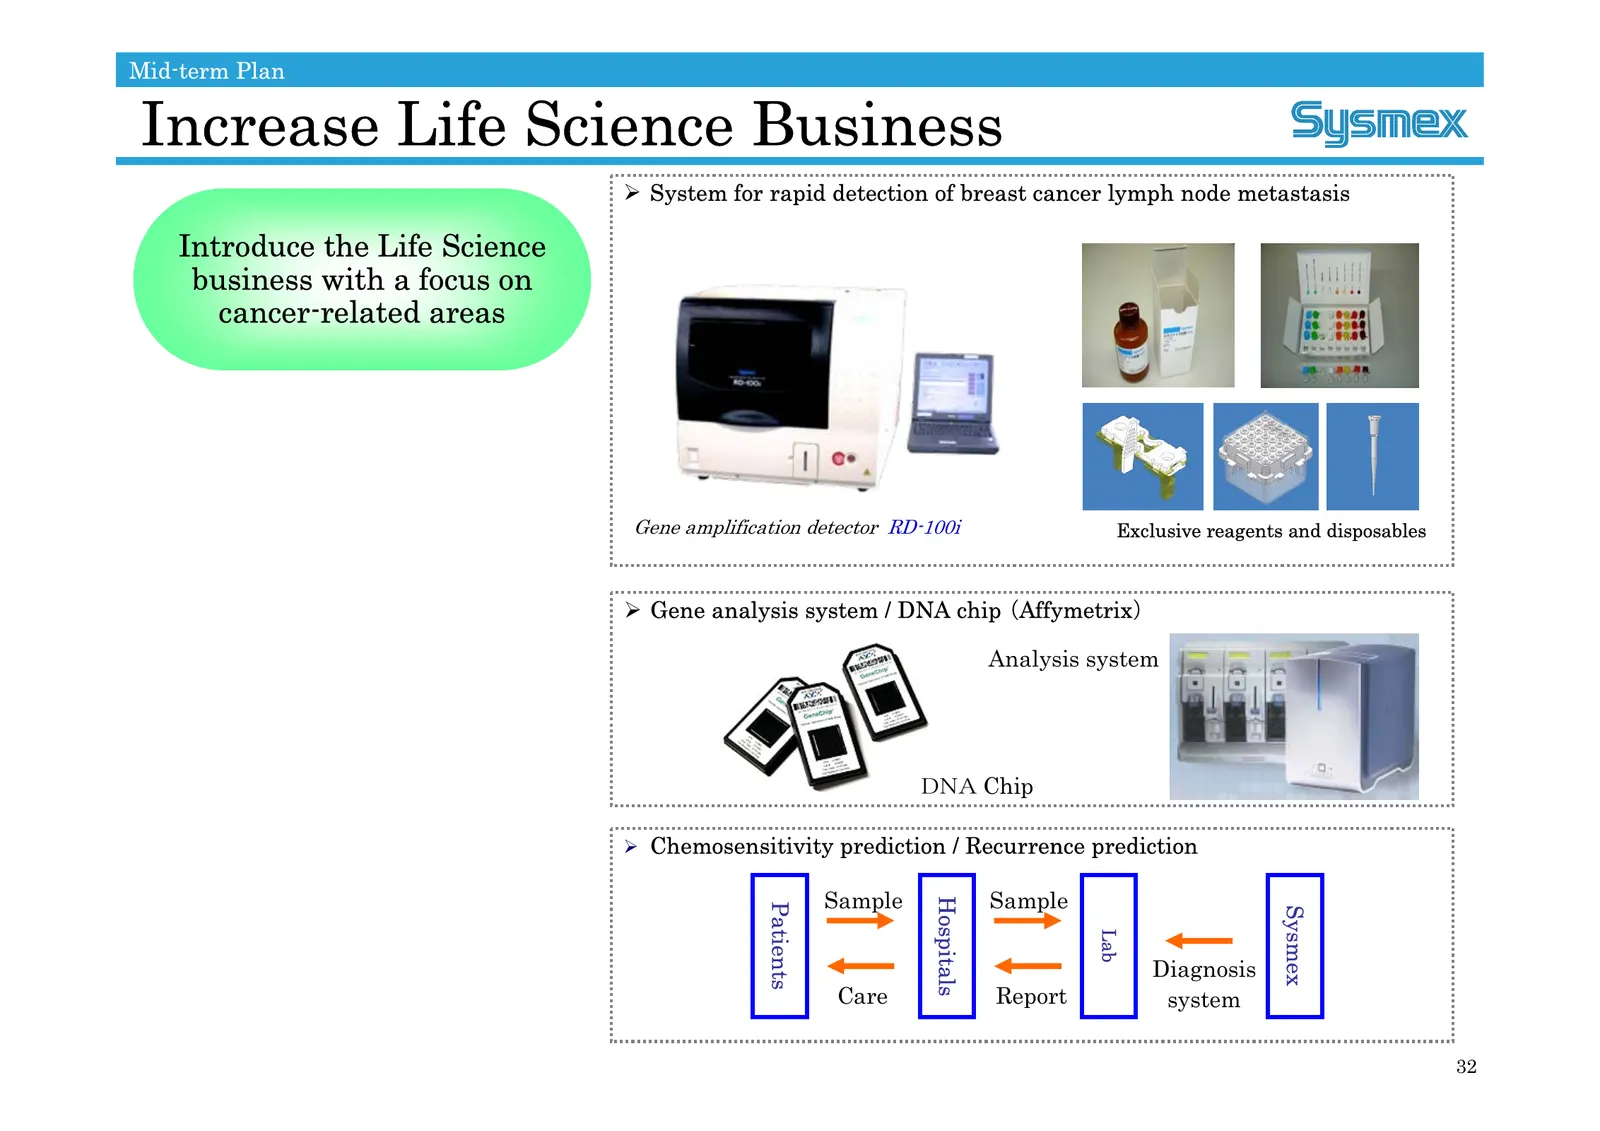
Slide 32: Increase Life Science Business
Mid-term Plan Increase Life Science Business ¾ System for rapid detection of breast cancer lymph node metastasis Introduce the Life Science business with a focus on cancer-related areas Gene amplification detector RD-100i Exclusive reagents and disposables ¾ Gene analysis system / DNA chip (Affymetr
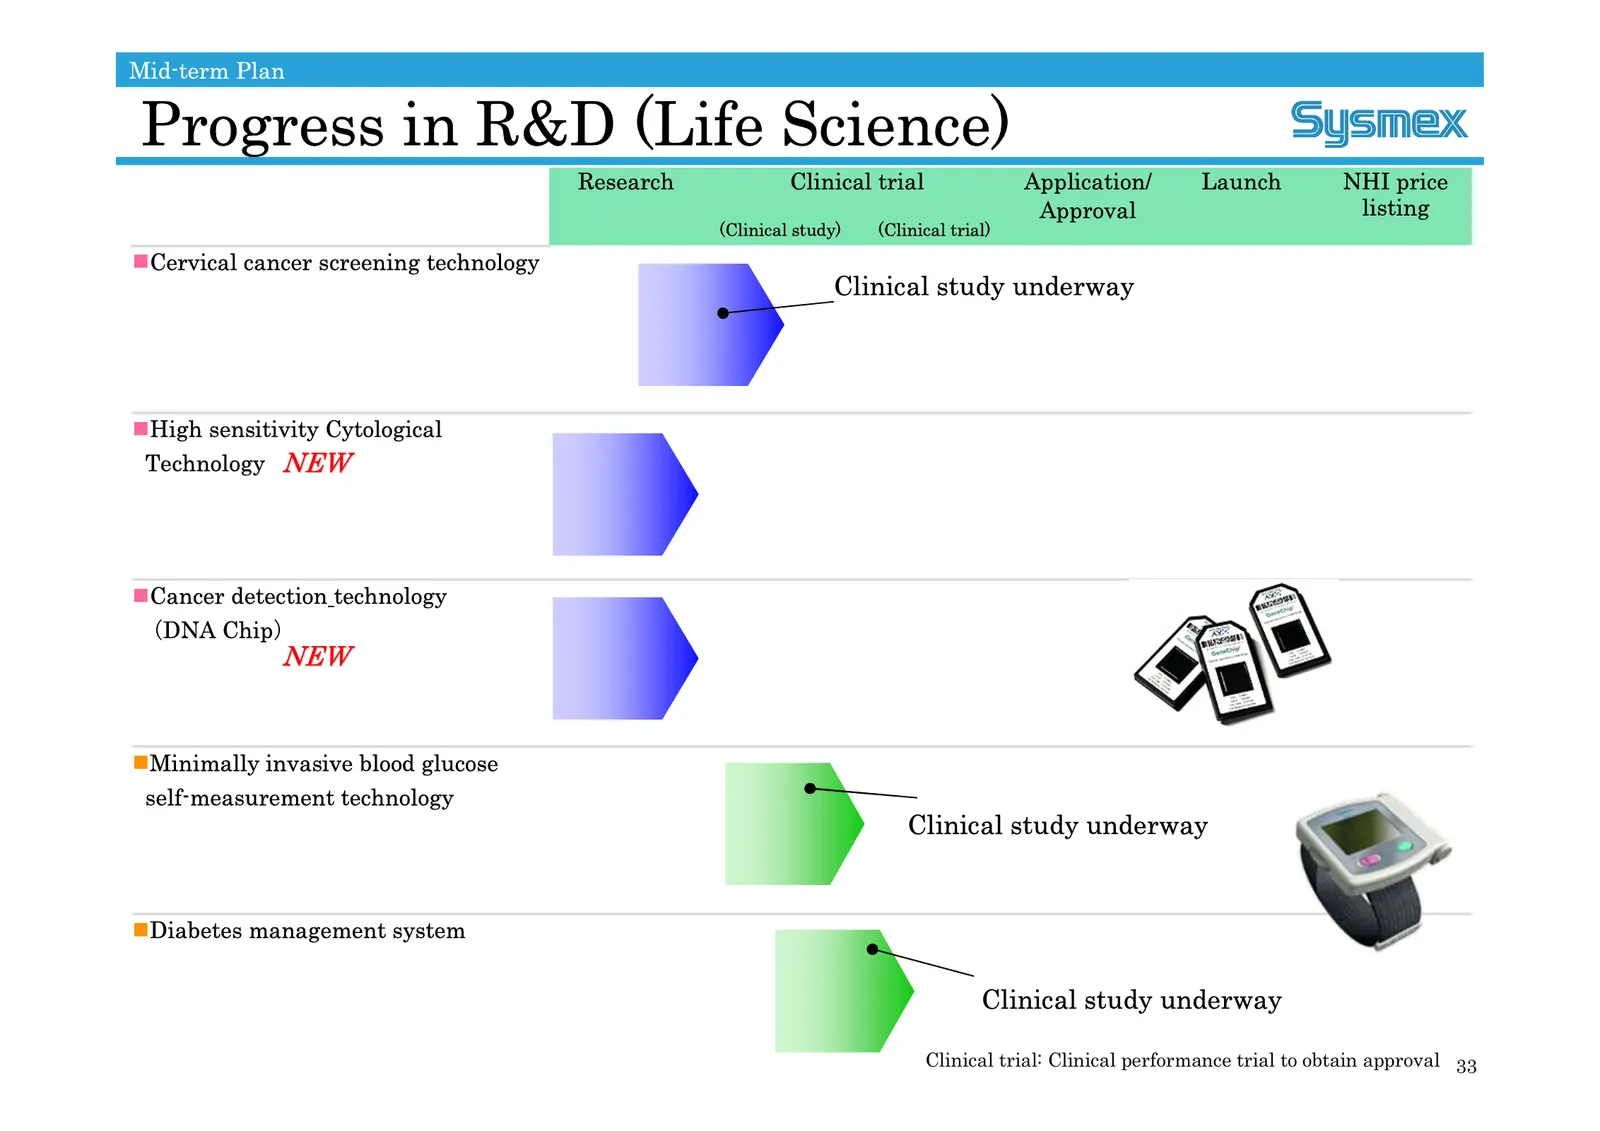
Slide 33: Progress in R&D (Life Science)
Mid-term Plan Progress in R&D (Life Science) Research Clinical trial Application/ Launch NHI price Approval listing (Clinical study) (Clinical trial) Cervical cancer screening technology Clinical study underway High sensitivity Cytological Technology NEW Cancer detection technology (DNA Chip) NEW
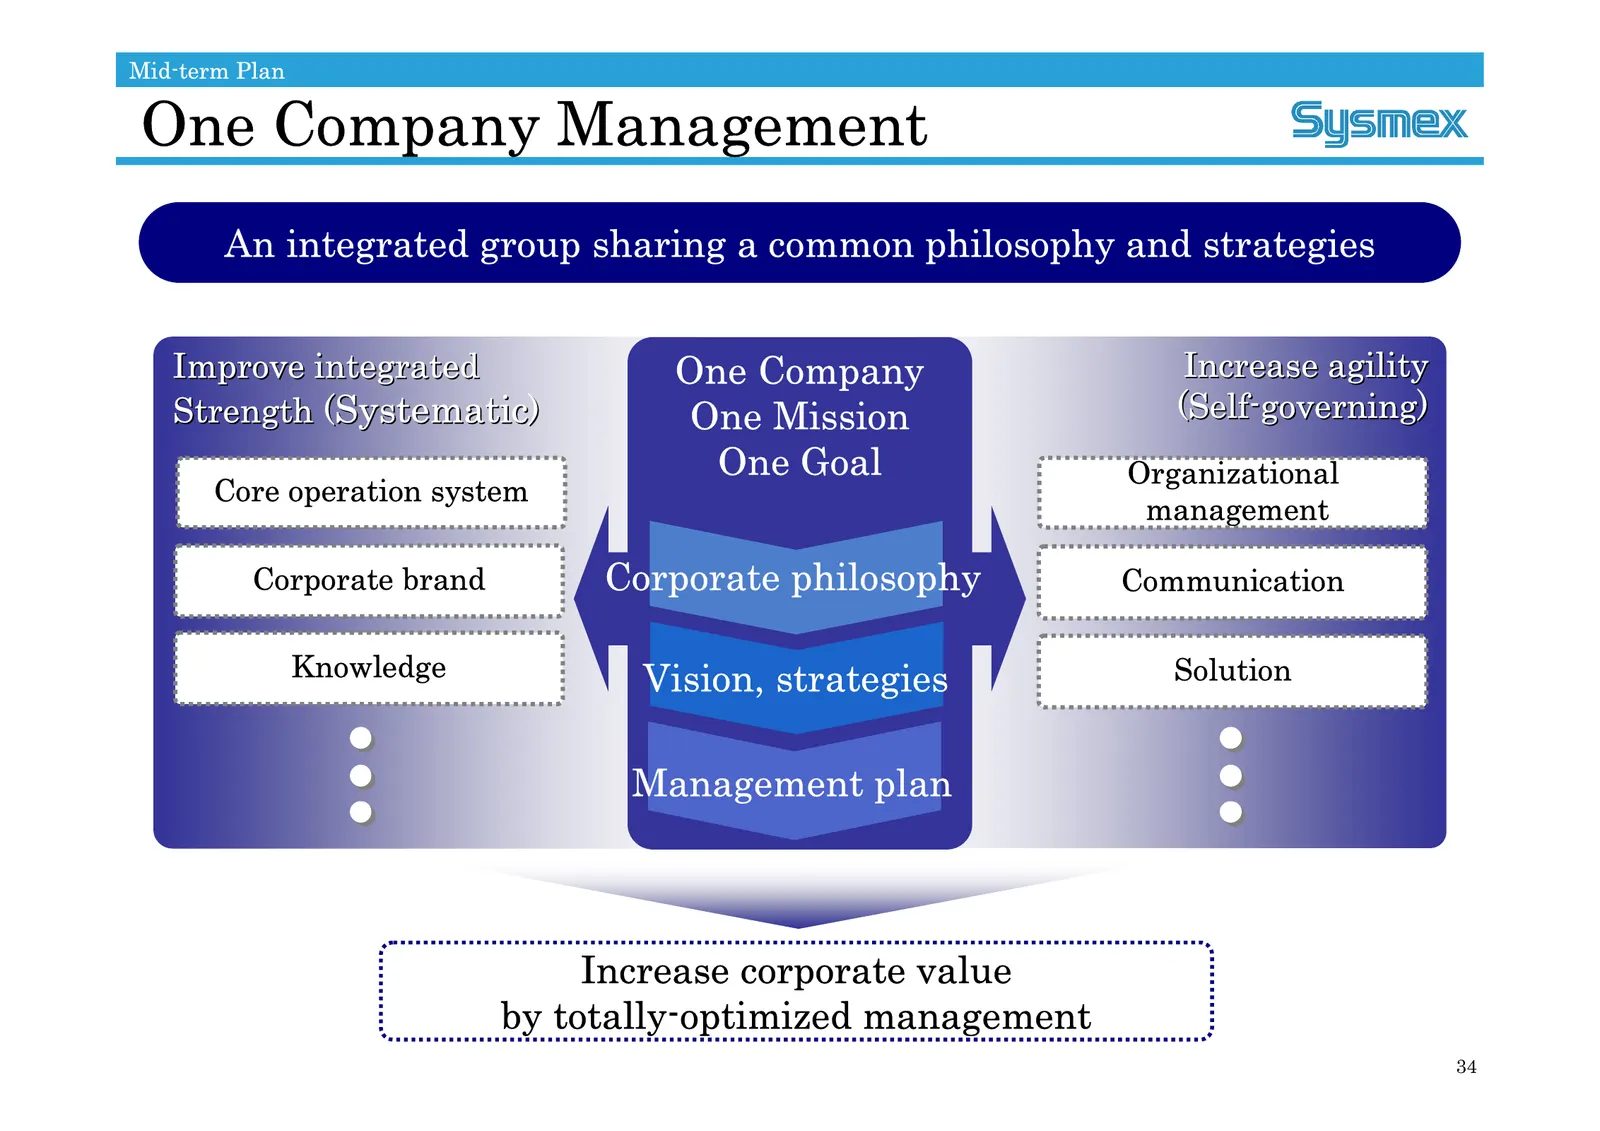
Slide 34: One Company Management
Mid-term Plan One Company Management An integrated group sharing a common philosophy and strategies Improve integrated One Company Increase agility Strength (Systematic) One Mission (Self-governing) One Goal Organizational Core operation system management Corporate brand Corporate philosophy Communi
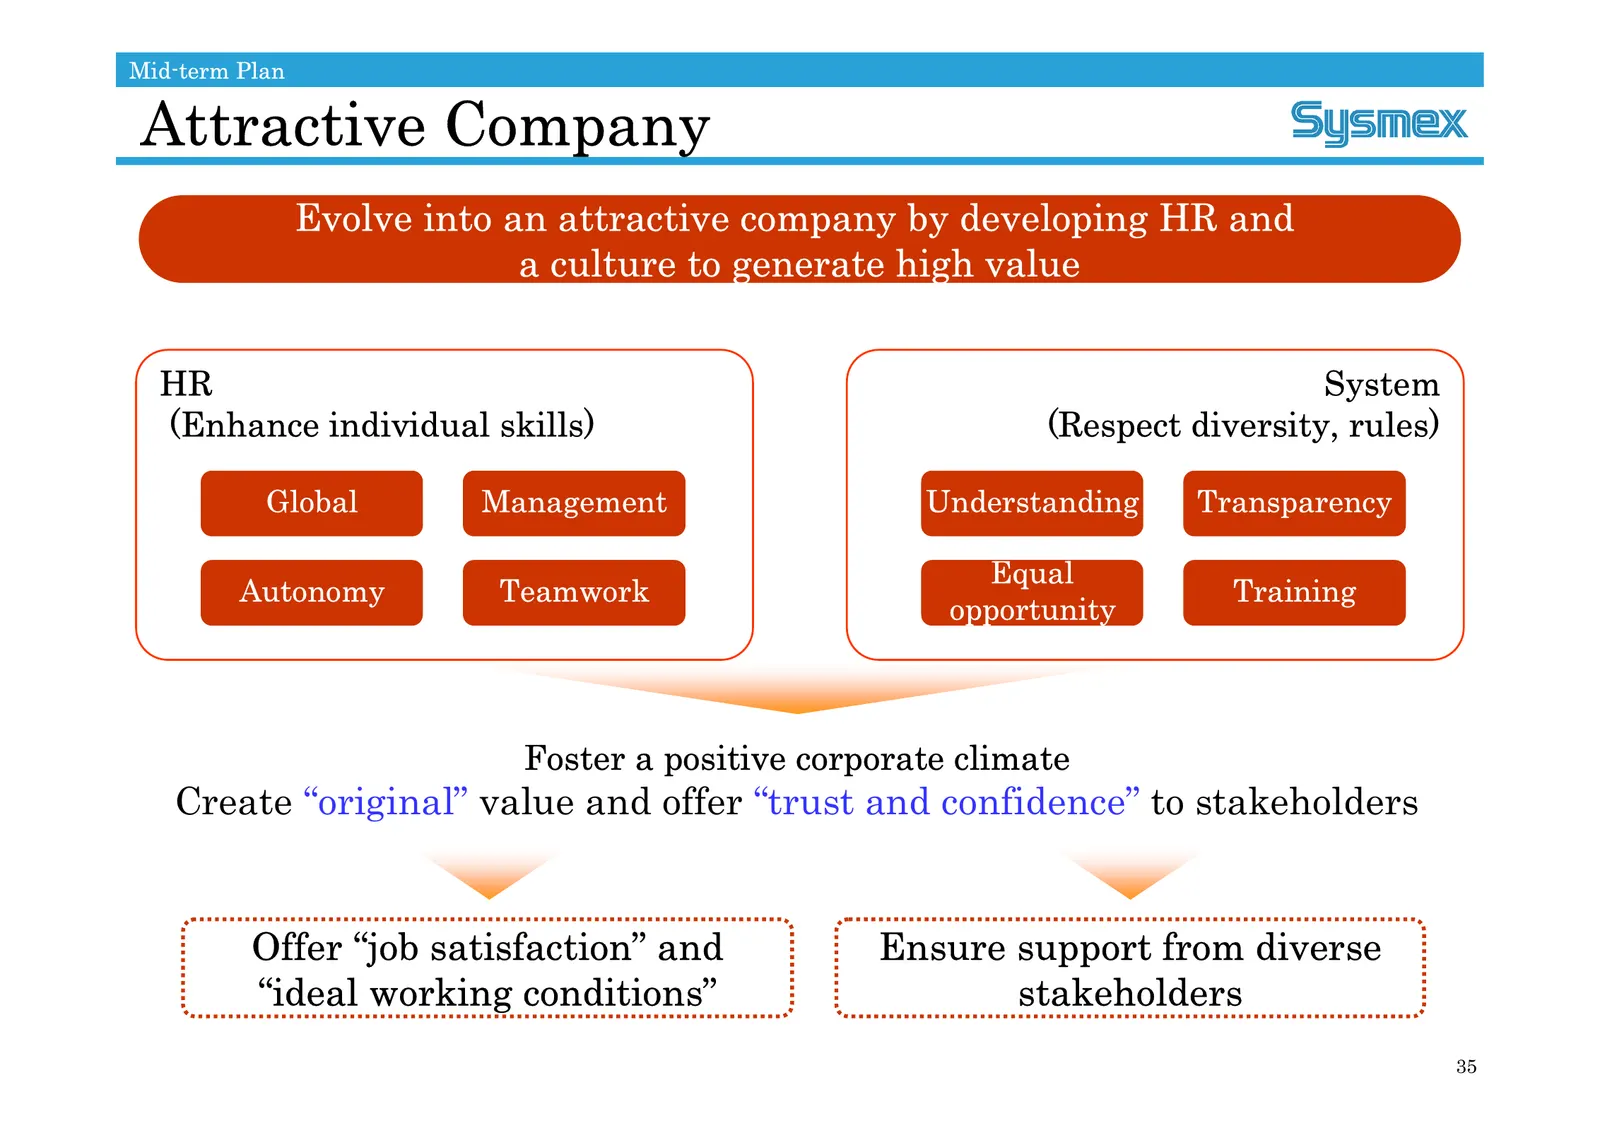
Slide 35: Attractive Company
Mid-term Plan Attractive Company Evolve into an attractive company by developing HR and a culture to generate high value HR System (Enhance individual skills) (Respect diversity, rules) Global Management Understanding Transparency Equal Autonomy Teamwork Training opportunity Foster a positive corpor
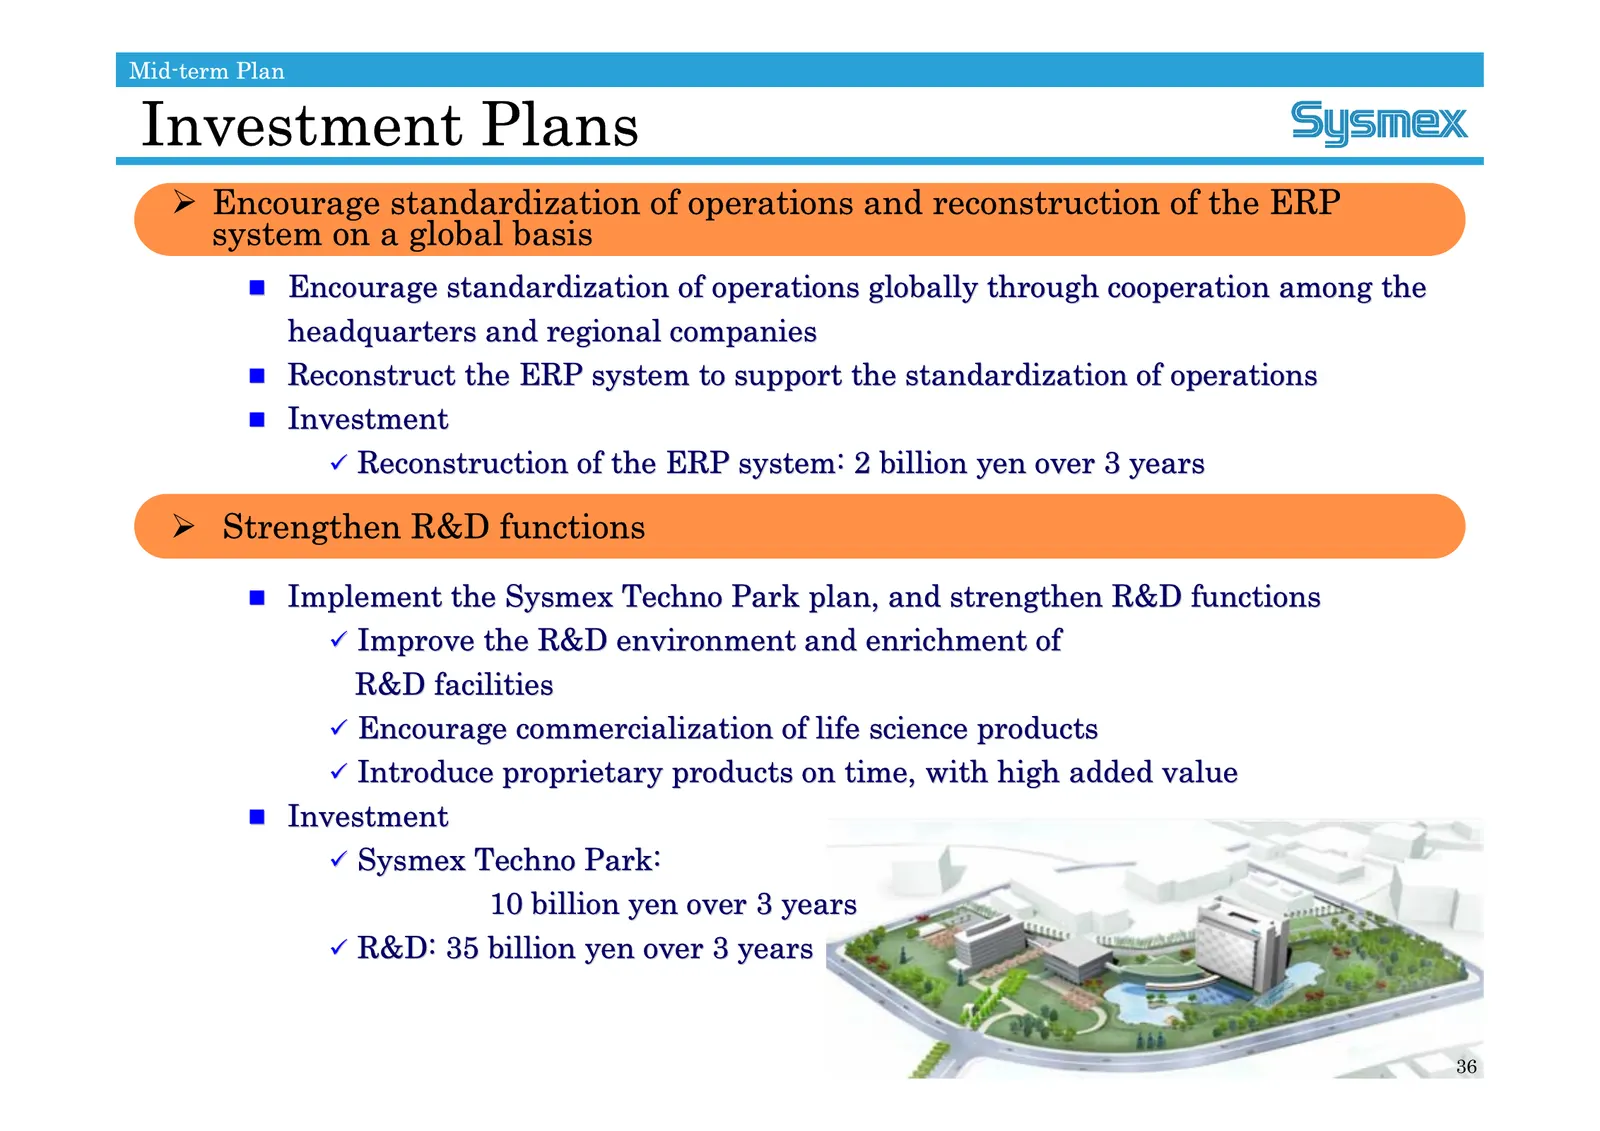
Slide 36: Investment Plans
Mid-term Plan Investment Plans ¾ Encourage standardization of operations and reconstruction of the ERP system on a global basis Encourage standardization of operations globally through cooperation cooperation among the headquarters and regional companies Reconstruct the ERP system to support the
Slide 37: FY2007 Consolidated Earnings Forecast
FY2007 Consolidated Earnings Forecast • FY2007 Consolidated Earnings Forecast • Projected Dividend for FY2007 A Unique & Global Healthcare Testing Company
Slide 38: FY2007 Consolidated Earnings Forecast
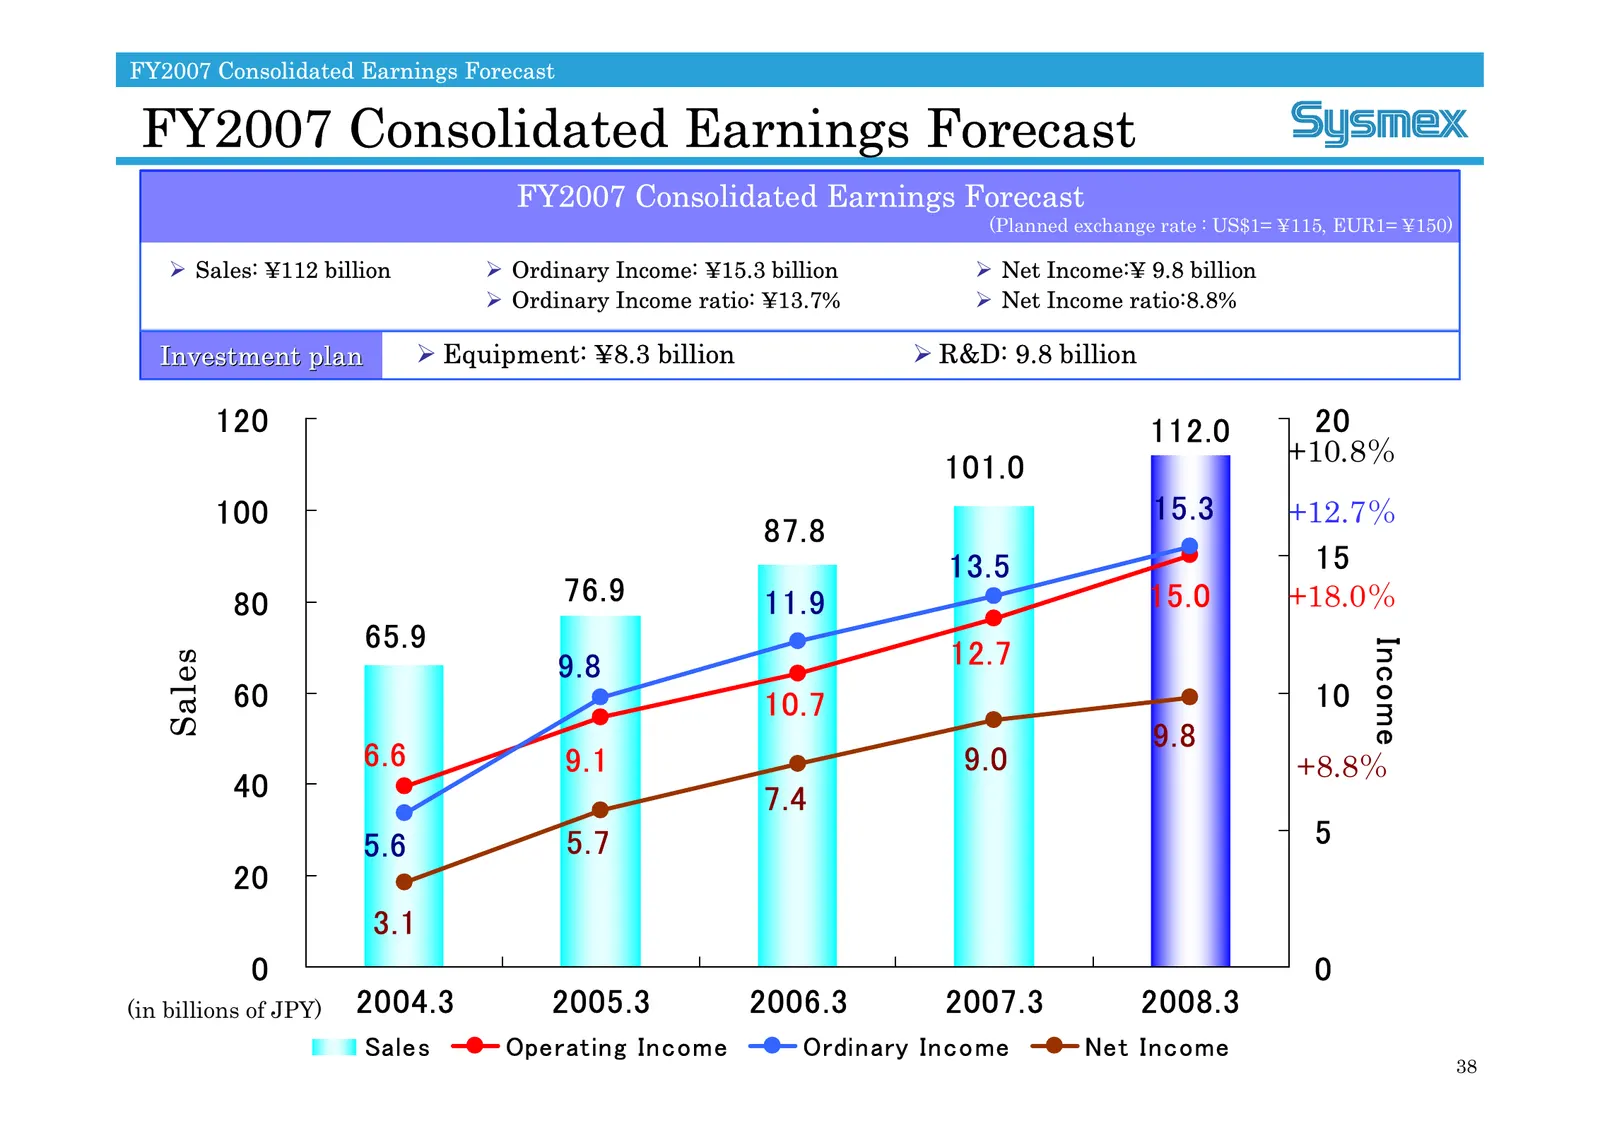
FY2007 Consolidated Earnings Forecast FY2007 Consolidated Earnings Forecast FY2007 Consolidated Earnings Forecast (Planned exchange rate : US$1= ¥115, EUR1= ¥150) ¾ Sales: ¥112 billion ¾ Ordinary Income: ¥15.3 billion ¾ Net Income:¥ 9.8 billion ¾ Ordinary Income ratio: ¥13.7% ¾ Net Income ratio:8.8%
Slide 39: Projected Dividend for FY2007
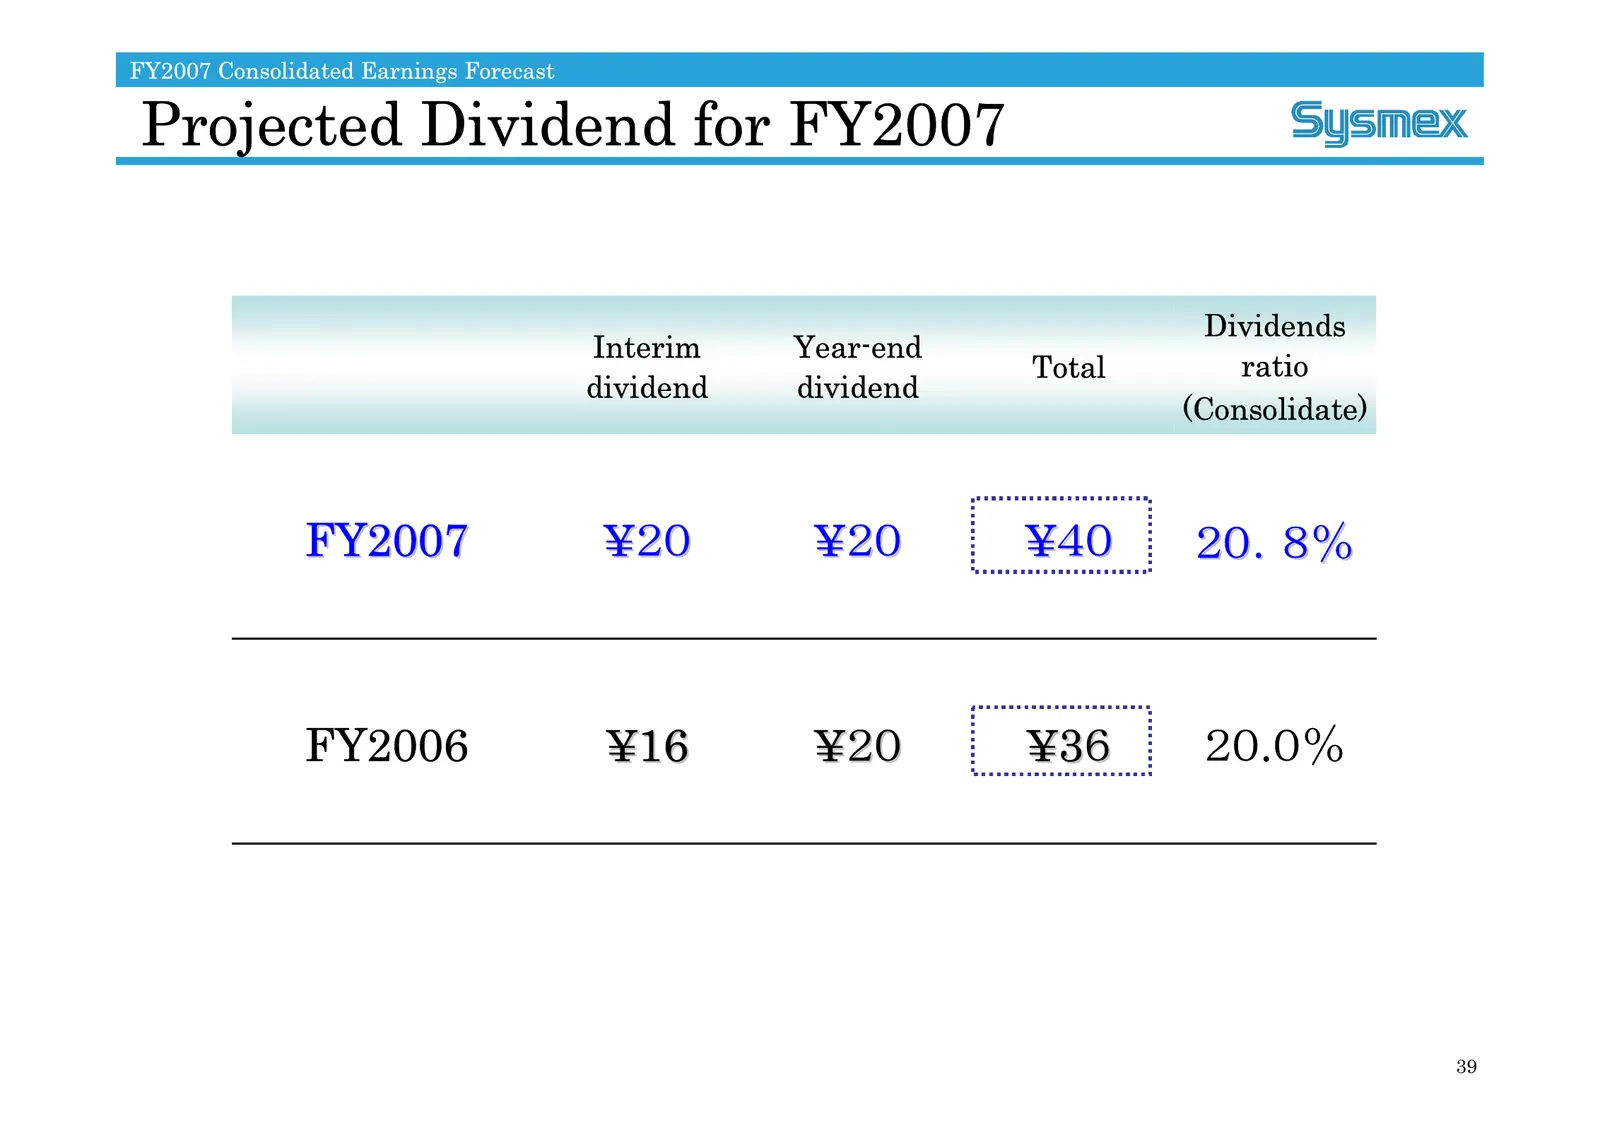
FY2007 Consolidated Earnings Forecast Projected Dividend for FY2007 Dividends Interim Year-end Total ratio dividend dividend (Consolidate) FY2007 ¥20 ¥20 ¥40 20.8% FY2006 ¥16 ¥20 ¥36 20.0% 39
Slide 40: Challenging the Frontiers of Healthcare Testing
Challenging the Frontiers of Healthcare Testing SYSMEX CORPORATION <Contact> IR & Corporate Communication Div. Phone: 81-078-265-0500 Email: info@sysmex.co.jp URL: www.sysmex.co.jp END A Unique & Global Healthcare Testing Company
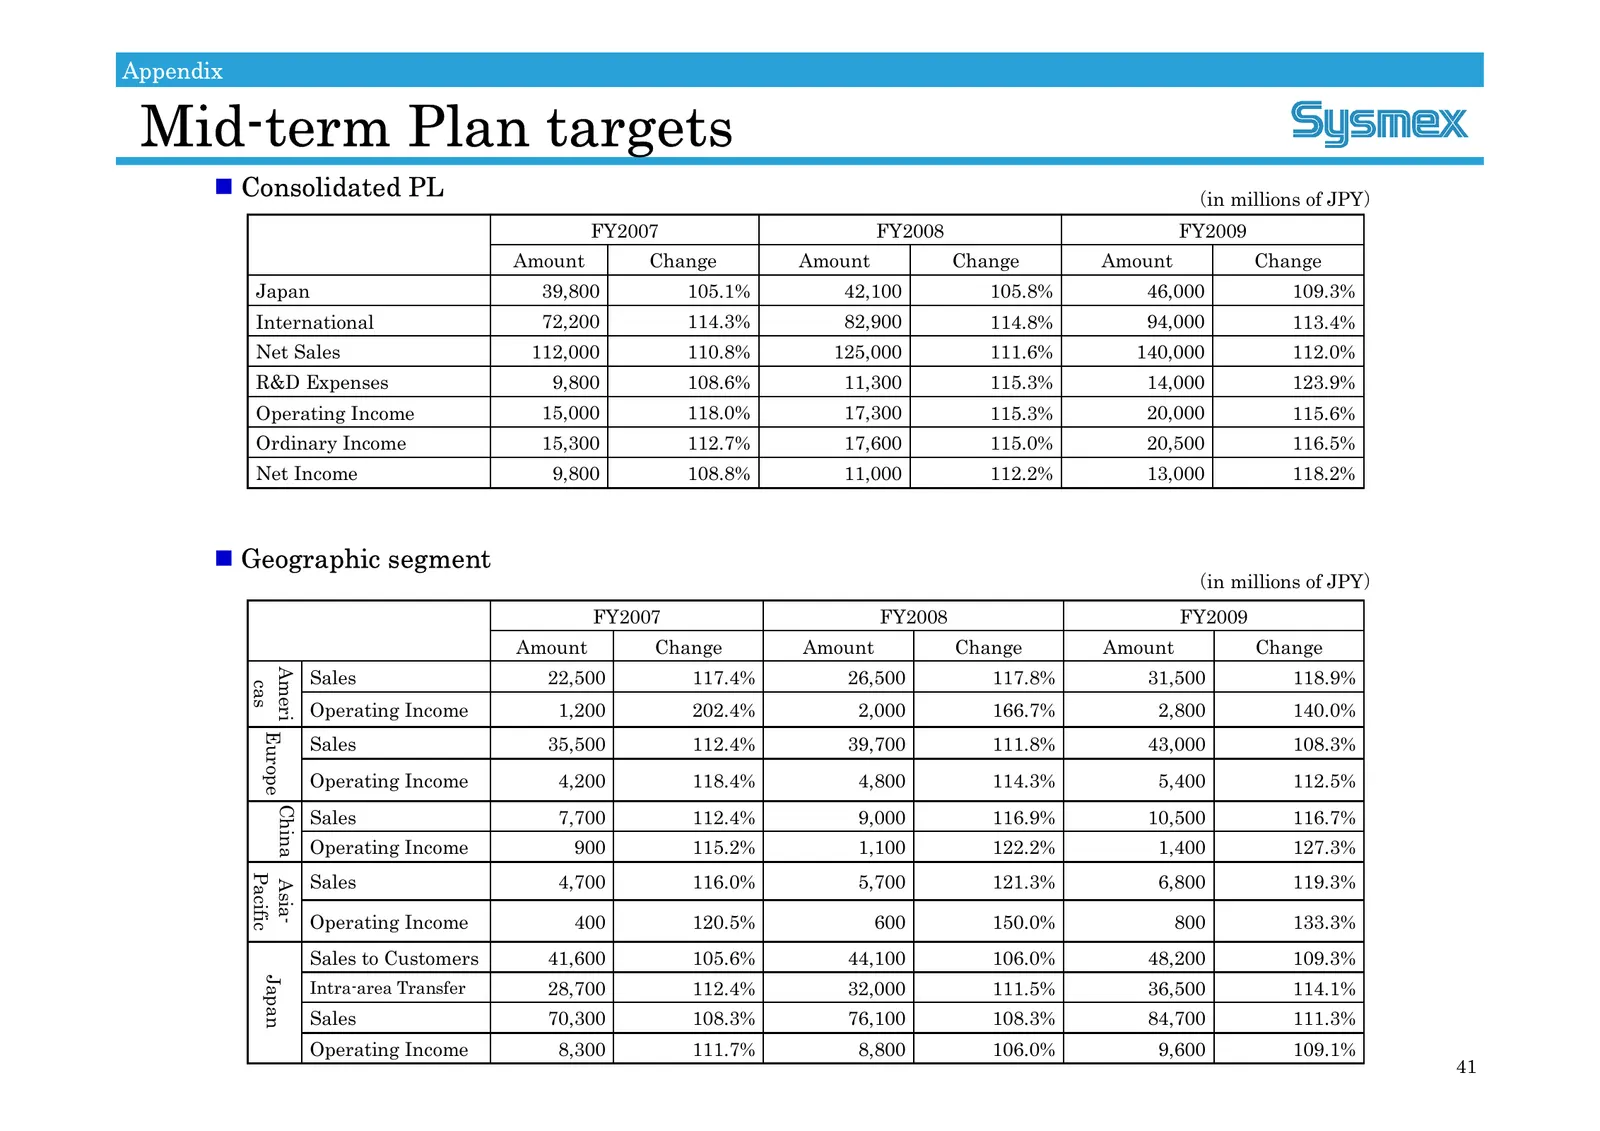
Slide 41: Mid-term Plan targets
Appendix Mid-term Plan targets Consolidated PL (in millions of JPY) FY2007 FY2008 FY2009 Amount Change Amount Change Amount Change Japan 39,800 105.1% 42,100 105.8% 46,000 109.3% International 72,200 114.3% 82,900 114.8% 94,000 113.4% Net Sales 112,000 110.8% 125,000 111.6% 140,000 112.0% R&D Expe
Source: Internet Archive copy of sysmex.co.jp
More decks from Sysmex Corporation
 Investor Presentation (November 2026)43 slides · Nov 10, 2026
 Q1 FY2027 Earnings Presentation33 slides · Aug 7, 2026
 Investor Presentation (2025)43 slides · 2025
 FY2011 Earnings Presentation23 slides · May 10, 2012
 FY2012 Earnings Presentation23 slides · May 10, 2012
 9M FY2012 Earnings Presentation12 slides · Feb 3, 2012