Sysmex Corporation · TSE:6869
Sysmex — FY2005 Earnings Presentation
40 slides from Sysmex's earnings presentation, May 2006
Slide 1: Business Results FY2005
A Unique & Global Healthcare Testing Company Business Results FY2005 Financial Highlights and Future Opportunities Hisashi Ietsugu President and CEO
Slide 2: Contents
Contents Financial Highlights of FY2005 ¾ Topics ¾ Outline of FY2005 ¾ Progress of Mid-term Plan Future Opportunities ¾ Market Scenarios ¾ Strategies/Targets ¾ Future Endeavors ¾ Consolidated Earnings Forecast of FY2006 Forward-looking Statements This material contains forward-looking statements
Slide 3: Financial Highlights of FY2005
Financial Highlights of FY2005 Topics Outline of FY2005 Progress of Mid-term Plan A Unique & Global Healthcare Testing Company
Slide 4: Topics
Financial Highlights of FY2005 Topics A Unique & Global Healthcare Testing Company
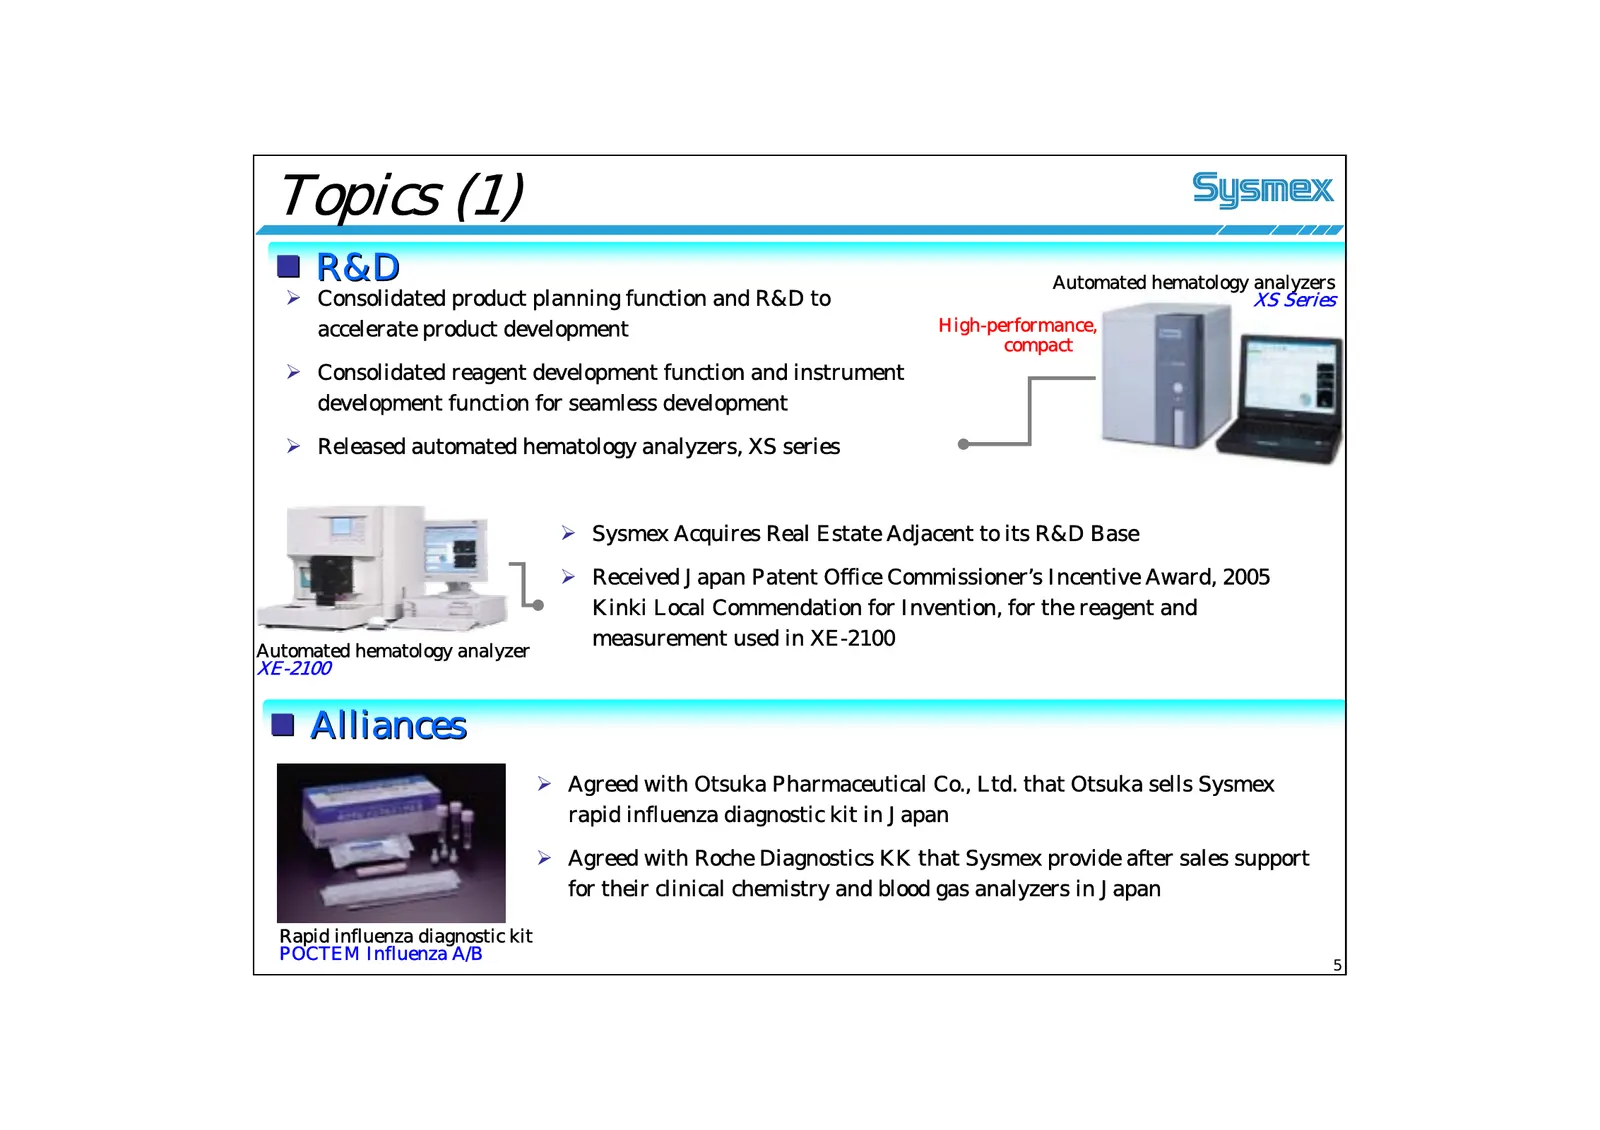
Slide 5: Topics (1)
Topics (1) R&D Automated hematology analyzers ¾ Consolidated product planning function and R&D to XS Series accelerate product development High-performance, compact ¾ Consolidated reagent development function and instrument development function for seamless development ¾ Released automated hematol
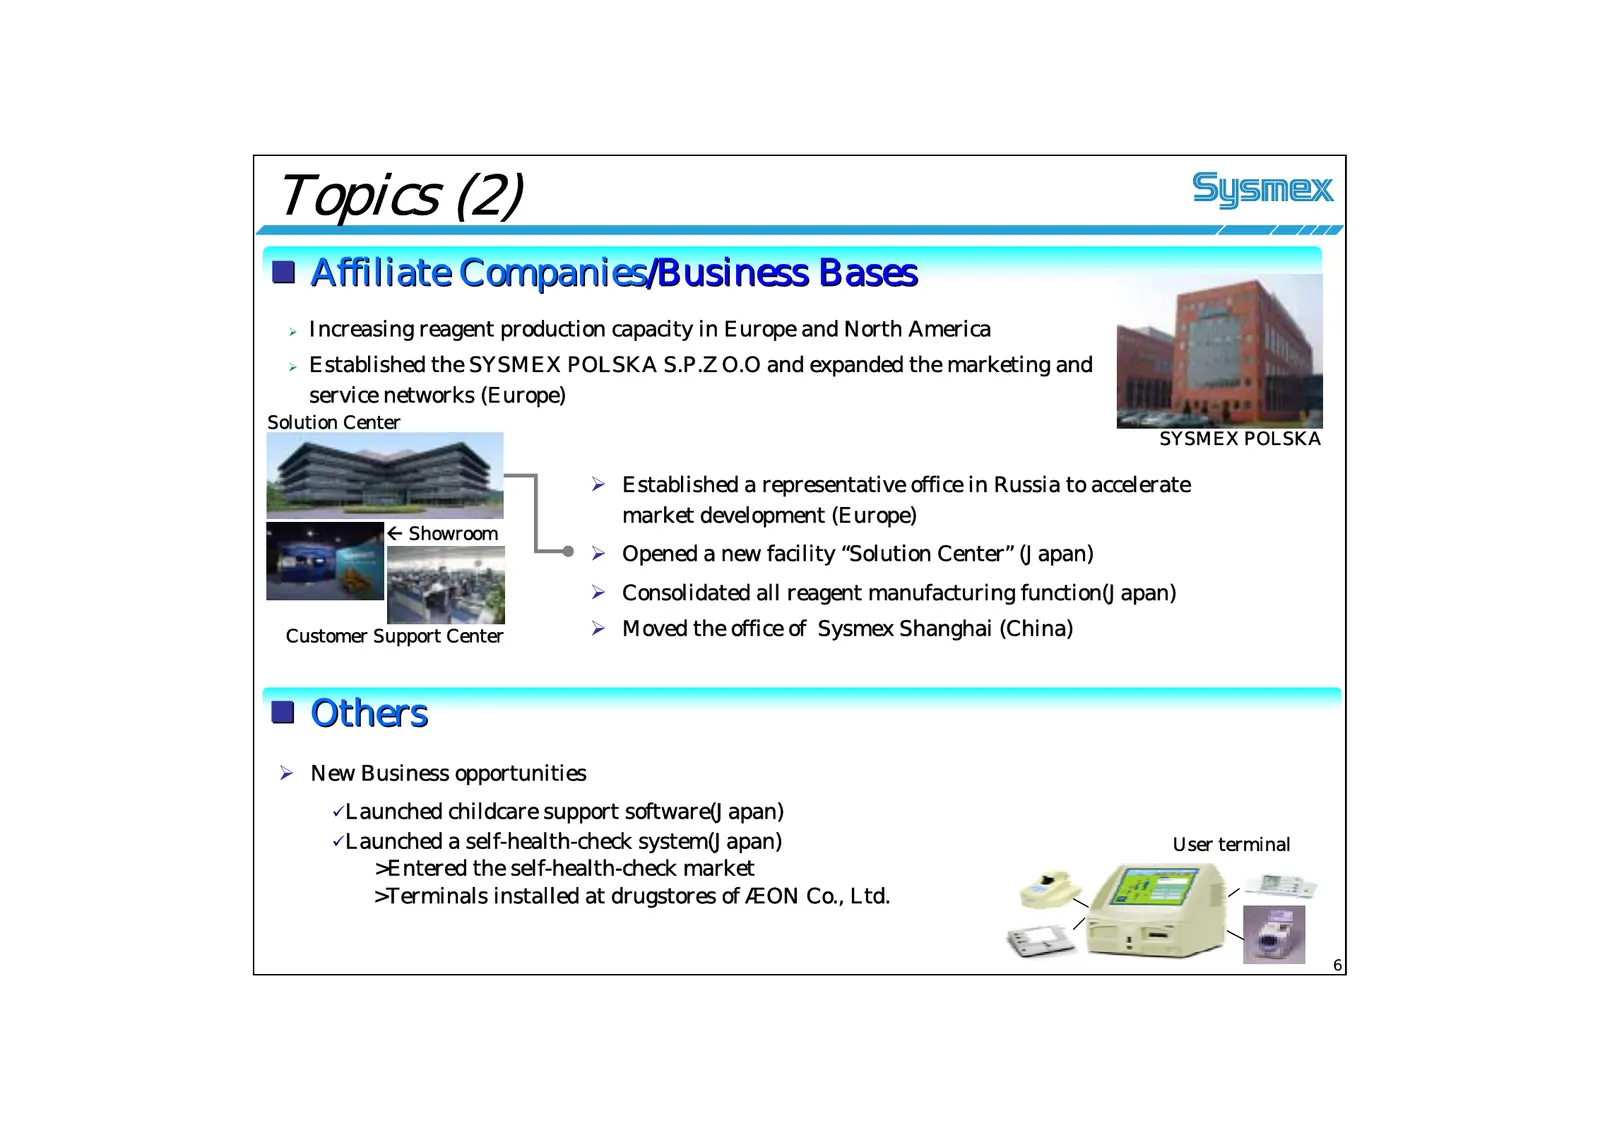
Slide 6: Topics (2)
Topics (2) Affiliate Companies/Business Bases ¾ Increasing reagent production capacity in Europe and North America ¾ Established the SYSMEX POLSKA S.P.Z O.O and expanded the marketing and service networks (Europe) Solution Center SYSMEX POLSKA ¾ Established a representative office in Russia to acc
Slide 7: Outline of FY2005
Financial Highlights of FY2005 Outline of FY2005 A Unique & Global Healthcare Testing Company
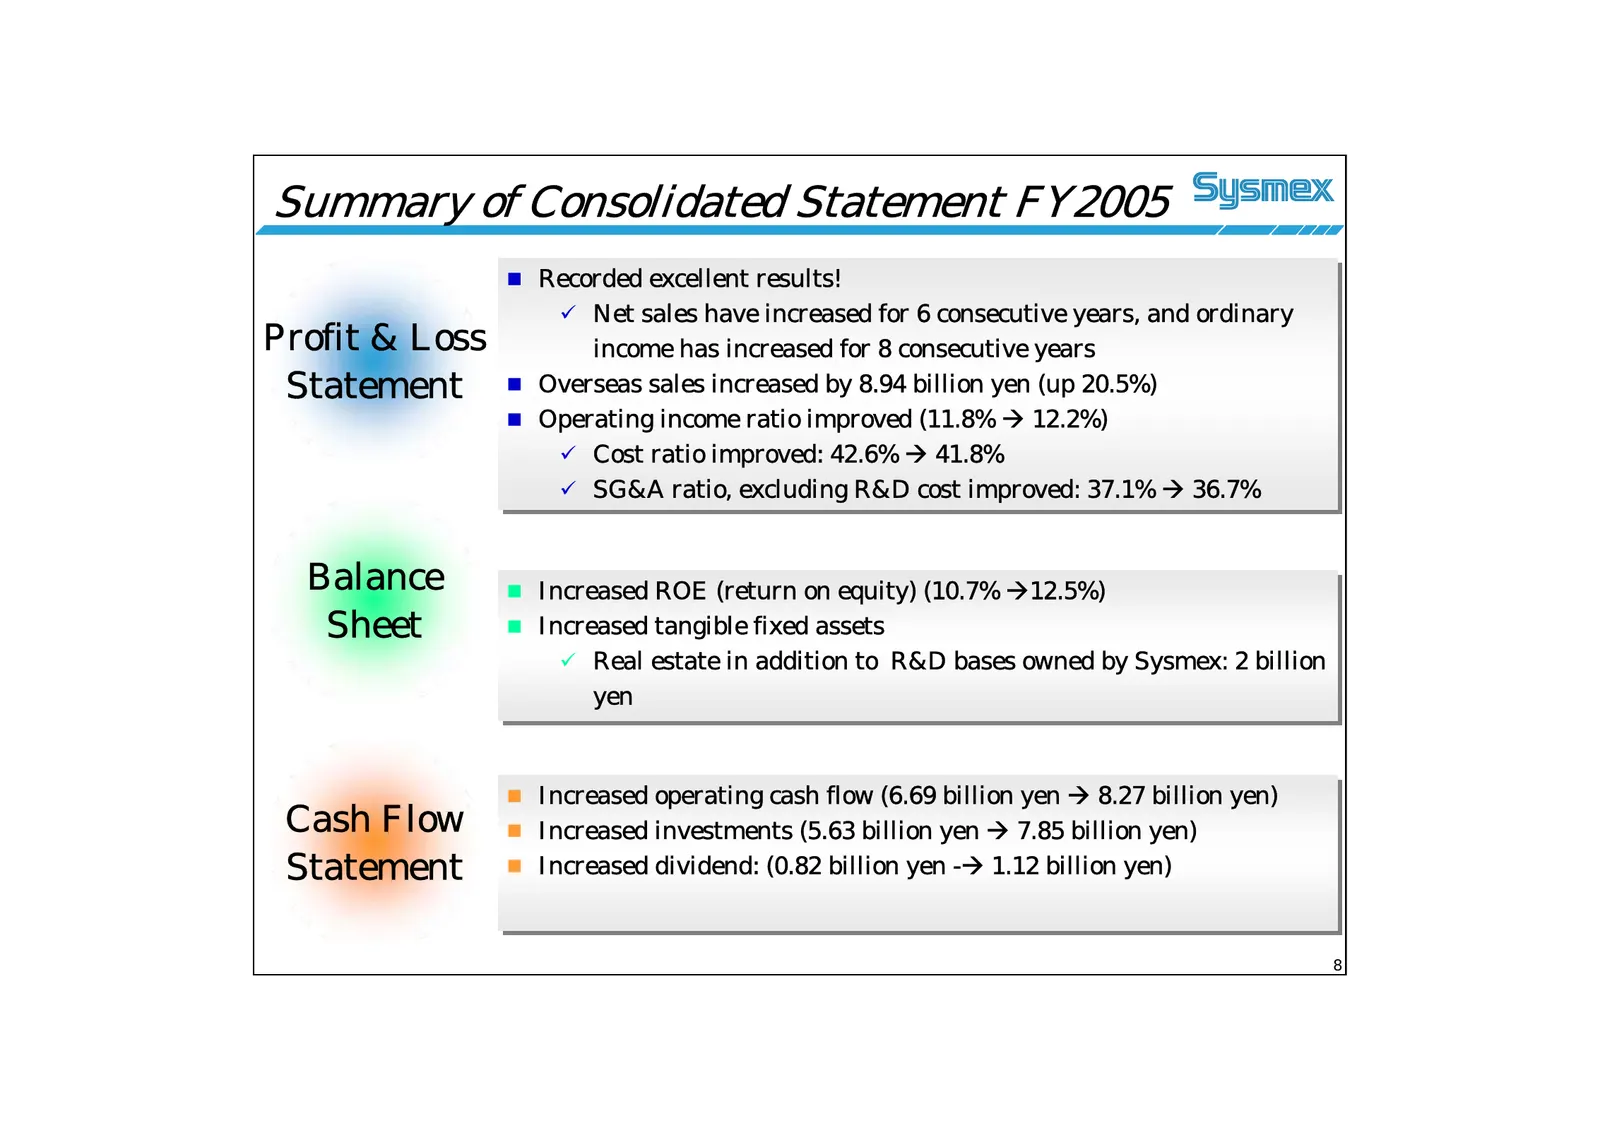
Slide 8: Summary of Consolidated Statement FY2005
Summary of Consolidated Statement FY2005 Recorded Recorded excellent excellent results! results! 99 Net Net sales sales have have increased increased for for 66 consecutive consecutive years, years, and and ordinary ordinary Profit & Loss income income has has increased increased for for 88 cons
Slide 9: Financial Highlights of FY2005
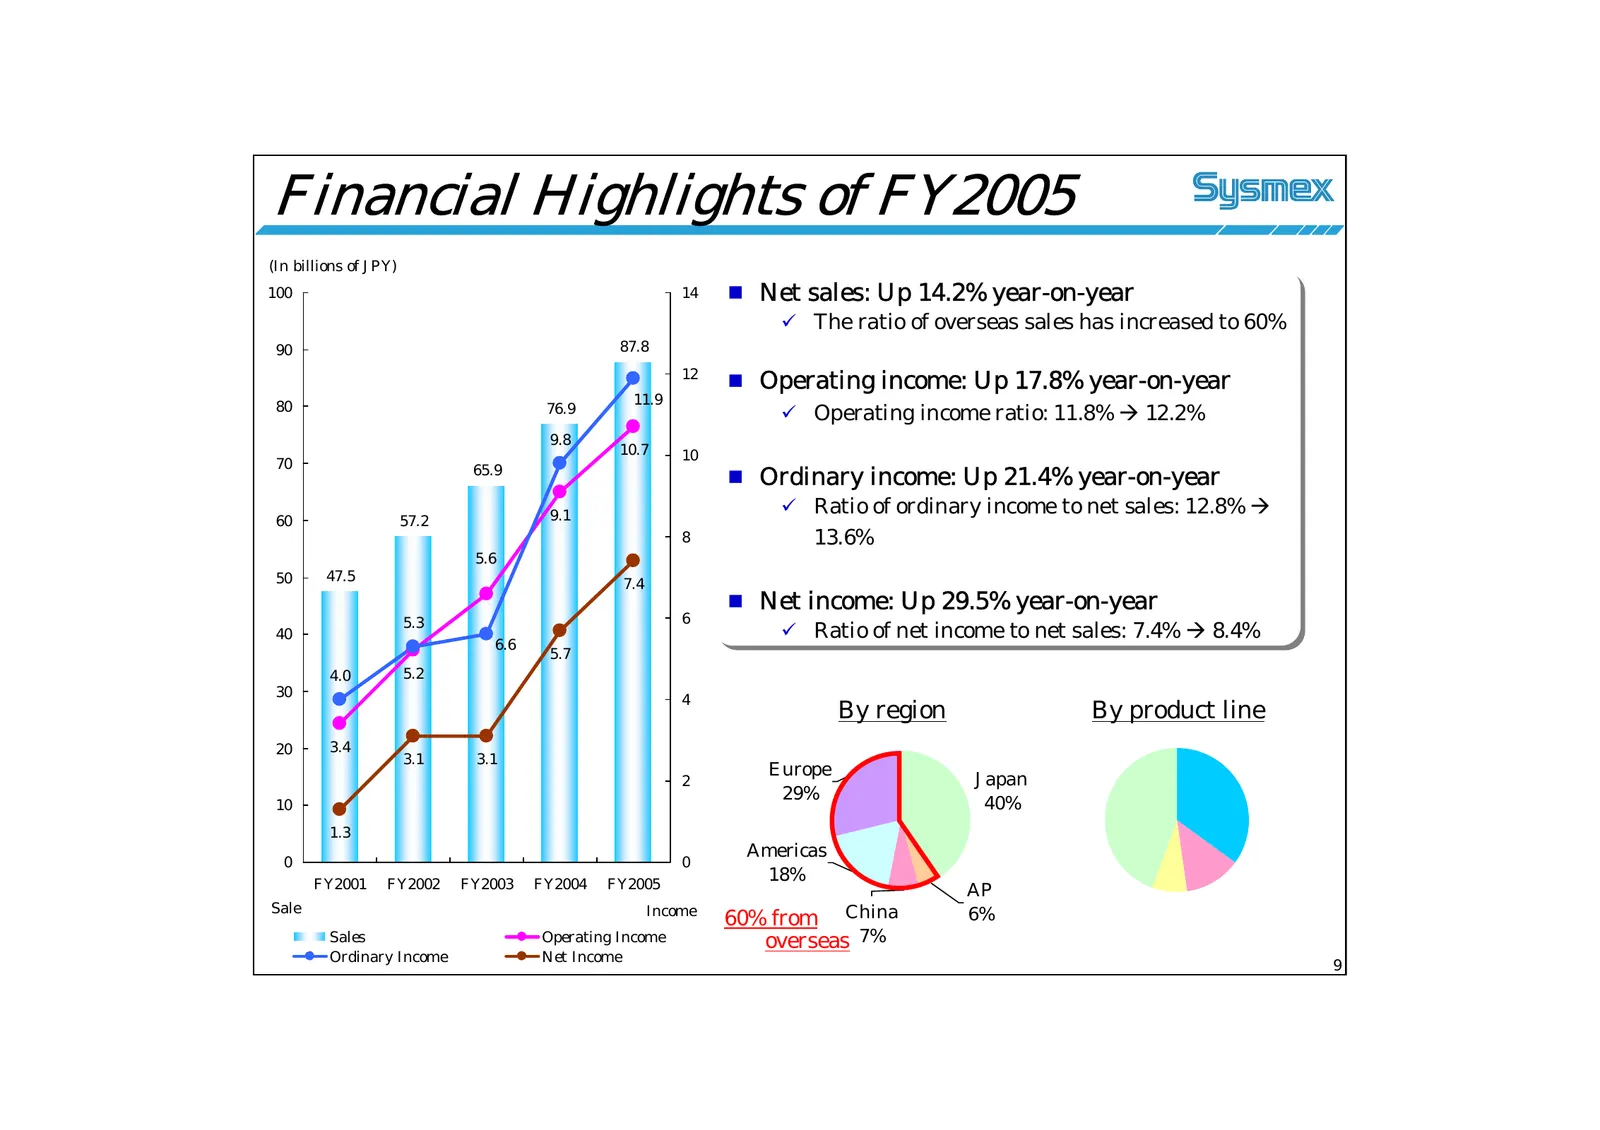
Financial Highlights of FY2005 (In billions of JPY) 100 14 Net Net sales: sales: Up Up 14.2% 14.2% year-on-year year-on-year 99 The The ratio ratio of of overseas overseas sales sales has has increased increased to to 60% 60% 90 87.8 Operating Operating income: income: Up Up 17.8% 17.8% year-o
Slide 10: Breakdown of Net Sales and Ordinary Income
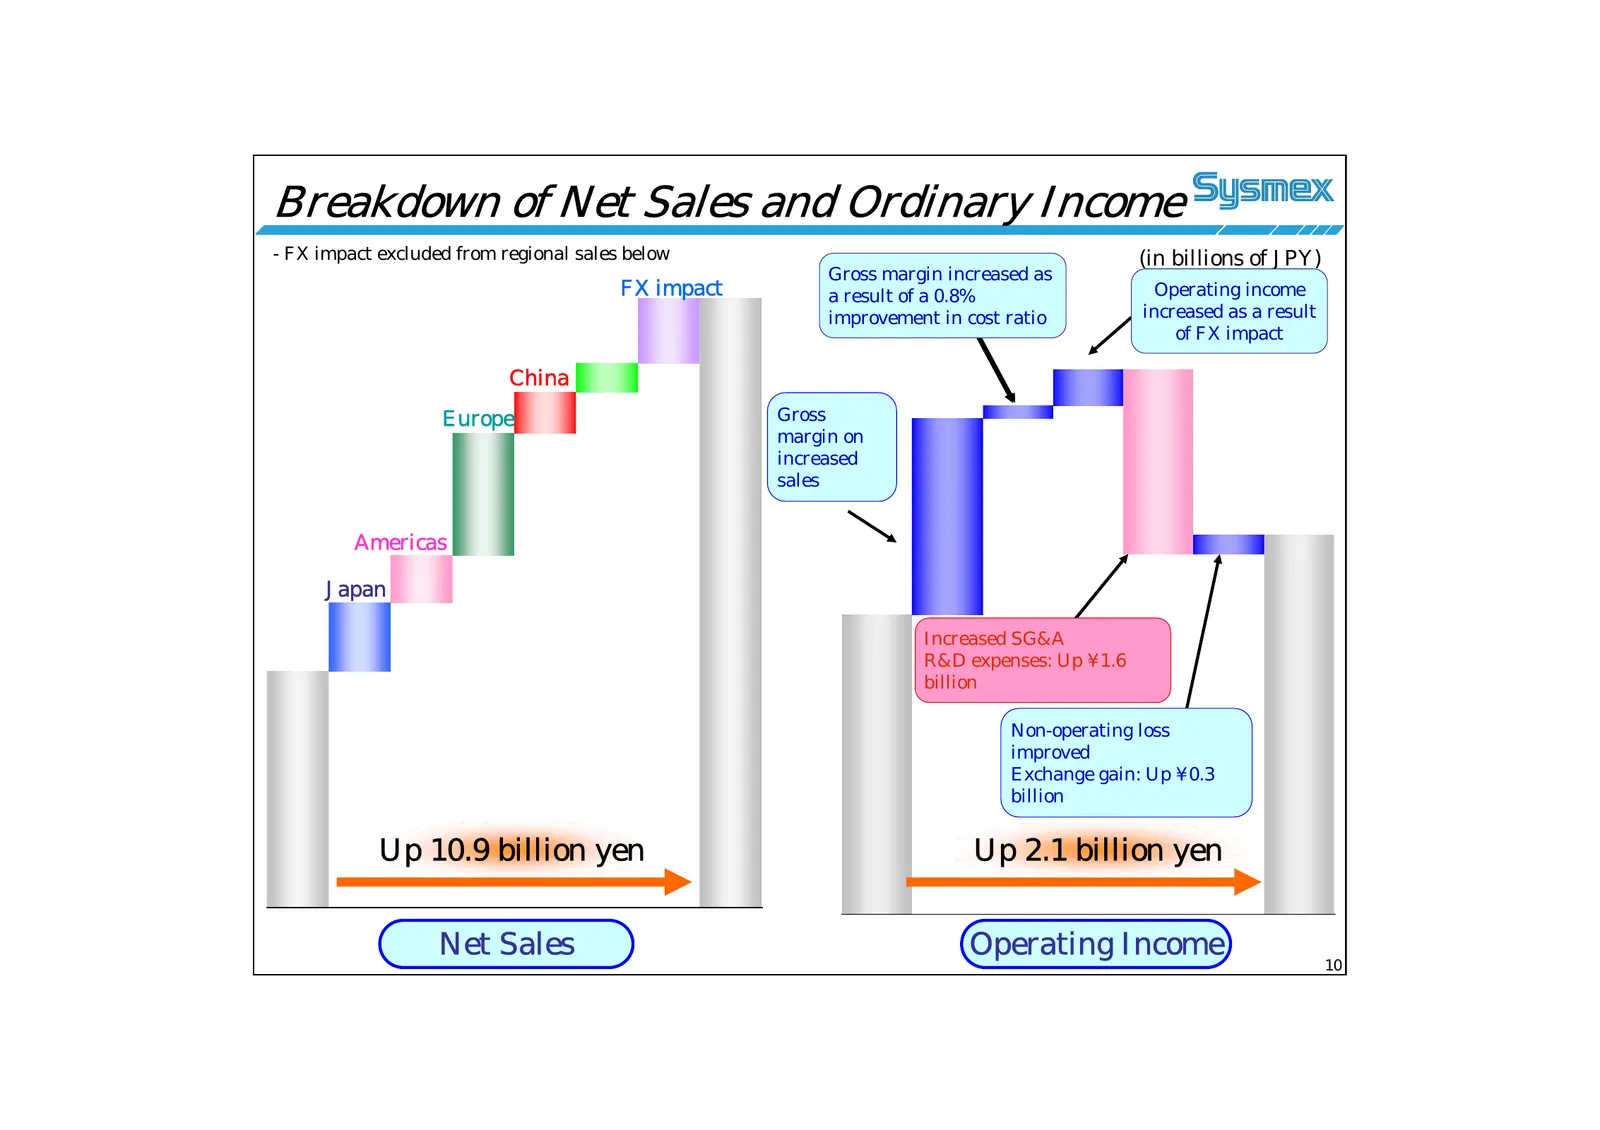
Breakdown of Net Sales and Ordinary Income - FX impact excluded from regional sales below (in billions of JPY) Gross margin increased as FX impact a result of a 0.8% Operating income improvement in cost ratio increased as a result of FX impact China Europe Gross margin on increased sales Americas Ja
Slide 11: Geographic Segment Information
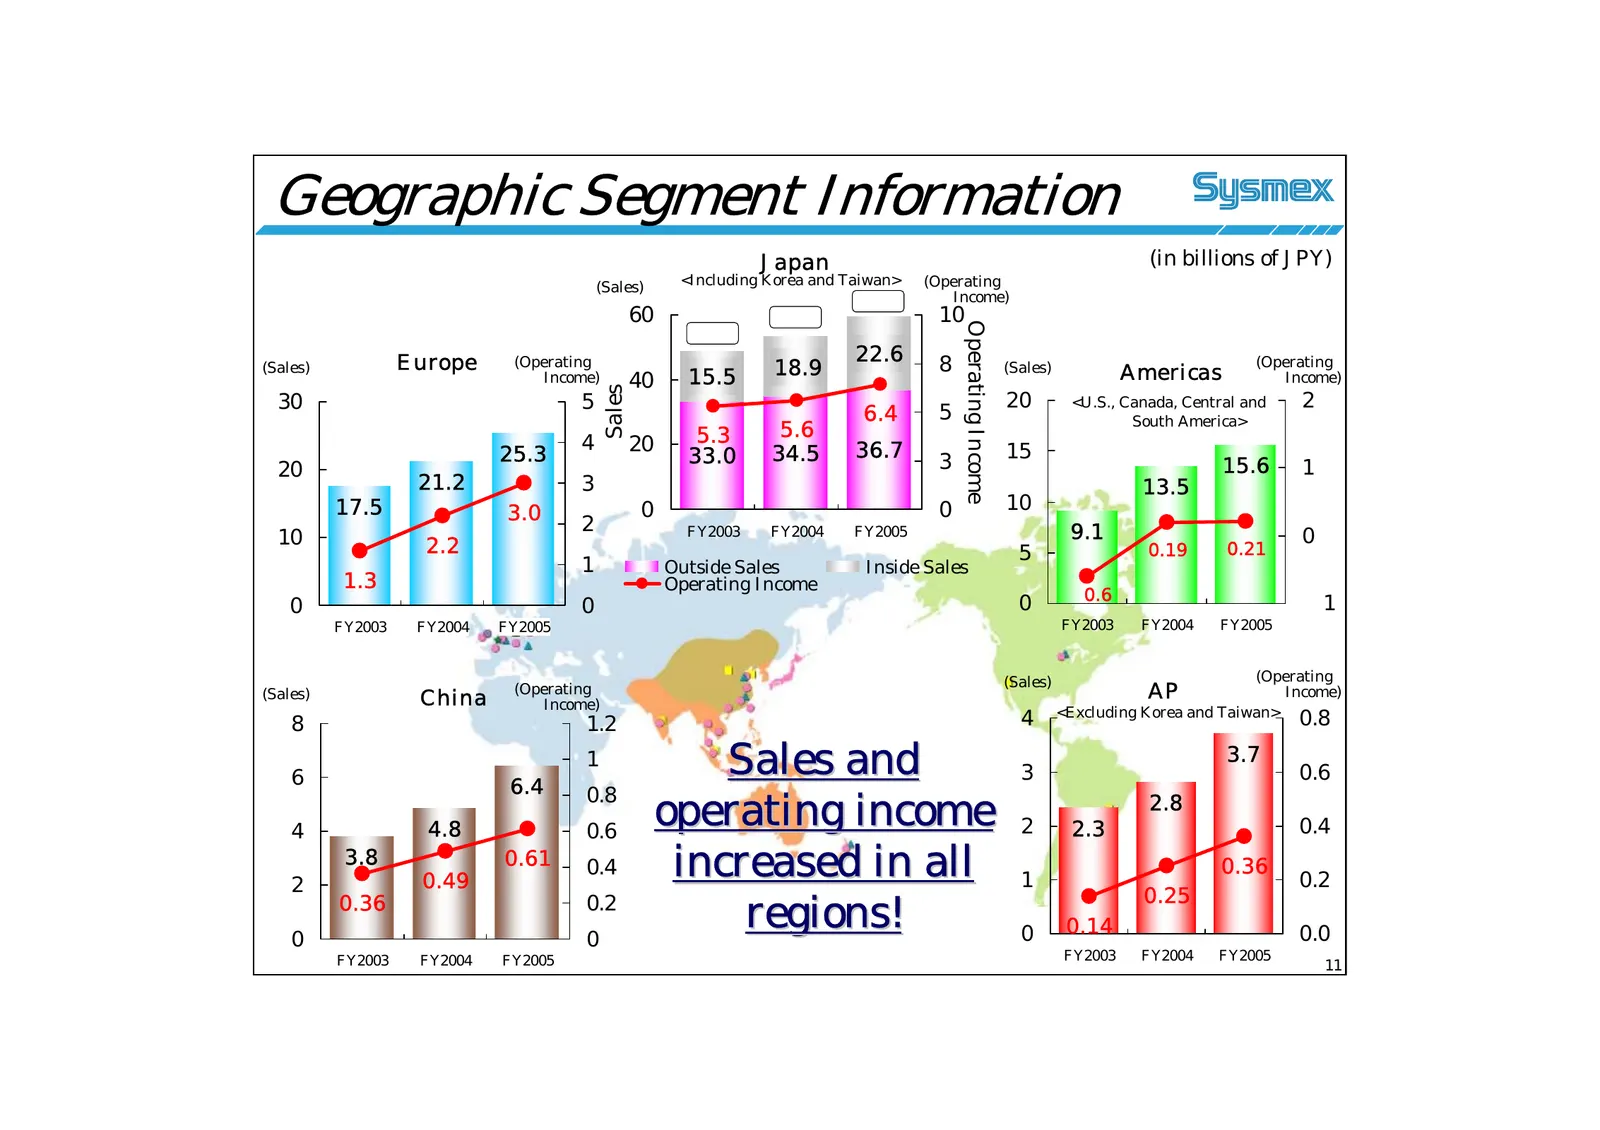
Geographic Segment Information Japan (in billions of JPY) (Sales) <Including Korea and Taiwan> (Operating Income) 60 10 Operating Income Europe (Operating 22.6 8 (Operating (Sales) 15.5 18.9 (Sales) Americas Income) 40 Income) Sales 30 5 20 <U.S., Canada, Central and 2 6.4 5 South America> 5.3 5.6 4
Slide 12: Breakdown of Balance Sheet (Consolidated)
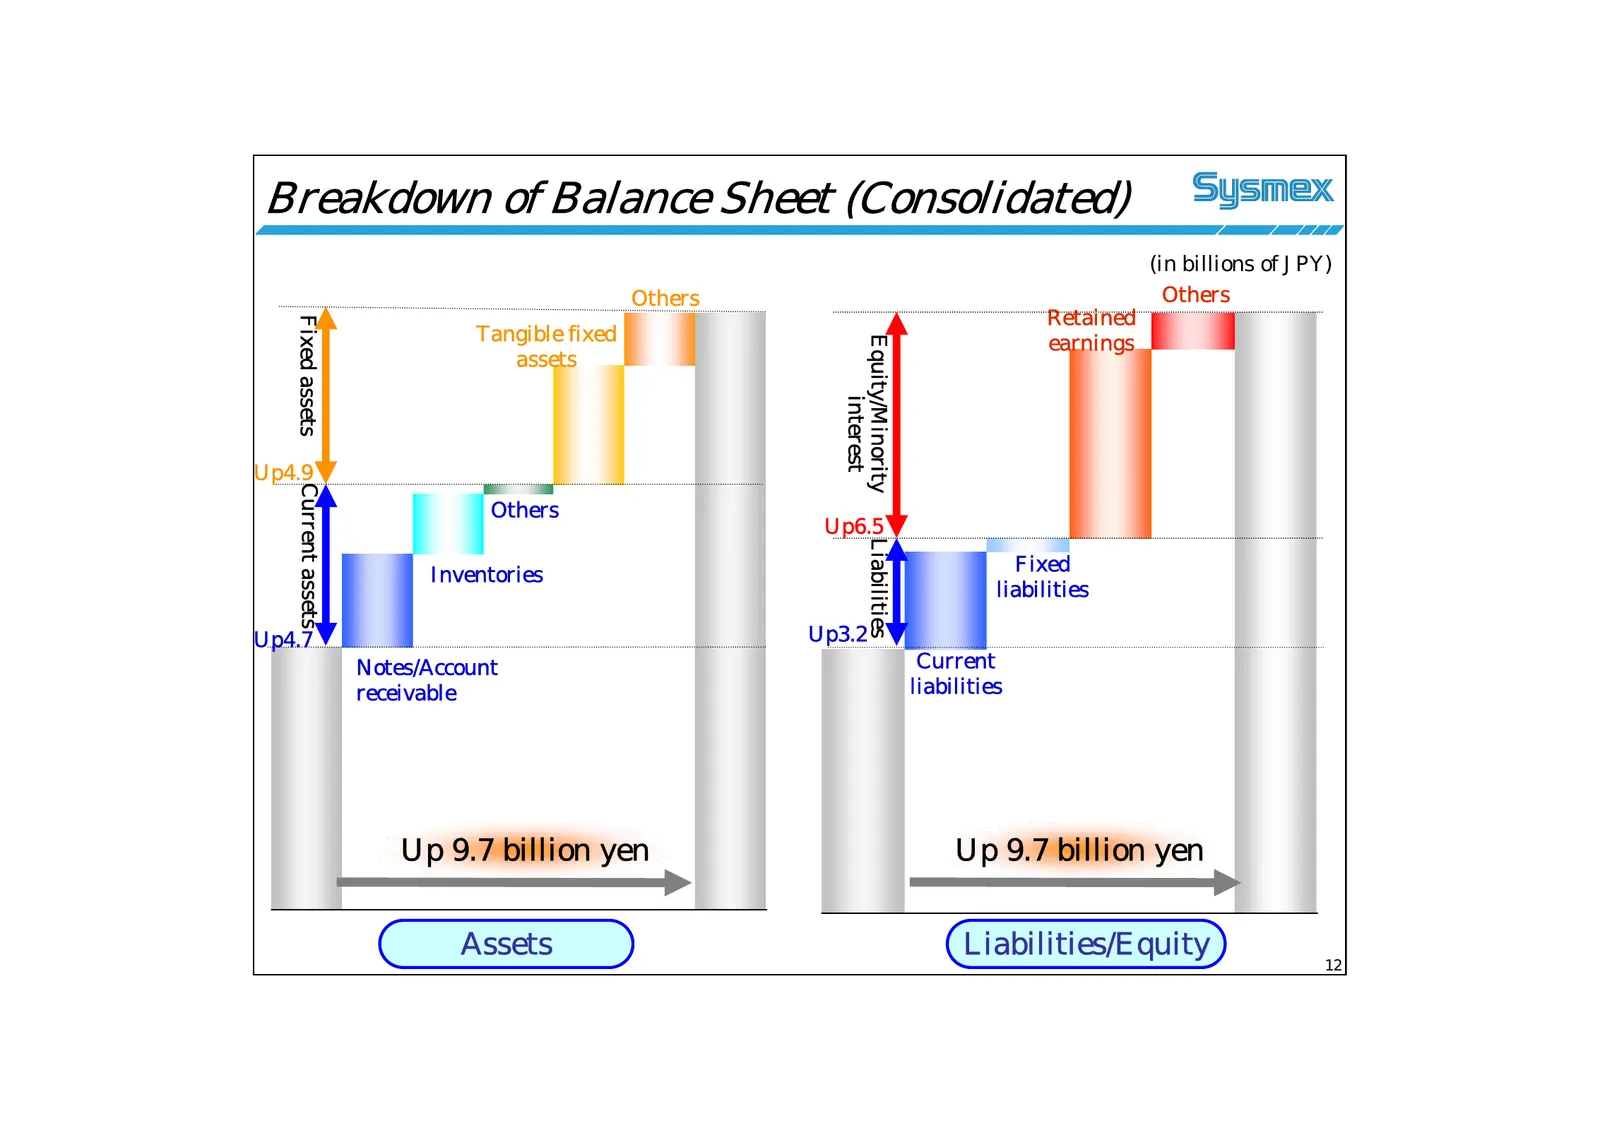
Breakdown of Balance Sheet (Consolidated) (in billions of JPY) Others Others Retained Fixed assets Tangible fixed earnings Equity/Minority assets interest Up4.9 Current assets Others Up6.5 Liabilities Inventories Fixed liabilities Up4.7 Up3.2 Notes/Account Current receivable liabilities Up 9.7 billi
Slide 13: Consolidated Cash Flow
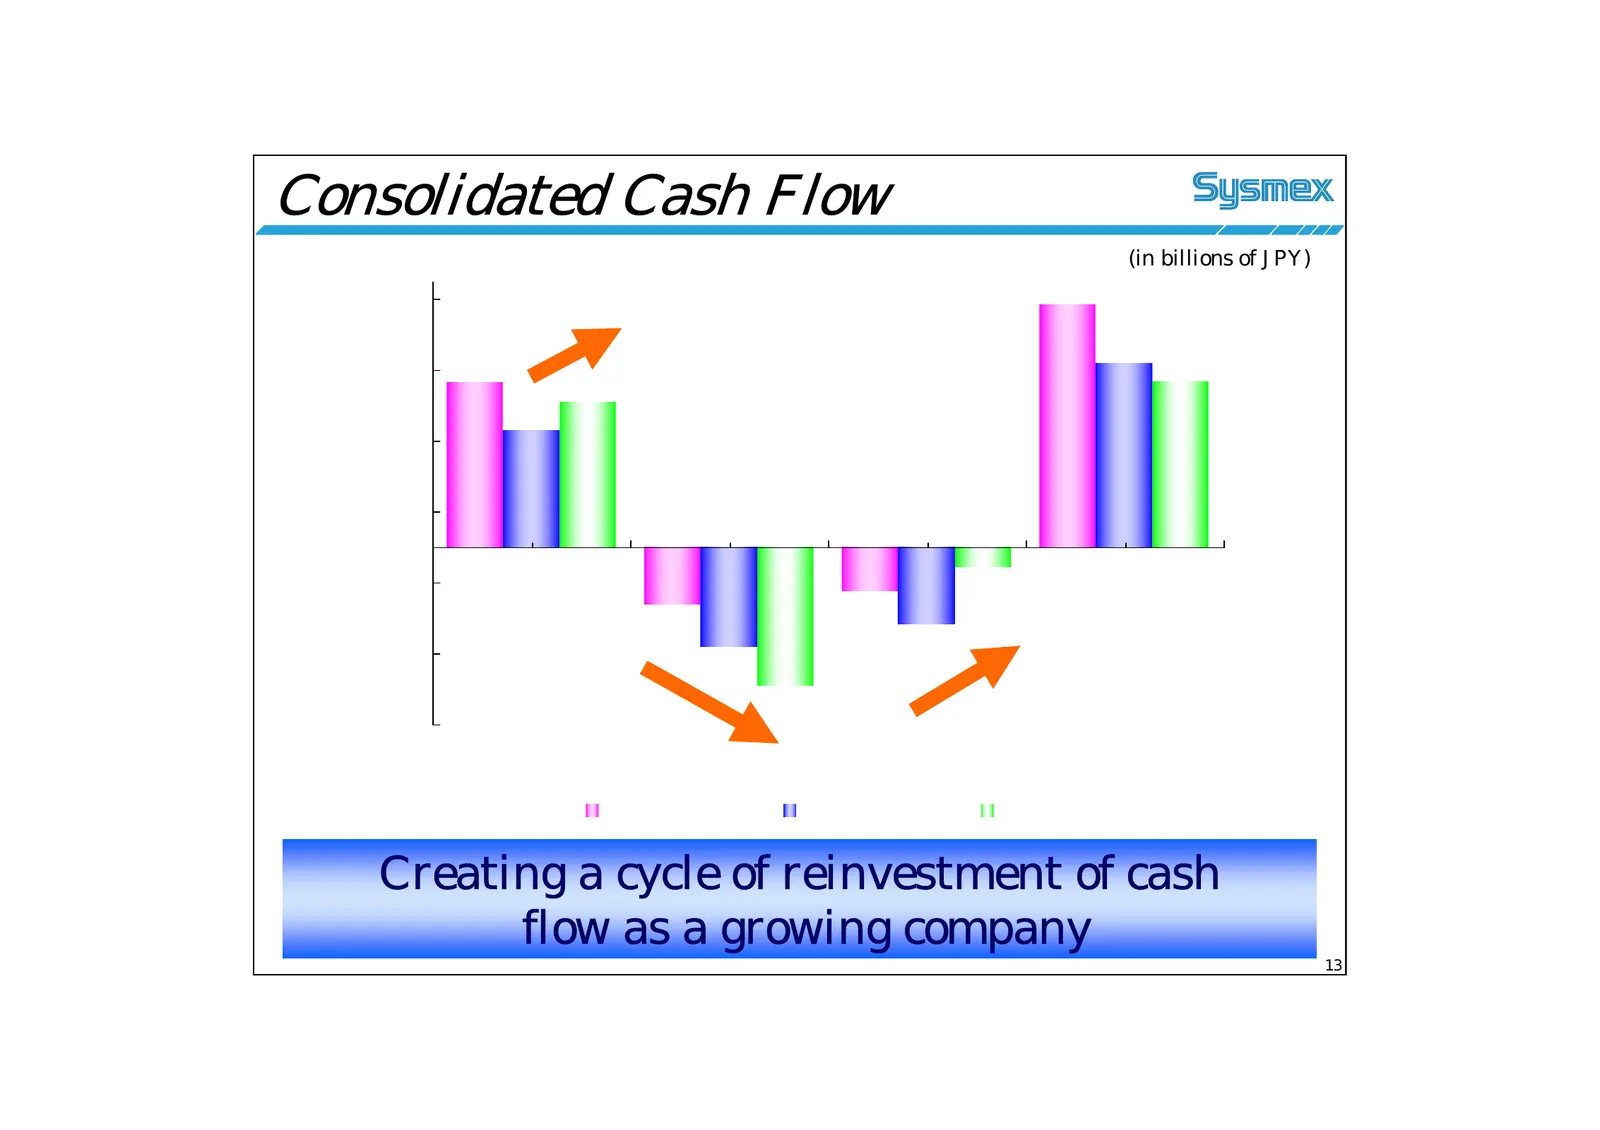
Consolidated Cash Flow (in billions of JPY) Creating a cycle of reinvestment of cash flow as a growing company 13
Slide 14: Dividend
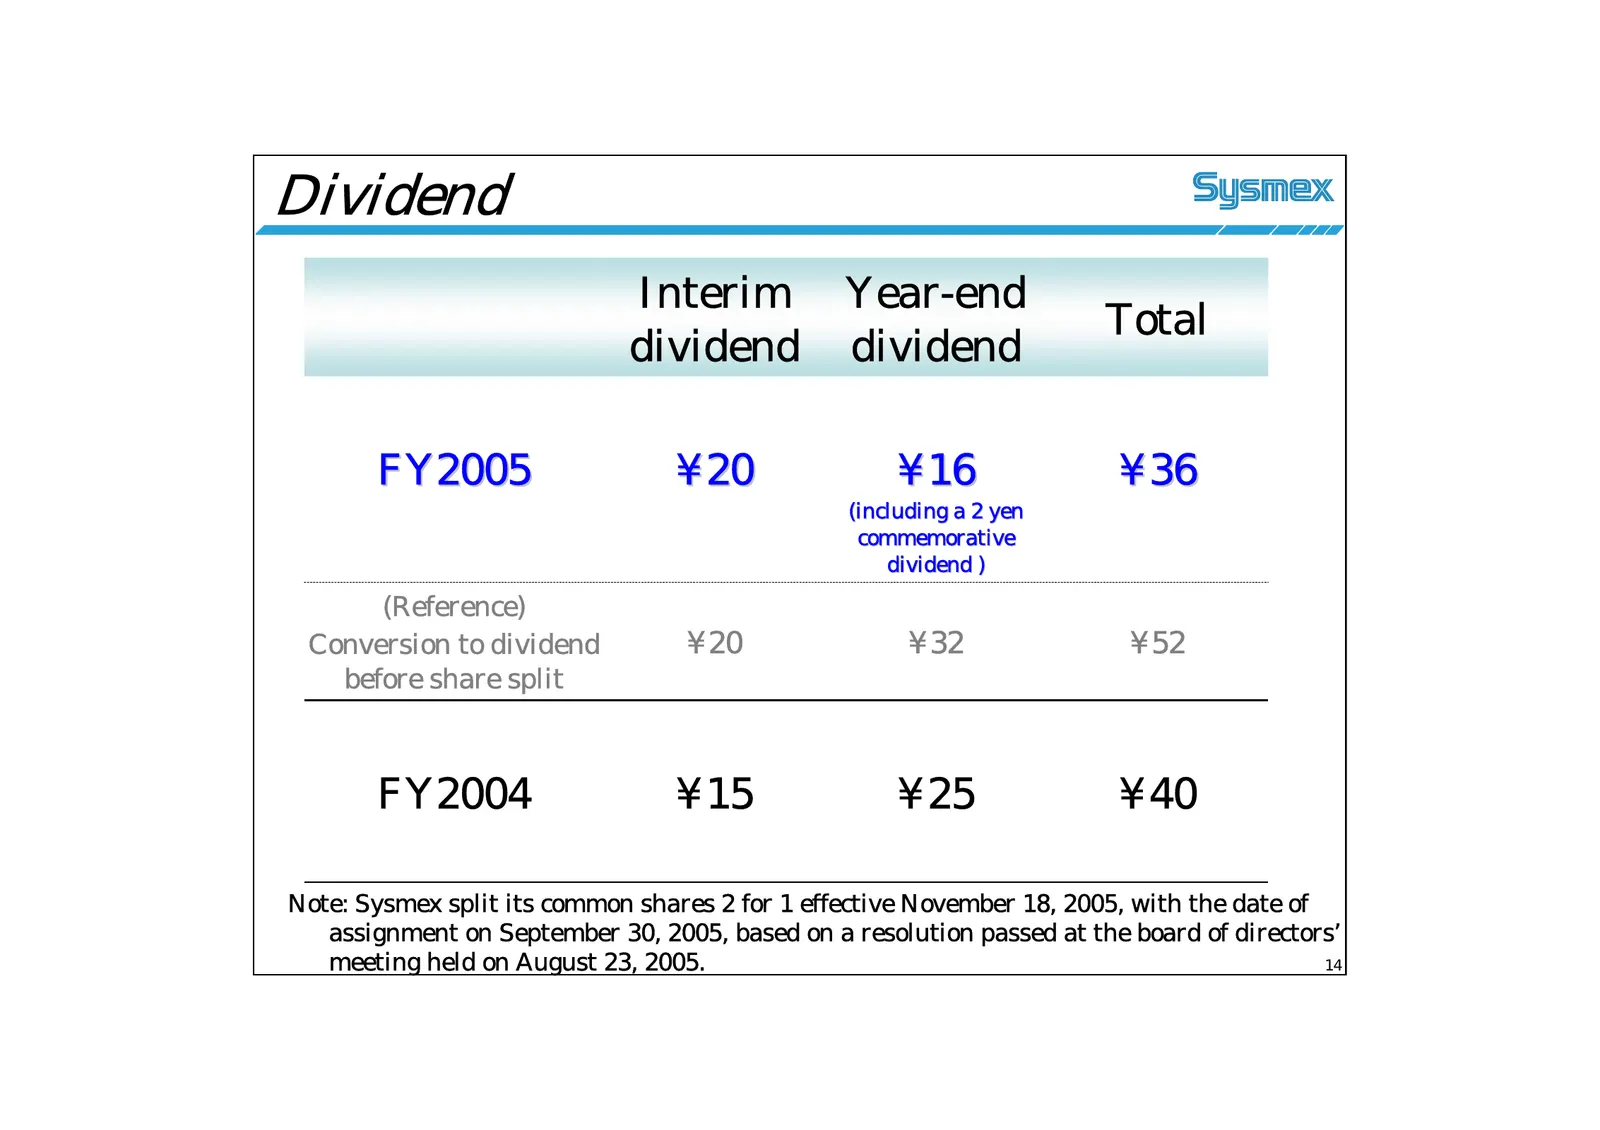
Dividend Interim Year-end Total dividend dividend FY2005 ¥20 ¥16 ¥36 (including a 2 yen commemorative dividend ) (Reference) Conversion to dividend ¥20 ¥32 ¥52 before share split FY2004 ¥15 ¥25 ¥40 Note: Sysmex split its common shares 2 for 1 effective November 18, 2005, with the date of assignment
Slide 15: Progress of Mid-term Plan
Financial Highlights of FY2005 Progress of Mid-term Plan A Unique & Global Healthcare Testing Company
Slide 16: Targets for FY2007 and Key Issues
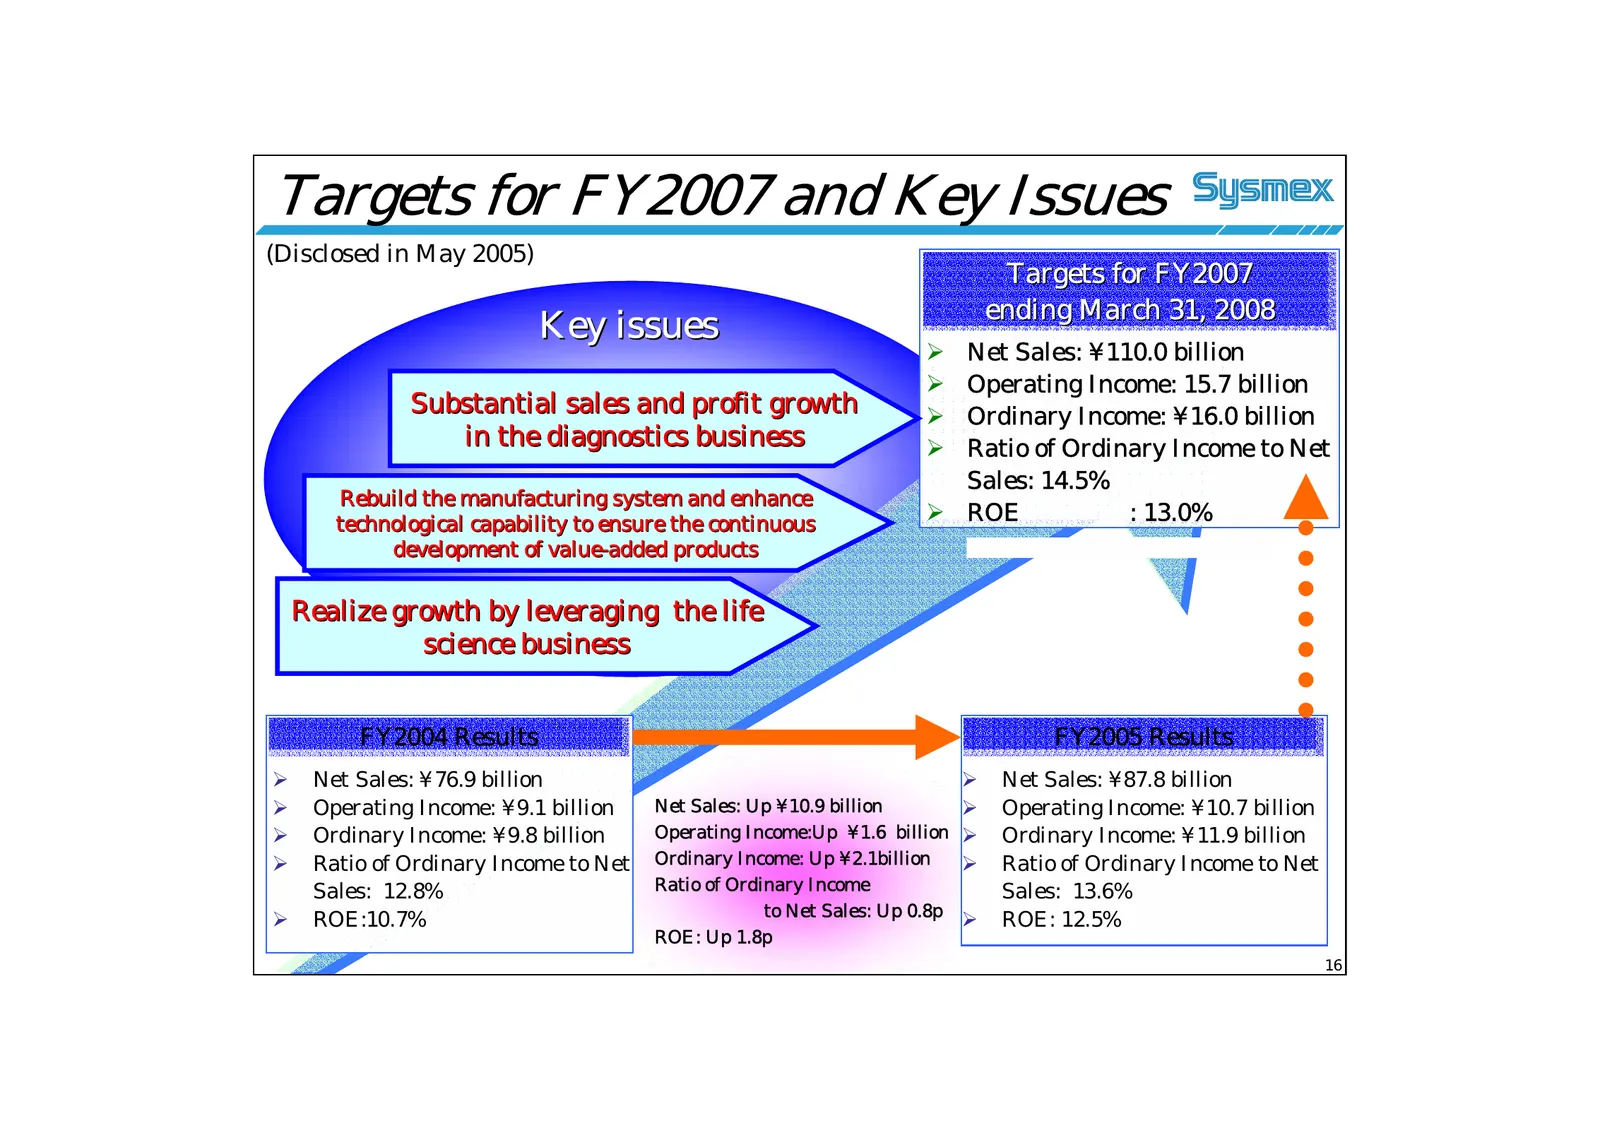
Targets for FY2007 and Key Issues (Disclosed in May 2005) Targets for FY2007 ending March 31, 2008 Key issues ¾ Net Sales: ¥110.0 billion ¾ Operating Income: 15.7 billion Substantial sales and profit growth ¾ Ordinary Income: ¥16.0 billion in the diagnostics business ¾ Ratio of Ordinary Income to Ne
Slide 17: Progress on the Key Issues
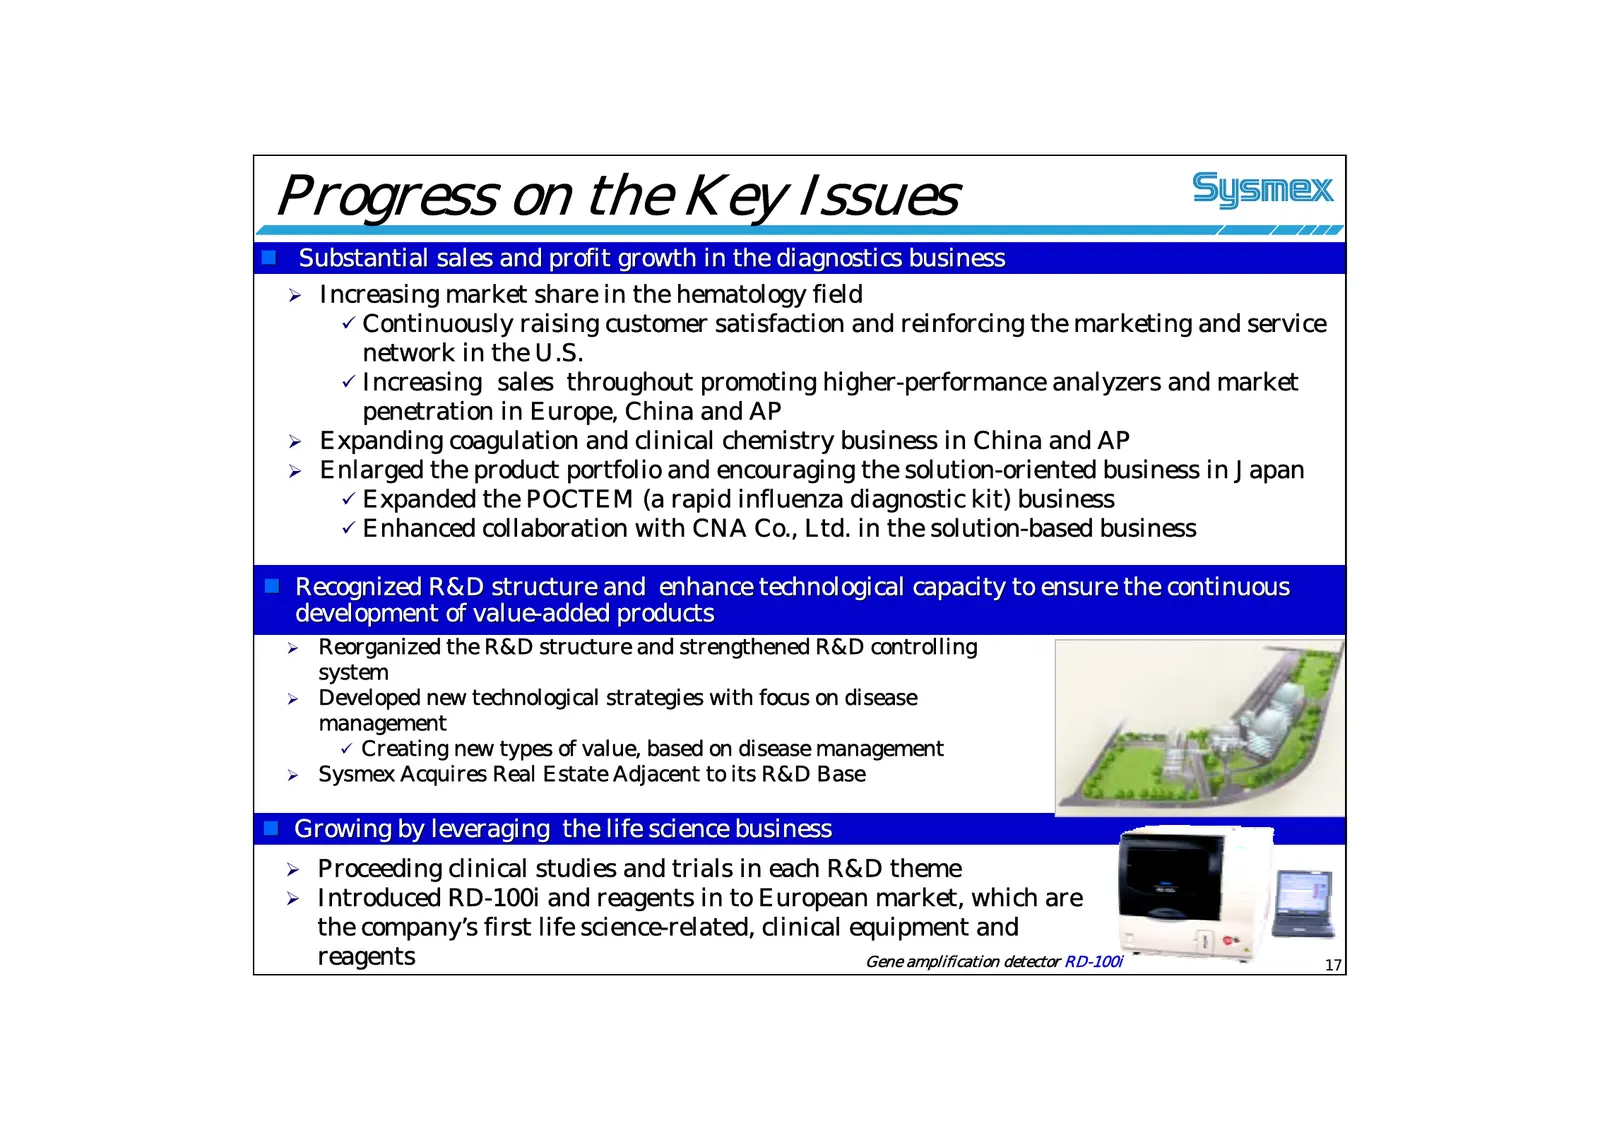
Progress on the Key Issues Substantial sales and profit growth in the diagnostics business ¾ Increasing market share in the hematology field 9 Continuously raising customer satisfaction and reinforcing the marketing and service network in the U.S. 9 Increasing sales throughout promoting higher-per
Slide 18: Increasing reagent production capacity
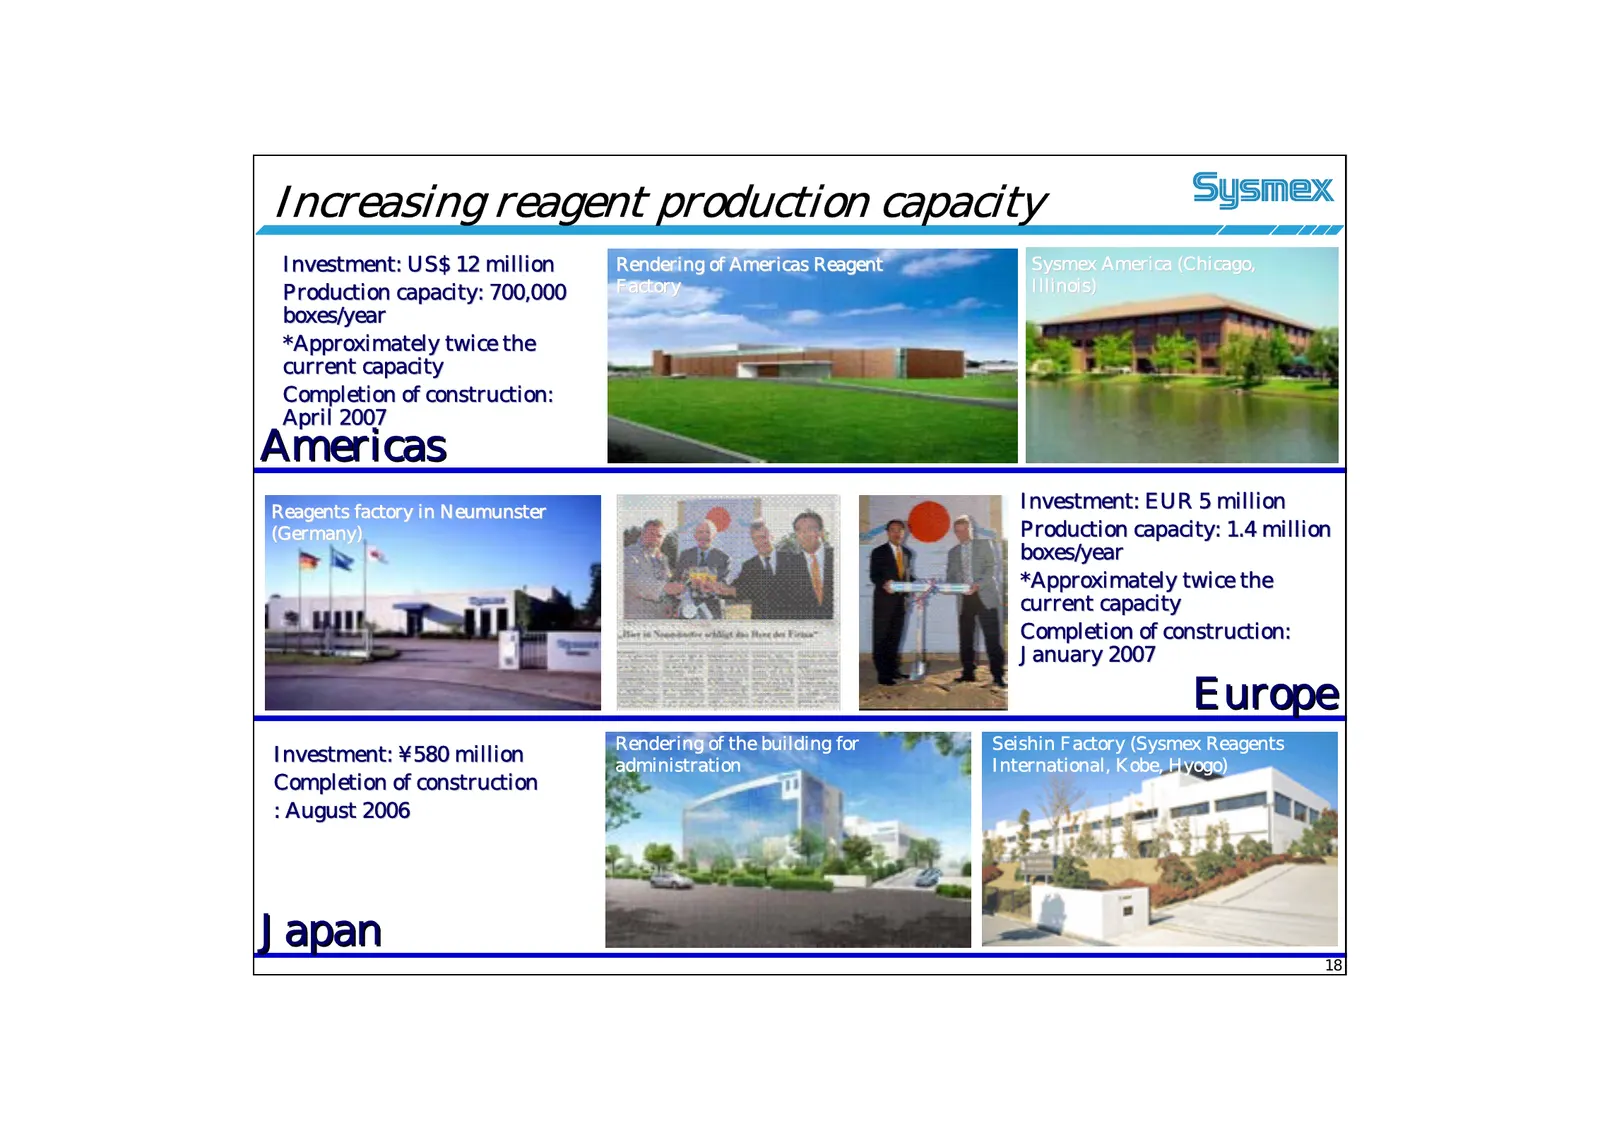
Increasing reagent production capacity Investment: US$ 12 million Rendering of Americas Reagent Sysmex America (Chicago, Production capacity: 700,000 Factory Illinois) boxes/year *Approximately twice the current capacity Completion of construction: April 2007 Americas Reagents factory in Neumunster
Slide 19: Future Opportunities
Future Opportunities Market Scenarios Strategies/Targets Future Endeavors Consolidated Earnings Forecast of FY2006 A Unique & Global Healthcare Testing Company
Slide 20: Market Scenarios
Future Opportunities Market Scenarios A Unique & Global Healthcare Testing Company
Slide 21: External Changes
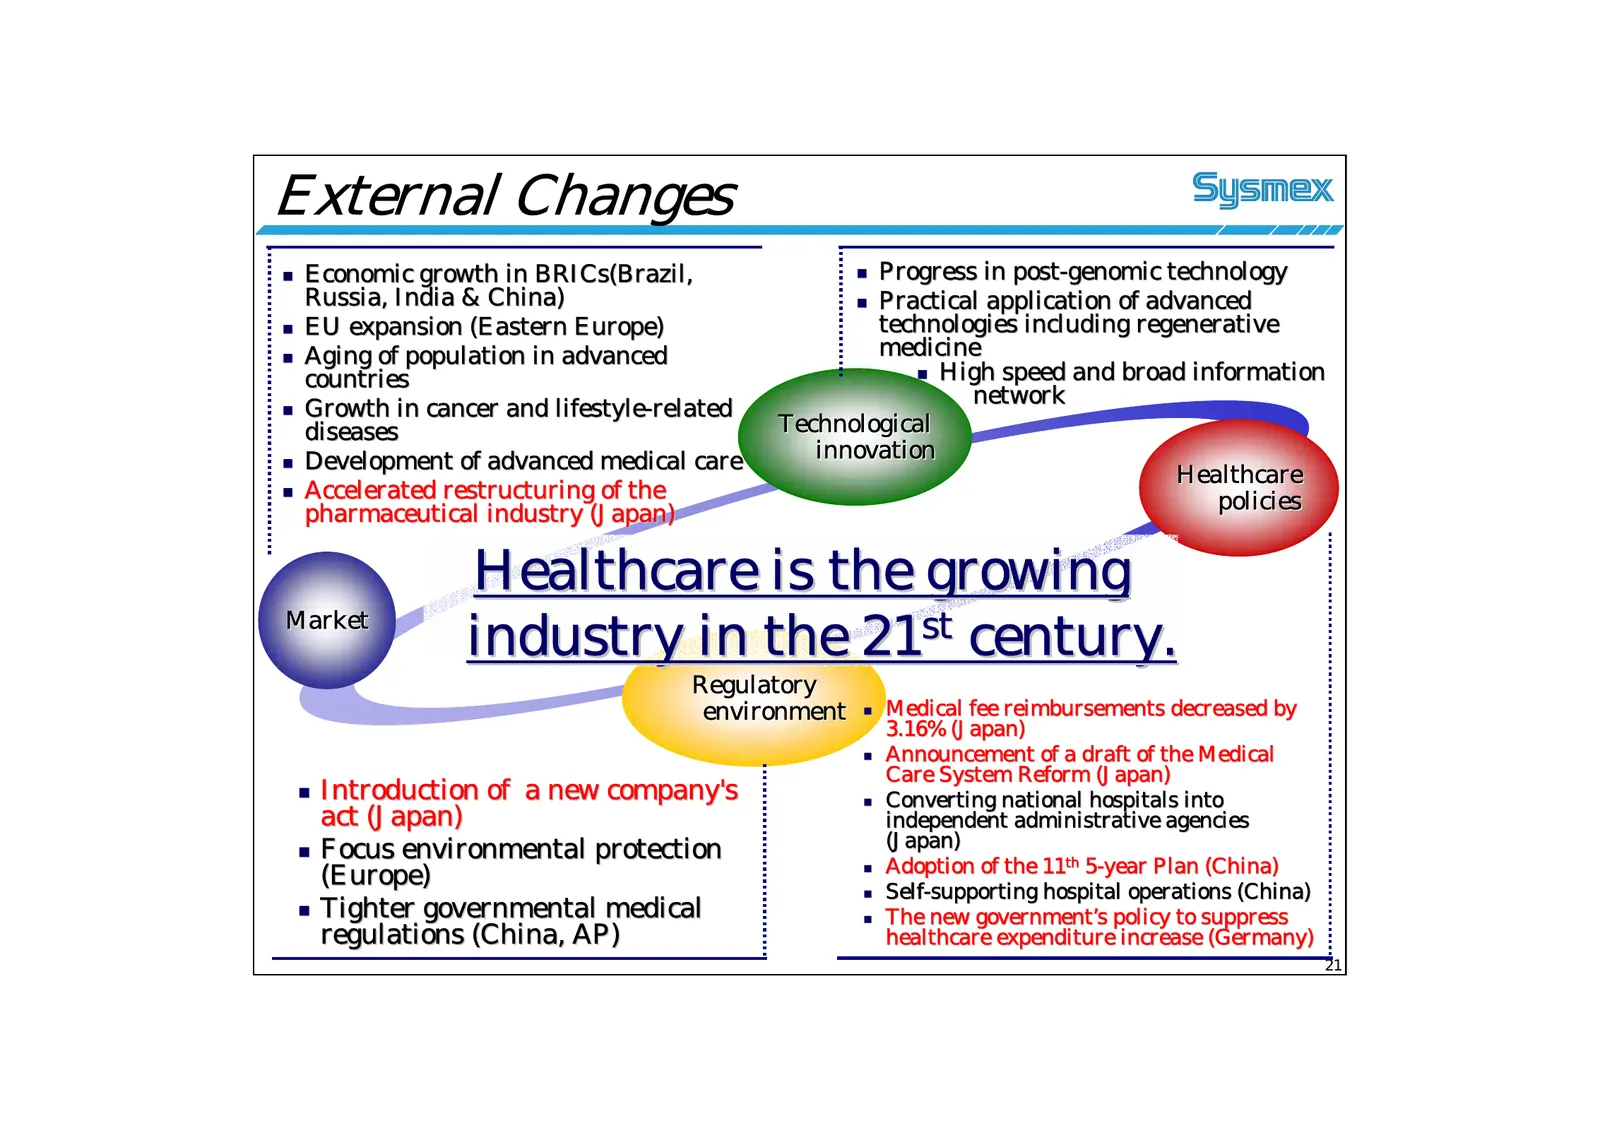
External Changes Economic growth in BRICs(Brazil, BRICs(Brazil, Progress in post- post-genomic technology Russia, India & China) Practical application of advanced EU expansion (Eastern Europe) technologies including regenerative Aging of population in advanced medicine countries High spe
Slide 22: Breakdown of Diagnostics Market
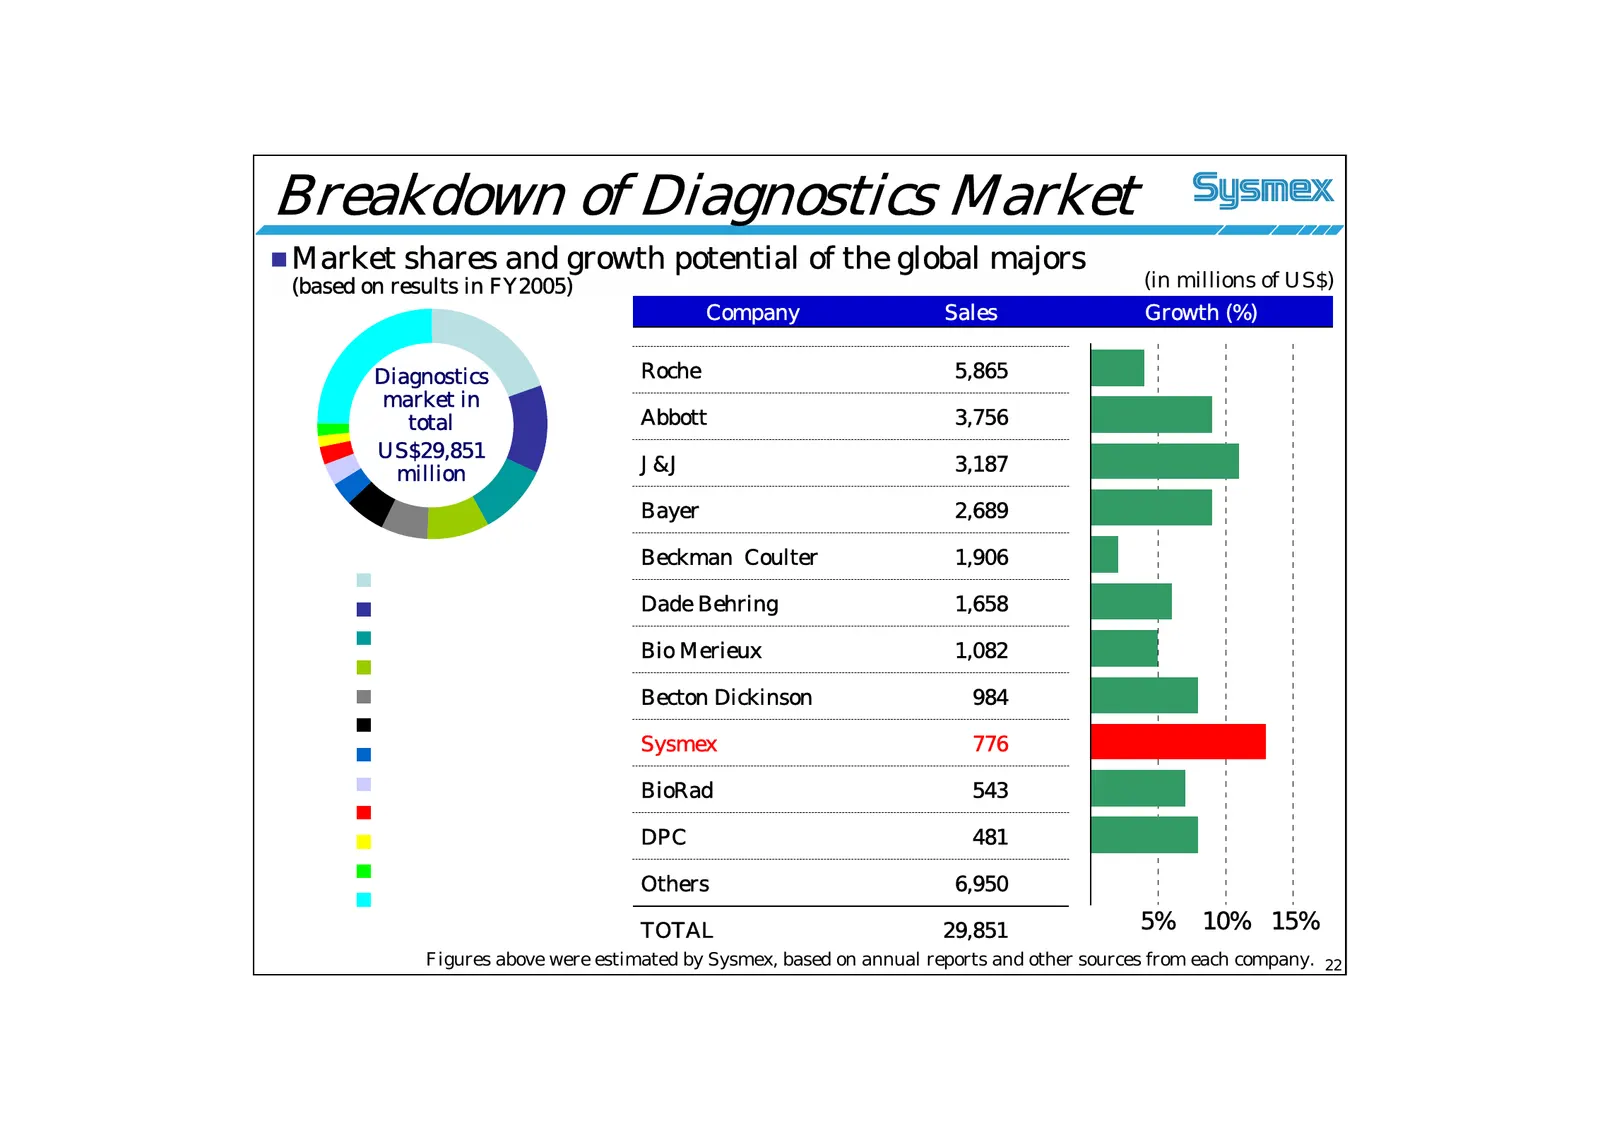
Breakdown of Diagnostics Market Market shares and growth potential of the global majors (based on results in FY2005) (in millions of US$) Company Sales Growth (%) Diagnostics Roche 5,865 market in total Abbott 3,756 US$29,851 million J&J 3,187 Bayer 2,689 Beckman Coulter 1,906 Dade Behring 1,658 B
Slide 23: Strategies/Targets
Future Opportunities Strategies/Targets A Unique & Global Healthcare Testing Company
Slide 24: Strategies / Targets
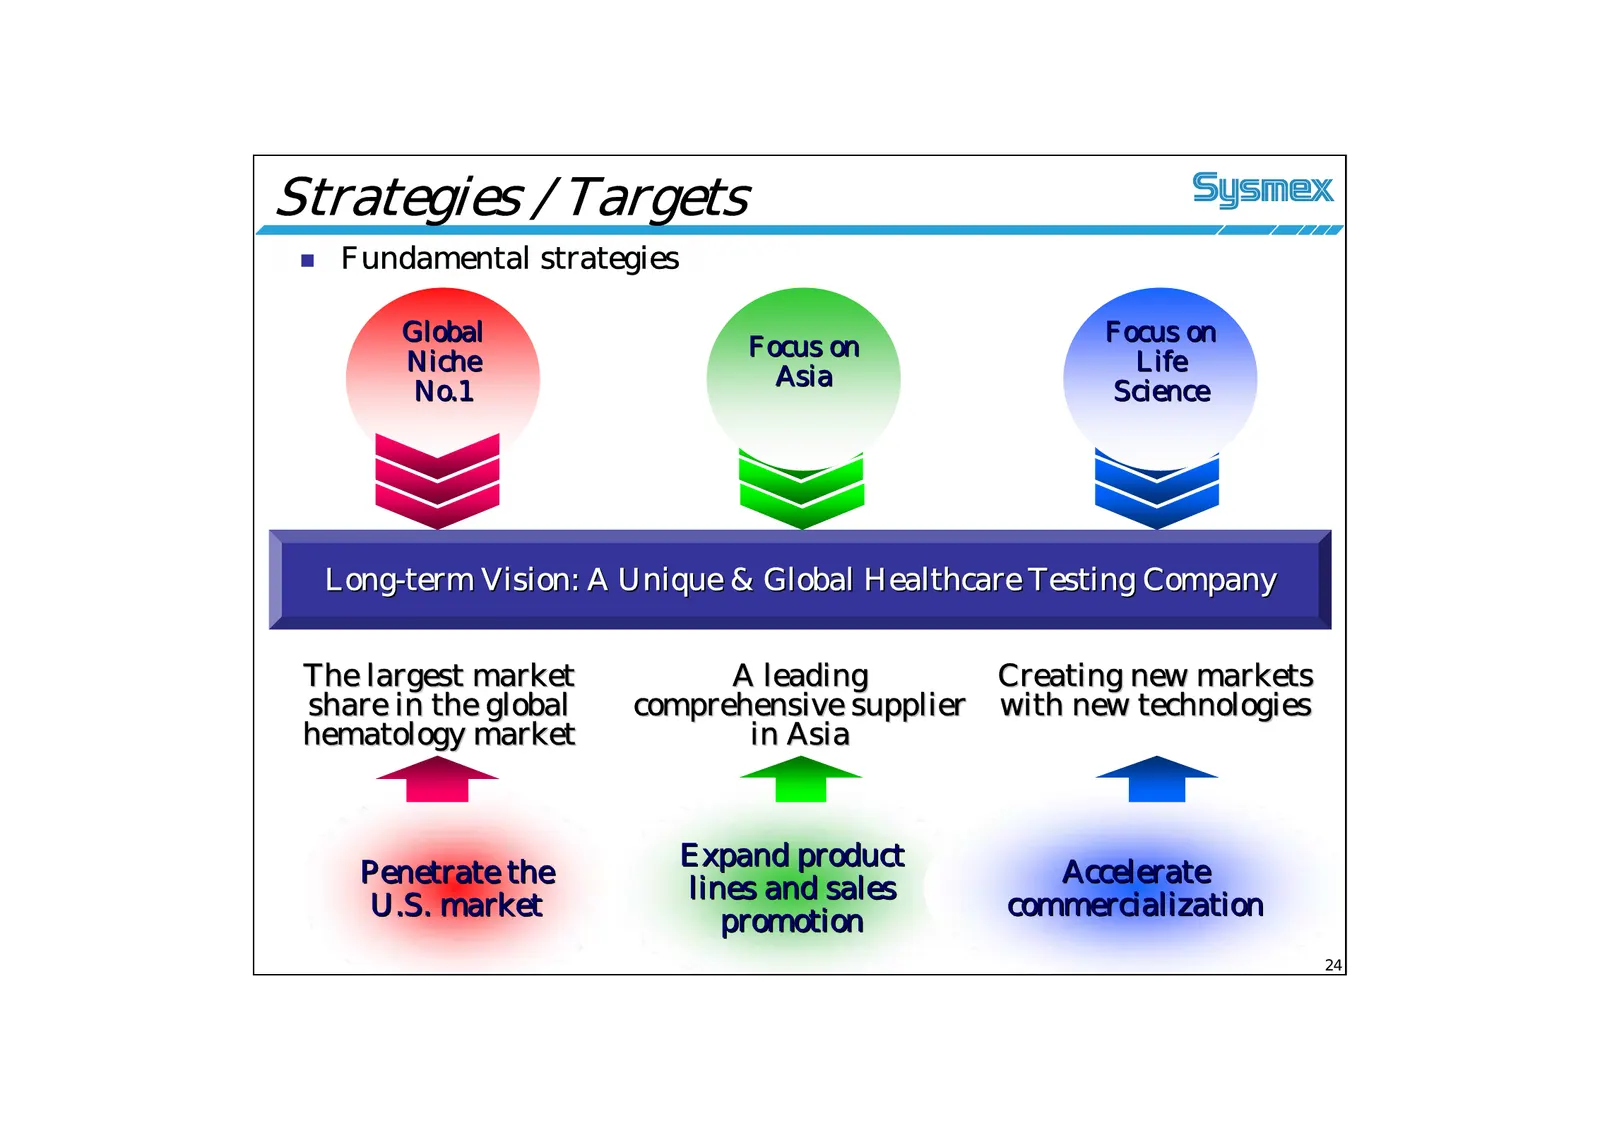
Strategies / Targets Fundamental strategies Global Focus on Focus on Niche Life Asia No.1 Science Long-term Vision: A Unique & Global Healthcare Testing Company The largest market A leading Creating new markets share in the global comprehensive supplier with new technologies hematology market in A
Slide 25: Future Endeavors
Future Opportunities Future Endeavors A Unique & Global Healthcare Testing Company
Slide 26: Global Niche No.1
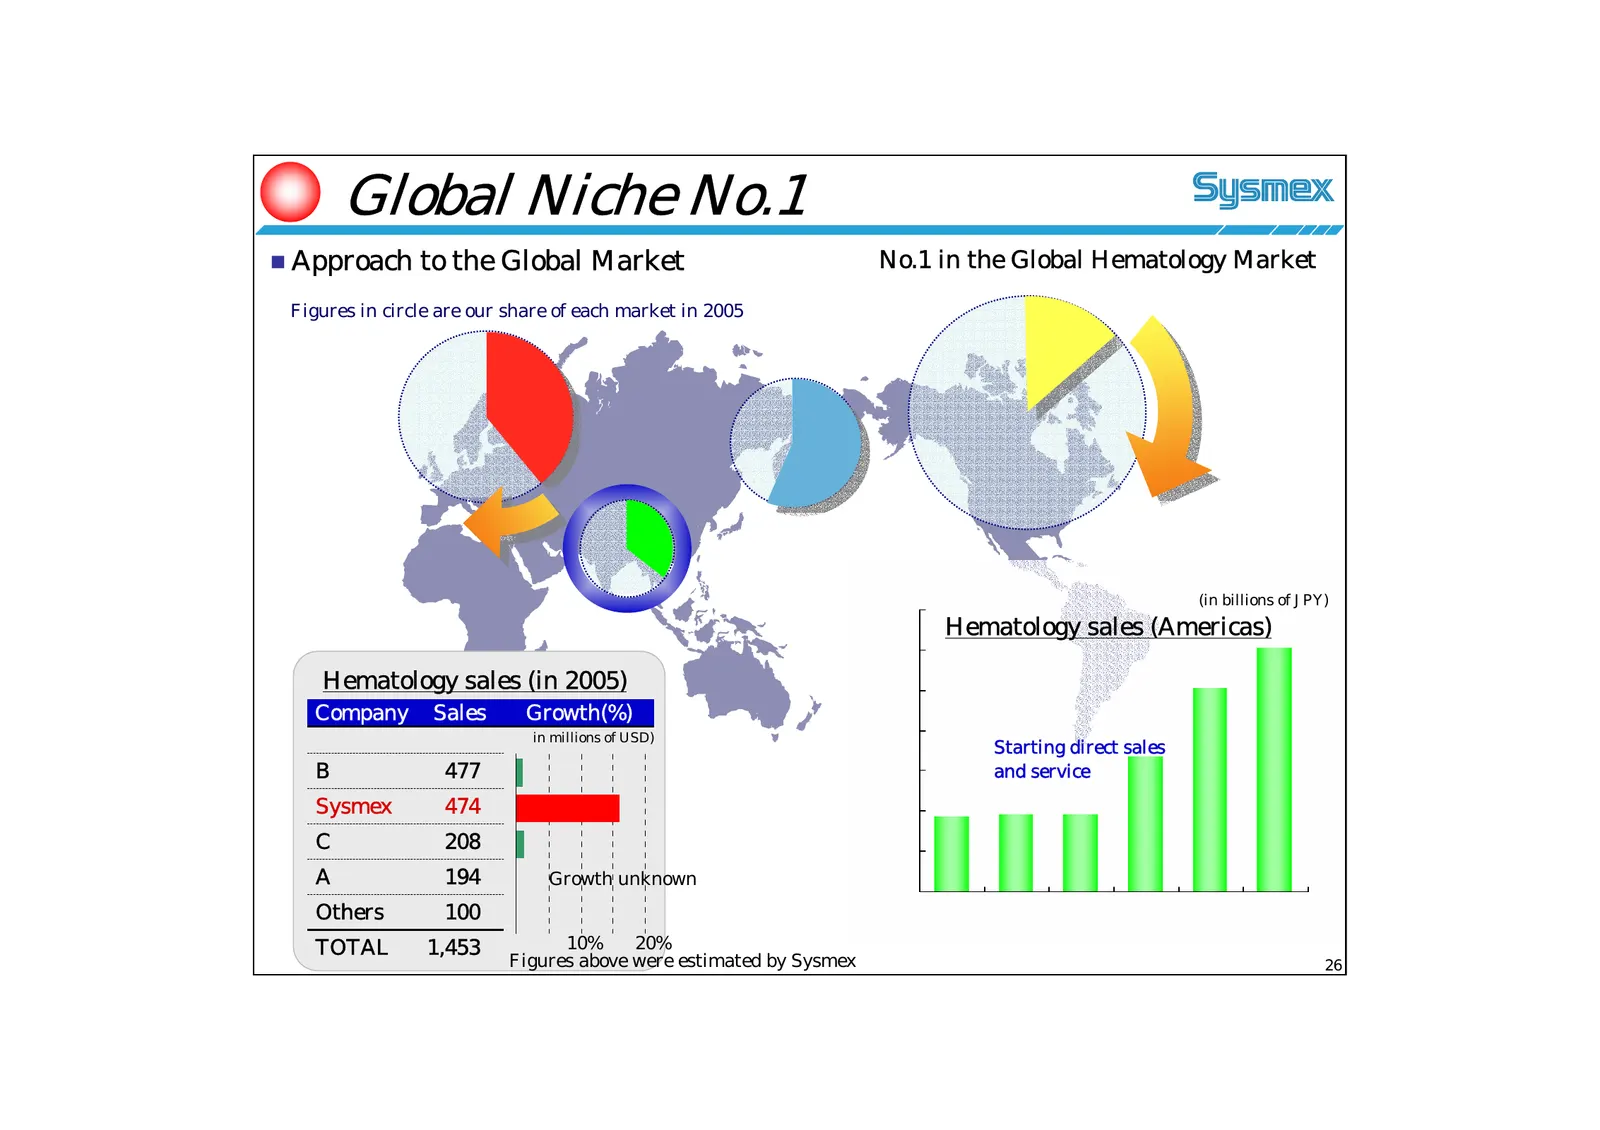
Global Niche No.1 Approach to the Global Market No.1 in the Global Hematology Market Figures in circle are our share of each market in 2005 (in billions of JPY) Hematology sales (Americas) Hematology sales (in 2005) Company Sales Growth(%) million $) in millions of USD) Starting direct sales B 477
Slide 27: Strategic Priorities in the US Market
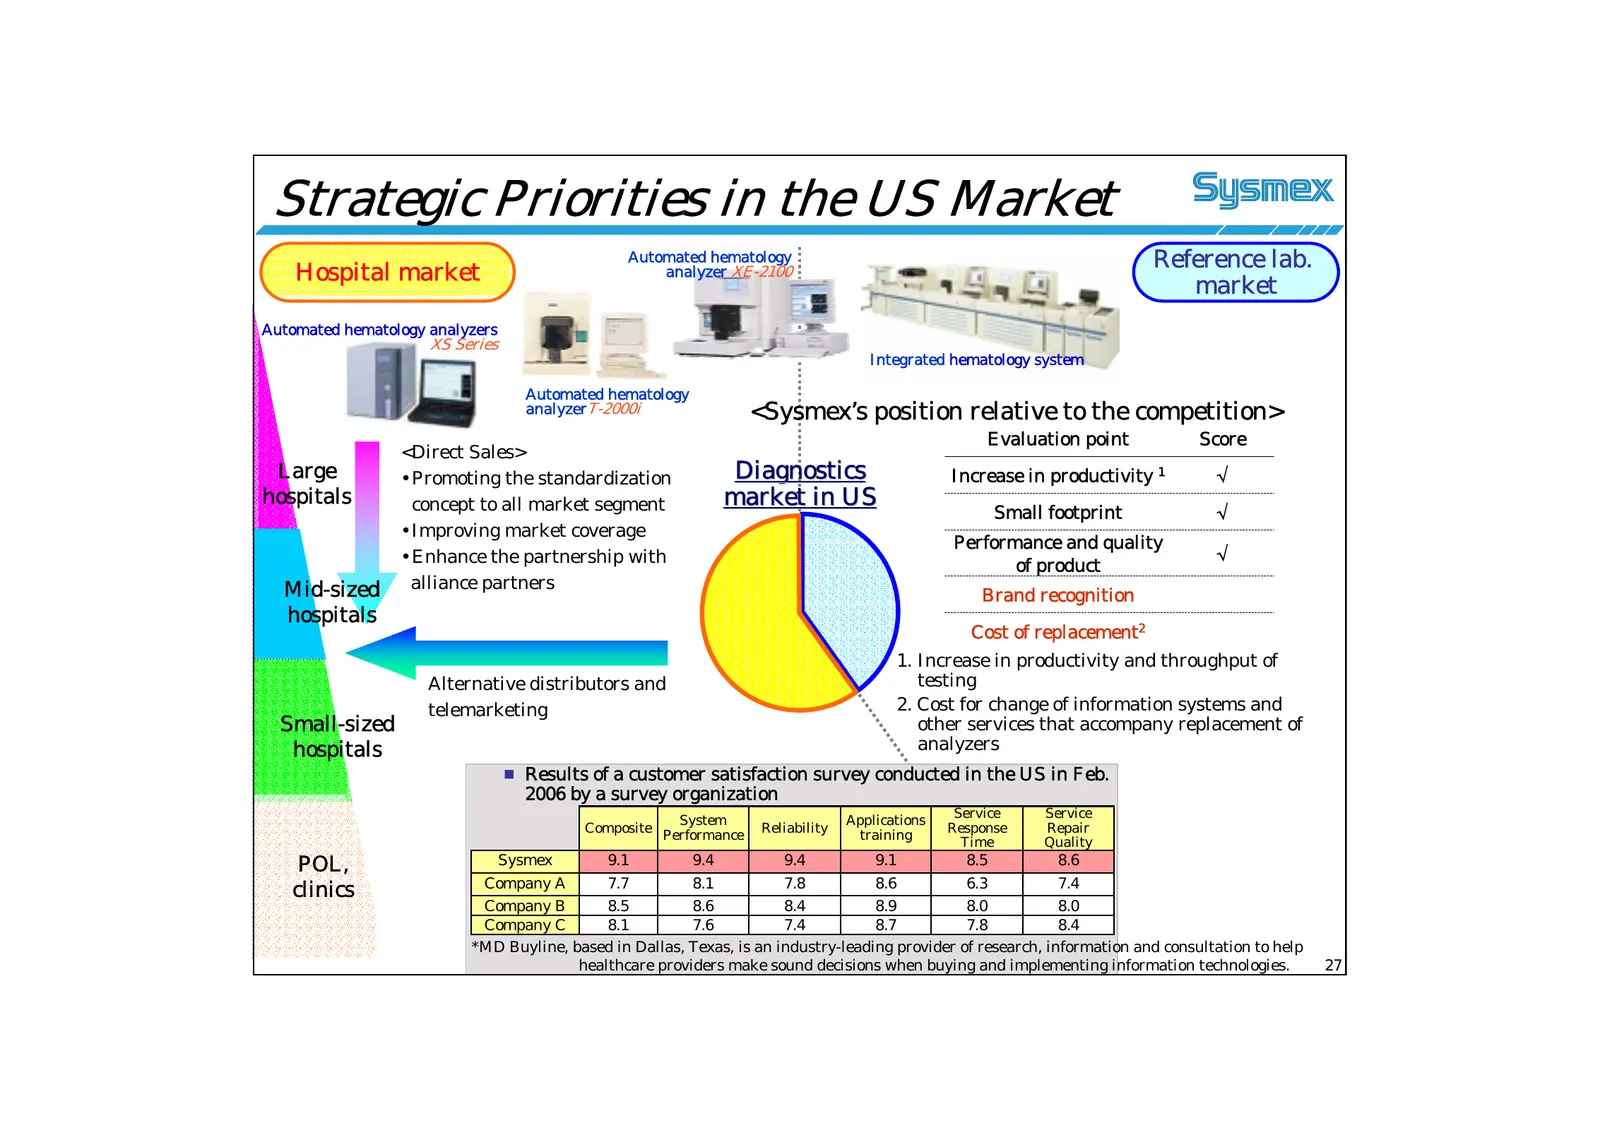
Strategic Priorities in the US Market Automated hematology Reference lab. Hospital market analyzer XE-2100 market Automated hematology analyzers XS Series Integrated hematology system Automated hematology analyzerT-2000i <Sysmex’s position relative to the competition> Evaluation point Score <Direct
Slide 28: Challenges (Americas/Europe)
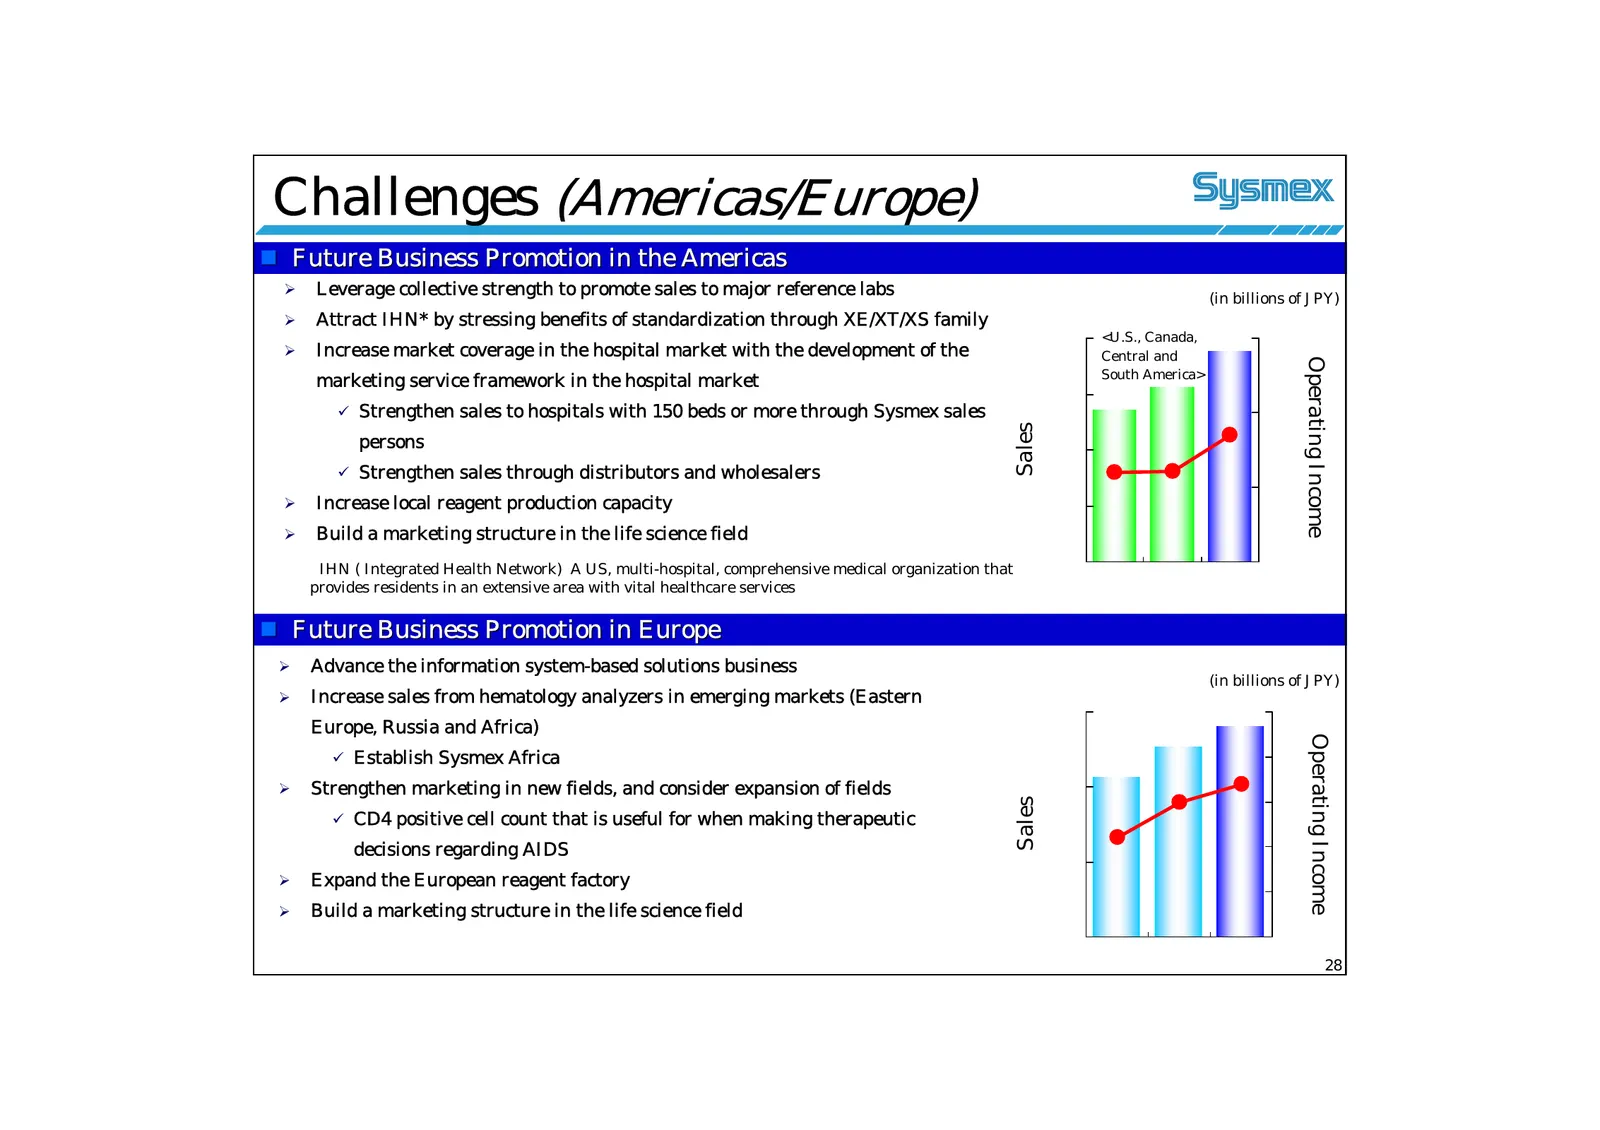
Challenges (Americas/Europe) Future Business Promotion in the Americas ¾ Leverage collective strength to promote sales to major reference labs (in billions of JPY) ¾ Attract IHN* by stressing benefits of standardization through XE/XT/XS family <U.S., Canada, ¾ Increase market coverage in the hospi
Slide 29: Focus on Asia
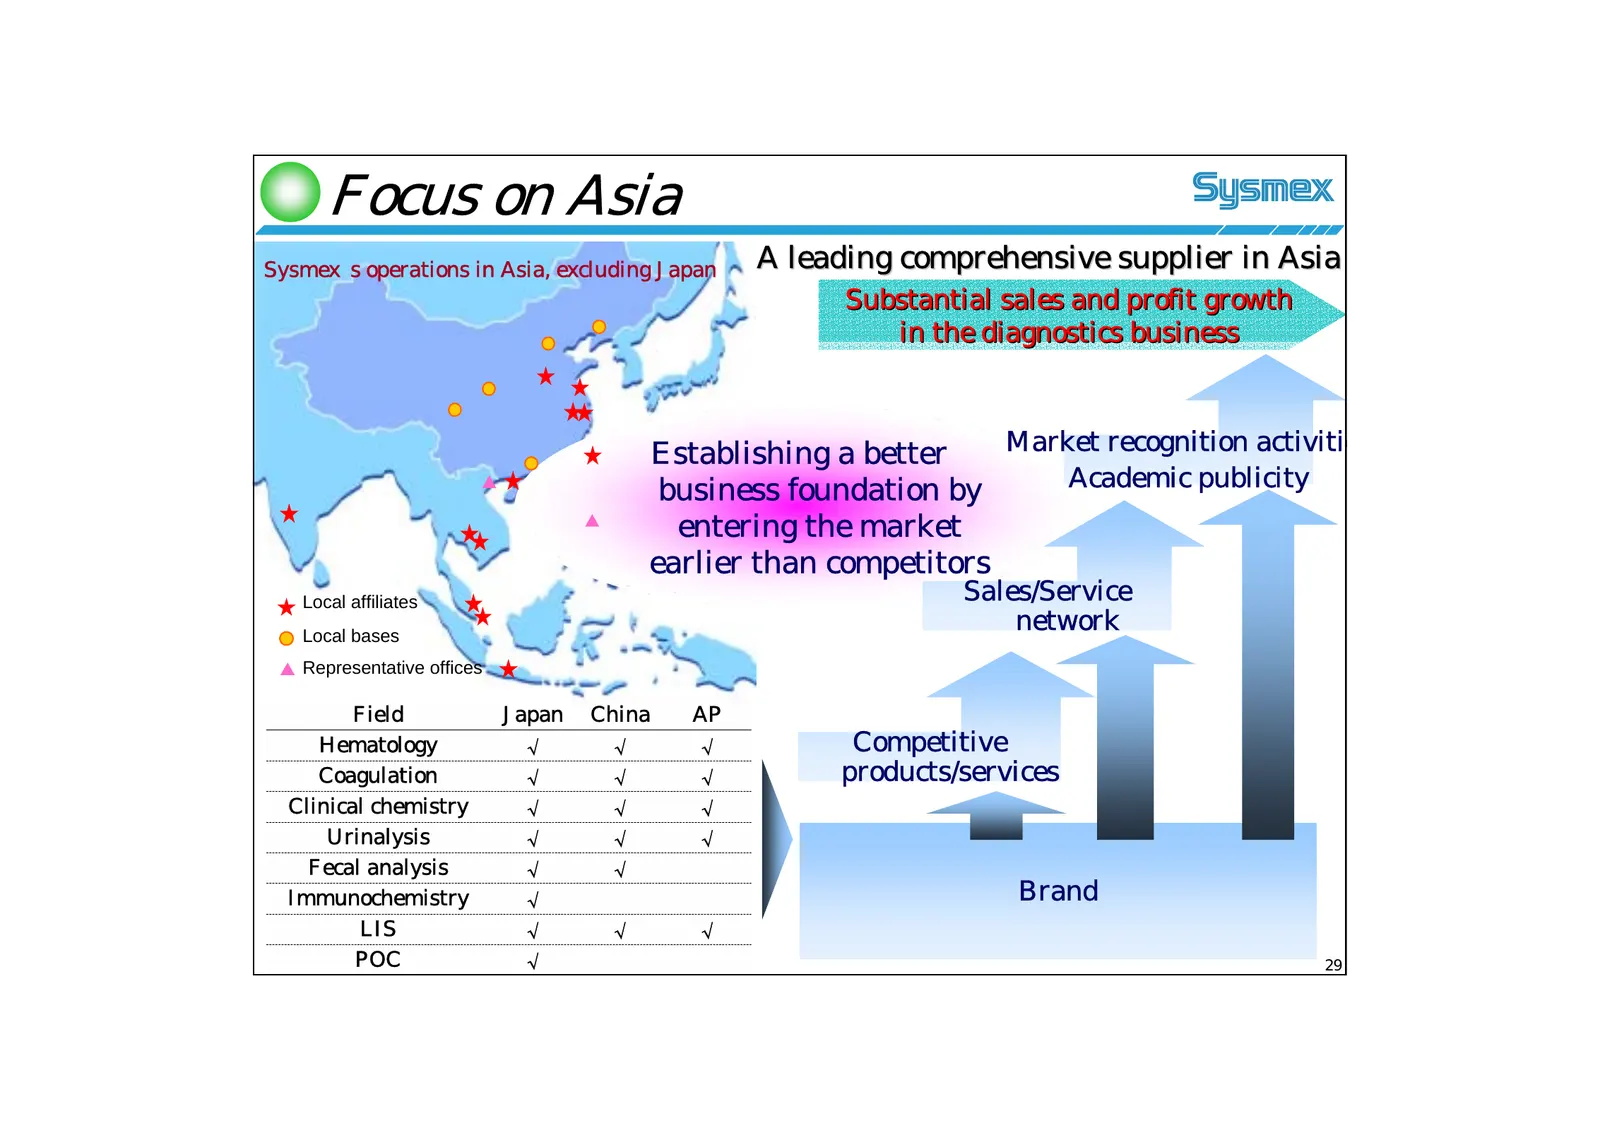
Focus on Asia Sysmex s operations in Asia, excluding Japan A leading comprehensive supplier in Asia Substantial sales and profit growth in the diagnostics business Establishing a better Market recognition activitie business foundation by Academic publicity entering the market earlier than competitor
Slide 30: Challenges (China/AP)
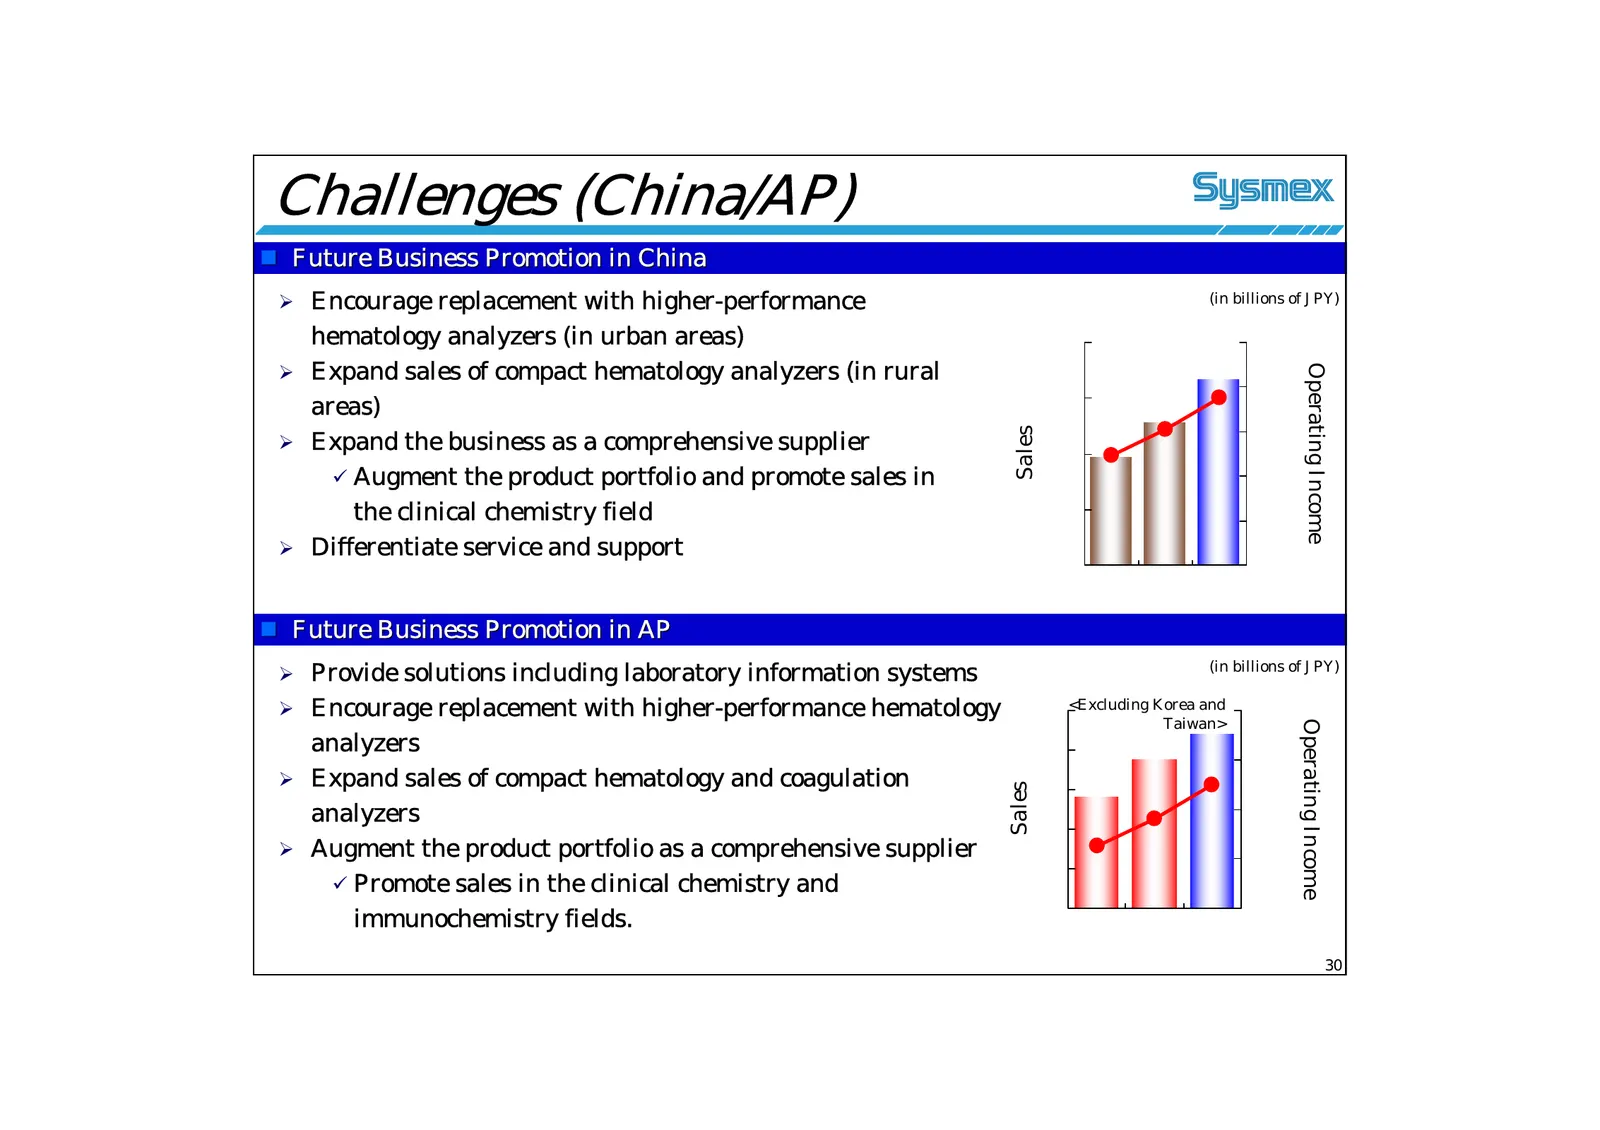
Challenges (China/AP) Future Business Promotion in China ¾ Encourage replacement with higher-performance (in billions of JPY) hematology analyzers (in urban areas) ¾ Expand sales of compact hematology analyzers (in rural Operating Income areas) ¾ Expand the business as a comprehensive supplier Sal
Slide 31: Challenges (Japan)
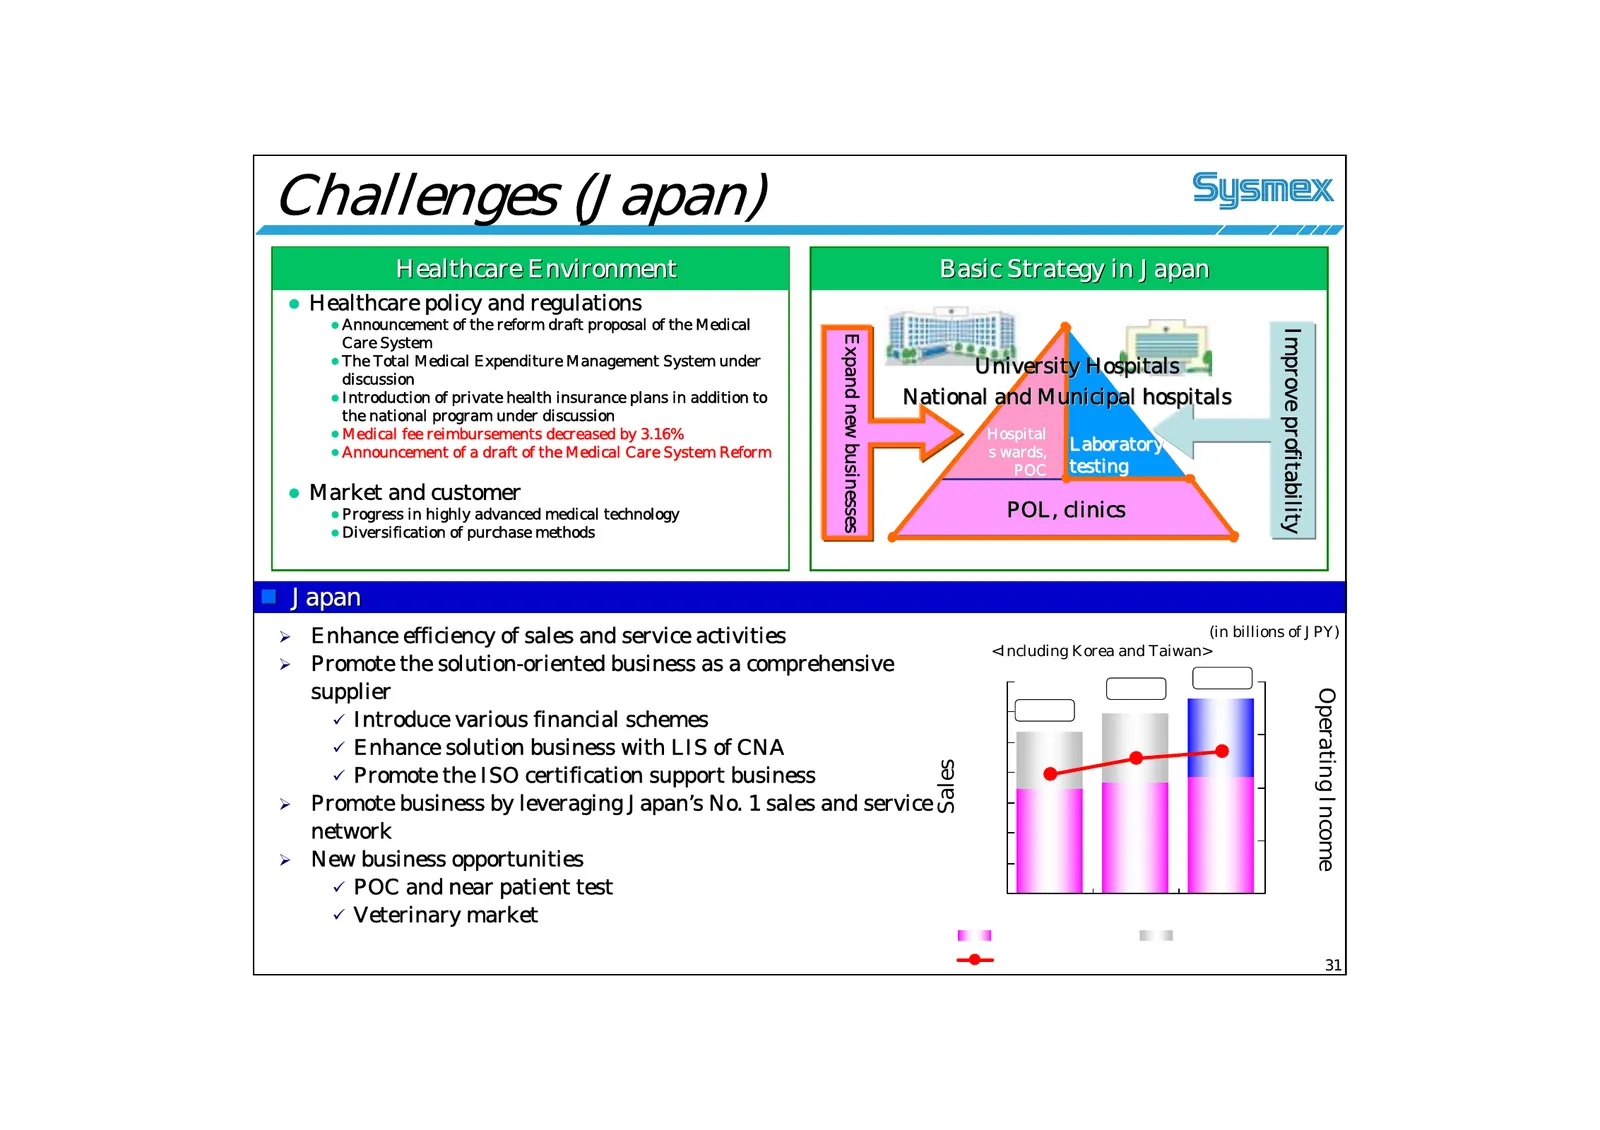
Challenges (Japan) Healthcare Environment Basic Strategy in Japan z Healthcare policy and regulations z Announcement of the reform draft proposal of the Medical Improve profitability Expand new businesses Care System z The Total Medical Expenditure Management System under University Hospitals discus
Slide 32: Focus on Life Science
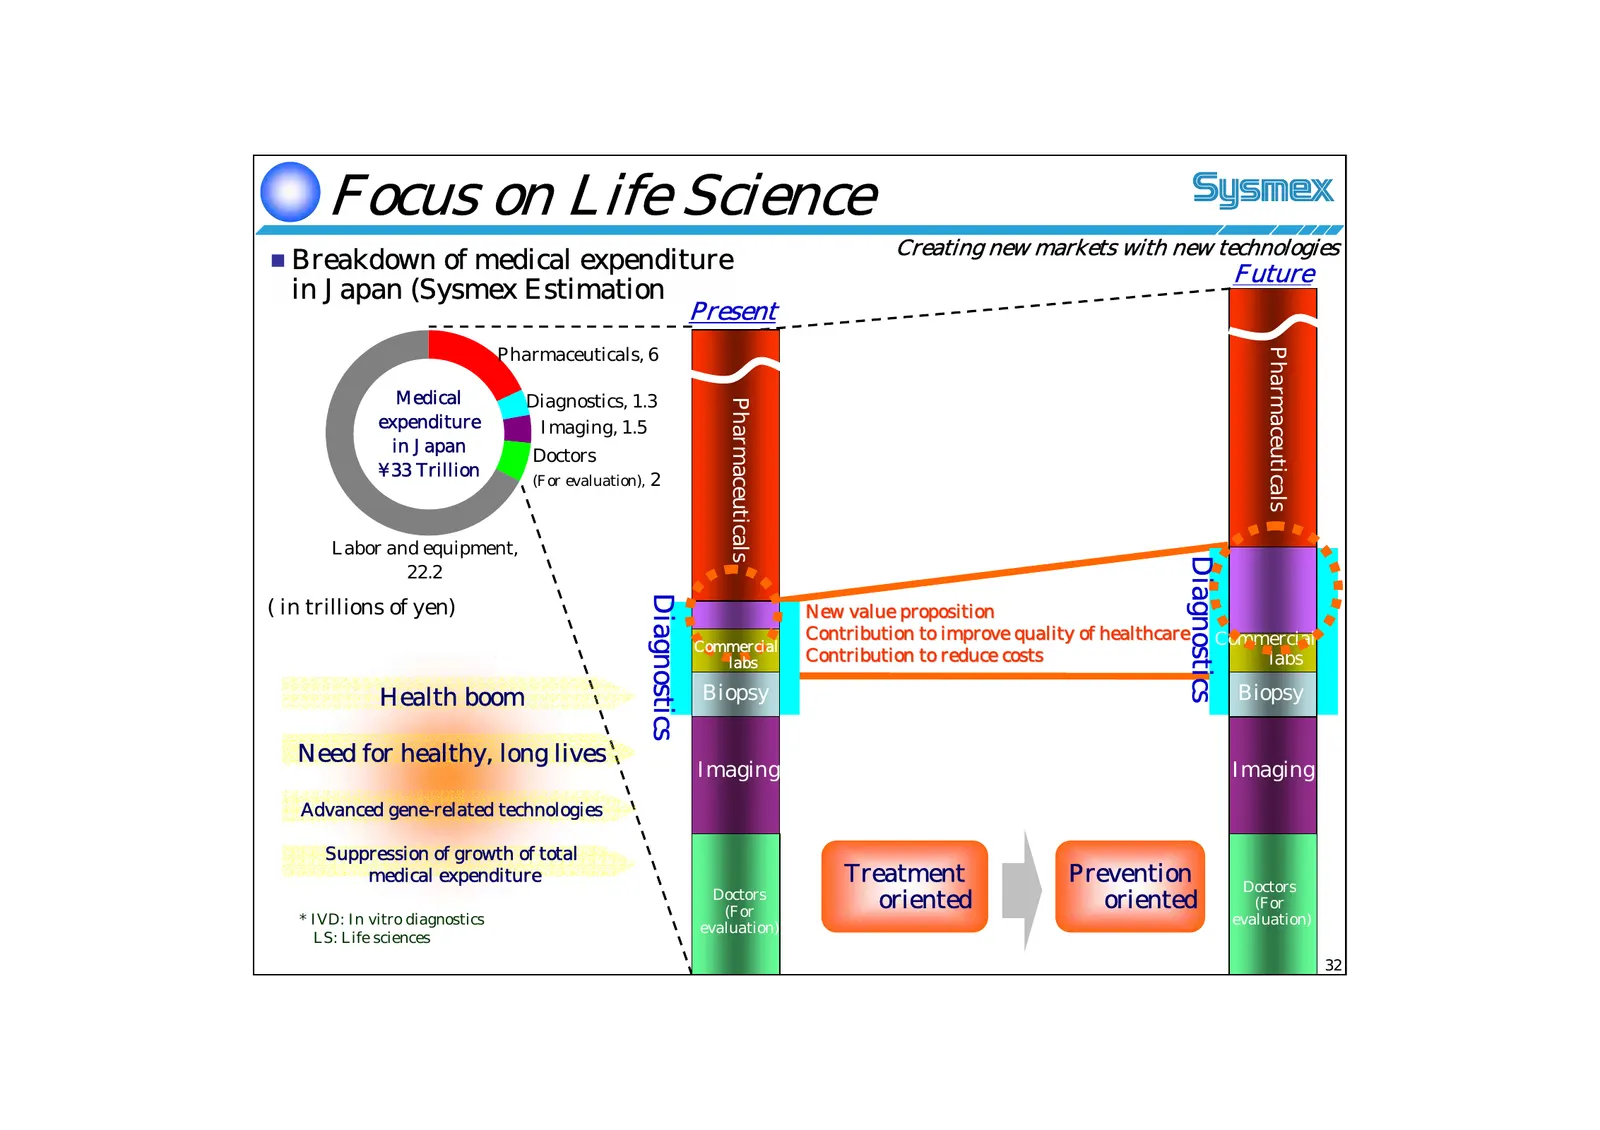
Focus on Life Science Creating new markets with new technologies Breakdown of medical expenditure Future in Japan (Sysmex Estimation Present Pharmaceuticals, 6 Pharmaceuticals Medical Diagnostics, 1.3 Pharmaceuticals Pharmaceuticals expenditure Imaging, 1.5 in Japan Doctors ¥33 Trillion (For evalu
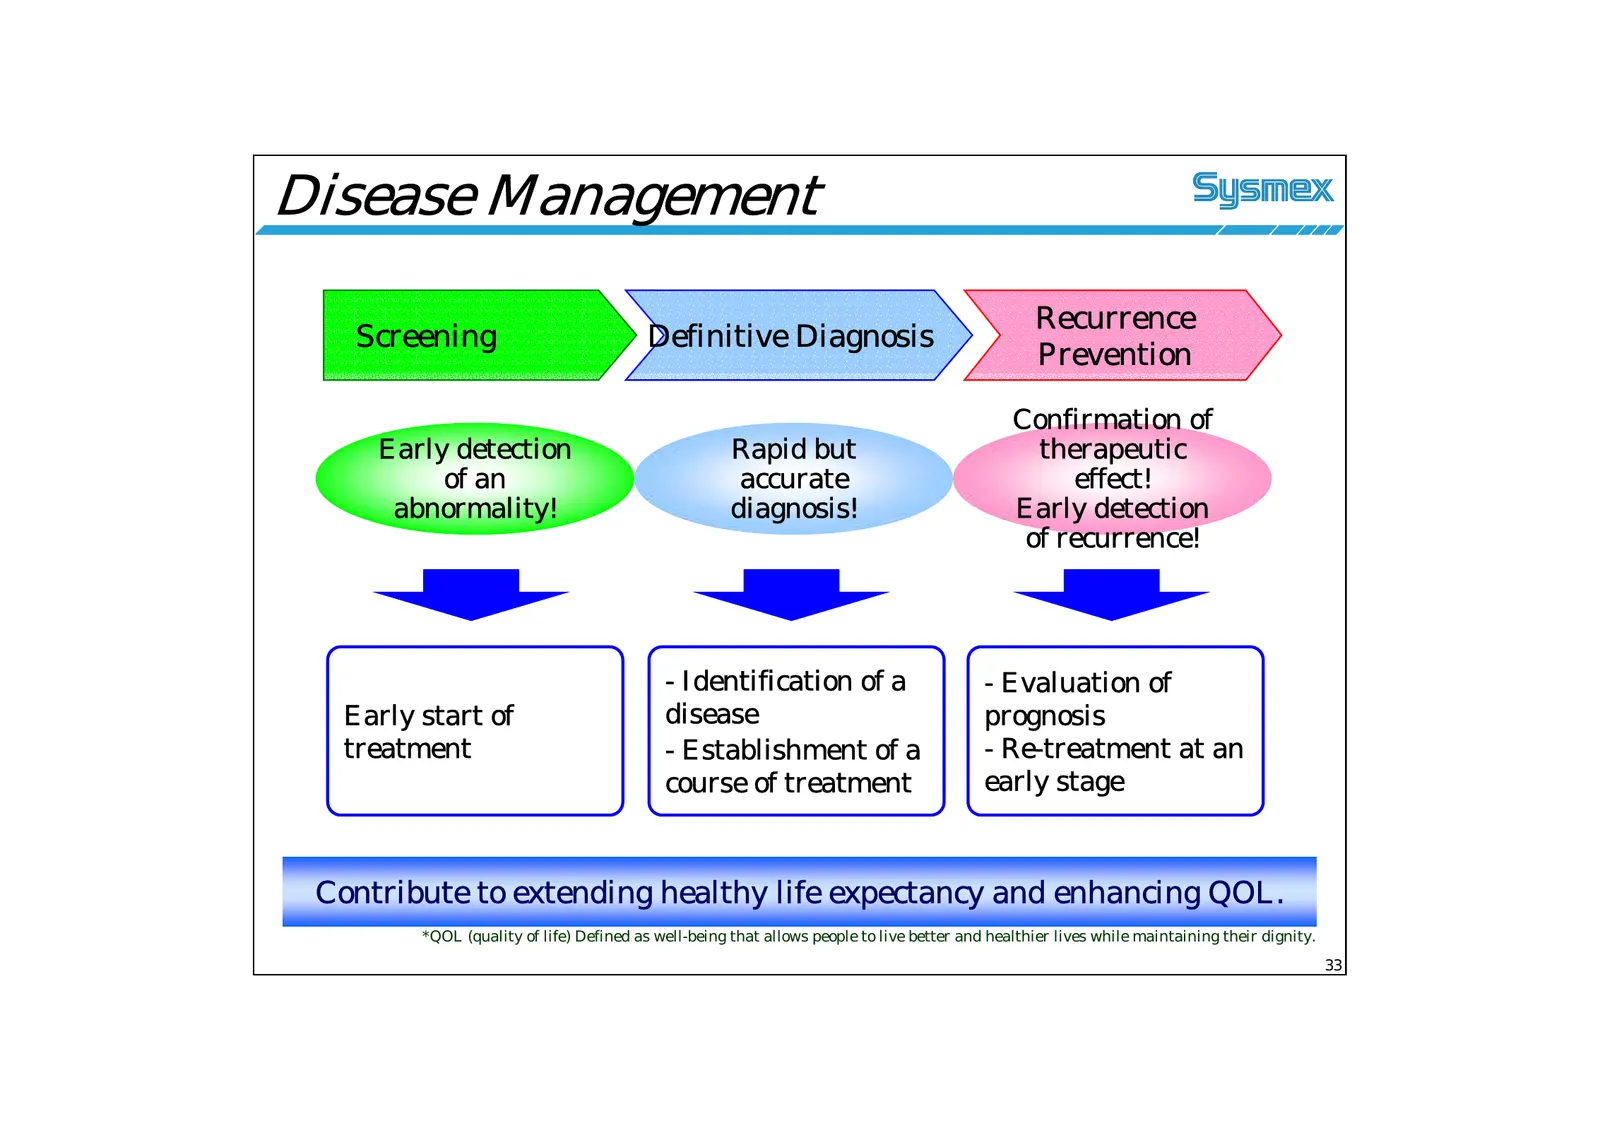
Slide 33: Disease Management
Disease Management Recurrence Screening Definitive Diagnosis Prevention Confirmation of Early detection Rapid but therapeutic of an accurate effect! abnormality! diagnosis! Early detection of recurrence! - Identification of a - Evaluation of Early start of disease prognosis treatment - Establishment
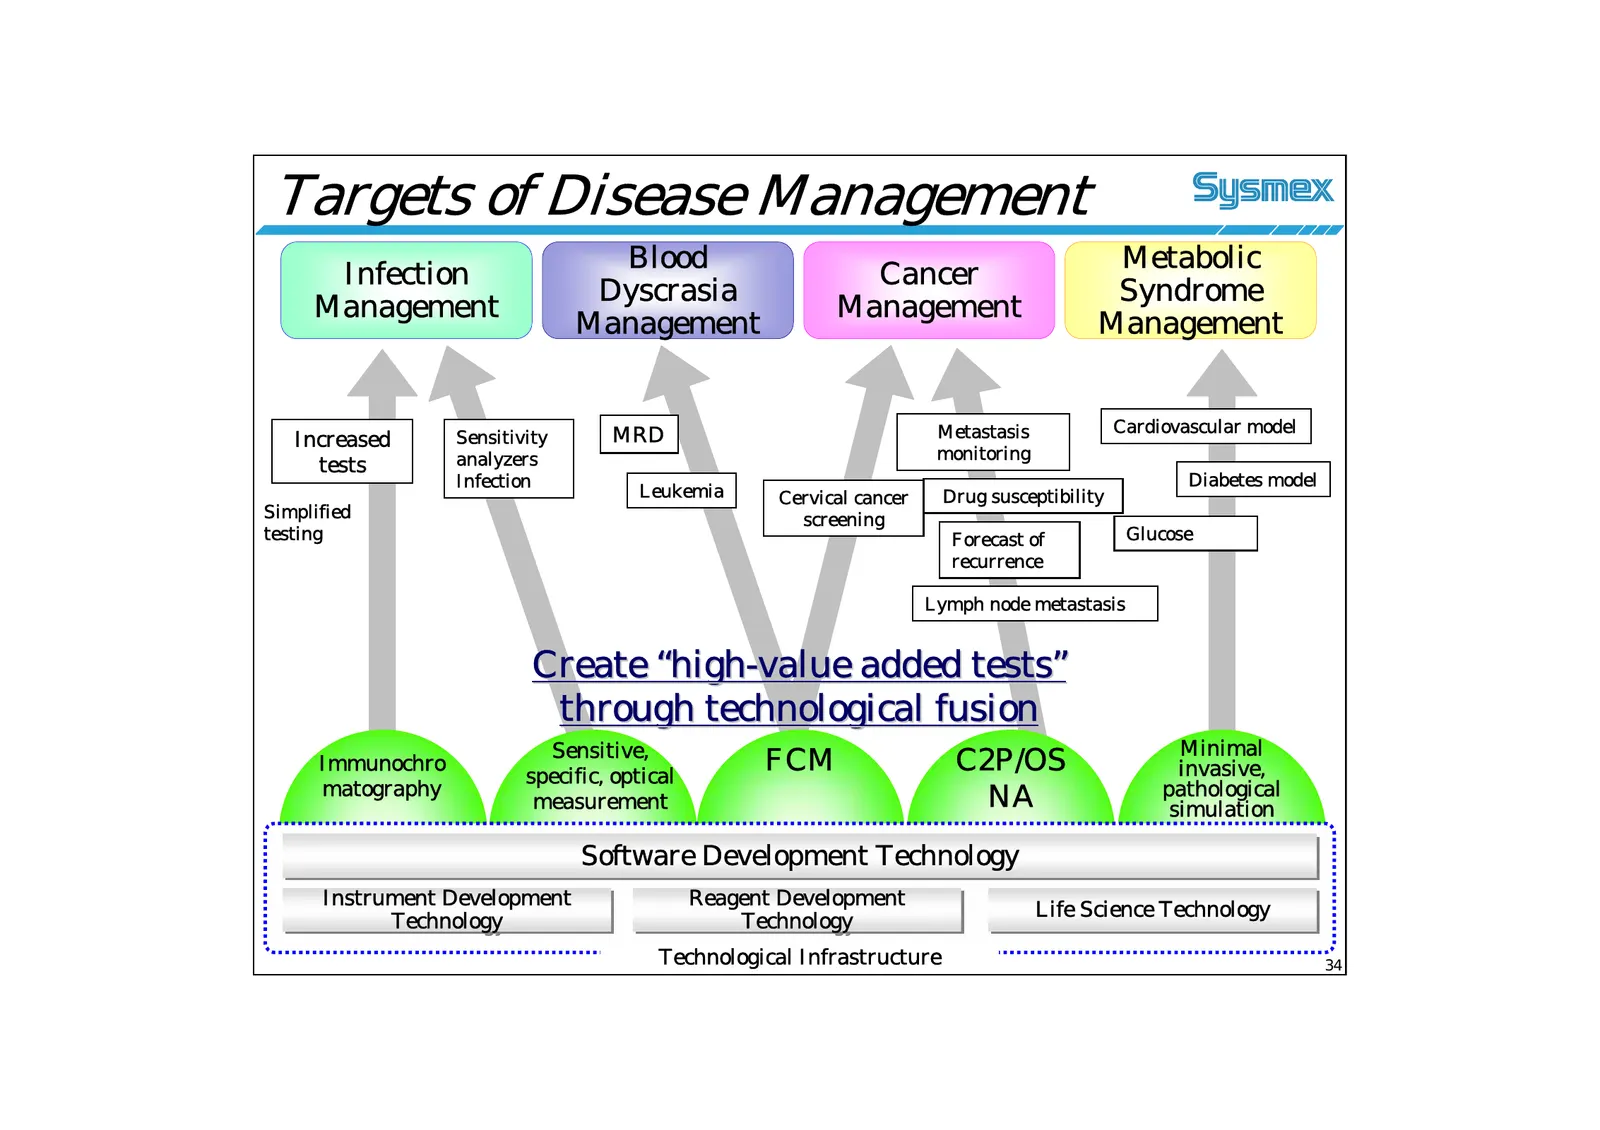
Slide 34: Targets of Disease Management
Targets of Disease Management Blood Metabolic Infection Cancer Dyscrasia Syndrome Management Management Management Management Metastasis Cardiovascular model Increased Sensitivity MRD analyzers monitoring tests Infection Diabetes model Leukemia Cervical cancer Drug susceptibility Simplified screenin
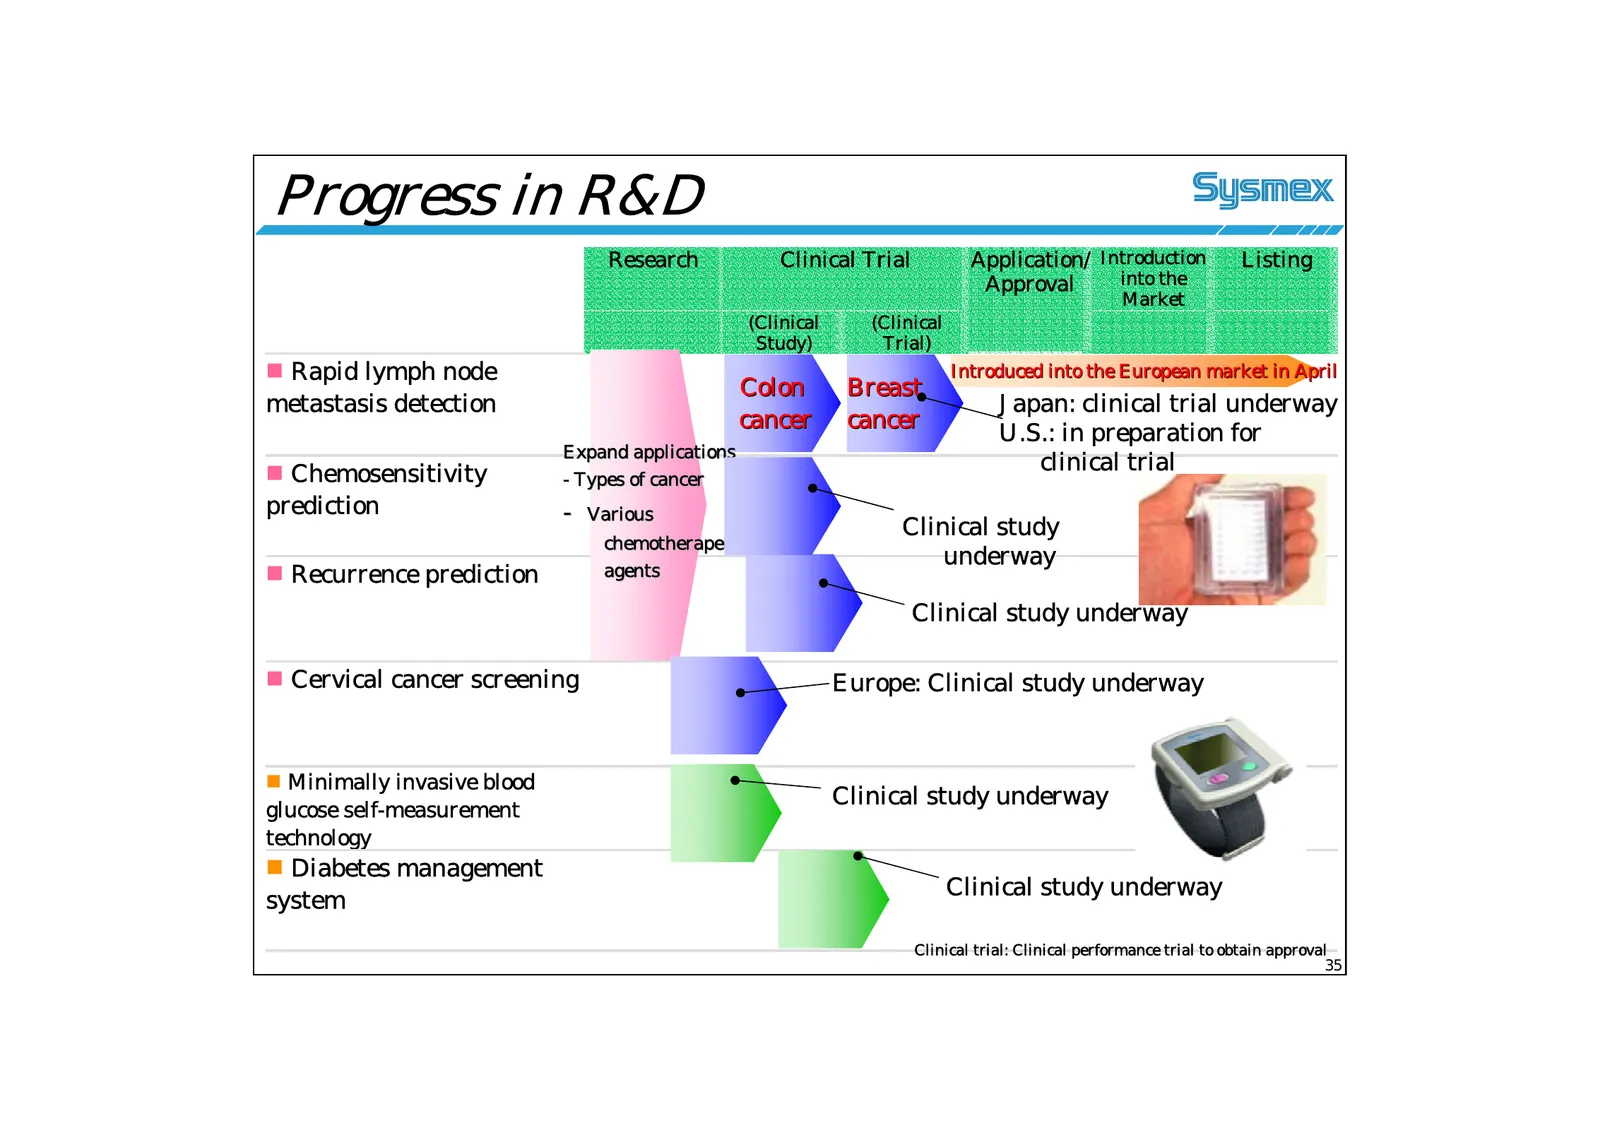
Slide 35: Progress in R&D
Progress in R&D Research Clinical Trial Application/ Introduction Listing Approval into the Market (Clinical (Clinical Study) Trial) Rapid lymph node Introduced into the European market in April Colon Breast metastasis detection Japan: clinical trial underway cancer cancer U.S.: in preparation for
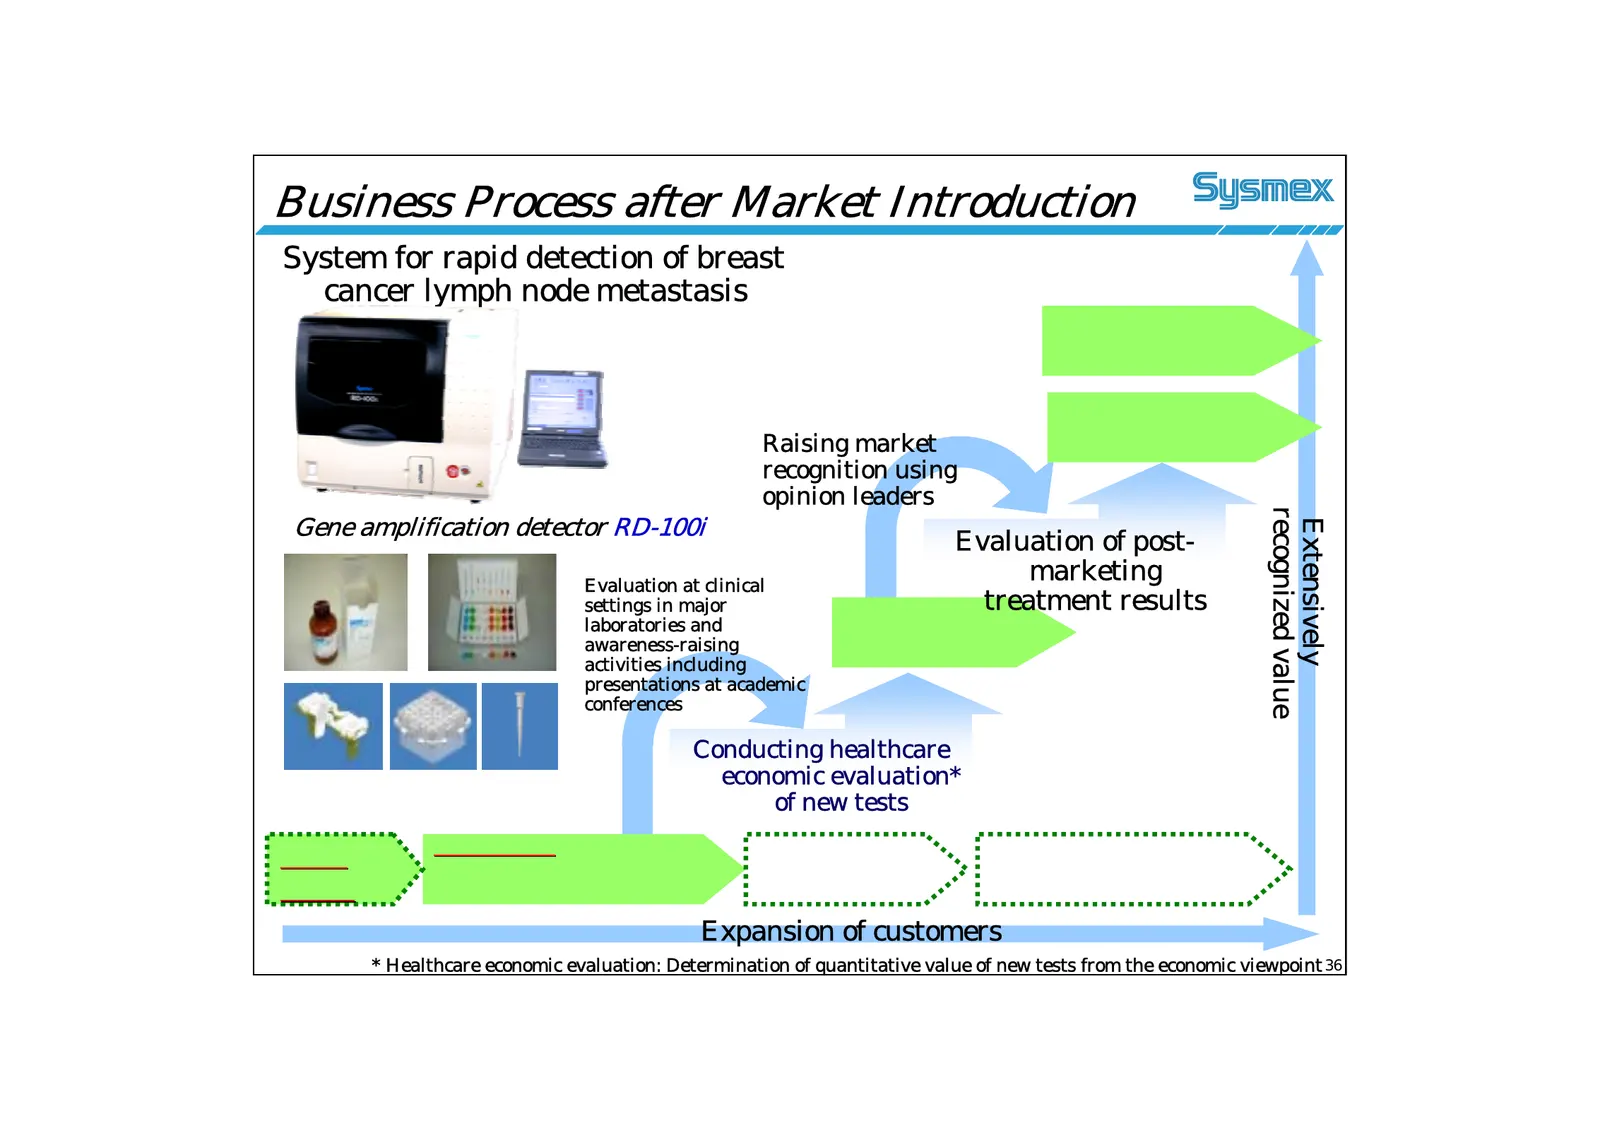
Slide 36: Extensively recognized value
Business Process after Market Introduction System for rapid detection of breast cancer lymph node metastasis Raising market recognition using opinion leaders recognized value Gene amplification detector RD-100i Extensively Evaluation of post- Evaluation at clinical marketing settings in major treatm
Slide 37: Consolidated Earnings Forecast of FY2006
Future Opportunities Consolidated Earnings Forecast of FY2006 A Unique & Global Healthcare Testing Company
Slide 38: FY2006 Consolidated Earnings Forecast
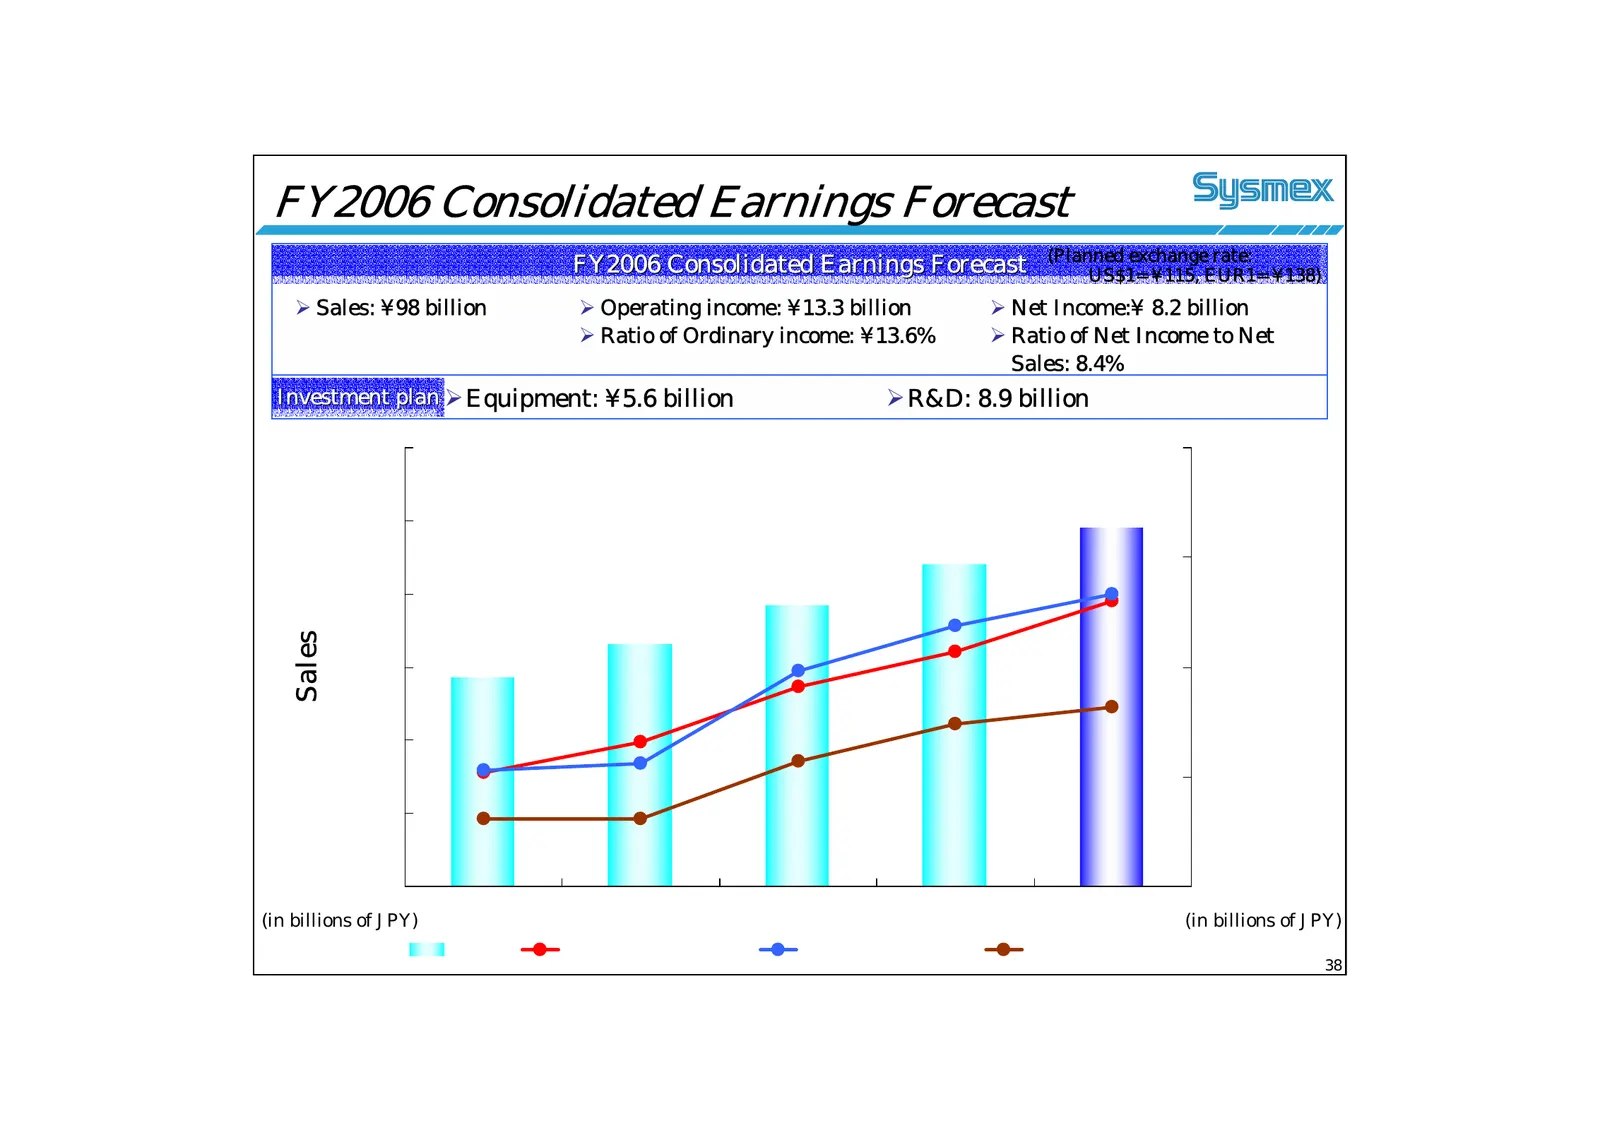
FY2006 Consolidated Earnings Forecast (Planned exchange rate: FY2006 Consolidated Earnings Forecast US$1= ¥115, EUR1= ¥138) ¾ Sales: ¥98 billion ¾ Operating income: ¥13.3 billion ¾ Net Income:¥ 8.2 billion ¾ Ratio of Ordinary income: ¥13.6% ¾ Ratio of Net Income to Net Sales: 8.4% Investment plan ¾E
Slide 39: Projected Dividend for FY2006
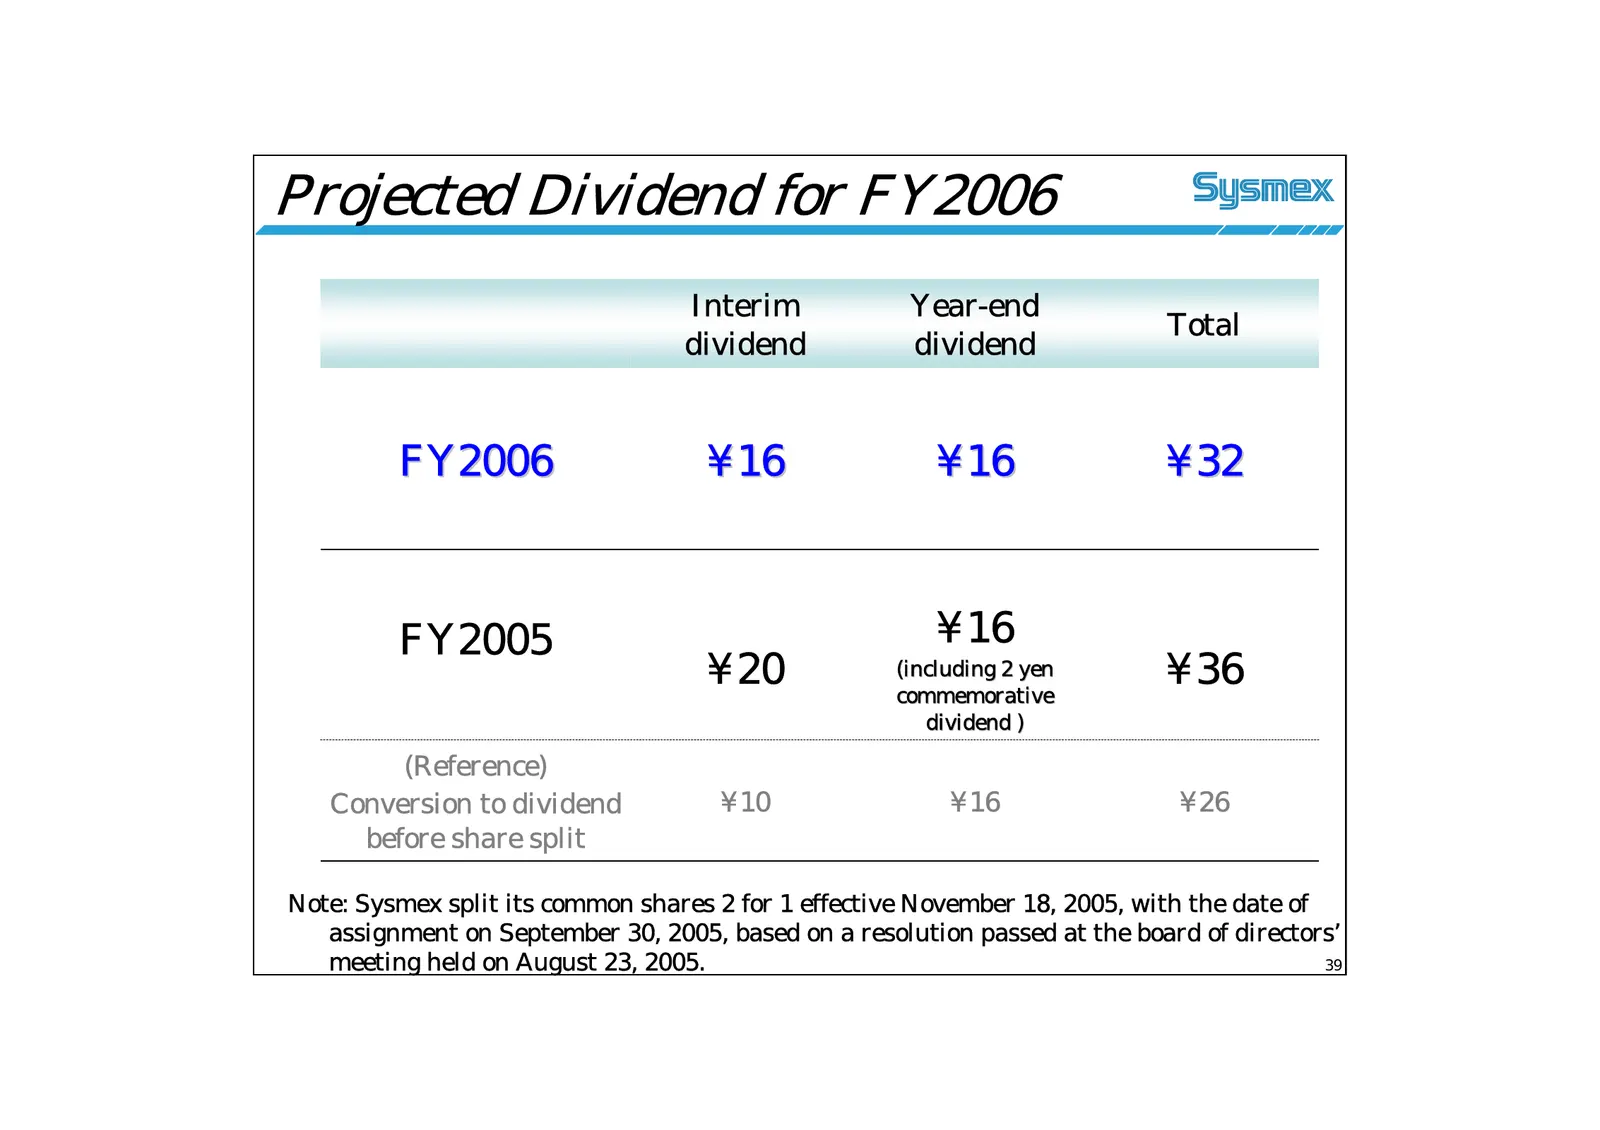
Projected Dividend for FY2006 Interim Year-end Total dividend dividend FY2006 ¥16 ¥16 ¥32 FY2005 ¥16 ¥20 (including 2 yen commemorative ¥36 dividend ) (Reference) Conversion to dividend ¥10 ¥16 ¥26 before share split Note: Sysmex split its common shares 2 for 1 effective November 18, 2005, with the
Slide 40: Challenging the Frontiers of Healthcare Testing
Challenging the Frontiers of Healthcare Testing SYSMEX CORPORATION <Contact> IR & Corporate Communication Div. Phone: 81-078-265-0500 Email: info@sysmex.co.jp URL: www.sysmex.co.jp A Unique & Global Healthcare Testing Company END
Source: Internet Archive copy of sysmex.co.jp
More decks from Sysmex Corporation
 Investor Presentation (November 2026)43 slides · Nov 10, 2026
 Q1 FY2027 Earnings Presentation33 slides · Aug 7, 2026
 Investor Presentation (2025)43 slides · 2025
 FY2011 Earnings Presentation23 slides · May 10, 2012
 FY2012 Earnings Presentation23 slides · May 10, 2012
 9M FY2012 Earnings Presentation12 slides · Feb 3, 2012