Sysmex Corporation · TSE:6869
Sysmex — Q1 FY2008 Earnings Presentation
9 slides from Sysmex's earnings presentation, Aug 4, 2008
Slide 1: FY2008 1Q Business Results
A Unique & Global Healthcare Testing Company FY2008 1Q Business Results August 4, 2008
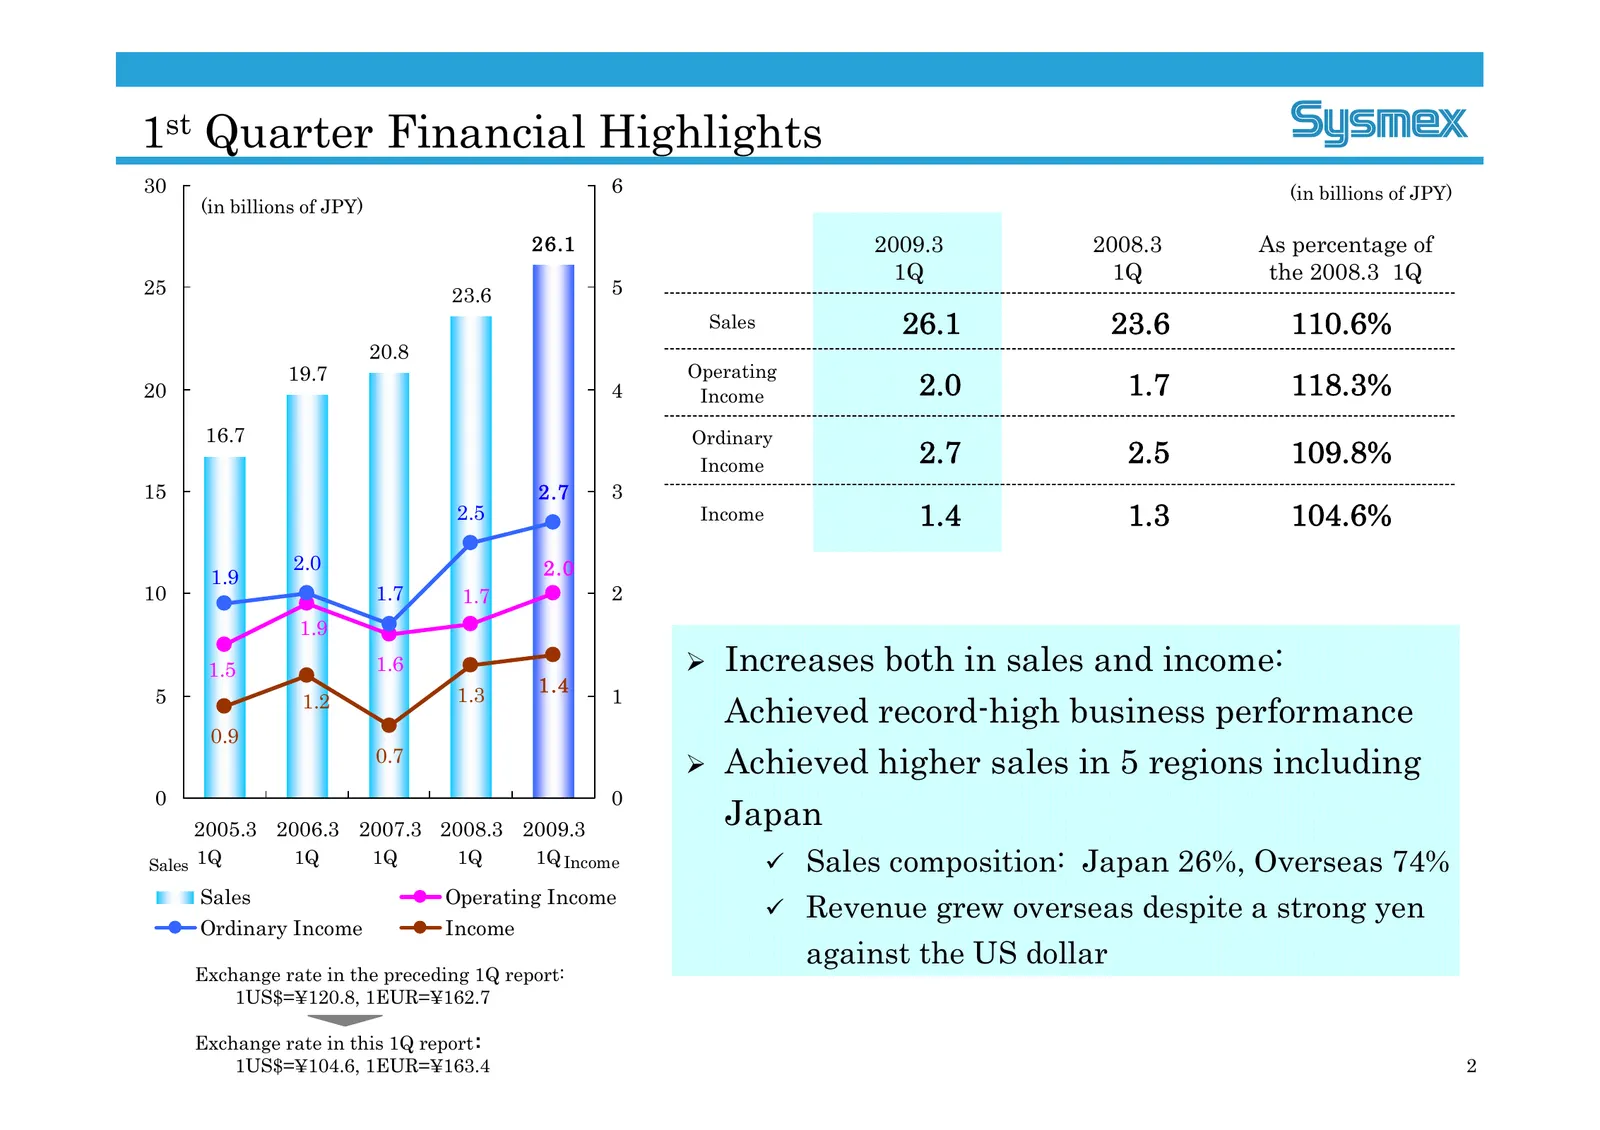
Slide 2: 1st Quarter Financial Highlights
1st Quarter Financial Highlights 30 6 (in billions of JPY) (in billions of JPY) 26.1 2009.3 2008.3 As percentage of 1Q 1Q the 2008.3 1Q 25 23.6 5 Sales 26.1 23.6 110.6% 20.8 19.7 Operating 20 4 Income 2.0 1.7 118.3% 16.7 Ordinary Income 2.7 2.5 109.8% 15 2.7 3 2.5 Income 1.4 1.3 104.6% 2.0 2.0 1.9 1
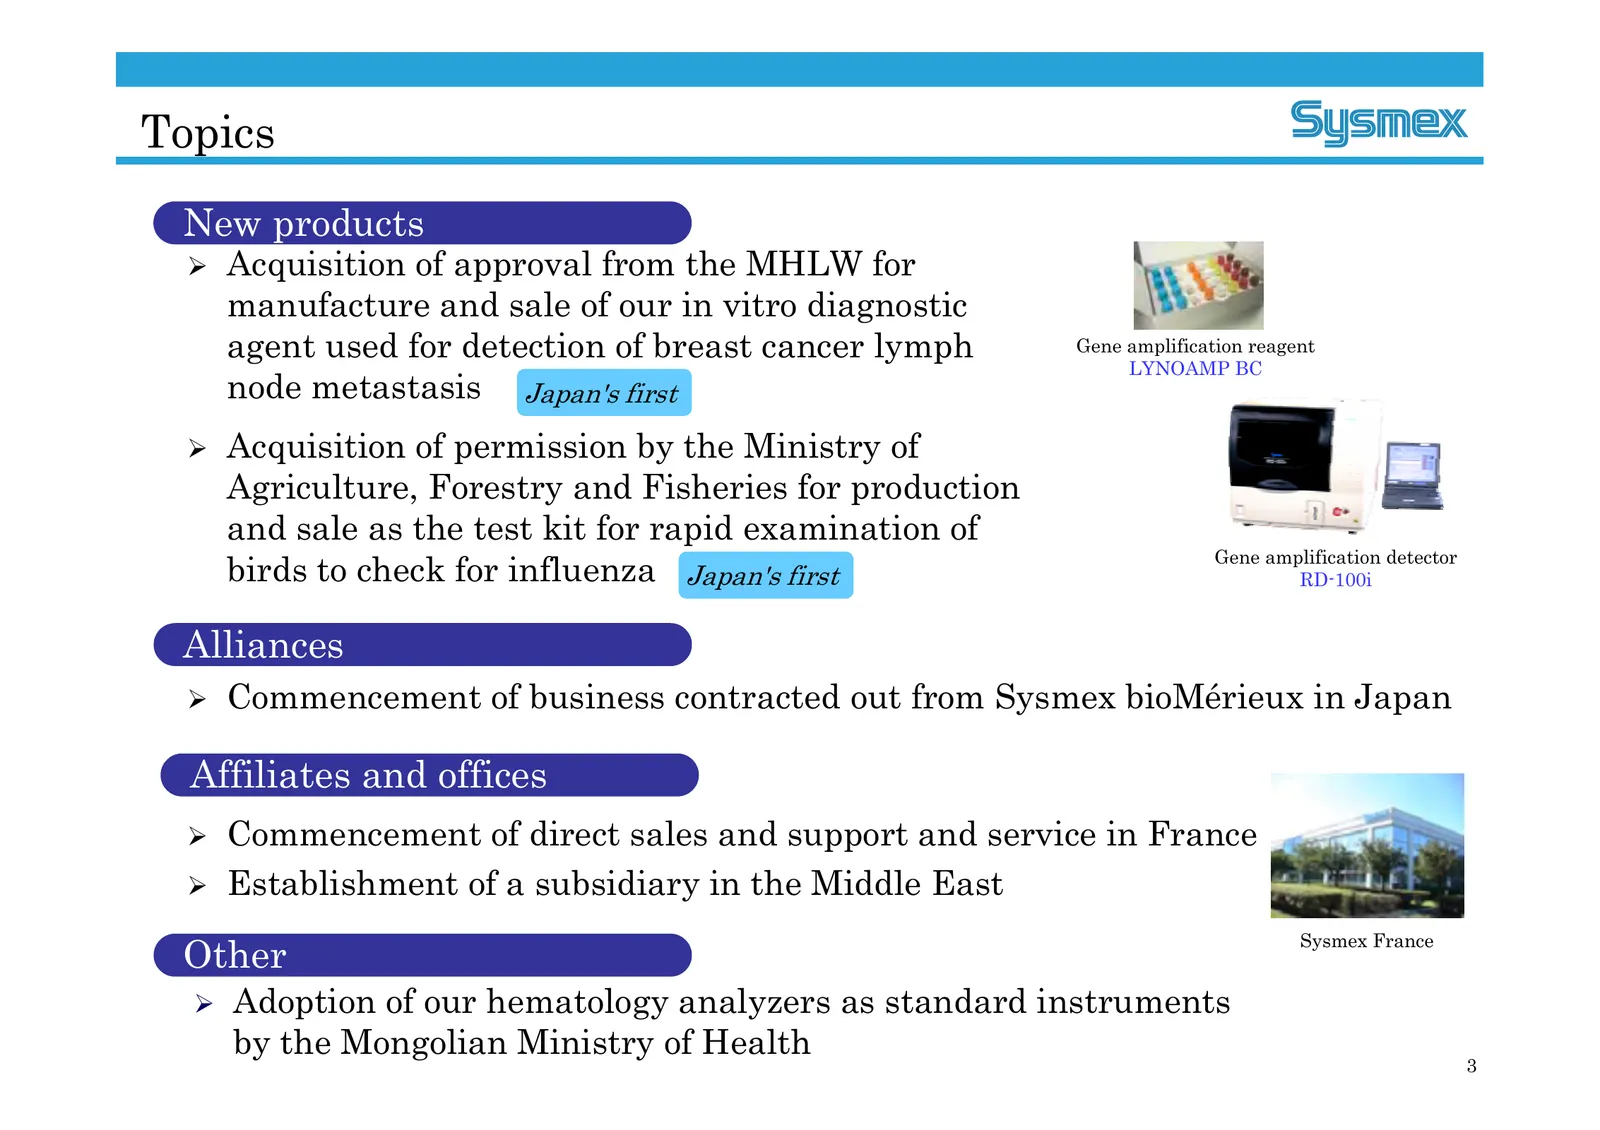
Slide 3: Topics
Topics New products ¾ Acquisition of approval from the MHLW for manufacture and sale of our in vitro diagnostic agent used for detection of breast cancer lymph Gene amplification reagent LYNOAMP BC node metastasis Japan's first ¾ Acquisition of permission by the Ministry of Agriculture, Forestry and
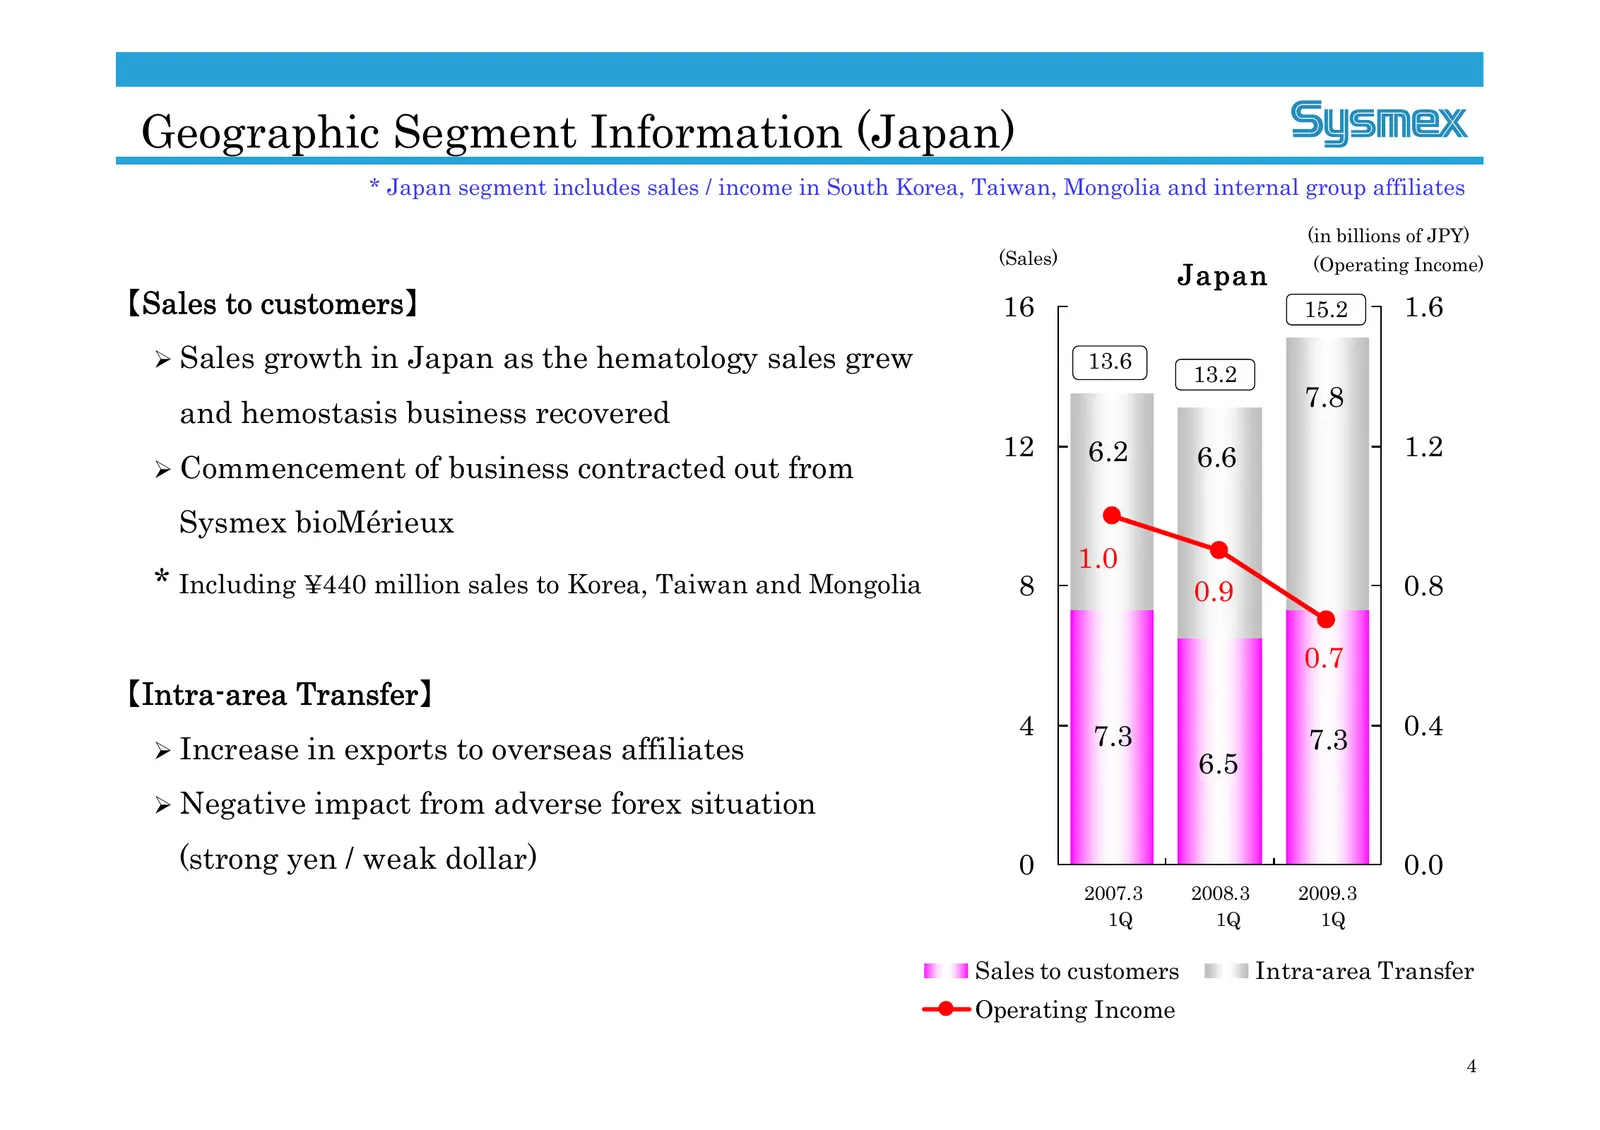
Slide 4: Geographic Segment Information (Japan)
Geographic Segment Information (Japan) * Japan segment includes sales / income in South Korea, Taiwan, Mongolia and internal group affiliates (in billions of JPY) (Sales) (Operating Income) Japan 【Sales to customers】 16 15.2 1.6 ¾ Sales growth in Japan as the hematology sales grew 13.6 13.2 7.8 and
Slide 5: Geographic Segment Information (Americas & Europe)
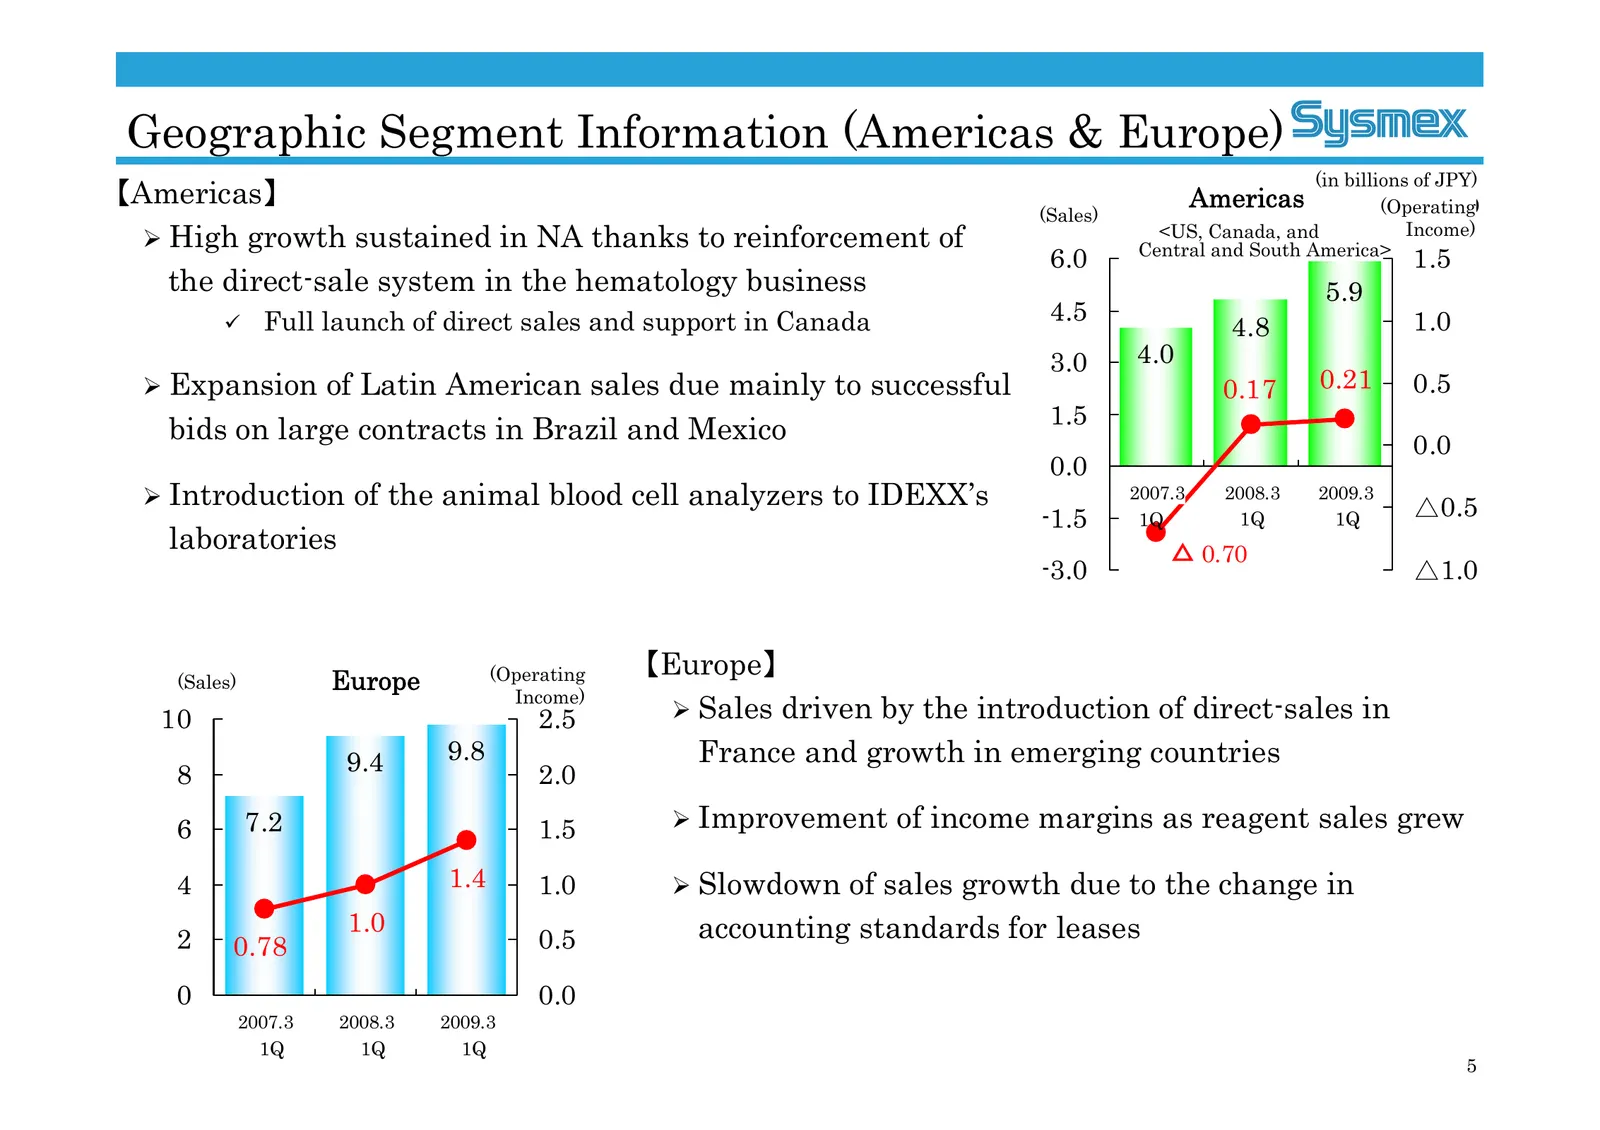
Geographic Segment Information (Americas & Europe) (in billions of JPY) 【Americas】 (売上高) Americas 米州 (Operating (営業利益) (Sales) ¾ High growth sustained in NA thanks to reinforcement of <US, Canada, and Central and South America> Income) 6.0 1.5 the direct-sale system in the hematology business 5.9 Fu
Slide 6: Geographic Segment Information (China & AP)
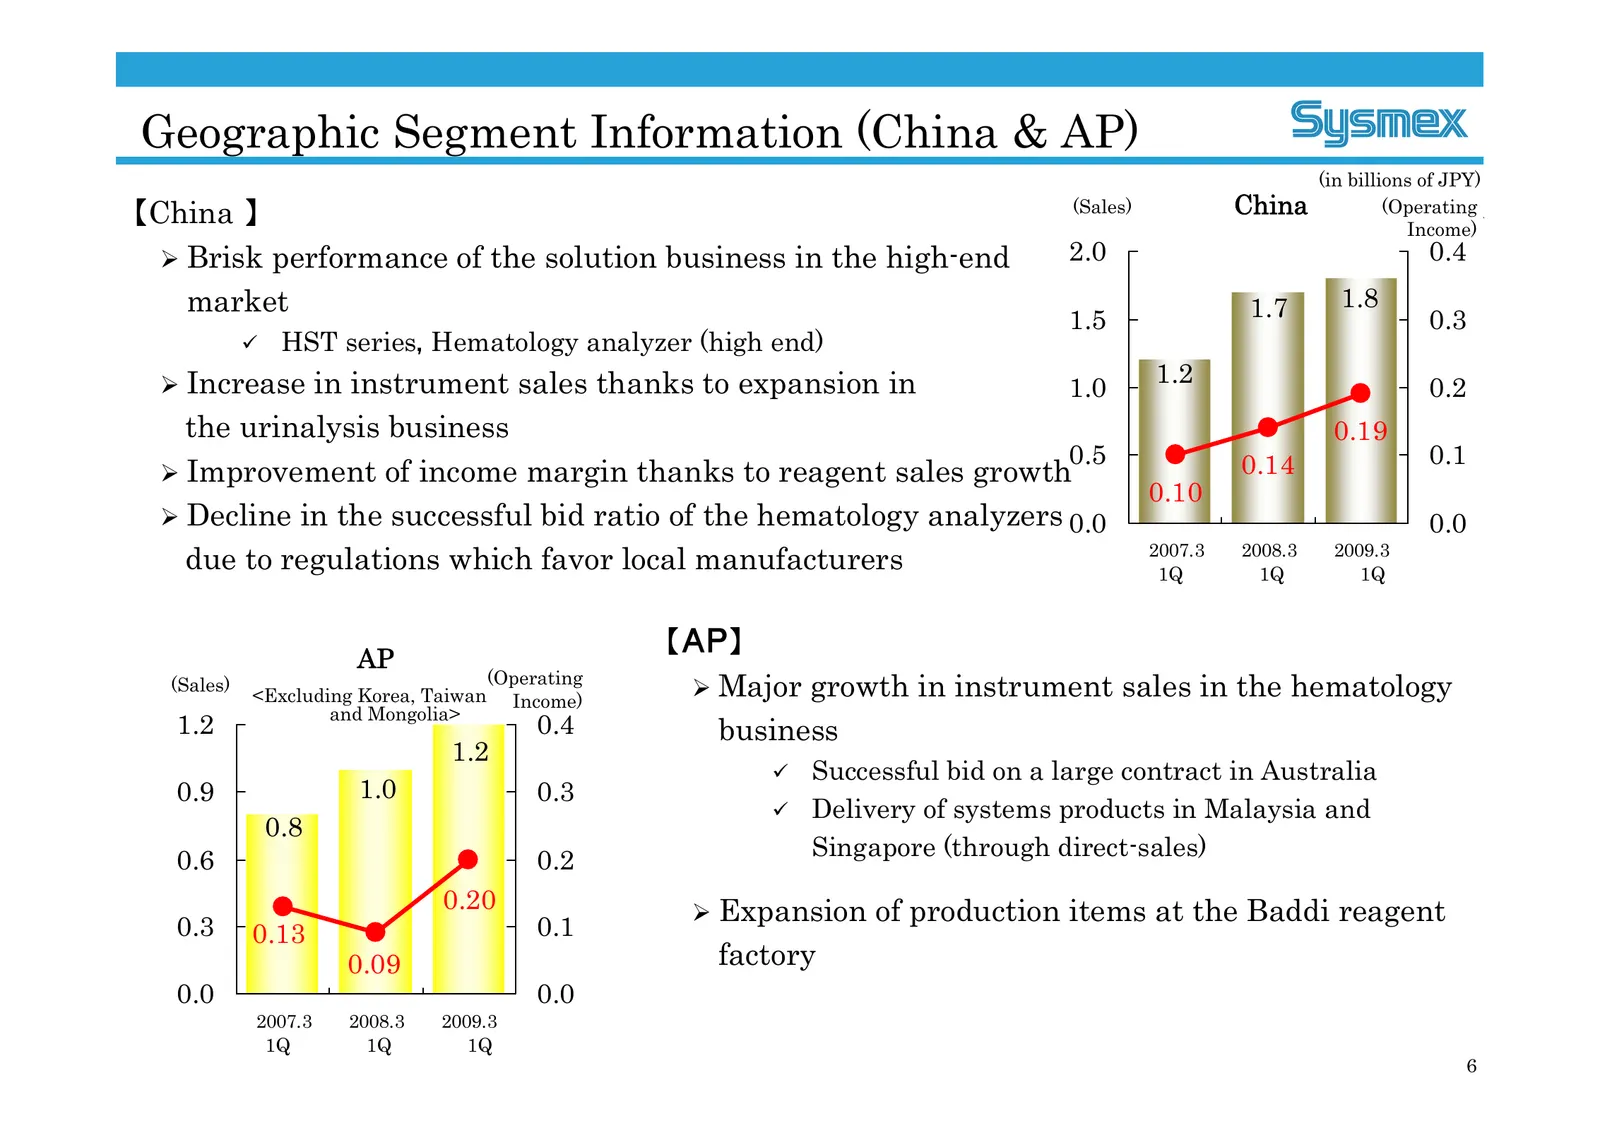
Geographic Segment Information (China & AP) (in billions of JPY) 【China 】 (Sales) China (Operating (売上高) 中国 (営業利益 Income) ¾ Brisk performance of the solution business in the high-end 2.0 0.4 market 1.7 1.8 1.5 0.3 9 HST series, Hematology analyzer (high end) ¾ Increase in instrument sales thanks to
Slide 7: FY2008 Consolidated Earnings Forecast
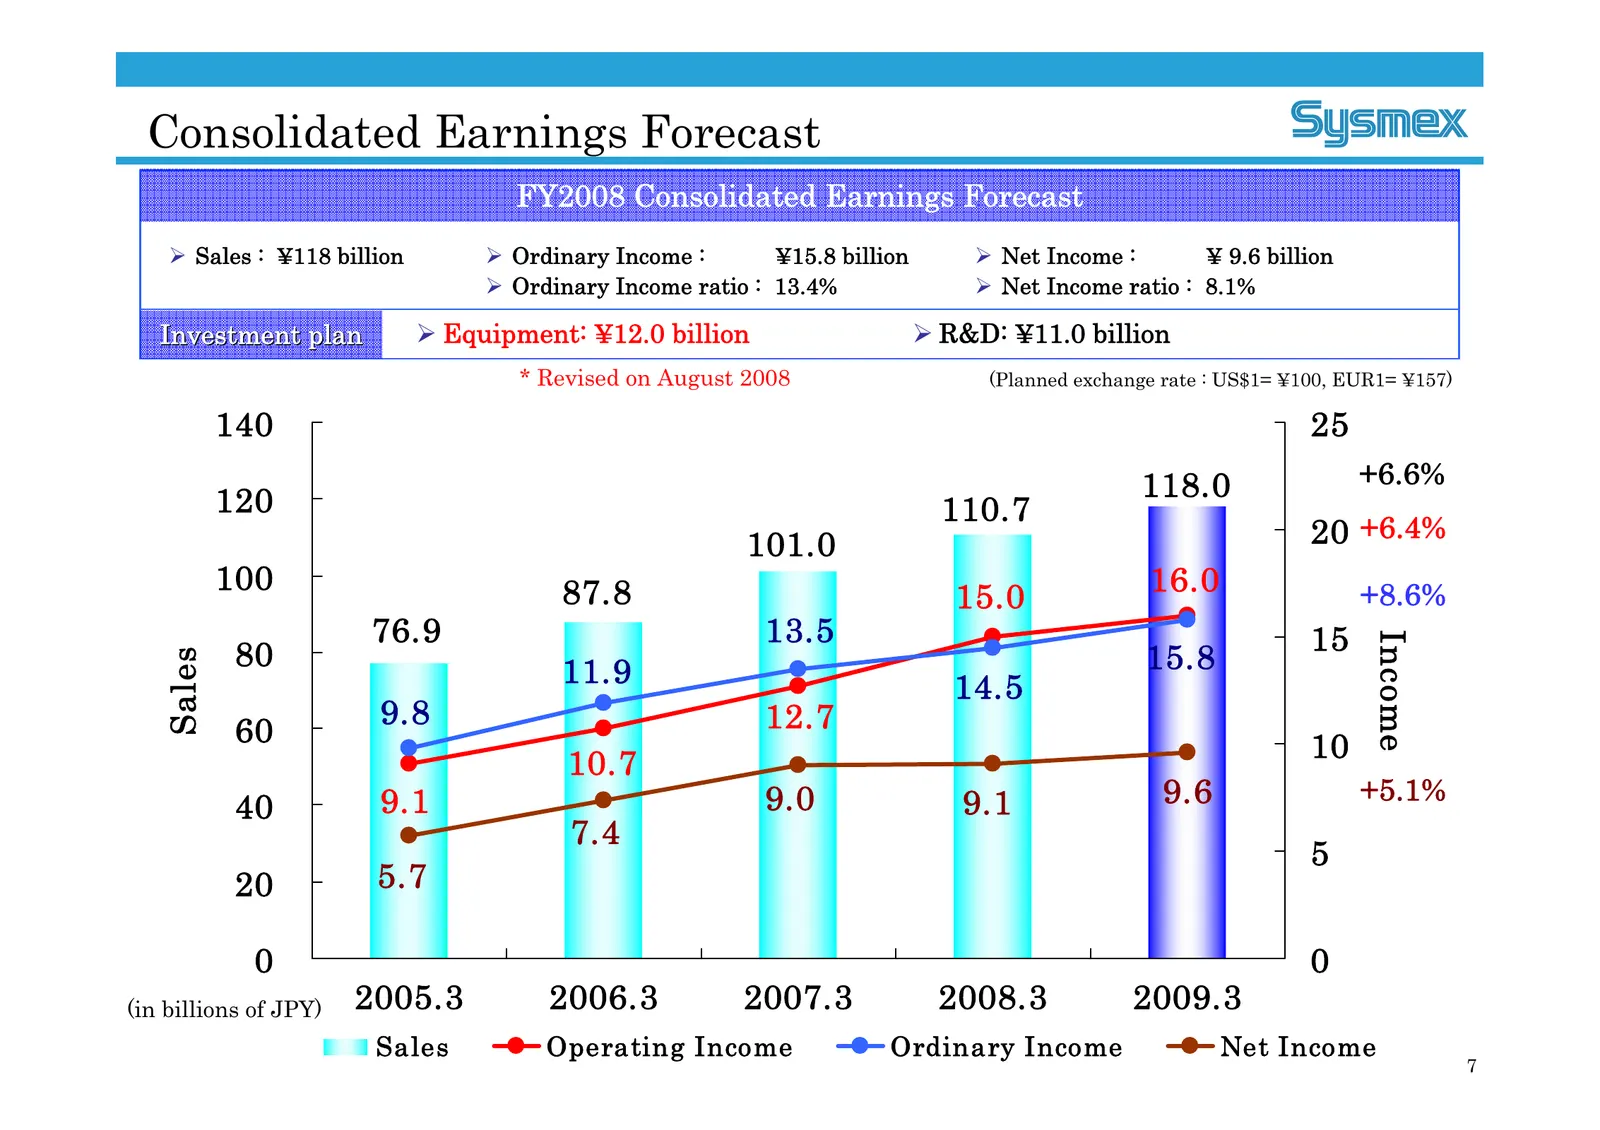
Consolidated Earnings Forecast FY2008 Consolidated Earnings Forecast ¾ Sales : ¥118 billion ¾ Ordinary Income : ¥15.8 billion ¾ Net Income : ¥ 9.6 billion ¾ Ordinary Income ratio : 13.4% ¾ Net Income ratio : 8.1% Investment plan ¾ Equipment: ¥12.0 billion ¾ R&D: ¥11.0 billion * Revised on August 200
Slide 8: Projected Dividend
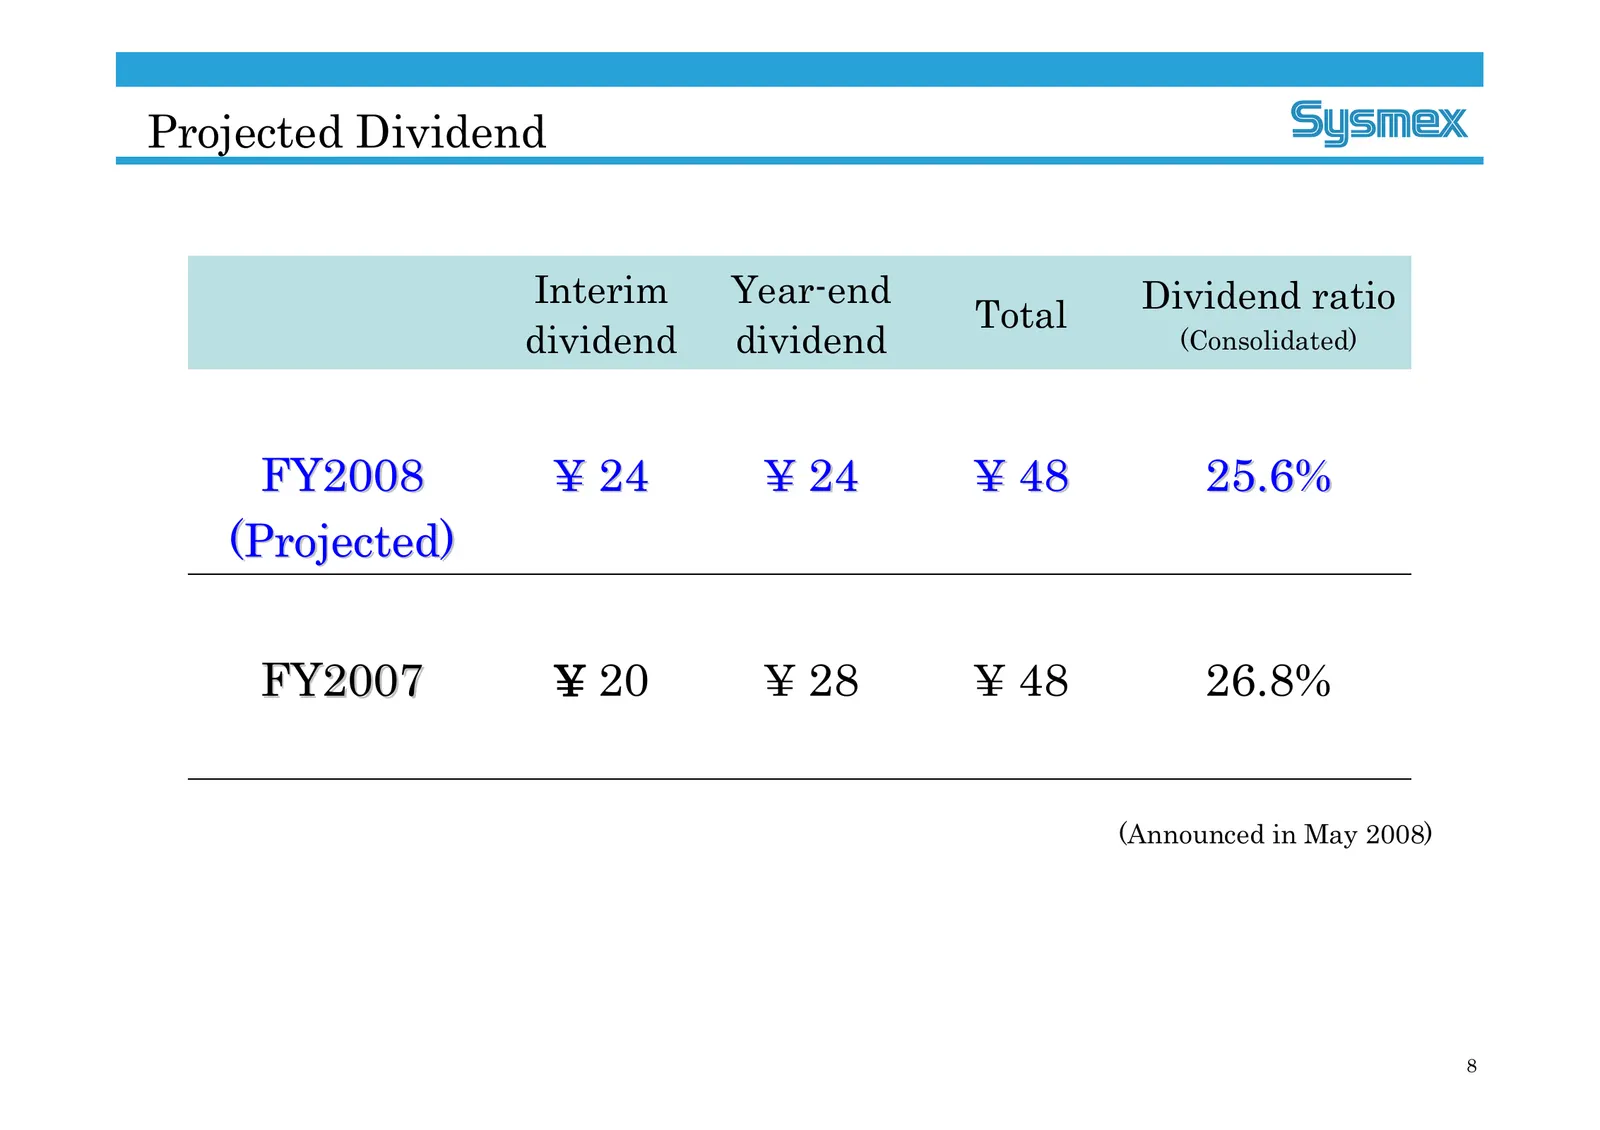
Projected Dividend Interim Year-end Dividend ratio Total dividend dividend (Consolidated) FY2008 ¥ 24 ¥ 24 ¥ 48 25.6% (Projected) FY2007 ¥ 20 ¥ 28 ¥ 48 26.8% (Announced in May 2008) 8
Slide 9: Challenging the Frontiers of Healthcare Testing
Forward-looking Statements This material contains forward-looking statements about Sysmex Corporation and its group companies (the Sysmex Group). These forward-looking statements are based on the current judgments and assumptions of the Sysmex Group in light of the information currently available to
Source: Internet Archive copy of sysmex.co.jp
More decks from Sysmex Corporation
 Investor Presentation (November 2026)43 slides · Nov 10, 2026
 Q1 FY2027 Earnings Presentation33 slides · Aug 7, 2026
 Investor Presentation (2025)43 slides · 2025
 FY2011 Earnings Presentation23 slides · May 10, 2012
 FY2012 Earnings Presentation23 slides · May 10, 2012
 9M FY2012 Earnings Presentation12 slides · Feb 3, 2012