Franklin Financial Network Inc
Franklin Financial Network — Q3 2016 Earnings Presentation
16 slides from Franklin Financial Network's earnings presentation, Oct 18, 2016
Slide 1: Third Quarter 2016 Investor Call
Franklin Financial Network, Inc. (NYSE:FSB) Third Quarter 2016 Investor Call October 19, 2016
Slide 2: Forward-Looking Statements
2 Forward - Looking Statements Except for the historical information contained herein, this presentation contains forward - looking statements within the meaning of Section 27A of the Securities Act of 1933, as amended, and Section 21E of the Securities Exchange Act of 1934, as amended. The forward
Slide 3: Third Quarter Highlights
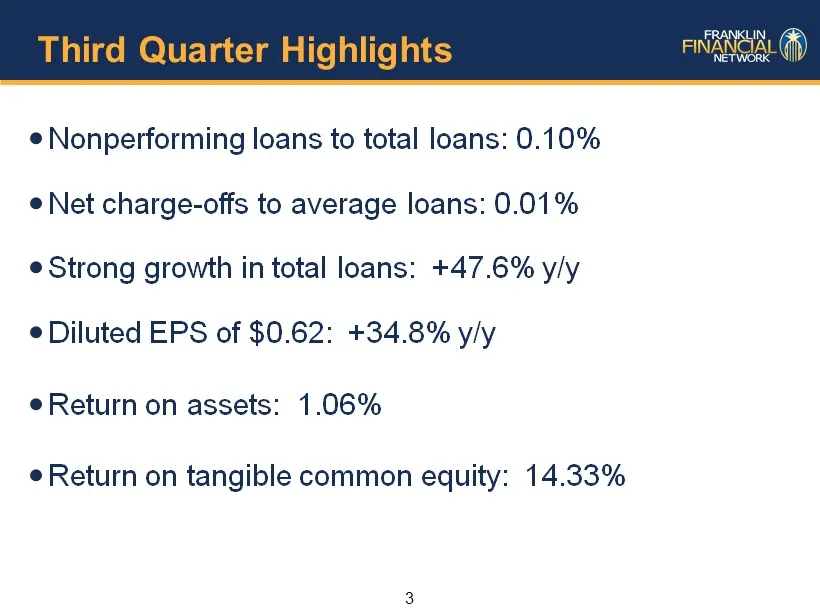
3 Third Quarter Highlights Nonperforming loans to total loans: 0.10% Net charge - offs to average loans: 0.01% Strong growth in total loans: +47.6% y/y D iluted EPS of $0.62: +34.8% y/y Return on assets: 1.06% Return on tangible common equity: 14.33%
Slide 4: Third Quarter Financial Summary
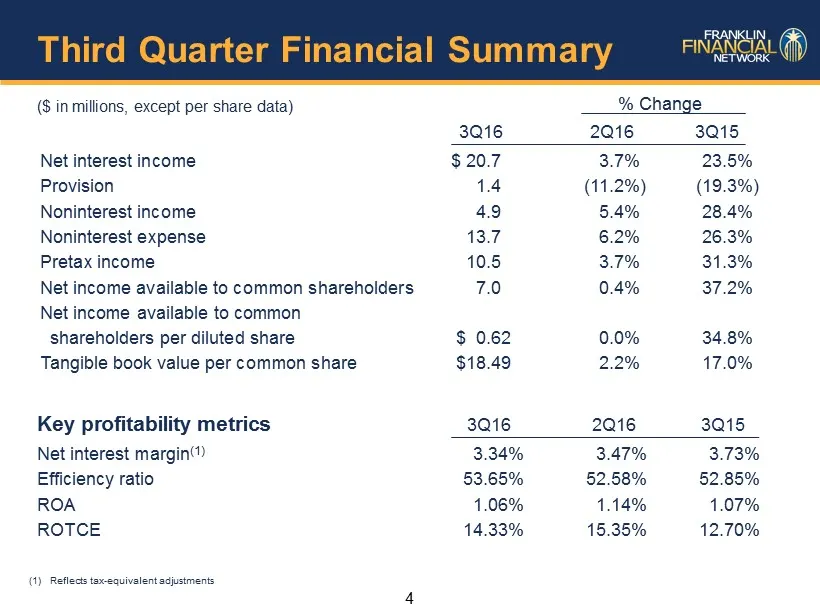
4 Third Quarter Financial Summary ($ in millions, except per share data) % Change 3Q16 2Q16 3Q15 Net interest income $ 20.7 3.7% 23.5% Provision 1.4 (11.2%) (19.3%) Noninterest income 4.9 5.4% 28.4% Noninterest expense 13.7 6.2% 26.3% Pretax income 10.5 3.7% 31.3% Net income available to common shar
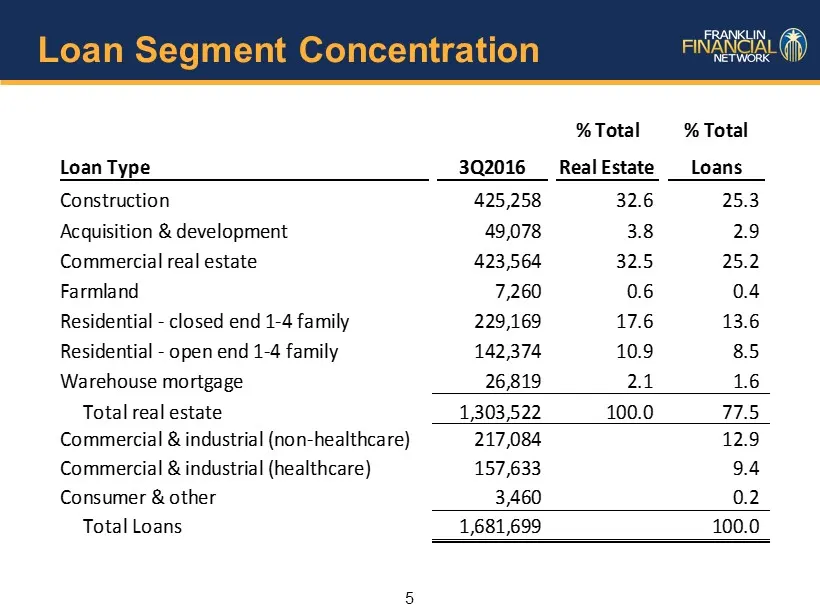
Slide 5: Loan Segment Concentration
5 Loan Segment Concentration Loan Type 3Q2016 % Total Real Estate % Total Loans Construction 425,258 32.6 25.3 Acquisition & development 49,078 3.8 2.9 Commercial real estate 423,564 32.5 25.2 Farmland 7,260 0.6 0.4 Residential - closed end 1-4 family 229,169 17.6 13.6 Residential - open end 1-4 fam
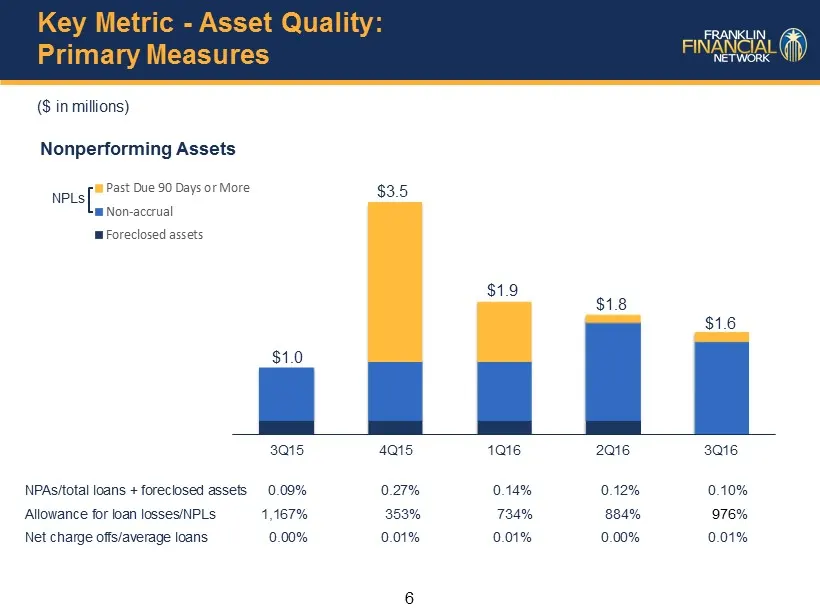
Slide 6: Key Metric - Asset Quality: Primary Measures
6 Key Metric - Asset Quality: Primary Measures ($ in millions) Nonperforming Assets NPAs/total loans + foreclosed assets 0.09% 0.27% 0.14% 0.12% 0.10% Allowance for loan losses/NPLs 1,167% 353% 734% 884% 976 % Net charge offs/average loans 0.00% 0.01% 0.01% 0.00% 0.01% 3Q15 4Q15 1Q16 2Q16 3Q16 Past
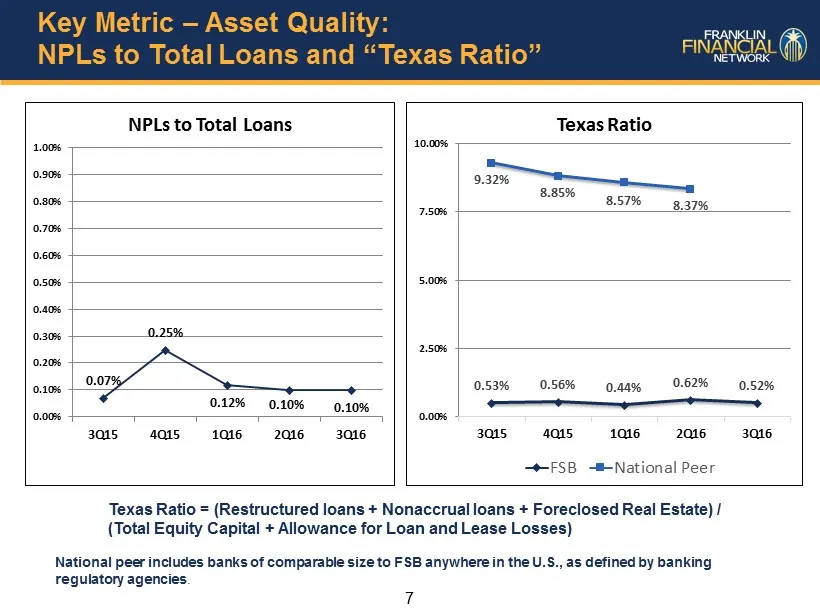
Slide 7: Key Metric - Asset Quality: NPLs to Total Loans and Texas Ratio
7 Key Metric – Asset Quality: NPLs to Total Loans and “Texas Ratio” 0.07% 0.25% 0.12% 0.10% 0.10% 0.00% 0.10% 0.20% 0.30% 0.40% 0.50% 0.60% 0.70% 0.80% 0.90% 1.00% 3Q15 4Q15 1Q16 2Q16 3Q16 NPLs to Total Loans Texas Ratio = (Restructured loans + Nonaccrual loans + Foreclosed Real Estate) / (Total Equ
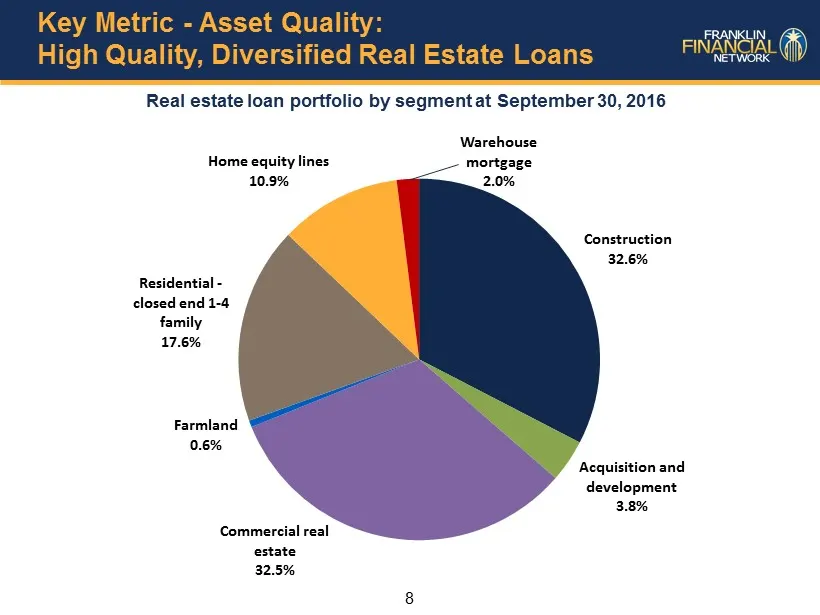
Slide 8: Key Metric - Asset Quality: High Quality, Diversified Real Estate Loans
8 Key Metric - Asset Quality: High Quality, Diversified Real Estate Loans Real estate loan portfolio by segment at September 30, 2016 Construction 32.6% Acquisition and development 3.8% Commercial real estate 32.5% Farmland 0.6% Residential - closed end 1 - 4 family 17.6% Home equity lines 10.9% War
Slide 9: Key Metric - Growth: Loans
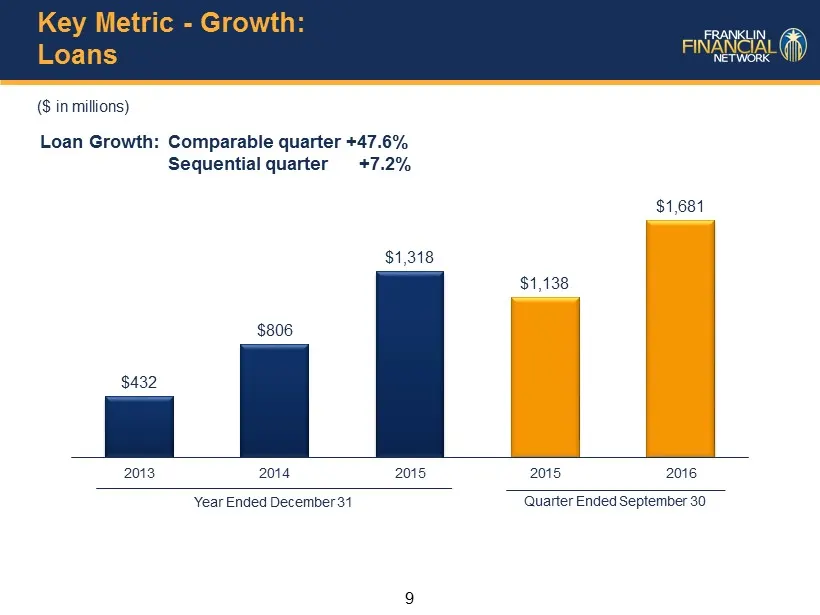
9 Key Metric - Growth: Loans ($ in millions) Loan Growth: Comparable quarter +47.6% Sequential quarter +7.2% $432 $806 $1,318 $1,138 $1,681 2013 2014 2015 2015 2016 Year Ended December 31 Quarter Ended September 30
Slide 10: Key Metric - Growth: Annual Loan Growth
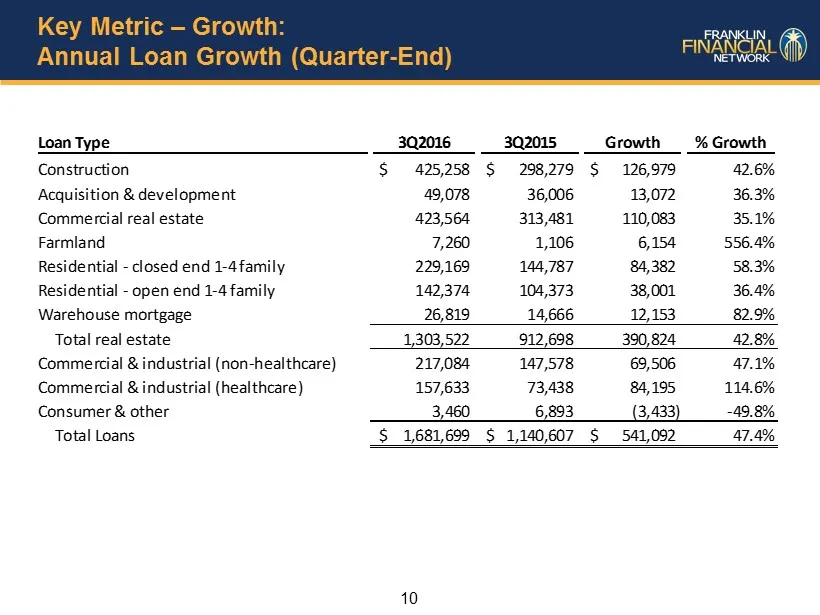
10 Key Metric – Growth: Annual Loan Growth (Quarter - End) Loan Type 3Q2016 3Q2015 Growth % Growth Construction 425,258$ 298,279$ 126,979$ 42.6% Acquisition & development 49,078 36,006 13,072 36.3% Commercial real estate 423,564 313,481 110,083 35.1% Farmland 7,260 1,106 6,154 556.4% Residential - c
Slide 11: Key Metric - Growth: Loan Portfolio Diversification
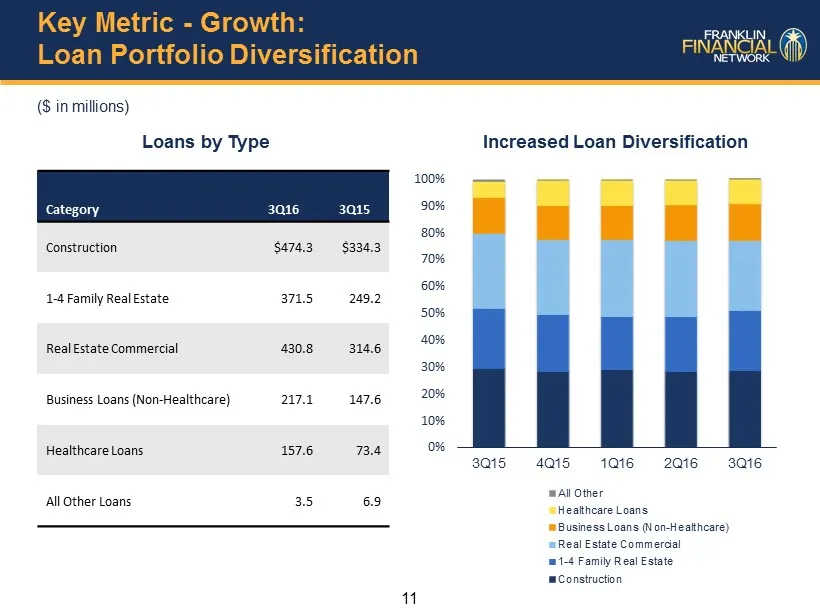
11 Key Metric - Growth : Loan Portfolio Diversification Category 3Q16 3Q15 Construction $474.3 $334.3 1 - 4 Family Real Estate 371.5 249.2 Real Estate Commercial 430.8 314.6 Business Loans (Non - Healthcare) 217.1 147.6 Healthcare Loans 157.6 73.4 All Other Loans 3.5 6.9 ($ in millions) Increased Lo
Slide 12: Key Metric - Growth: Substantial Increase in Deposits
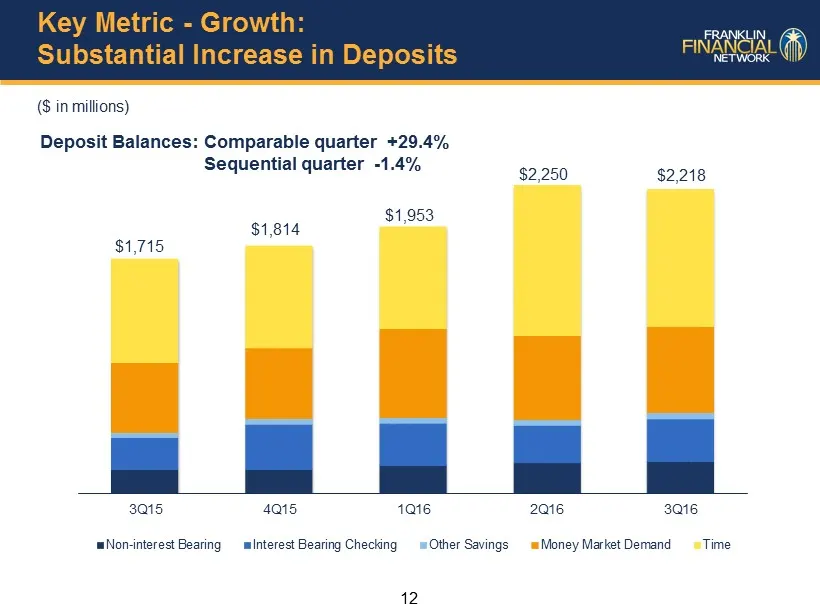
12 Key Metric - Growth: Substantial Increase in Deposits ($ in millions) Deposit Balances: Comparable quarter +29.4% Sequential quarter - 1.4% 3Q15 4Q15 1Q16 2Q16 3Q16 Non-interest Bearing Interest Bearing Checking Other Savings Money Market Demand Time $1,715 $1,814 $1,953 $2,250 $2,218
Slide 13: Key Metric - Profitability: Relatively Stable Net Interest Margin
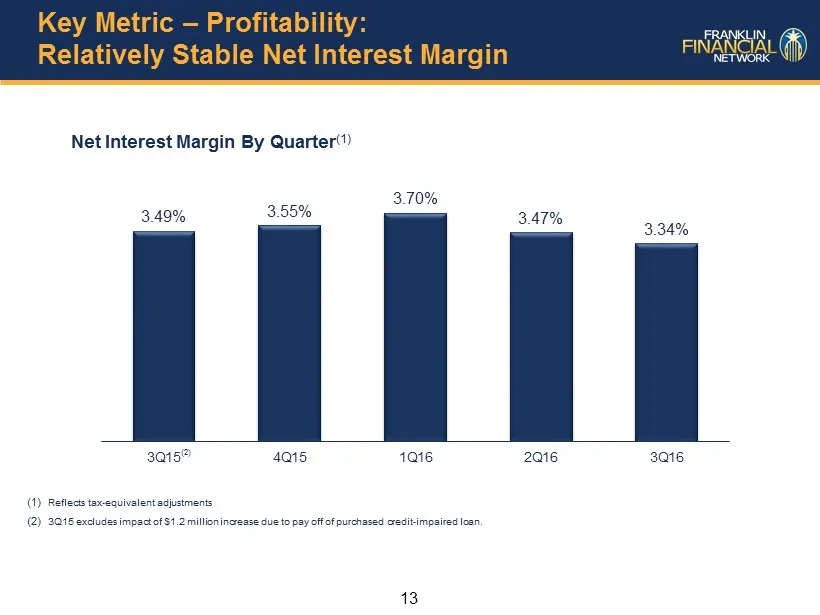
13 Key Metric – Profitability: Relatively Stable Net Interest Margin Net Interest Margin By Quarter (1) 3.49% 3.55% 3.70% 3.47% 3.34% 3Q15 4Q15 1Q16 2Q16 3Q16 (1) Reflects tax - equivalent adjustments (2) 3Q15 excludes impact of $1.2 million increase due to pay off of purchased credit - impaired loa
Slide 14: Key Metric - Profitability: Significant Growth in Noninterest Income
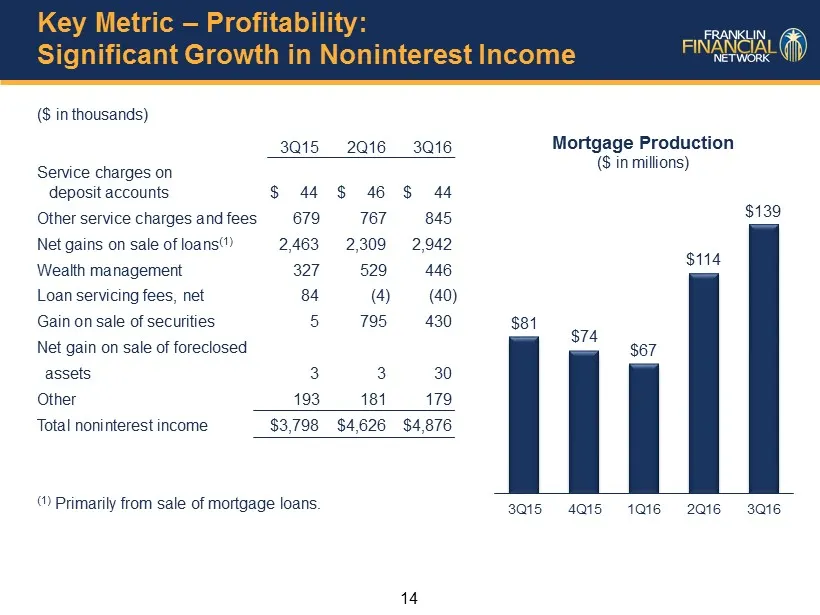
14 Key Metric – Profitability: Significant Growth in Noninterest Income ($ in thousands) 3Q15 2Q16 3Q16 Service charges on deposit accounts $ 44 $ 46 $ 44 Other service charges and fees 679 767 845 Net gains on sale of loans (1) 2,463 2,309 2,942 Wealth management 327 529 446 Loan servicing fees, ne
Slide 15: Key Metric - Profitability: Noninterest Expense and Economies of Scale
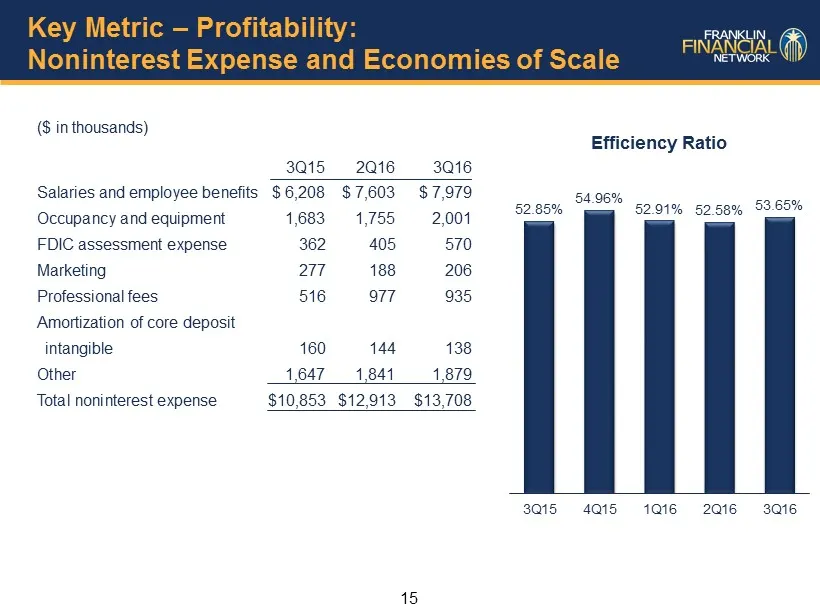
15 Key Metric – Profitability: Noninterest Expense and Economies of Scale ($ in thousands) 3Q15 2Q16 3Q16 Salaries and employee benefits $ 6,208 $ 7,603 $ 7,979 Occupancy and equipment 1,683 1,755 2,001 FDIC assessment expense 362 405 570 Marketing 277 188 206 Professional fees 516 977 935 Amortizat
Slide 16: Key Elements of FSB Performance
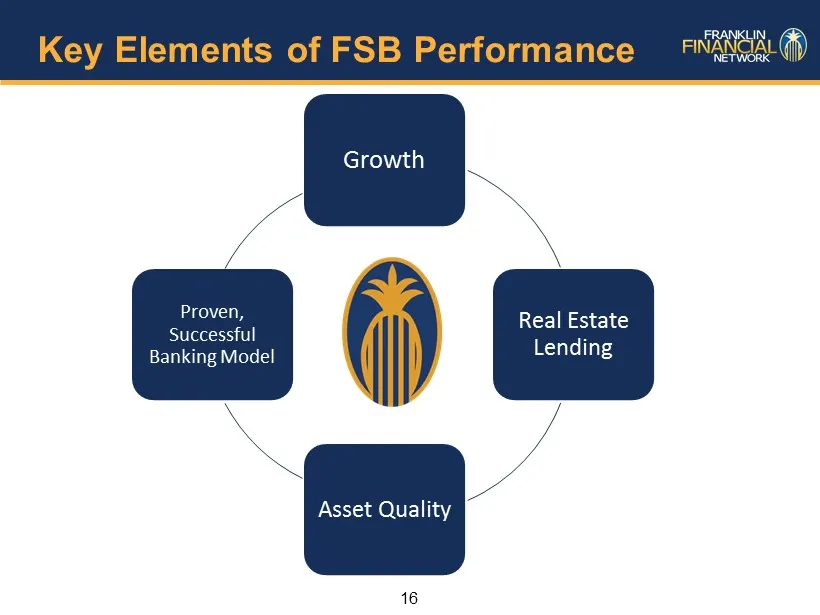
16 Key Elements of FSB Performance Growth Real Estate Lending Asset Quality Proven, Successful Banking Model
Source: SEC EDGAR · 8-K filed Oct 18, 2016
More decks from Franklin Financial Network Inc
 Merger or Acquisition (January 2020)17 slides · Jan 21, 2020
 Q3 2019 Earnings Presentation21 slides · Nov 1, 2019
 Q3 2019 Earnings Presentation15 slides · Oct 23, 2019
 Q2 2019 Earnings Presentation19 slides · Jul 26, 2019
 Q2 2019 Earnings Presentation15 slides · Jul 24, 2019
 Q1 2019 Earnings Presentation19 slides · May 10, 2019