CL Educate Ltd. · NSE:CLEDUCATE
CL Educate — Q4 FY23 Earnings Presentation
23 slides from CL Educate's earnings presentation, May 2023
Slide 1: Q4 FY23 Investor Presentation
Excellence Since 1995 Q4 FY23 Investor Presentation
Slide 2: Core Values
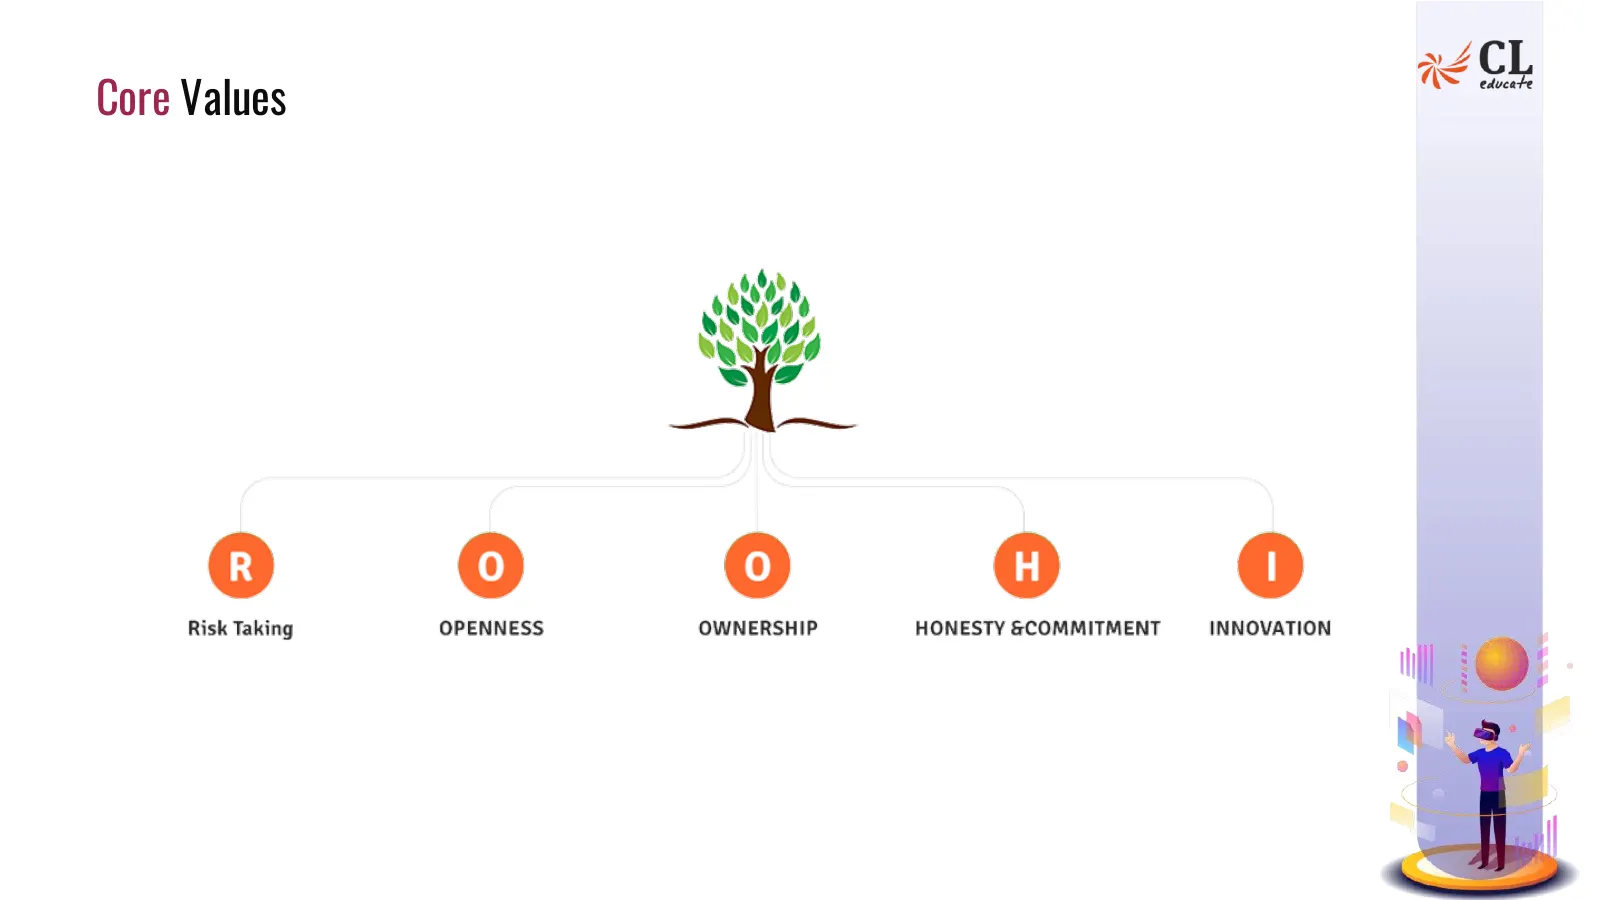
Core Values LR 0) oO Oo oO Risk Taking OPENNESS OWNERSHIP HONESTY &COMMITMENT INNOVATION
Slide 3: Safe Harbour
Safe Harbour This presentation has been prepared by CL Educate Limited (the “Company”) solely for information purposes without any regard to any specific objectives, financial situations or information needs of any particular person. This presentation and its contents are confidential and should not
Slide 4: Chairman Speaks
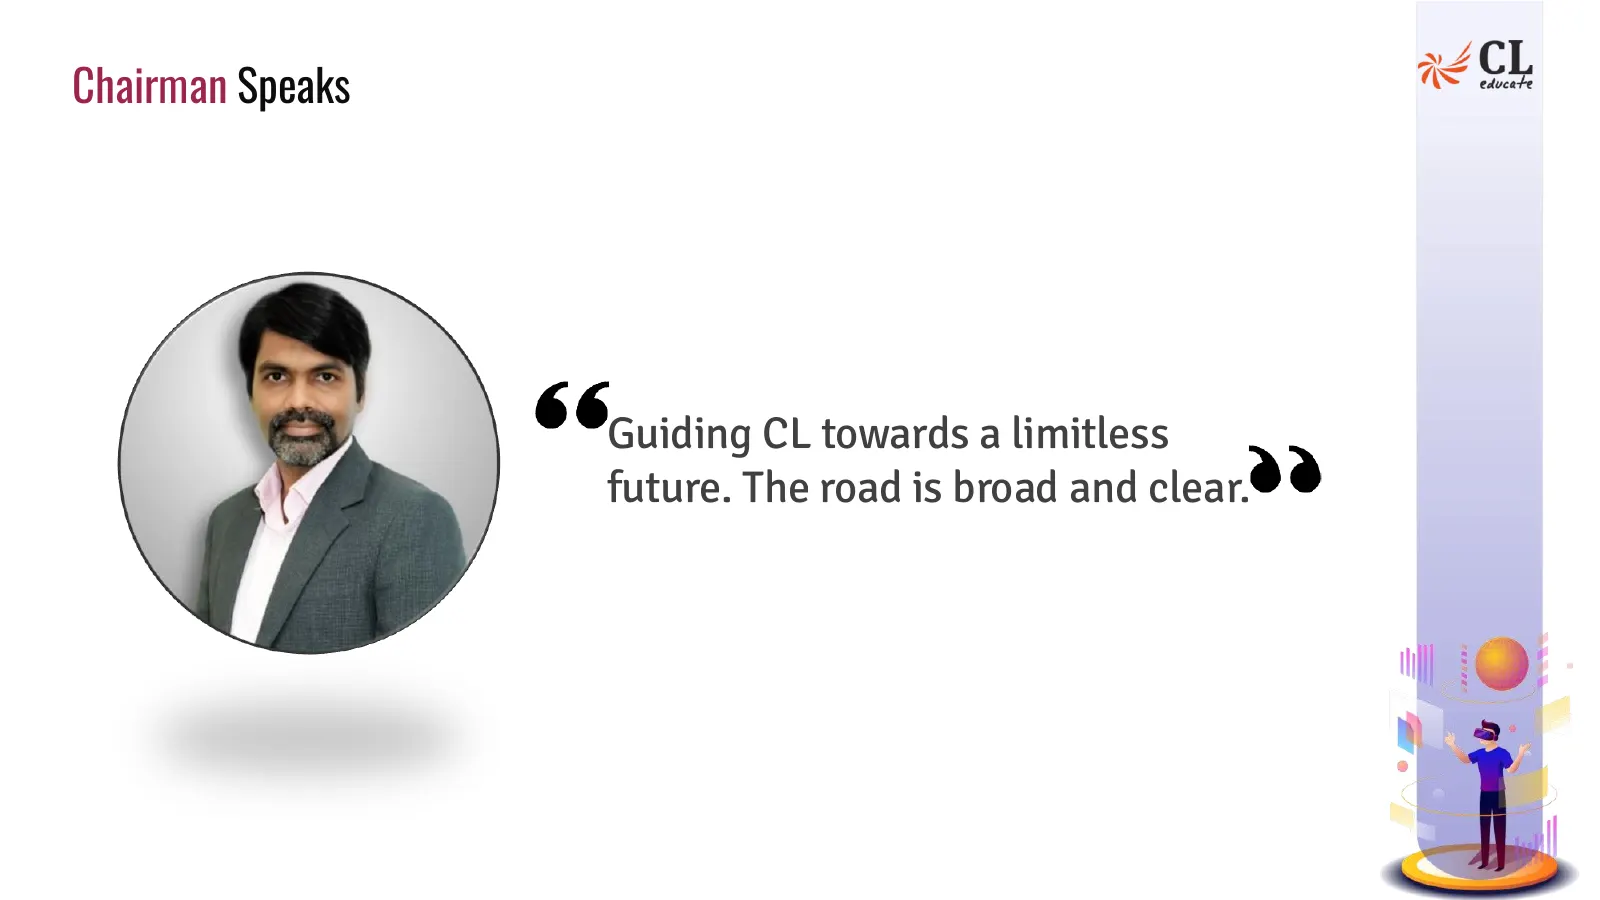
Chairman Speaks Guiding CL towards a limitless future. The road is broad and clear.
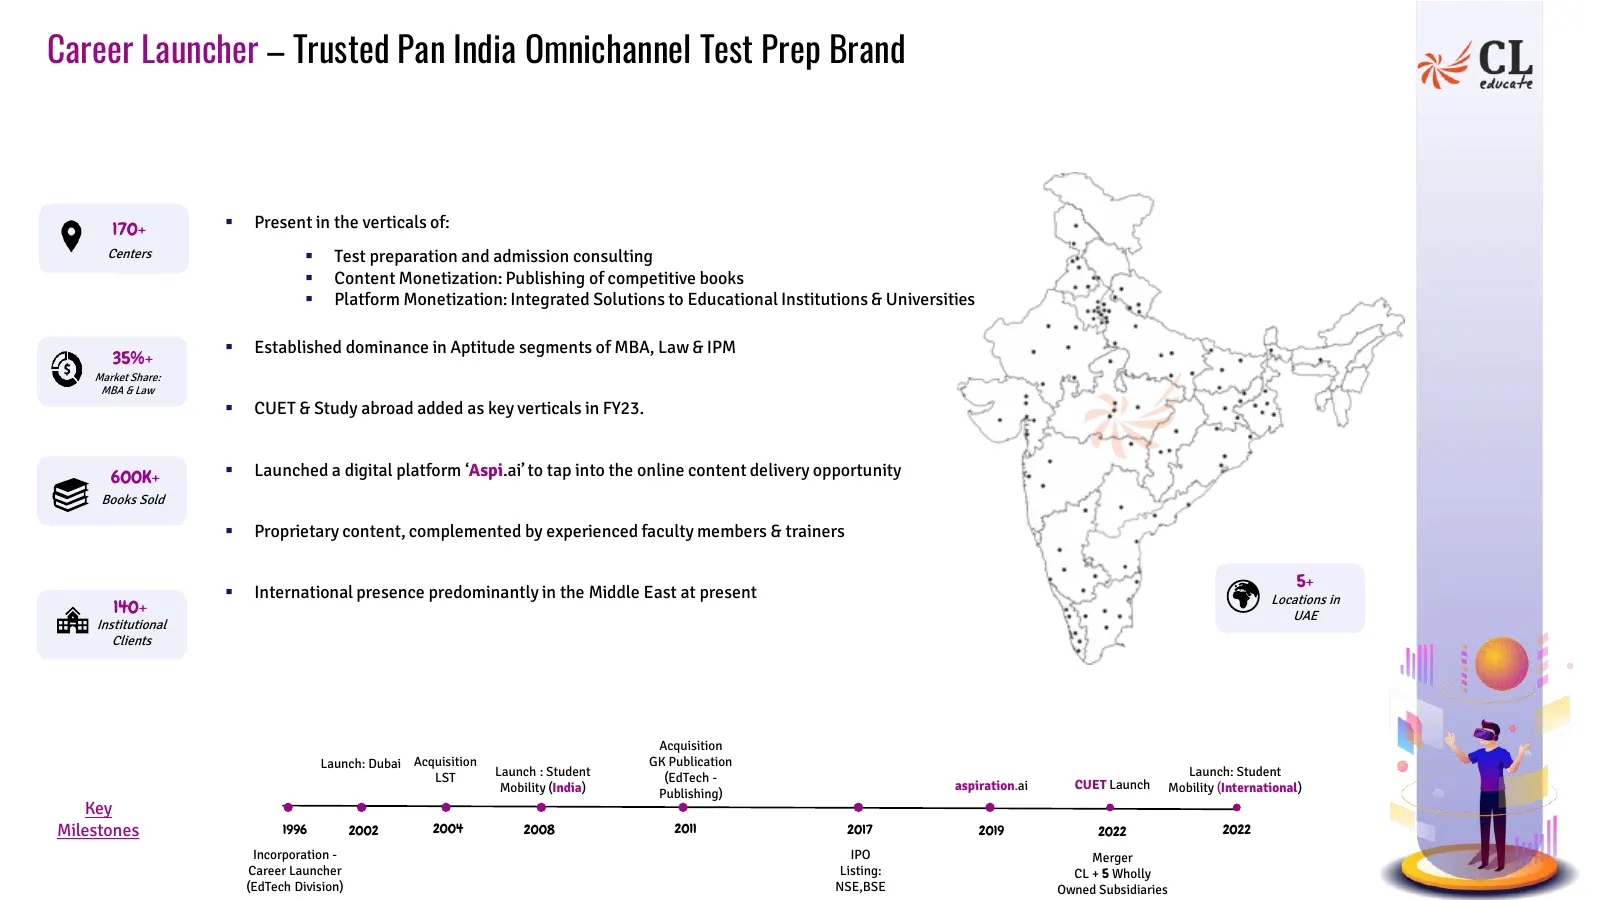
Slide 5: Career Launcher – Trusted Pan India Omnichannel Test Prep Brand
Career Launcher – Trusted Pan India Omnichannel Test Prep Brand 170+ ▪ Present in the verticals of: Centers ▪ Test preparation and admission consulting ▪ Content Monetization: Publishing of competitive books ▪ Platform Monetization: Integrated Solutions to Educational Institutions & Universities ▪ E
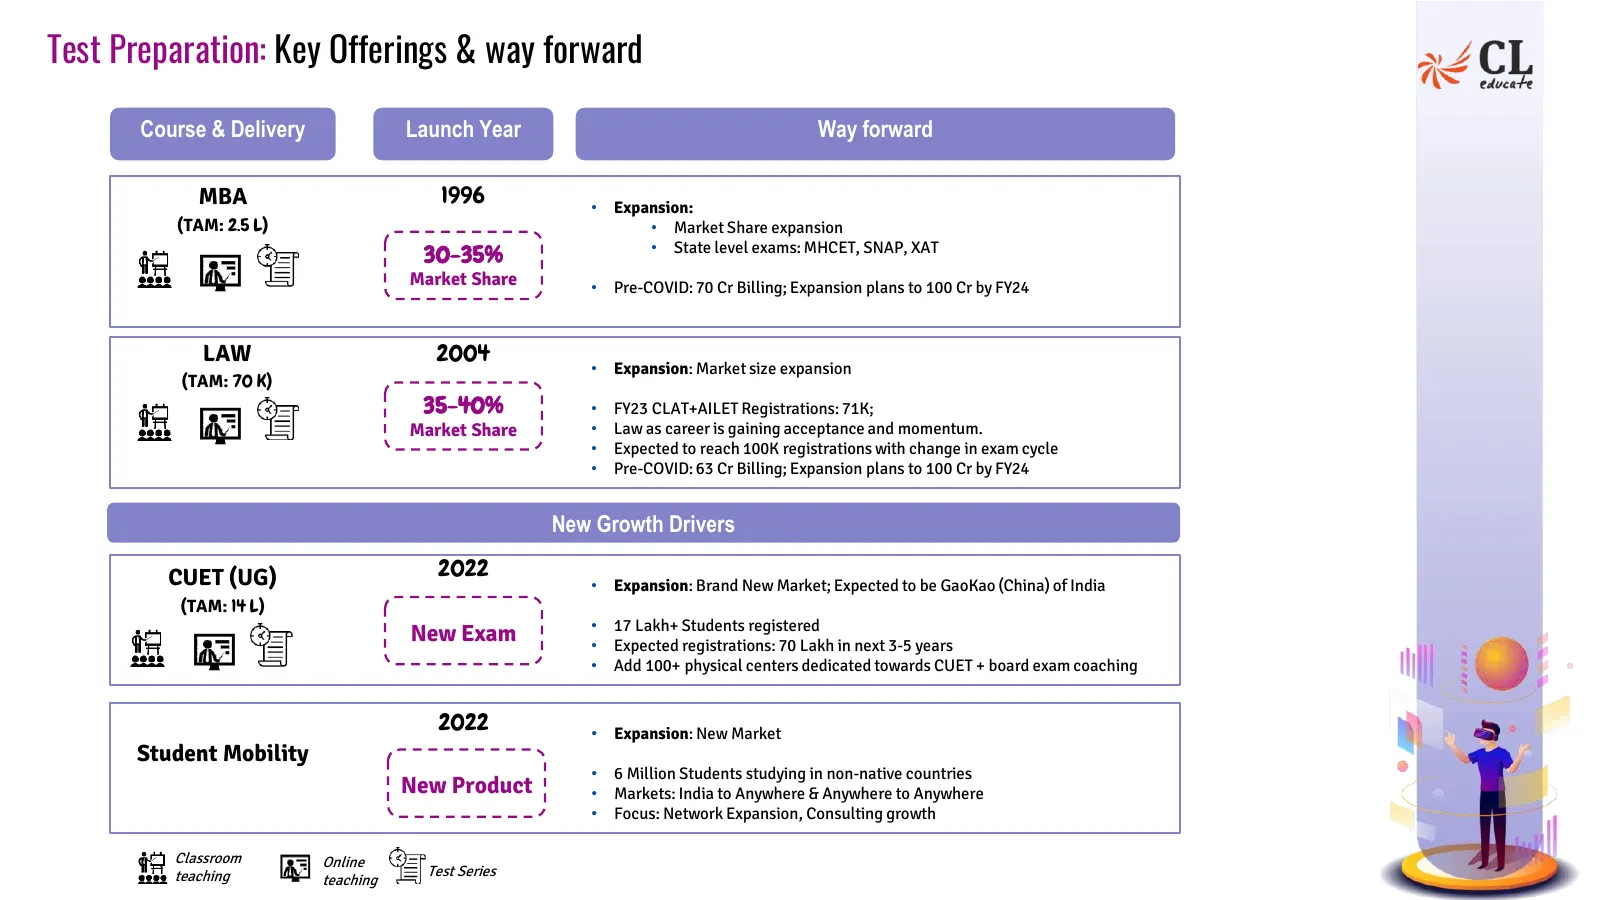
Slide 6: Test Preparation: Key Offerings & way forward
Test Preparation: Key Offerings & way forward Course & Delivery Launch Year Way forward MBA 1996 • Expansion: (TAM: 2.5 L) • Market Share expansion • State level exams: MHCET, SNAP, XAT 30-35% Market Share • Pre-COVID: 70 Cr Billing; Expansion plans to 100 Cr by FY24 LAW 2004 • Expansion: Market siz
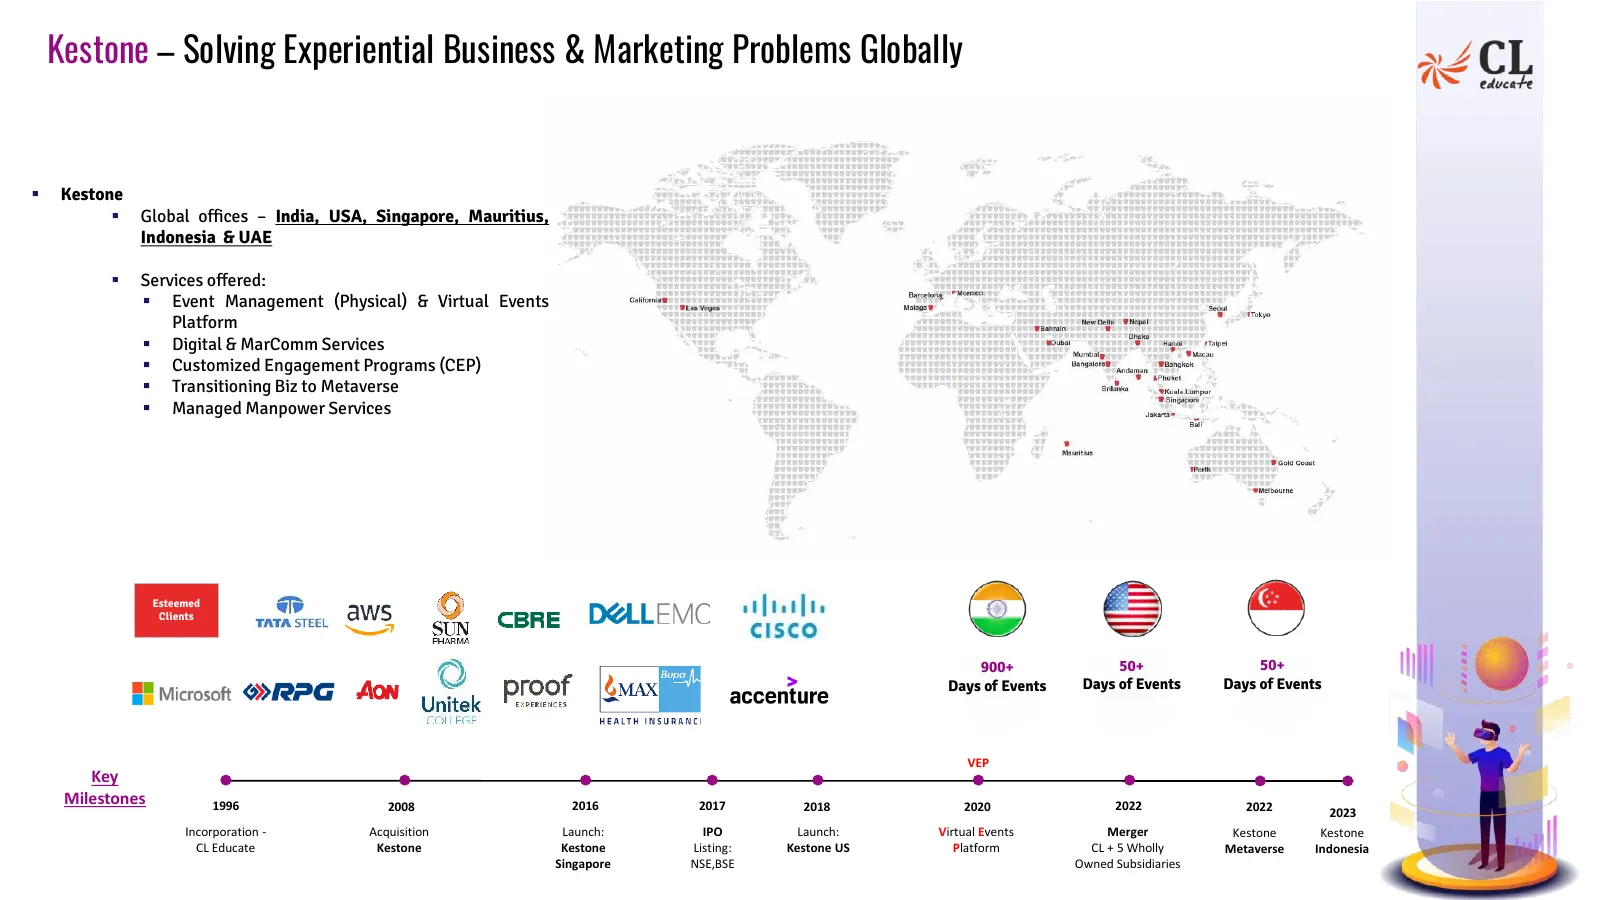
Slide 7: Kestone – Solving Experiential Business & Marketing Problems Globally
Kestone – Solving Experiential Business & Marketing Problems Globally ▪ Kestone ▪ Global offices – India, USA, Singapore, Mauritius, Indonesia & UAE ▪ Services offered: ▪ Event Management (Physical) & Virtual Events Platform ▪ Digital & MarComm Services ▪ Customized Engagement Programs (CEP) ▪ Trans
Slide 8: Content
Content Financial Updates Business Updates Corporate Roundup
Slide 9: Financial Updates
9 Financial Updates
Slide 10: Financial Update
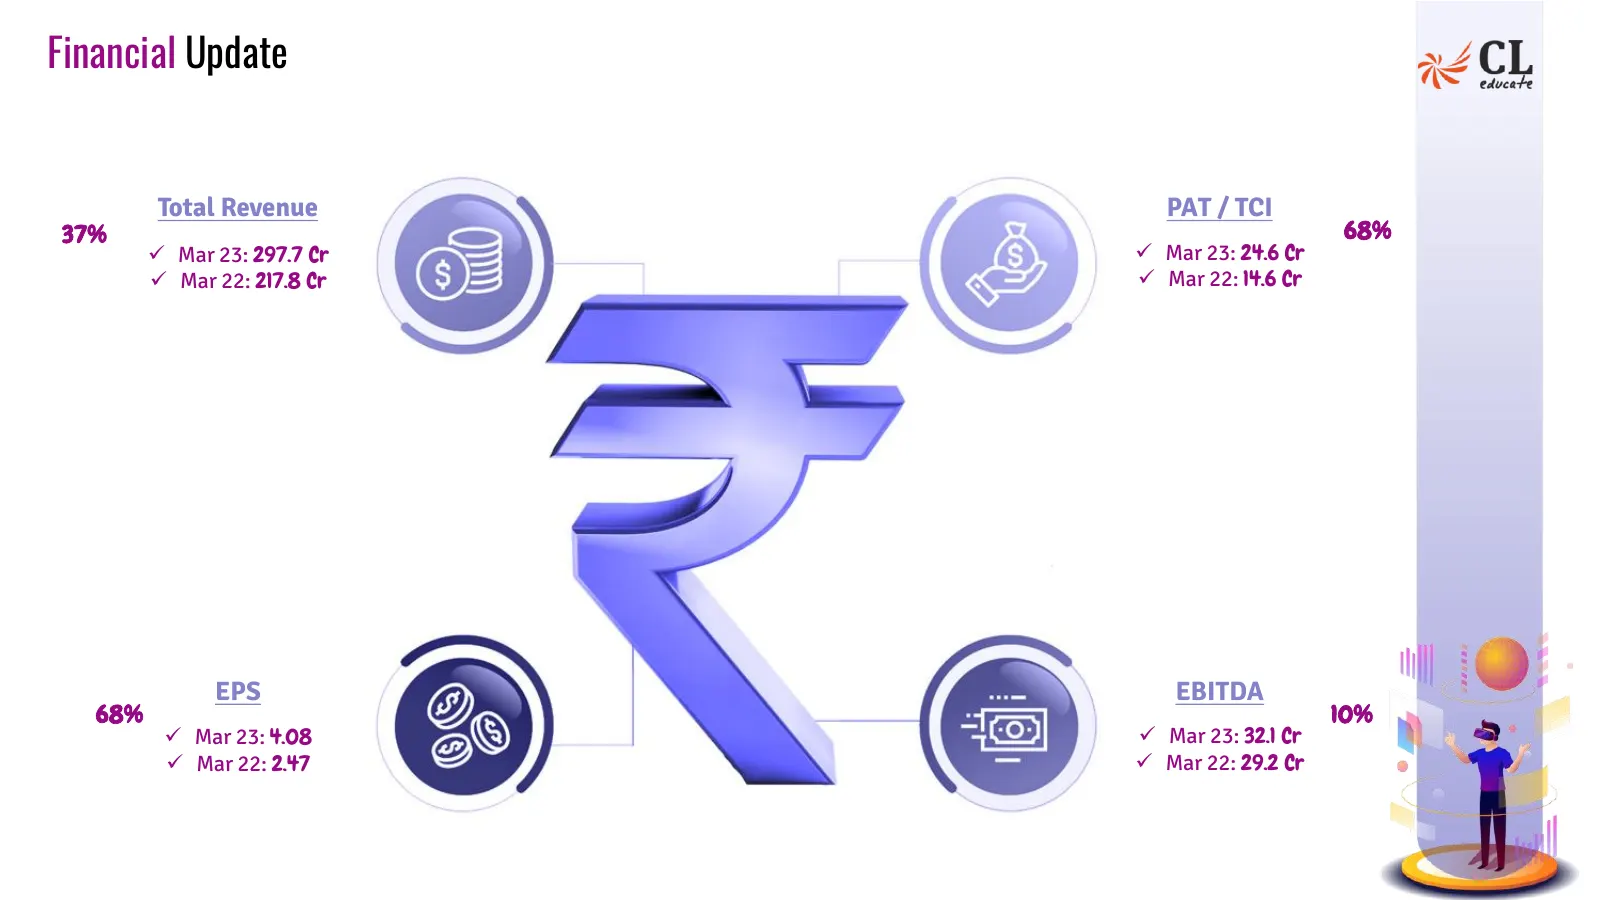
Financial Update Total Revenue PAT / TCI 37% 68% ✓ Mar 23: 297.7 Cr ✓ Mar 23: 24.6 Cr ✓ Mar 22: 217.8 Cr ✓ Mar 22: 14.6 Cr EPS EBITDA 68% 10% ✓ Mar 23: 4.08 ✓ Mar 23: 32.1 Cr ✓ Mar 22: 2.47 ✓ Mar 22: 29.2 Cr
Slide 11: Financial Summary
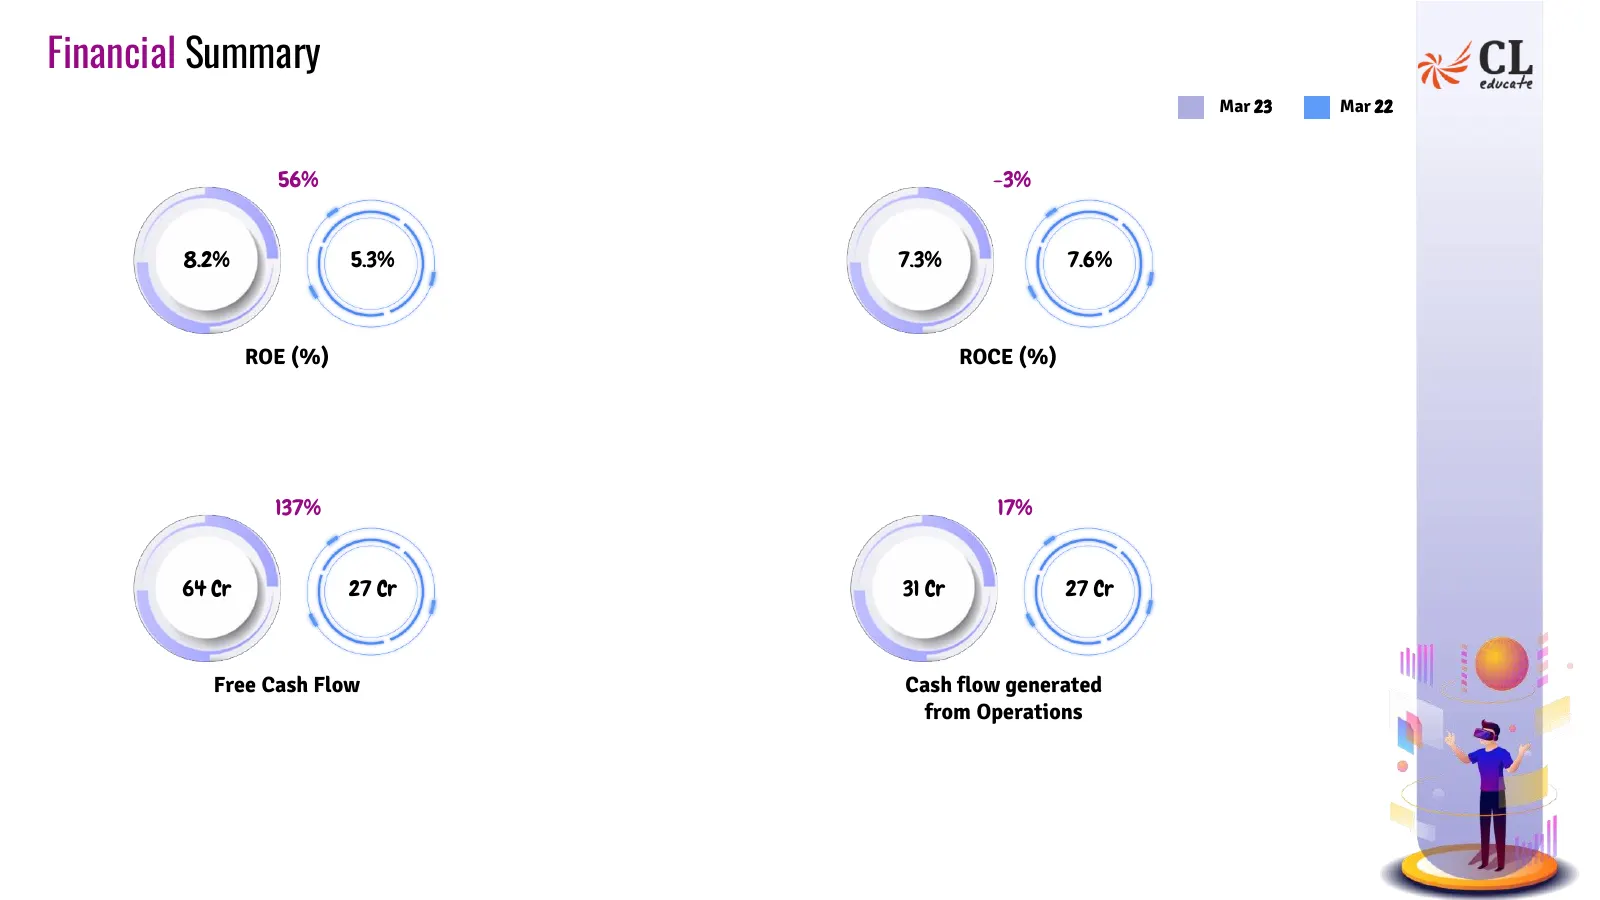
Financial Summary Mar 23 Mar 22 56% -3% 8.2% 5.3% 7.3% 7.6% ROE (%) ROCE (%) 137% 17% 64 Cr 27 Cr 31 Cr 27 Cr Free Cash Flow Cash flow generated from Operations
Slide 12: Financial Summary – 3 Year Story
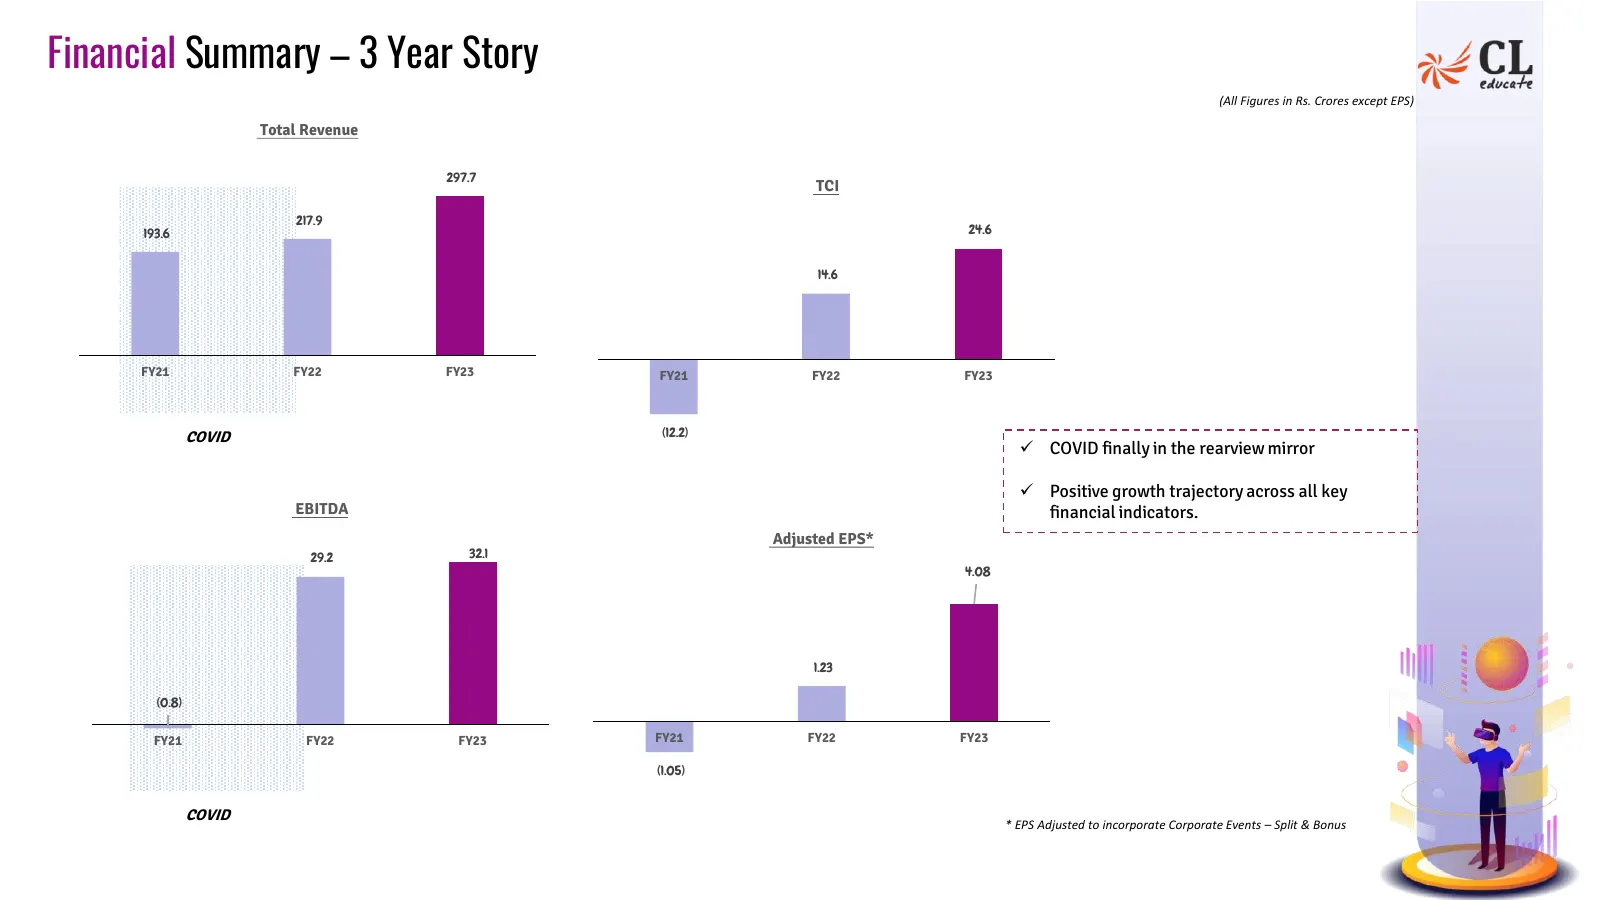
Financial Summary – 3 Year Story (All Figures in Rs. Crores except EPS) Total Revenue 297.7 TCI 217.9 193.6 24.6 14.6 FY21 FY22 FY23 FY21 FY22 FY23 COVID (12.2) ✓ COVID finally in the rearview mirror ✓ Positive growth trajectory across all key EBITDA financial indicators. Adjusted EPS* 29.2 32.1 4.0
Slide 13: Cash Position
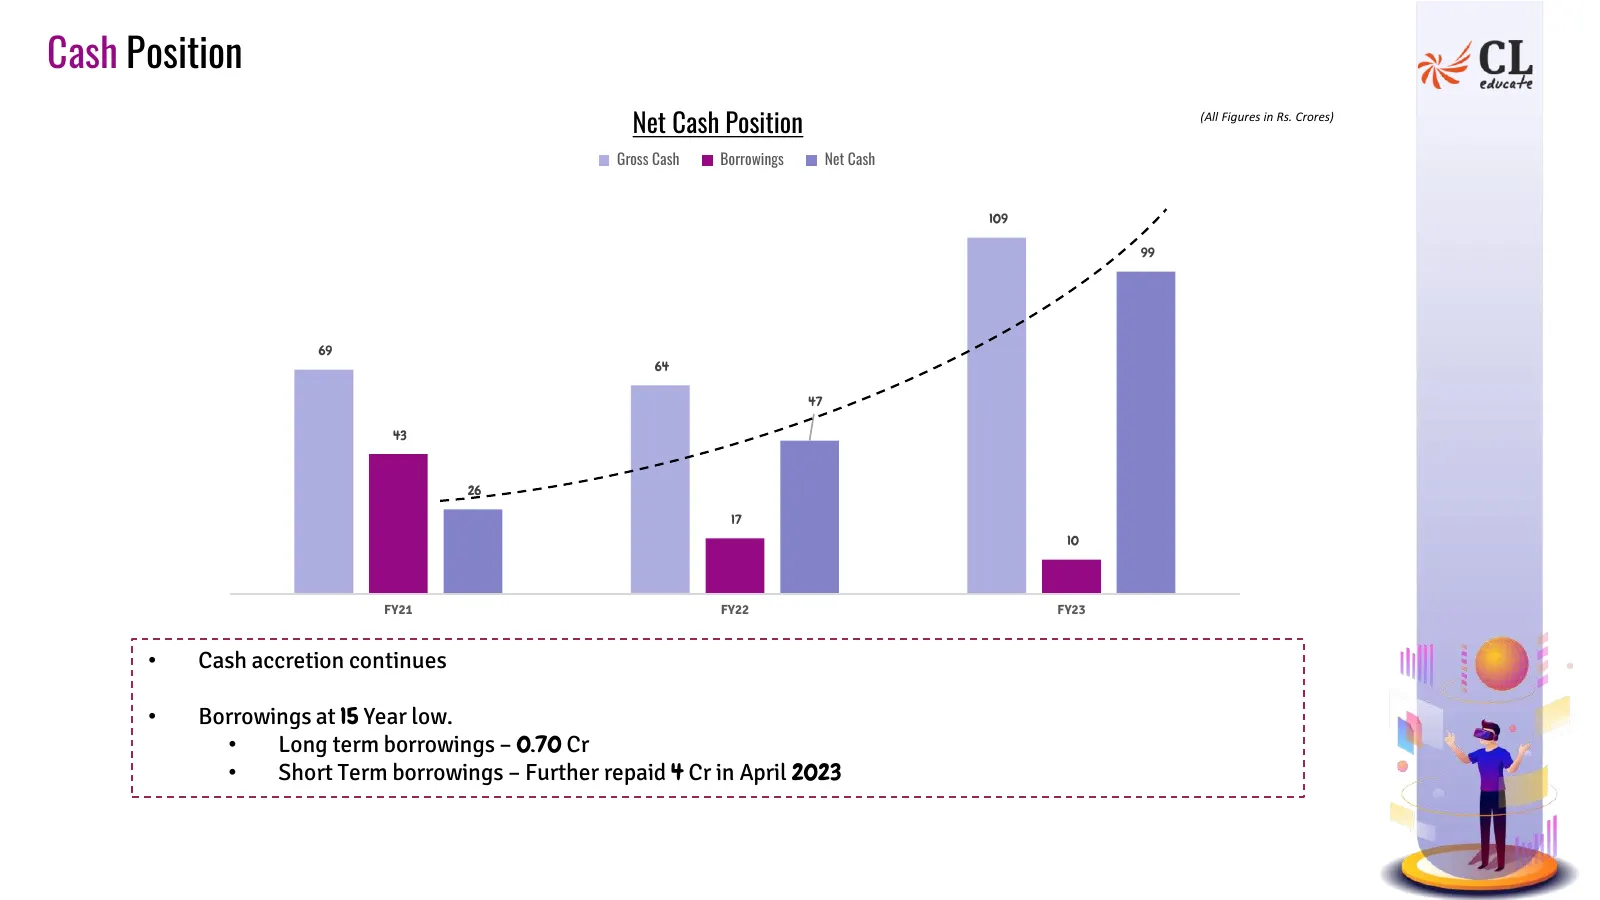
Cash Position Net Cash Position (All Figures in Rs. Crores) Gross Cash Borrowings Net Cash 109 99 69 64 47 43 26 17 10 FY21 FY22 FY23 • Cash accretion continues • Borrowings at 15 Year low. • Long term borrowings – 0.70 Cr • Short Term borrowings – Further repaid 4 Cr in April 2023
Slide 14: Segment Update
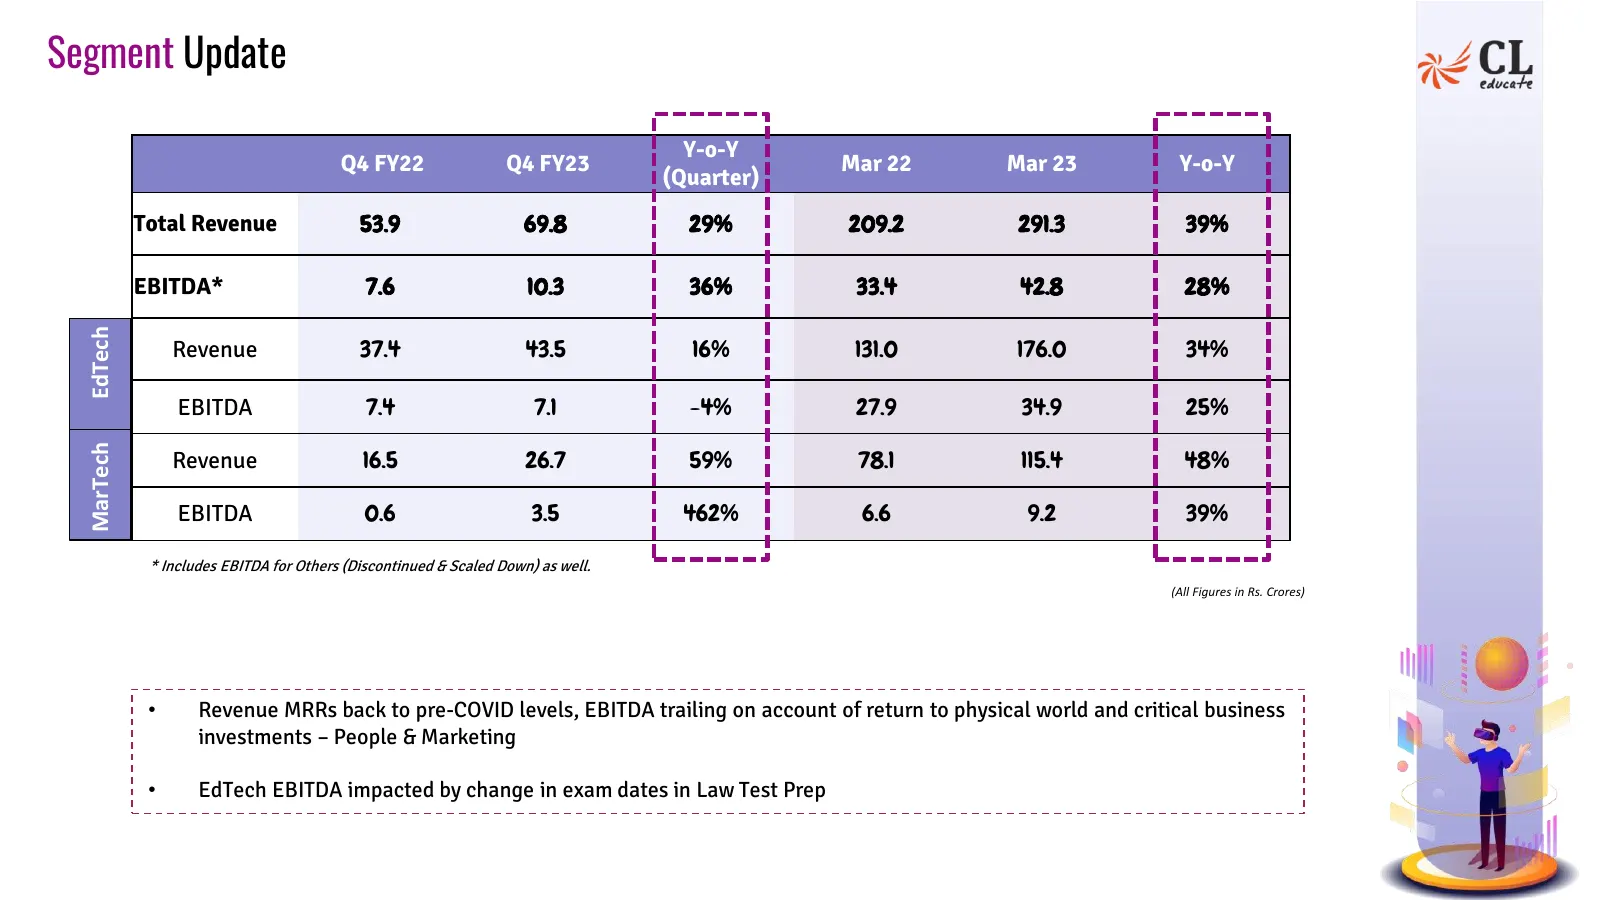
Segment Update Y-o-Y Q4 FY22 Q4 FY23 Mar 22 Mar 23 Y-o-Y (Quarter) Total Revenue 53.9 69.8 29% 209.2 291.3 39% EBITDA* 7.6 10.3 36% 33.4 42.8 28% EdTech Revenue 37.4 43.5 16% 131.0 176.0 34% EBITDA 7.4 7.1 -4% 27.9 34.9 25% MarTech Revenue 16.5 26.7 59% 78.1 115.4 48% EBITDA 0.6 3.5 462% 6.6 9.2 39%

Slide 15: Business Updates
wz Business Updates
Slide 16: EdTech: Test Prep
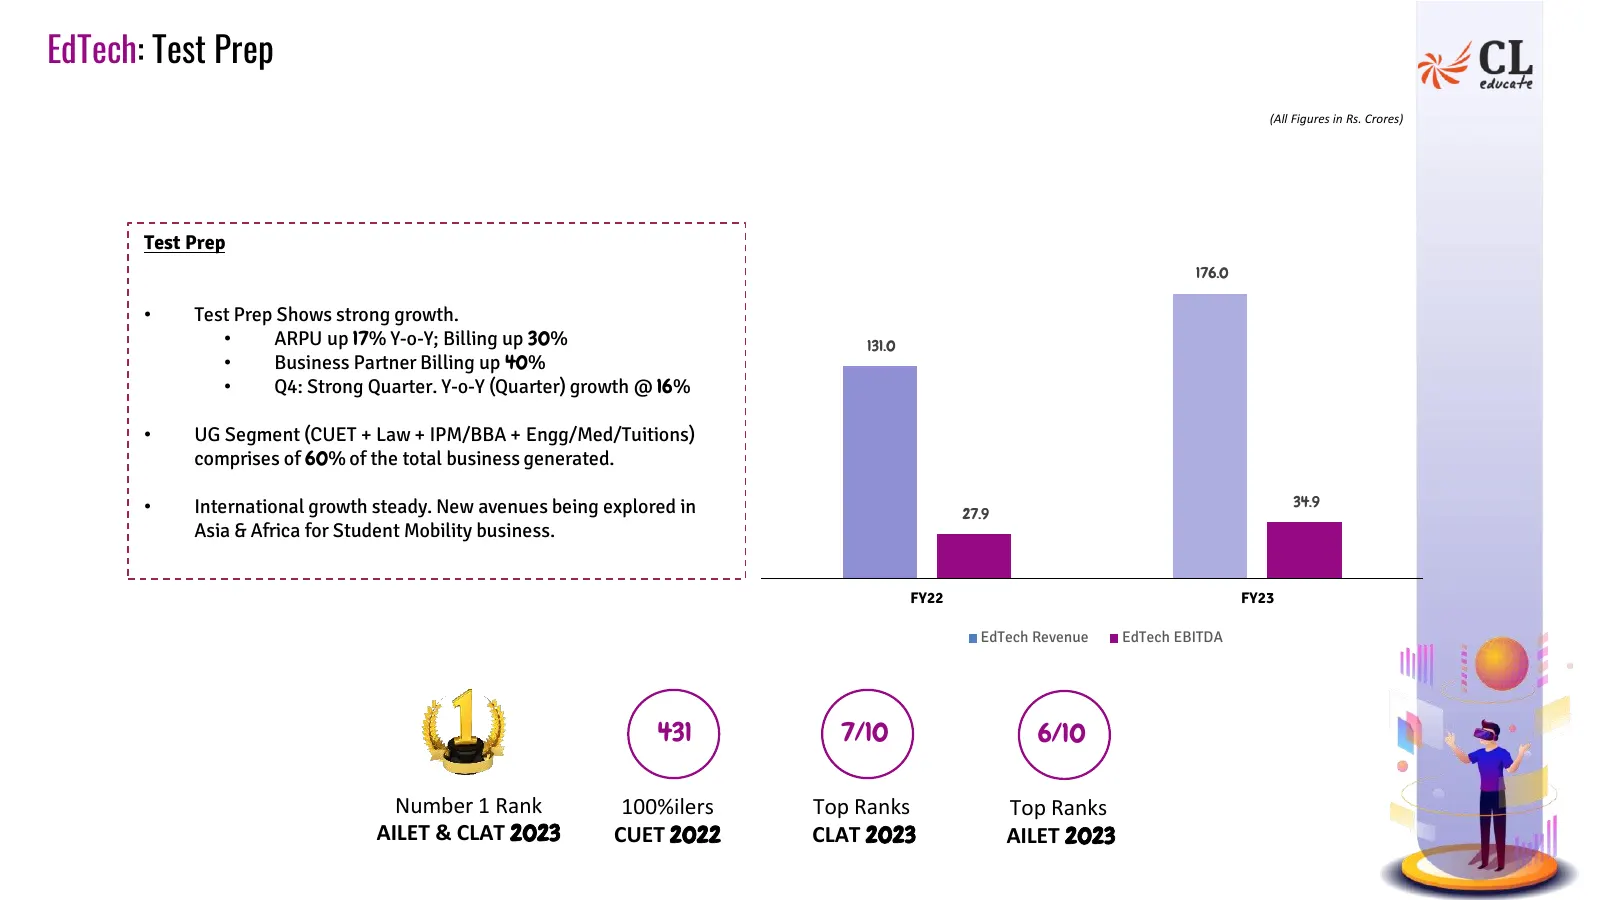
EdTech: Test Prep (All Figures in Rs. Crores) Test Prep 176.0 • Test Prep Shows strong growth. • ARPU up 17% Y-o-Y; Billing up 30% 131.0 • Business Partner Billing up 40% • Q4: Strong Quarter. Y-o-Y (Quarter) growth @ 16% • UG Segment (CUET + Law + IPM/BBA + Engg/Med/Tuitions) comprises of 60% of th
Slide 17: EdTech: Content & Platform
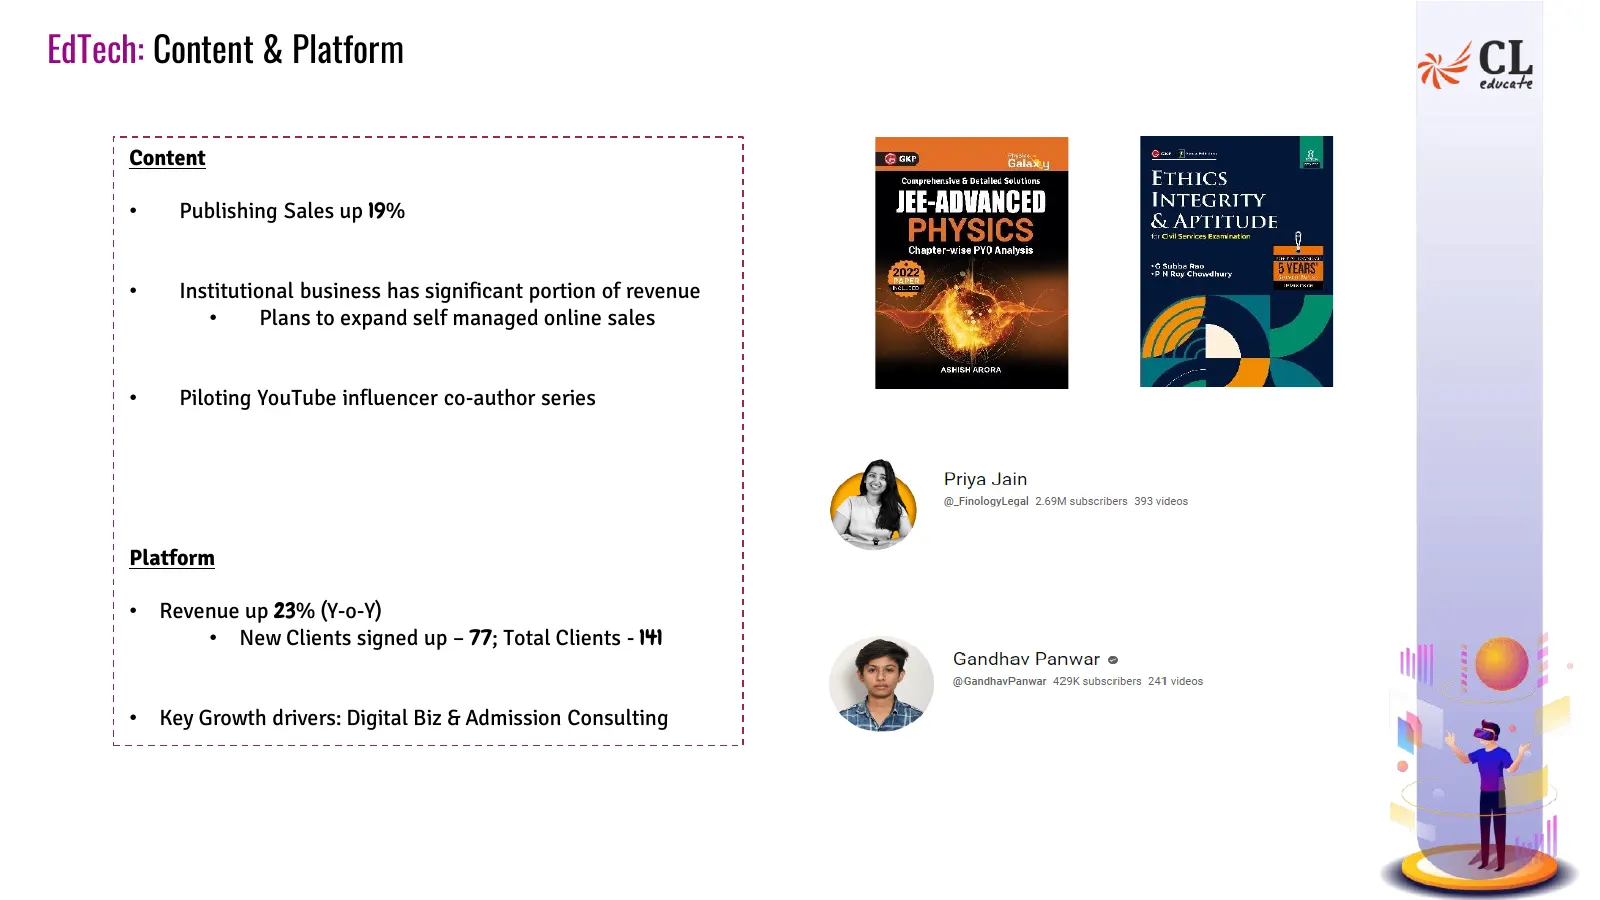
EdTech: Content & Platform Content • Publishing Sales up 19% • Institutional business has significant portion of revenue • Plans to expand self managed online sales • Piloting YouTube influencer co-author series Platform • Revenue up 23% (Y-o-Y) • New Clients signed up – 77; Total Clients - 141 • Ke
Slide 18: MarTech
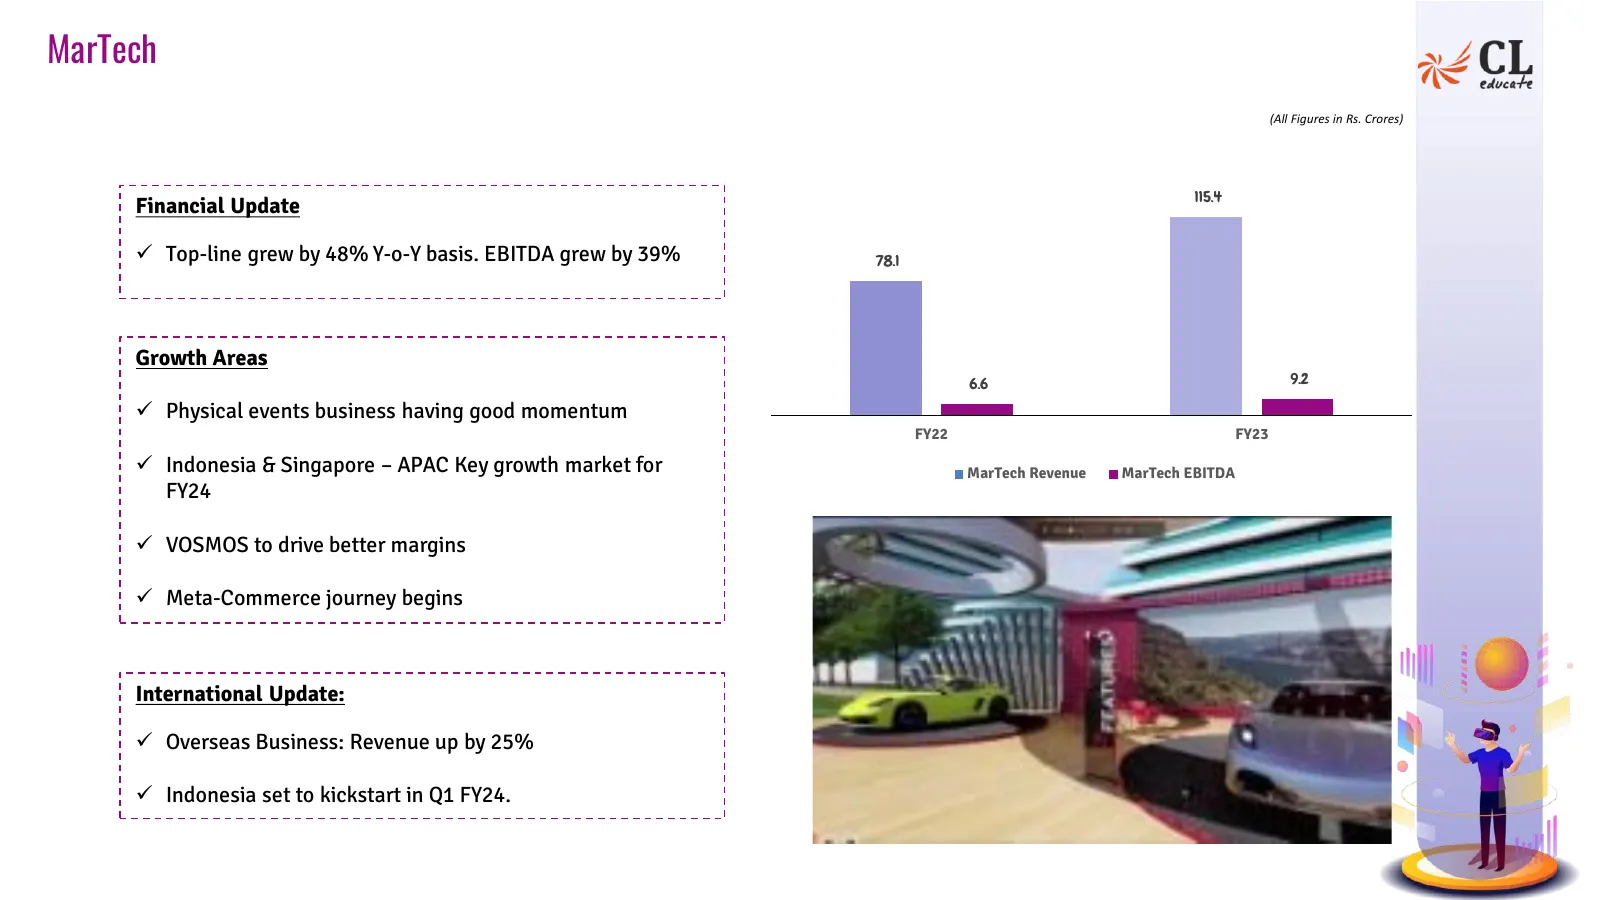
MarTech (All Figures in Rs. Crores) 115.4 Financial Update ✓ Top-line grew by 48% Y-o-Y basis. EBITDA grew by 39% 78.1 Growth Areas 6.6 9.2 ✓ Physical events business having good momentum FY22 FY23 ✓ Indonesia & Singapore – APAC Key growth market for MarTech Revenue MarTech EBITDA FY24 ✓ VOSMOS to d
Slide 19: Corporate Roundup
y Corporate Roundup
Slide 20: Corporate Roundup: Steps taken to Maximize Shareholder Wealth – Last 18 Months
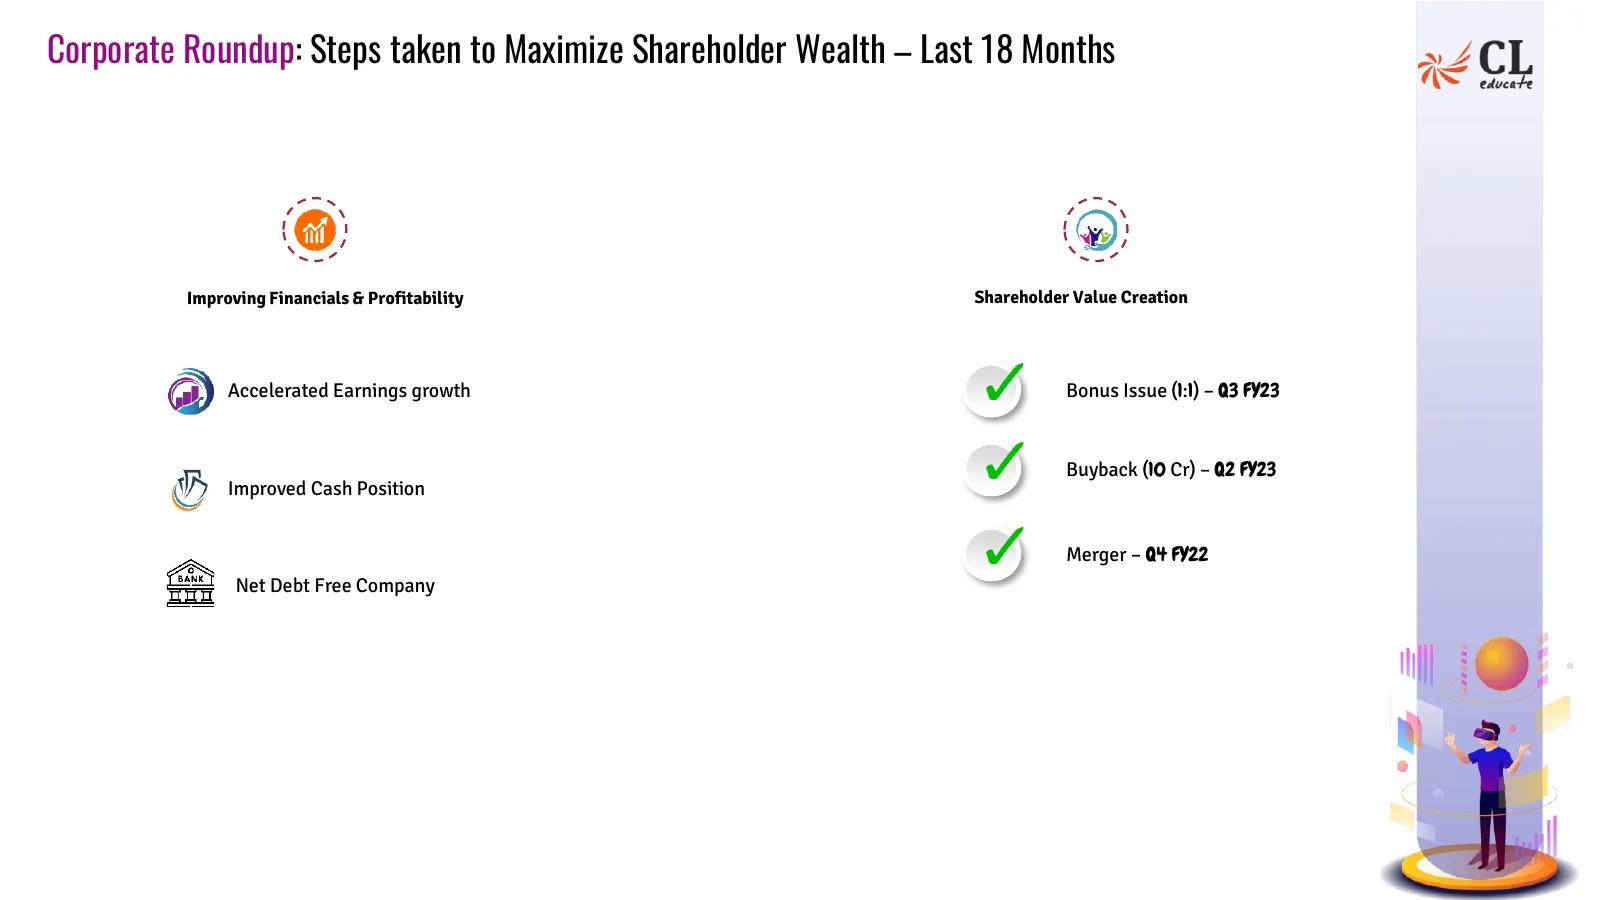
Corporate Roundup: Steps taken to Maximize Shareholder Wealth – Last 18 Months Improving Financials & Profitability Shareholder Value Creation Accelerated Earnings growth Bonus Issue (1:1) – Q3 FY23 Buyback (10 Cr) – Q2 FY23 Improved Cash Position Merger – Q4 FY22 Net Debt Free Company
Slide 21: Financial Annexures
o Financial Annexures
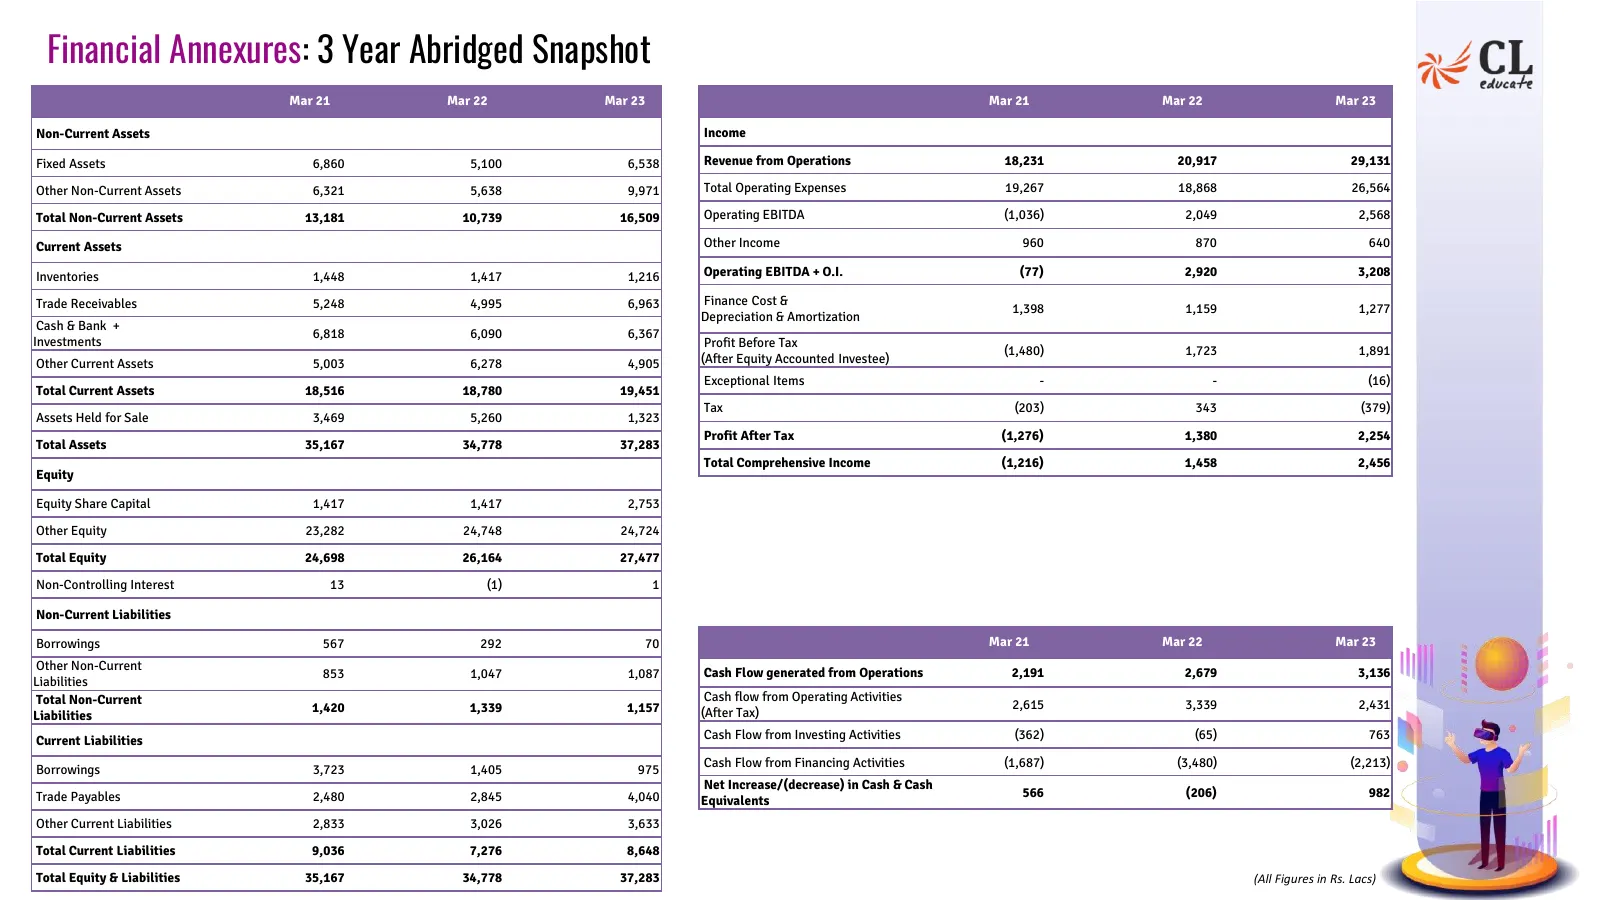
Slide 22: Financial Annexures: 3 Year Abridged Snapshot
Financial Annexures: 3 Year Abridged Snapshot Mar 21 Mar 22 Mar 23 Mar 21 Mar 22 Mar 23 Non-Current Assets Income Fixed Assets 6,860 5,100 6,538 Revenue from Operations 18,231 20,917 29,131 Other Non-Current Assets 6,321 5,638 9,971 Total Operating Expenses 19,267 18,868 26,564 Total Non-Current Ass
Slide 23: Get in Touch !
Get in Touch ! Arjun Wadhwa Chief Financial Officer CL Educate Ltd. Call: +91-98116 17289 E-mail: investors@careerlauncher.com arjun.wadhwa@careerlauncher.com Amit Kanabar Sr Manager – Finance & Strategy CL Educate Ltd. Call: +91-88009 76683 E-mail: investors@careerlauncher.com amit.kanabar@careerla
Source: Internet Archive copy of cleducate.com
More decks from CL Educate Ltd.
 H1 FY2027 Earnings Presentation15 slides · Nov 4, 2026
 Q1 FY2027 Earnings Presentation13 slides · Aug 5, 2026
 Q4 FY2026 Earnings Presentation10 slides · May 14, 2026
 FY2026 Earnings Presentation9 slides · May 14, 2026
 Q3 FY2026 Earnings Presentation22 slides · Feb 6, 2026
 H1 FY2026 Earnings Presentation26 slides · Nov 10, 2025