Teppco Partners LP — Investor Day (March 2007)
75 slides from Teppco Partners LP's investor day presentation, Mar 29, 2007
Slide 1: TEPPCO Partners, L.P. Analyst Meeting March 29, 2007
TEPPCO Partners, L.P. Analyst Meeting March 29, 2007
Slide 2: Forward-looking Statements
Forward-looking Statements The material and information furnished in this presentation includes "forward-looking statements." All statements that express belief, expectation, estimates or intentions, as well as those that are not statements of historical facts are forward-looking statements. Without
Slide 3: Forward-looking Statements (continued)
Forward-looking Statements ....trucking and railroad freight, agricultural usage and military usage; the demand for propane is sensitive to the weather and prevailing economic conditions; the demand for petrochemicals is dependent upon prices for products produced from petrochemicals; the demand for
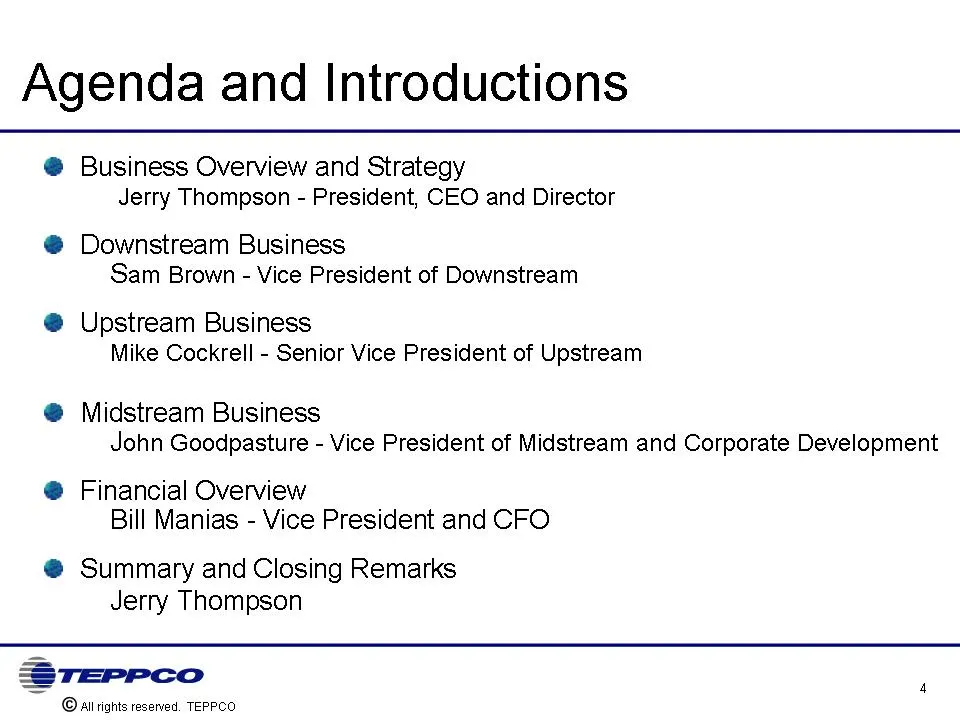
Slide 4: Agenda and Introductions
Agenda and Introductions Business Overview and Strategy Jerry Thompson - President, CEO and Director Downstream Business Sam Brown - Vice President of Downstream Upstream Business Mike Cockrell - Senior Vice President of Upstream Midstream Business John Goodpasture - Vice President of Midstream and
Slide 5: TEPPCO System Map
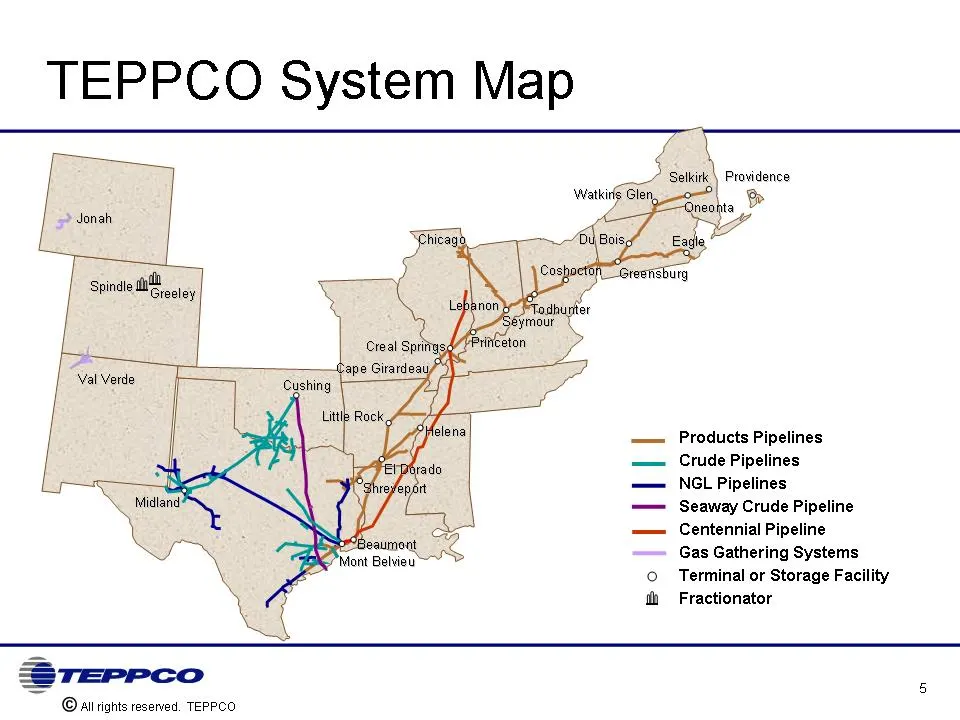
TEPPCO System Map do Greeley Val Verde Ll “io its Spindle ii Products Pipelines Crude Pipelines NGL Pipelines Seaway Crude Pipeline Centennial Pipeline Gas Gathering Systems © Terminal or Storage Facility ii Fractionator AW "a ¢ Mont Belview ©alirights reserved. TEPPCO
Slide 6: Partnership Overview
Partnership Overview One of the oldest publicly traded partnerships with an enterprise value of $5.3 billion Ranks 267 on the Fortune 500 list 17% compound annual investment return over a 17-year period since IPO (1) Greater than 90% fee-based business from diversified asset base Transportation, sto
Slide 7: Strong Long-Term Track Record
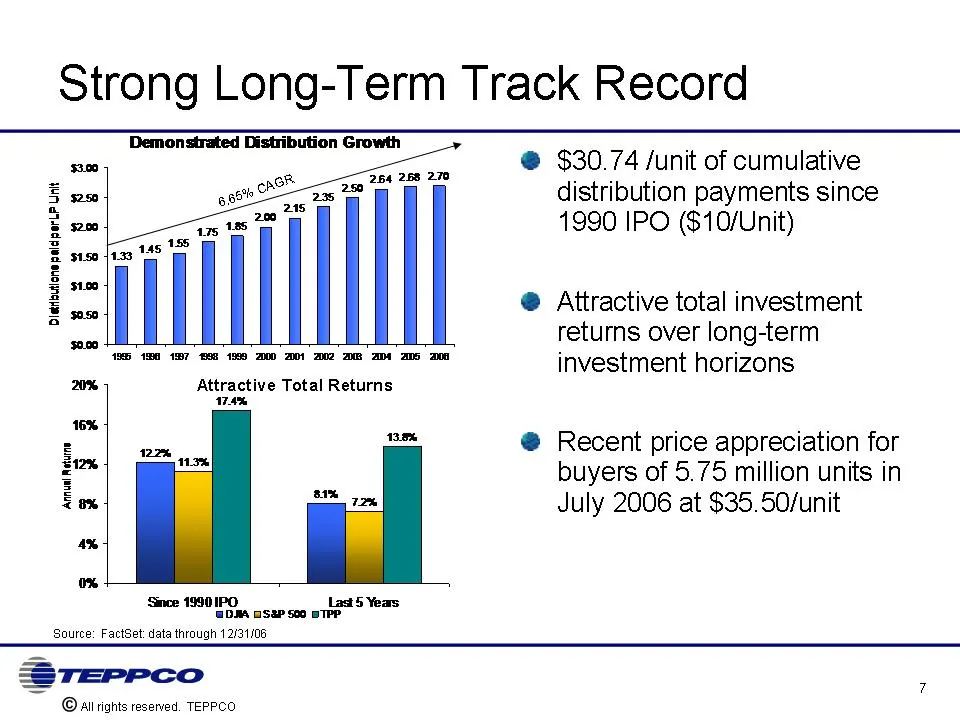
Strong Long-Term Track Record $30.74 /unit of cumulative distribution payments since 1990 IPO ($10/Unit) Attractive total investment returns over long-term investment horizons Recent price appreciation for buyers of 5.75 million units in July 2006 at $35.50/unit
Slide 8: Record EBITDA from Diversified Base of Assets
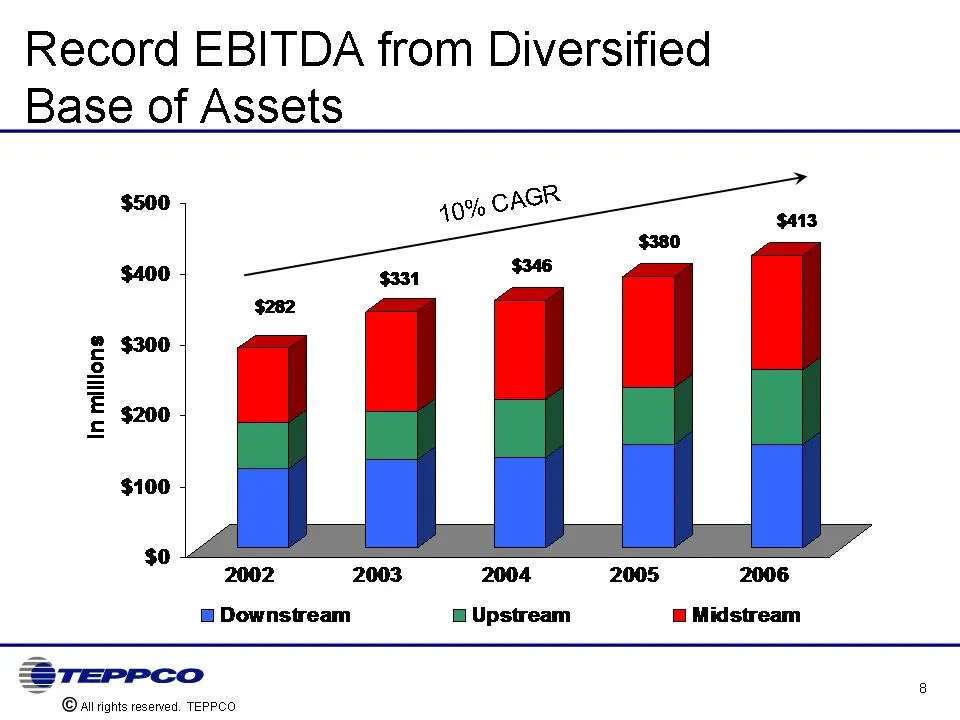
Record EBITDA from Diversified Base of Assets
Slide 9: Accomplishments Since August 2006 Analyst Meeting
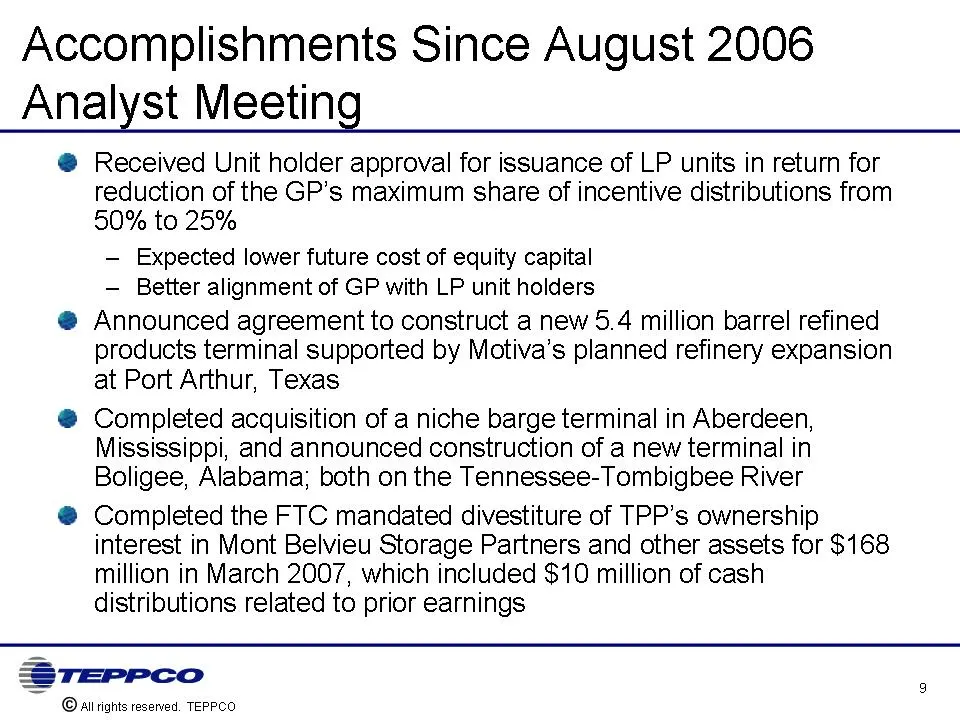
Accomplishments Since August 2006 Analyst Meeting Received Unit holder approval for issuance of LP units in return for reduction of the GP's maximum share of incentive distributions from 50% to 25% Expected lower future cost of equity capital Better alignment of GP with LP unit holders Announced agr
Slide 10: Supportive General Partner Sponsor
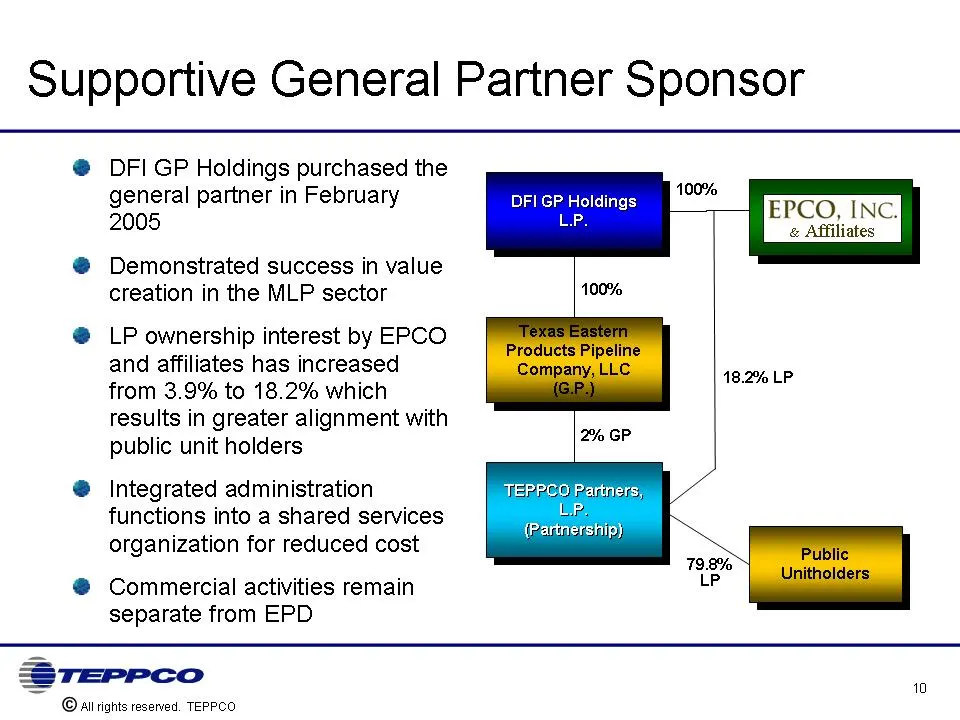
Supportive General Partner Sponsor DFI GP Holdings purchased the general partner in February 2005 Demonstrated success in value creation in the MLP sector LP ownership interest by EPCO and affiliates has increased from 3.9% to 18.2% which results in greater alignment with public unit holders Integra
Slide 11: Trends Expected to Drive TEPPCO's Long-Term Growth Opportunities
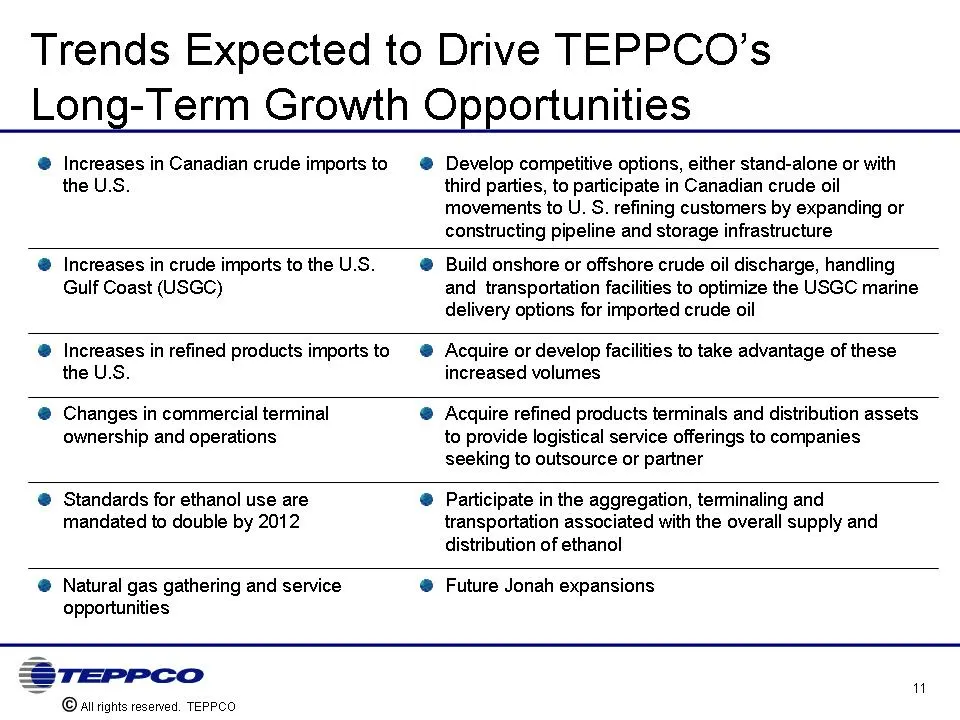
Trends Expected to Drive TEPPCO's Long-Term Growth Opportunities Increases in Canadian crude imports to the U.S. Develop competitive options, either stand-alone or with third parties, to participate in Canadian crude oil movements to U. S. refining customers by expanding or constructing pipeline and
Slide 12: Key Investment Highlights
Key Investment Highlights Diversified businesses and strategic asset investments provide earnings stability > 90% of business is structured as fee-based activity, with limited commodity exposure Visibility of growth prospects Financial strength to fund growth initiatives General partner with greater
Slide 13: Downstream Business
Downstream Business Sam Brown
Slide 14: TEPPCO's Downstream Business
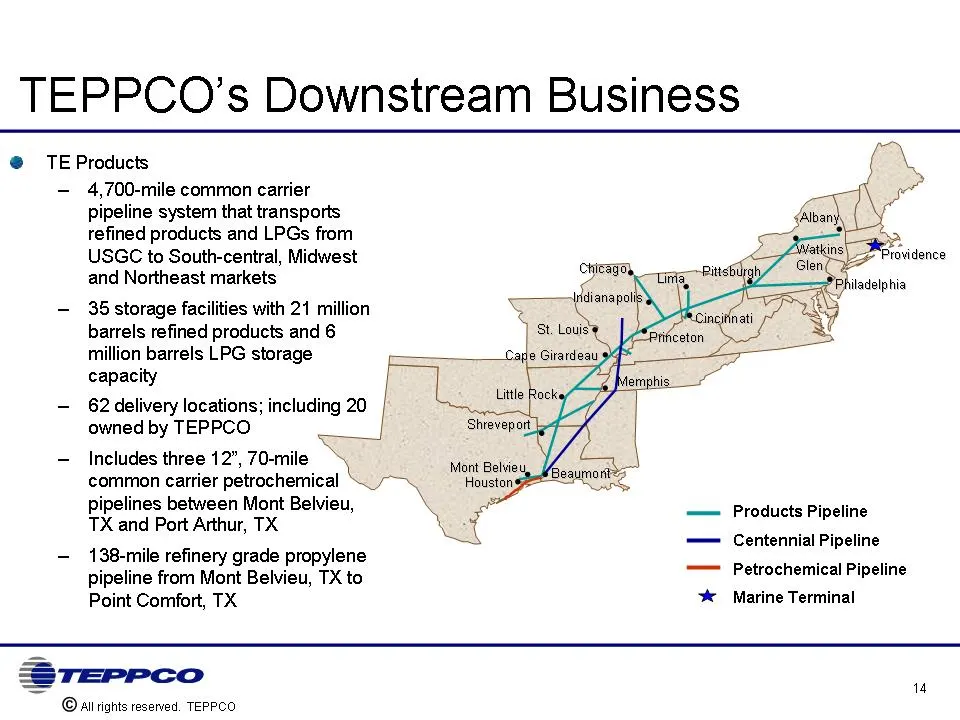
TEPPCO's Downstream Business TE Products 4,700-mile common carrier pipeline system that transports refined products and LPGs from USGC to South-central, Midwest and Northeast markets 35 storage facilities with 21 million barrels refined products and 6 million barrels LPG storage capacity 62 delivery
Slide 15: Refined Products Overview
Refined Products Overview Transporter of gasoline, diesel, jet fuel and various feedstocks that originate from refinery and third party terminal connections in the Houston and Beaumont area Revenues are generated through a combination of market- based and indexed-based tariffs that cover mainline tr
Slide 16: Centennial has Enabled Volume Growth
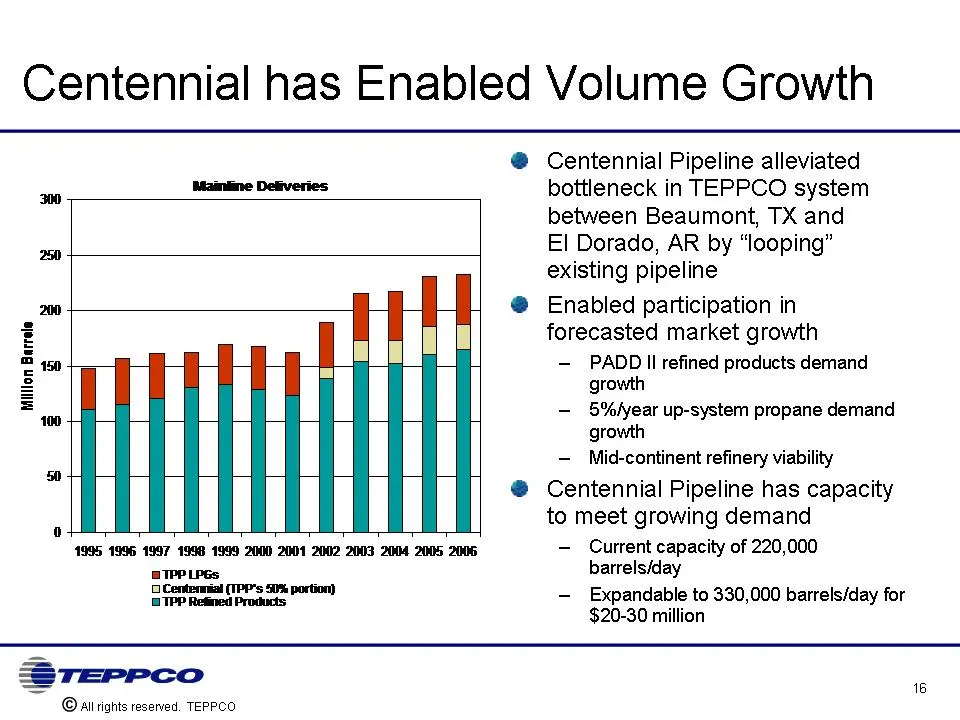
Centennial has Enabled Volume Growth Centennial Pipeline alleviated bottleneck in TEPPCO system between Beaumont, TX and El Dorado, AR by "looping" existing pipeline Enabled participation in forecasted market growth PADD II refined products demand growth 5%/year up-system propane demand growth Mid-c
Slide 17: Centennial has Facilitated TEPPCO System Growth Projects
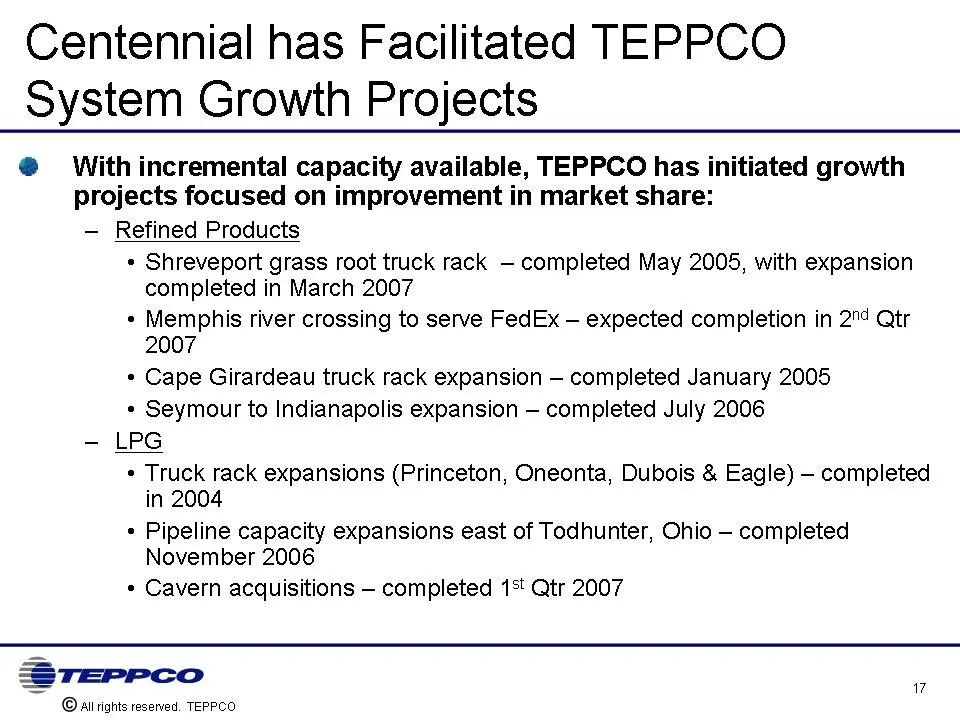
Centennial has Facilitated TEPPCO System Growth Projects With incremental capacity available, TEPPCO has initiated growth projects focused on improvement in market share Refined Products Shreveport grass root truck rack completed May 2005, with expansion completed in March 2007 Memphis river crossin
Slide 18: TEPPCO LPG System
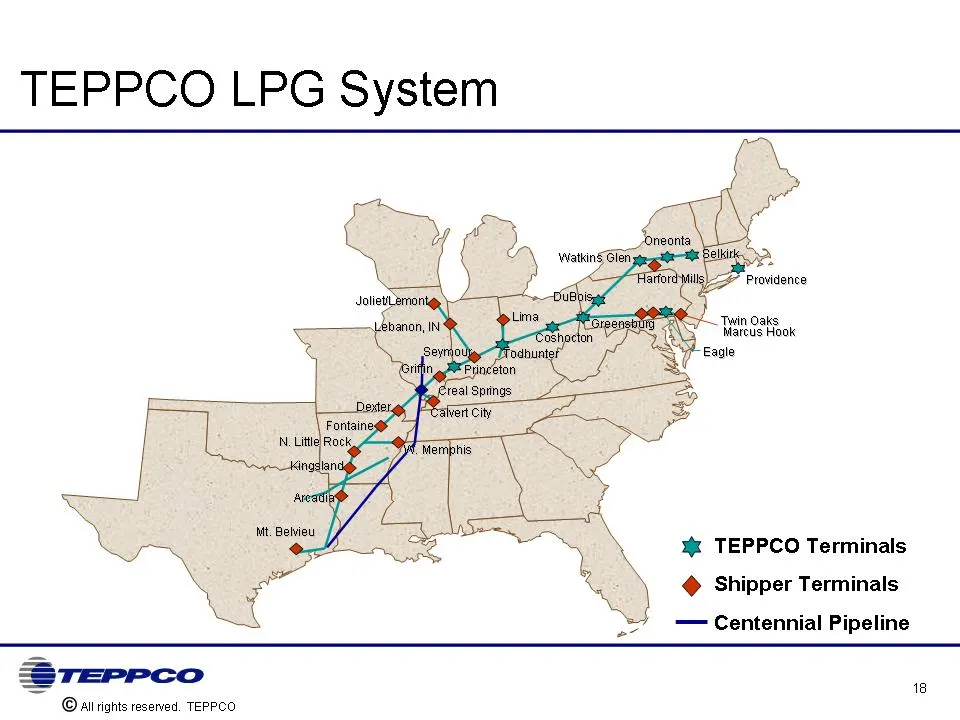
TEPPCO LPG System igor ) FP? Prowcence Twin Oaks Marcus Hook & TEPPCO Terminals @ Shipper Terminals — Centennial Pipeline 18 TEPPCO ©alirights reserved. TEPPCO
Slide 19: LPG Overview
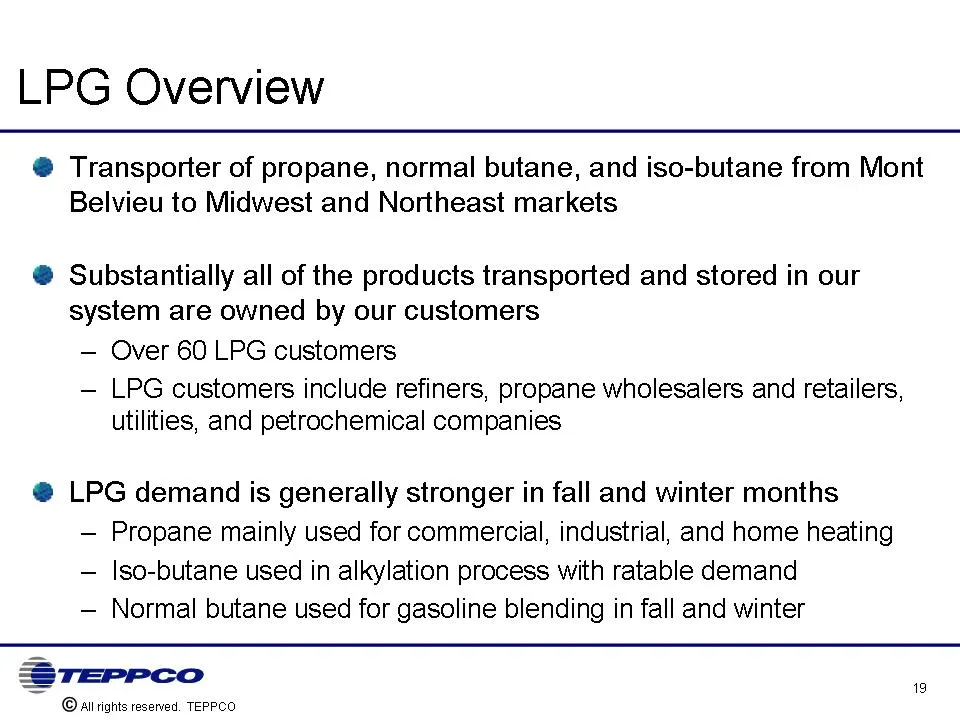
LPG Overview Transporter of propane, normal butane, and iso-butane from Mont Belvieu to Midwest and Northeast markets Substantially all of the products transported and stored in our system are owned by our customers Over 60 LPG customers LPG customers include refiners, propane wholesalers and retail
Slide 20: Business Drivers for Growth
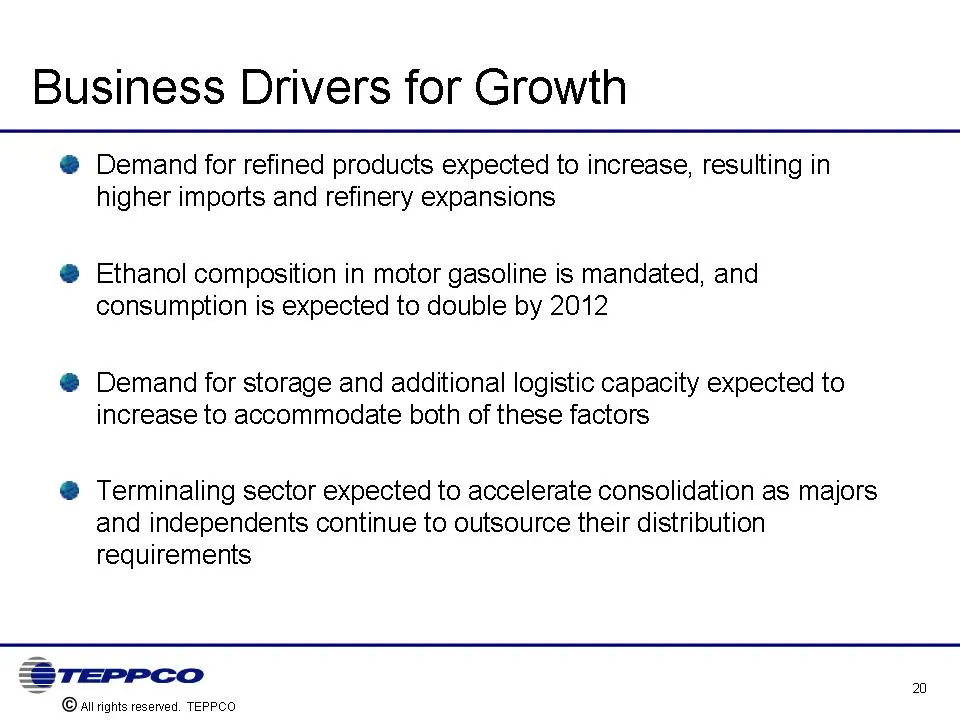
Business Drivers for Growth Demand for refined products expected to increase, resulting in higher imports and refinery expansions Ethanol composition in motor gasoline is mandated, and consumption is expected to double by 2012 Demand for storage and additional logistic capacity expected to increase
Slide 21: Growth Strategy
Growth Strategy Utilize TEPPCO and Centennial Pipeline systems to serve Midwest supply shortfall Pursue organic growth acquisitions adjacent to the TEPPCO system Position market share growth around increased refined products imports Pursue opportunities to provide logistical services for ethanol and
Slide 22: Downstream Strategy Execution
Downstream Strategy Execution
Slide 23: Port Arthur Refined Products Terminal
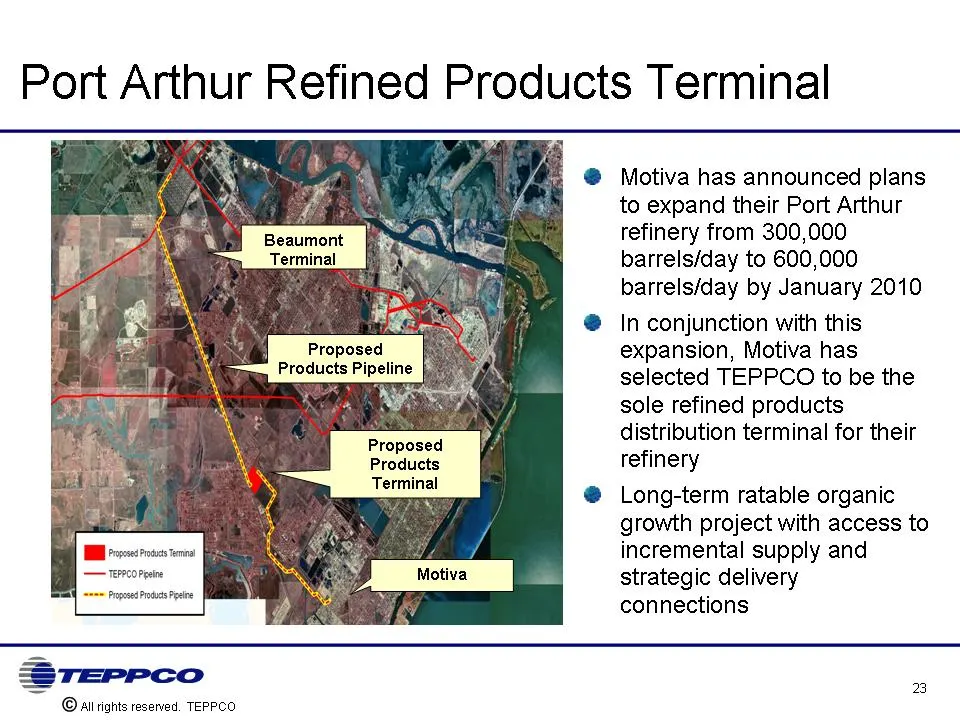
Port Arthur Refined Products Terminal Motiva has announced plans to expand their Port Arthur refinery from 300,000 barrels/day to 600,000 barrels/day by January 2010 In conjunction with this expansion, Motiva has selected TEPPCO to be the sole refined products distribution terminal for their refiner
Slide 24: Port Arthur Refined Products Terminal Capital Expenditures
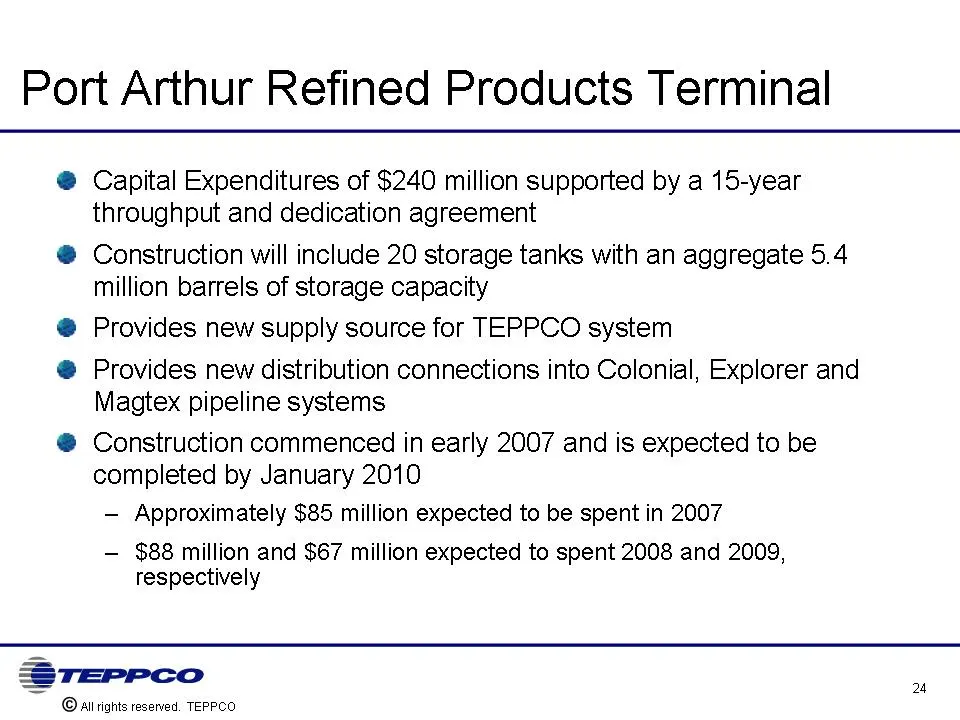
Port Arthur Refined Products Terminal Capital Expenditures of $240 million supported by a 15-year throughput and dedication agreement Construction will include 20 storage tanks with an aggregate 5.4 million barrels of storage capacity Provides new supply source for TEPPCO system Provides new distrib
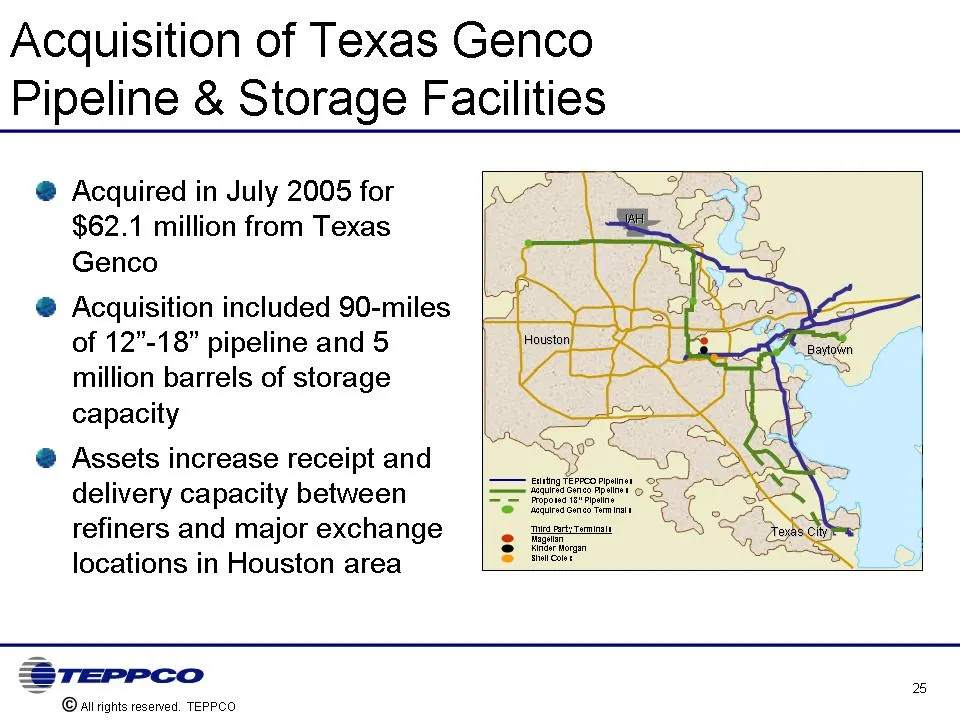
Slide 25: Acquisition of Texas Genco Pipeline and Storage Facilities
Acquisition of Texas Genco Pipeline and Storage Facilities Acquired in July 2005 for $62.1 million from Texas Genco Acquisition included 90-miles of 12"-18" pipeline and 5 million barrels of storage capacity Assets increase receipt and delivery capacity between refiners and major exchange locations
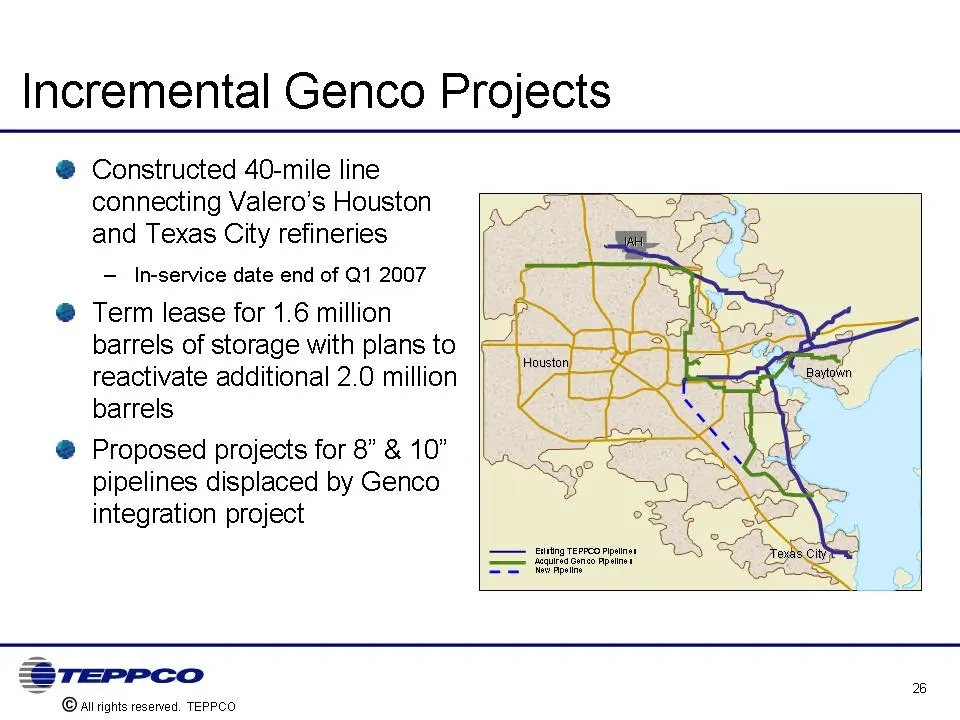
Slide 26: Incremental Genco Projects
Incremental Genco Projects Constructed 40-mile line connecting Valero's Houston and Texas City refineries In-service date end of Q1 2007 Term lease for 1.6 million barrels of storage with plans to reactivate additional 2.0 million barrels Proposed projects for 8" and 10" pipelines displaced by Genco
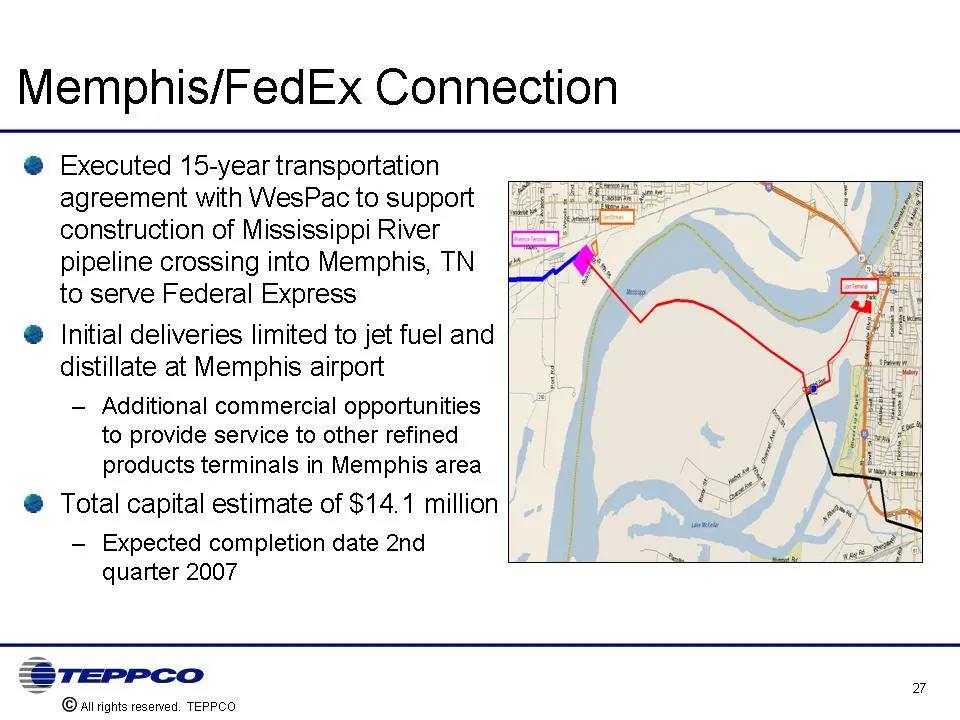
Slide 27: Memphis/FedEx Connection
Memphis/FedEx Connection Executed 15-year transportation agreement with WesPac to support construction of Mississippi River pipeline crossing into Memphis, TN to serve Federal Express Initial deliveries limited to jet fuel and distillate at Memphis airport Additional commercial opportunities to prov
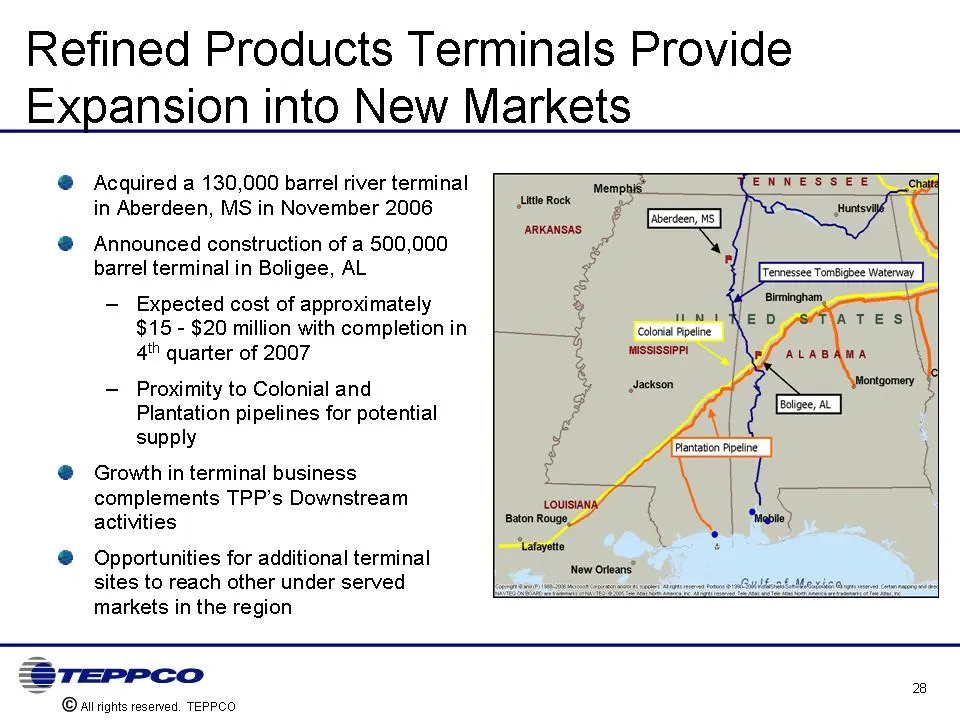
Slide 28: Refined Products Terminals Provide Expansion into New Markets
Refined Products Terminals Provide Expansion into New Markets Acquired a 130,000 barrel river terminal in Aberdeen, MS in November 2006 Announced construction of a 500,000 barrel terminal in Boligee, AL Expected cost of approximately $15 - $20 million with completion in 4th quarter of 2007 Proximity
Slide 29: Upstream Business
Upstream Business Mike Cockrell
Slide 30: TEPPCO Upstream Oil Pipeline Assets
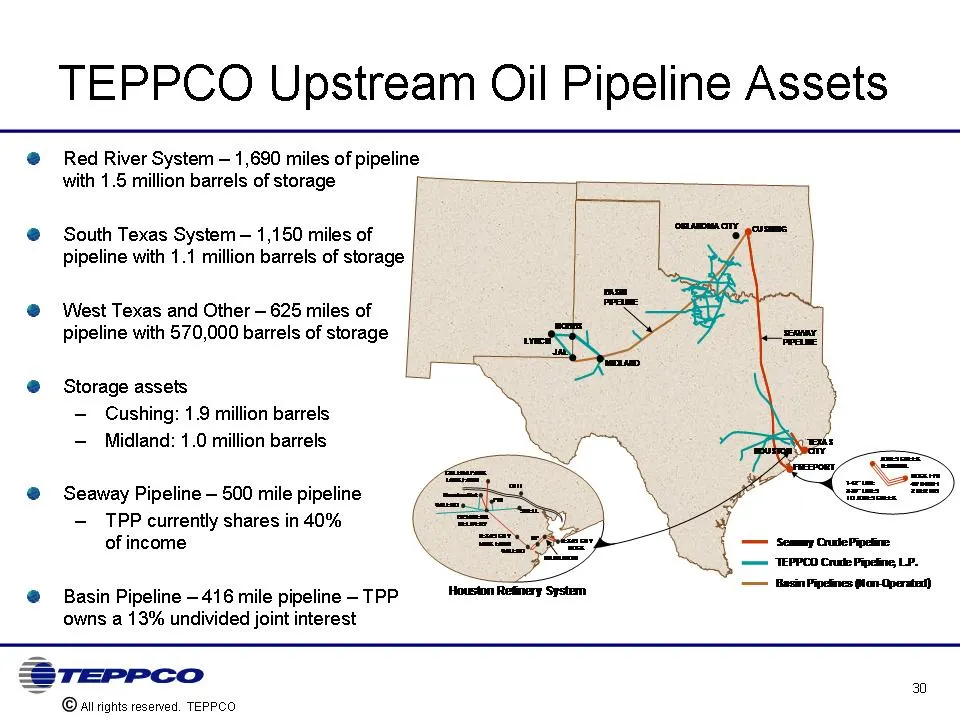
TEPPCO Upstream Oil Pipeline Assets Red River System - 1,690 miles of pipeline with 1.5 million barrels of storage South Texas System - 1,150 miles of pipeline with 1.1 million barrels of storage West Texas and Other - 625 miles of pipeline with 570,000 barrels of storage Storage assets Cushing: 1.9
Slide 31: TEPPCO Crude Gathering and Marketing
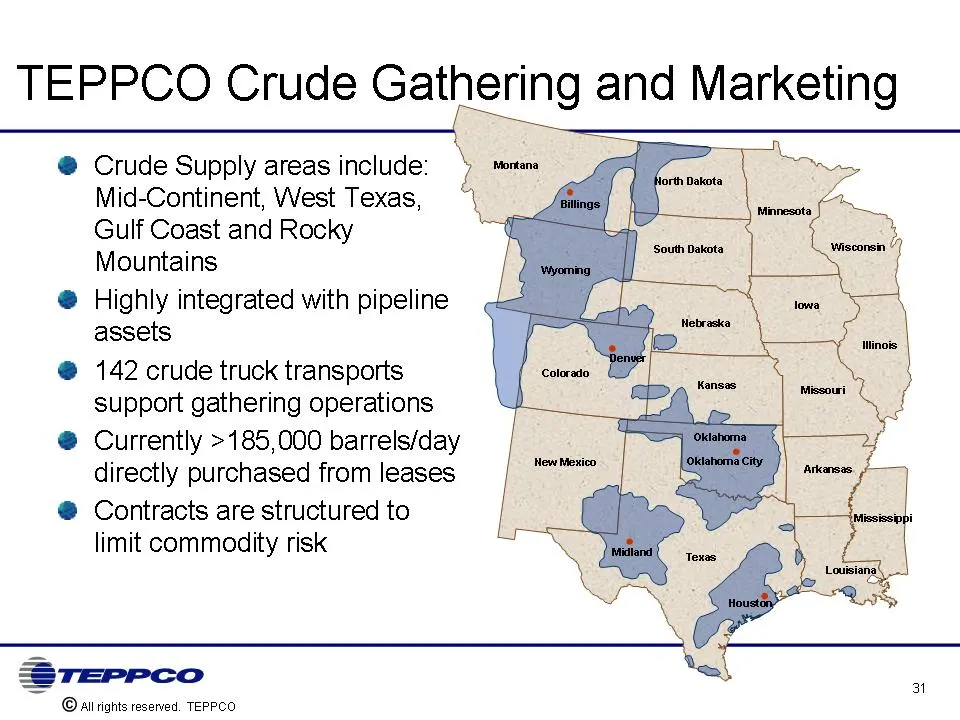
TEPPCO Crude Gathering and Marketing Crude Supply areas include: Mid-Continent, West Texas, Gulf Coast and Rocky Mountains Highly integrated with pipeline assets 142 crude truck transports support gathering operations Currently >185,000 barrels/day directly purchased from leases Contracts are struct
Slide 32: Seaway Crude Pipeline
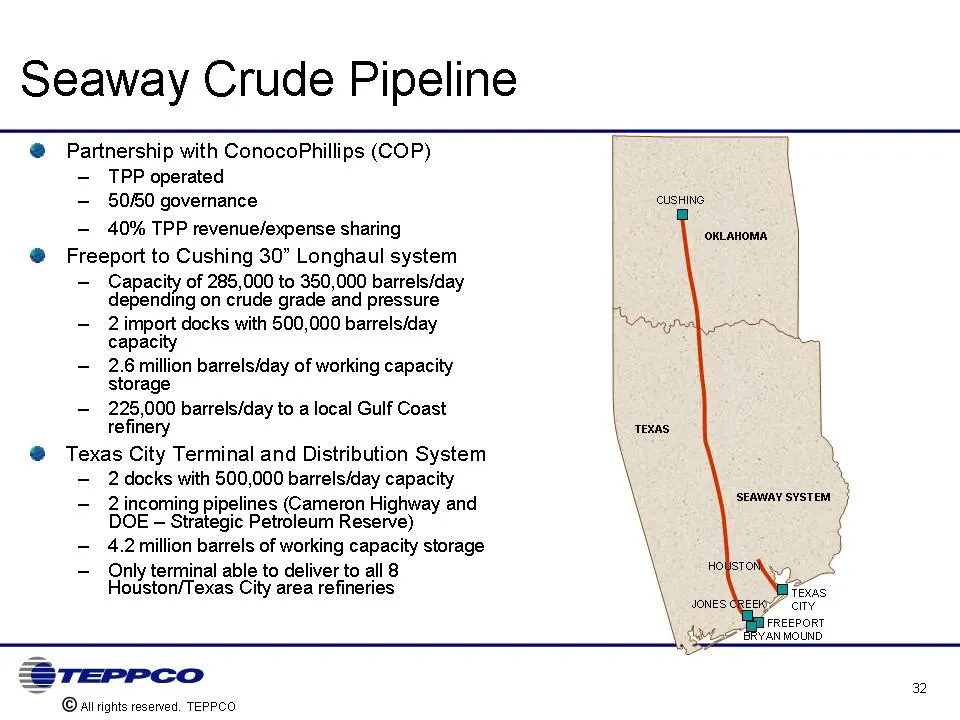
Seaway Crude Pipeline Partnership with ConocoPhillips (COP) TPP operated 50/50 governance 40% TPP revenue/expense sharing Freeport to Cushing 30" Longhaul system Capacity of 285,000 to 350,000 barrels/day depending on crude grade and pressure 2 import docks with 500,000 barrels/day capacity 2.6 mill
Slide 33: Lubrication Services
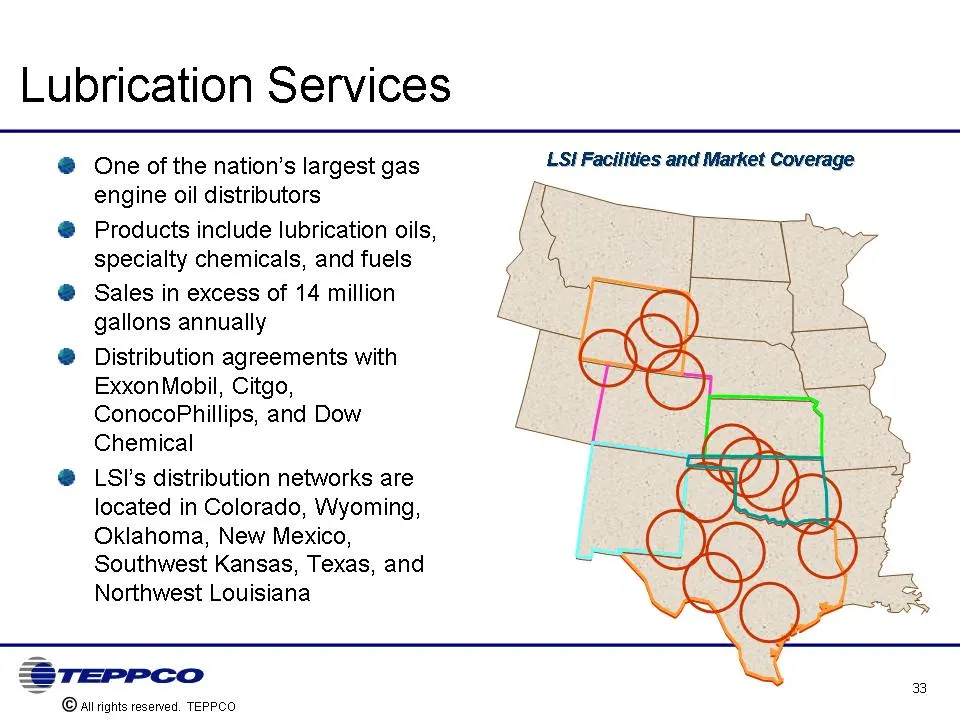
Lubrication Services One of the nation's largest gas engine oil distributors Products include lubrication oils, specialty chemicals, and fuels Sales in excess of 14 million gallons annually Distribution agreements with ExxonMobil, Citgo, ConocoPhillips, and Dow Chemical LSI's distribution networks a
Slide 34: Business Drivers for Growth
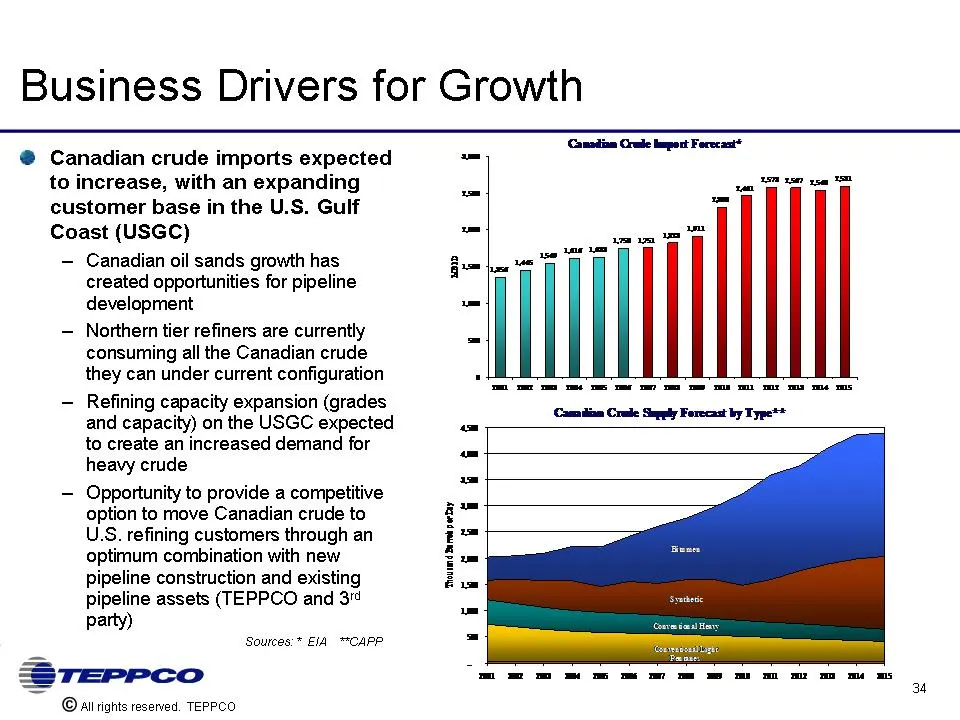
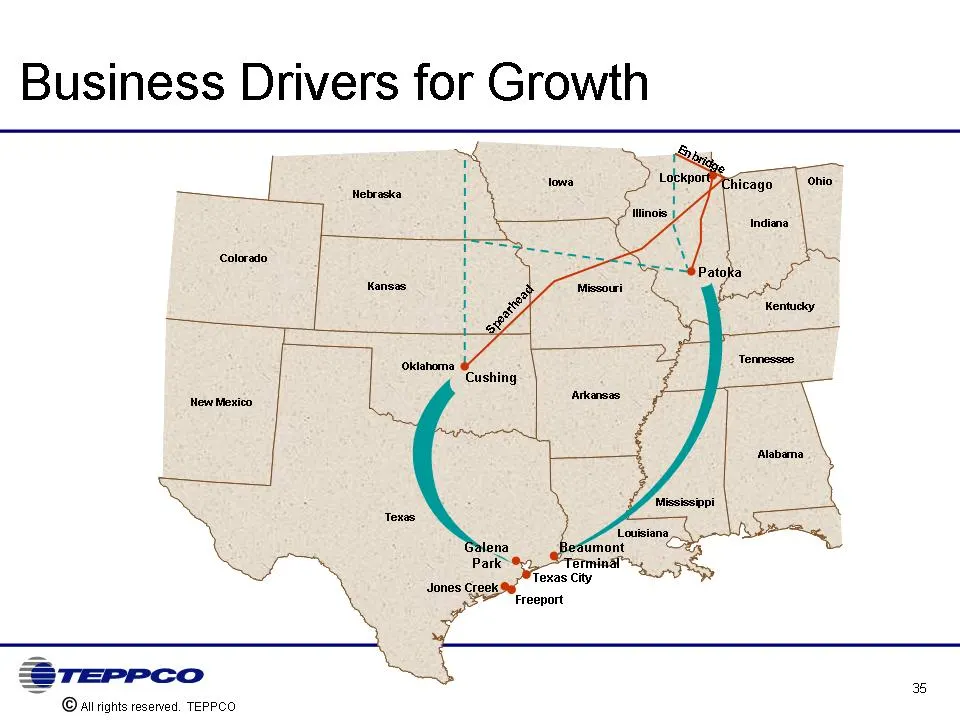
Business Drivers for Growth Canadian crude imports expected to increase, with an expanding customer base in the U.S. Gulf Coast (USGC) Canadian oil sands growth has created opportunities for pipeline development Northern tier refiners are currently consuming all the Canadian crude they can under cur
Slide 35: Business Drivers for Growth
Business Drivers for Growth Freeport TEPPCO ©alirights reserved. TEPPCO 5
Slide 36: Business Drivers for Growth
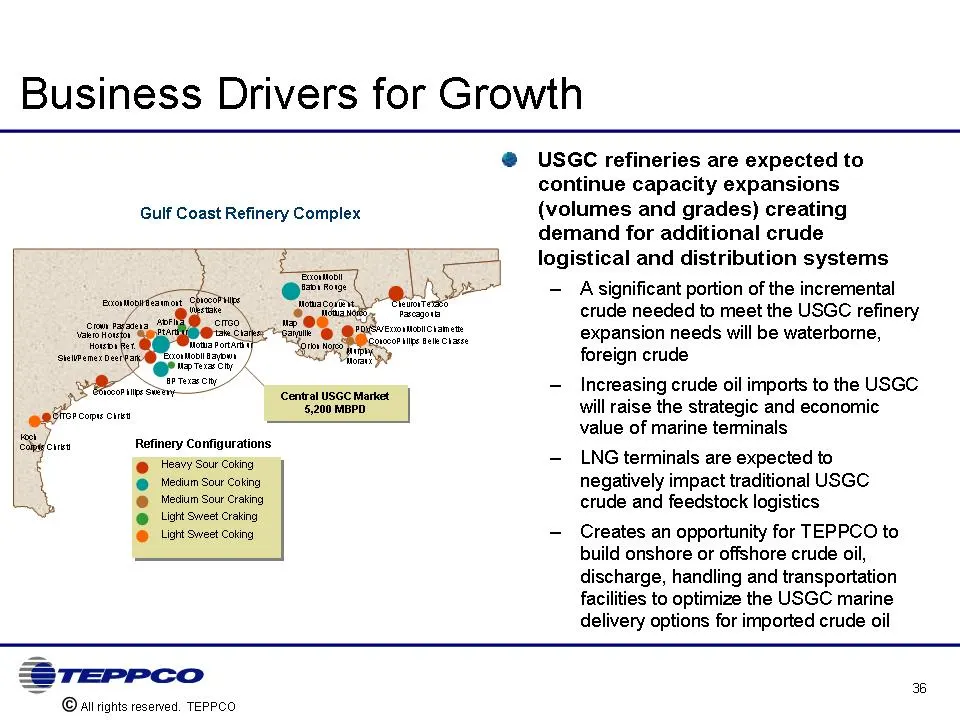
Business Drivers for Growth USGC refineries are expected to continue capacity expansions (volumes and grades) creating demand for additional crude logistical and distribution systems A significant portion of the incremental crude needed to meet the USGC refinery expansion needs will be waterborne, f
Slide 37: Growth Strategy
Growth Strategy Evaluate opportunities to participate in Canadian crude movements to the U. S. Gulf Coast Improve and expand services around existing asset base Continued storage expansion at Cushing Develop Gulf Coast infrastructure to expand area of operations Organic growth activity in Mid-Contin
Slide 38: Upstream Strategy Execution
Upstream Strategy Execution
Slide 39: Expansion of Cushing Storage Assets
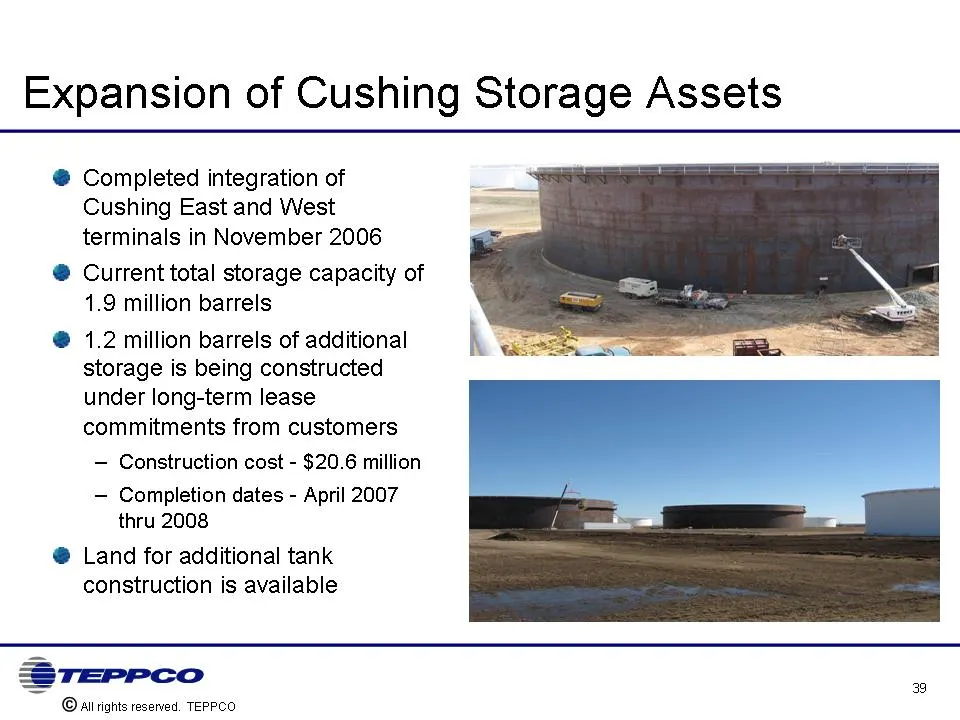
Expansion of Cushing Storage Assets Completed integration of Cushing East and West terminals in November 2006 Current total storage capacity of 1.9 million barrels 1.2 million barrels of additional storage is being constructed under long-term lease commitments from customers Construction cost - $20.
Slide 40: Other Projects
Other Projects Project completions throughout 2007 are expected to generate incremental cash flow in 2007 Provide attractive returns and complement existing assets Numerous lease supply extensions in the West Texas, New Mexico, and Mid-continent regions - completion dates throughout 2007 Pipeline su
Slide 41: Midstream Business
Midstream Business John Goodpasture
Slide 42: TEPPCO Midstream Business
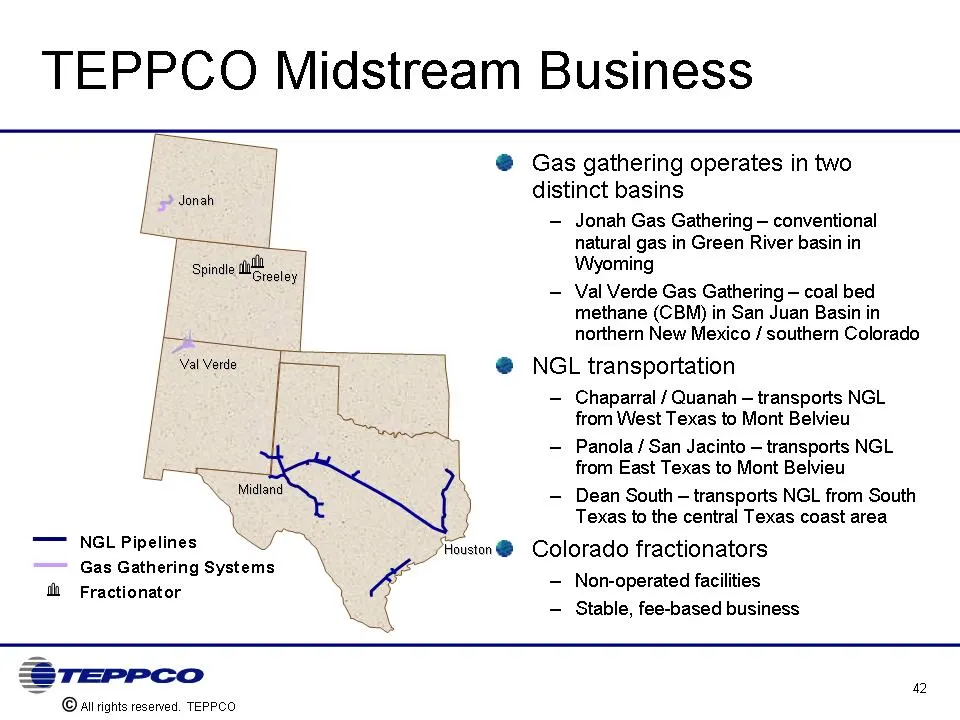
TEPPCO Midstream Business Gas gathering operates in two distinct basins Jonah Gas Gathering - conventional natural gas in Green River basin in Wyoming Val Verde Gas Gathering - coal bed methane (CBM) in San Juan Basin in northern New Mexico / southern Colorado NGL transportation Chaparral / Quanah -
Slide 43: Jonah Gas Gathering System Overview
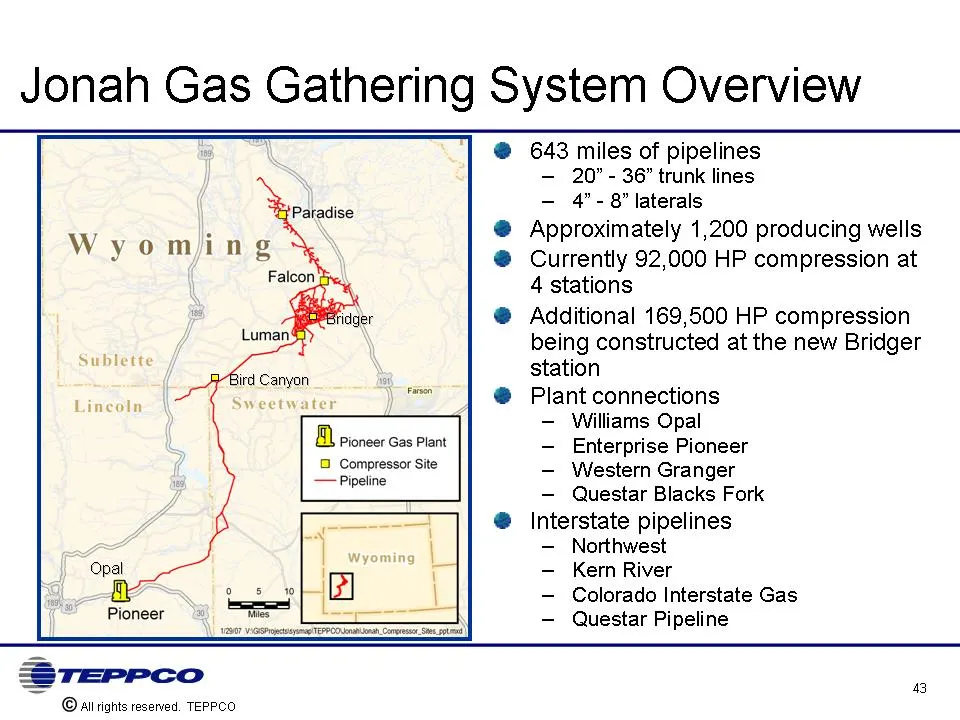
Jonah Gas Gathering System Overview 643 miles of pipelines 20" - 36" trunk lines 4" - 8" laterals Approximately 1,200 producing wells Currently 92,000 HP compression at 4 stations Additional 169,500 HP compression being constructed at the new Bridger station Plant connections Williams Opal Enterpris
Slide 44: Jonah Gas Gathering Volume Growth
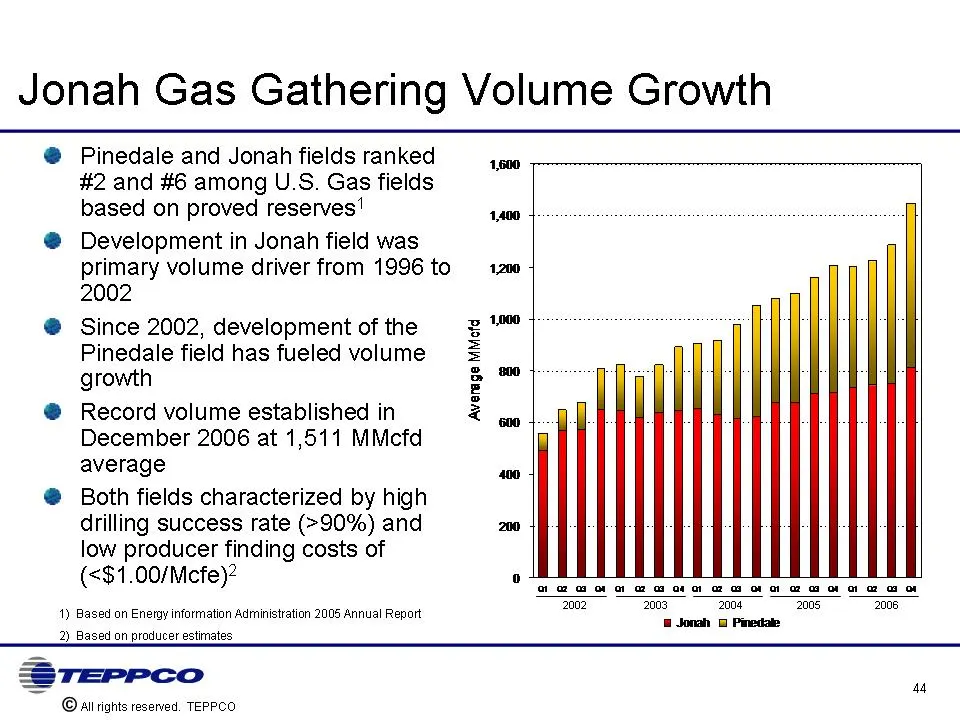
Jonah Gas Gathering Volume Growth Pinedale and Jonah fields ranked #2 and #6 among U.S. Gas fields based on proved reserves(1) Development in Jonah field was primary volume driver from 1996 to 2002 Since 2002, development of the Pinedale field has fueled volume growth Record volume established in De
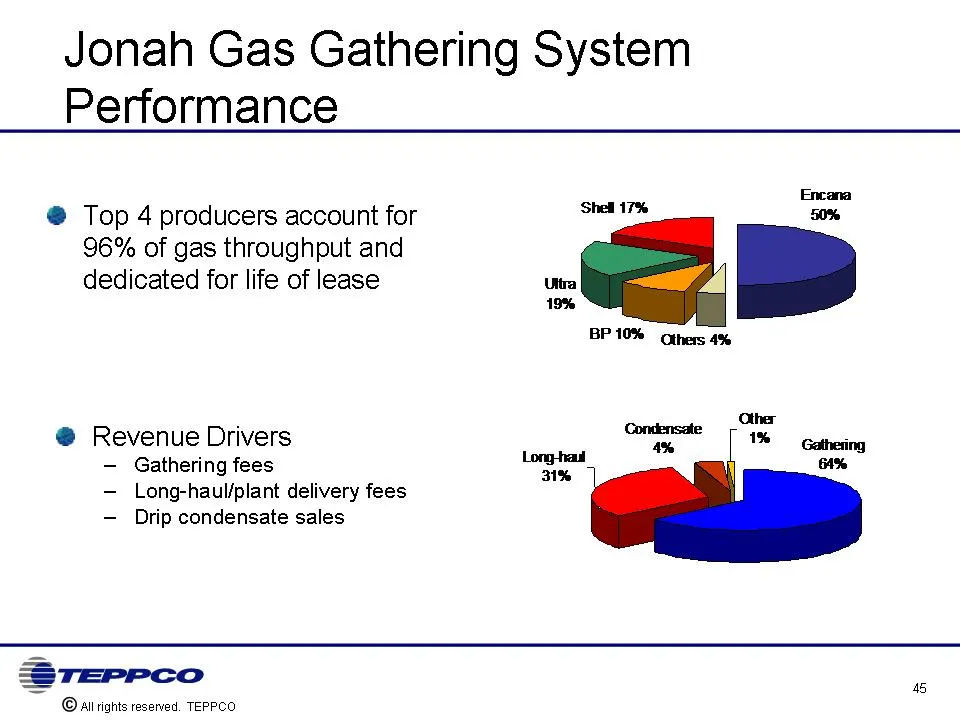
Slide 45: Jonah Gas Gathering System Performance
Jonah Gas Gathering System Performance Top 4 producers account for 96% of gas throughput and dedicated for life of lease Revenue Drivers Gathering fees Long-haul/plant delivery fees Drip condensate sales
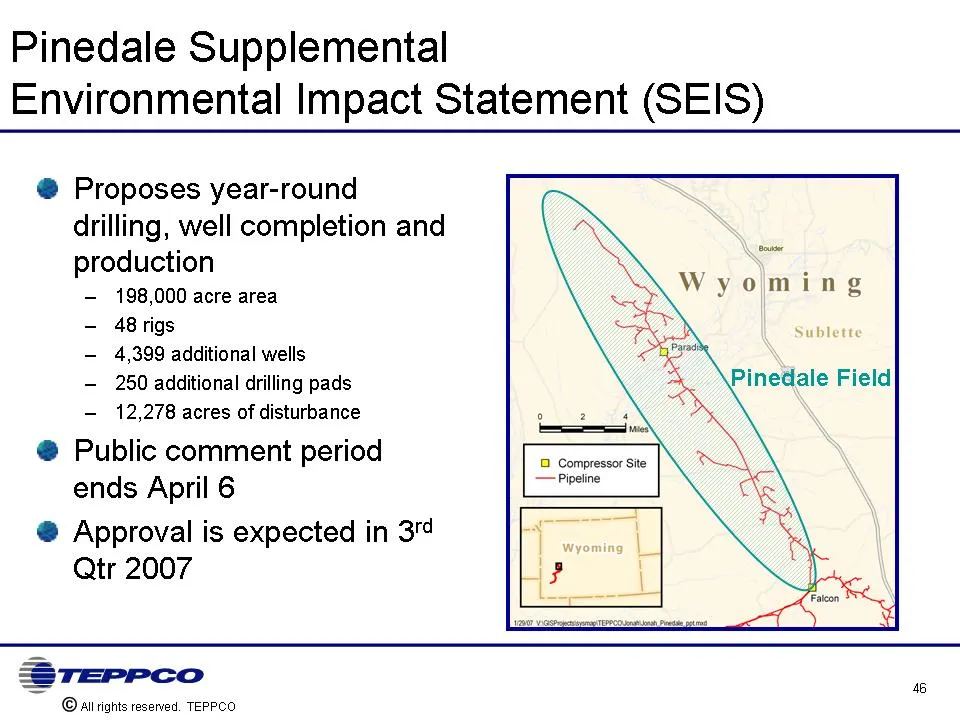
Slide 46: Pinedale Supplemental Environmental Impact Statement (SEIS)
Pinedale Supplemental Environmental Impact Statement (SEIS) Proposes year-round drilling, well completion and production 198,000 acre area 48 rigs 4,399 additional wells 250 additional drilling pads 12,278 acres of disturbance Public comment period ends April 6 Approval is expected in 3rd Qtr 2007
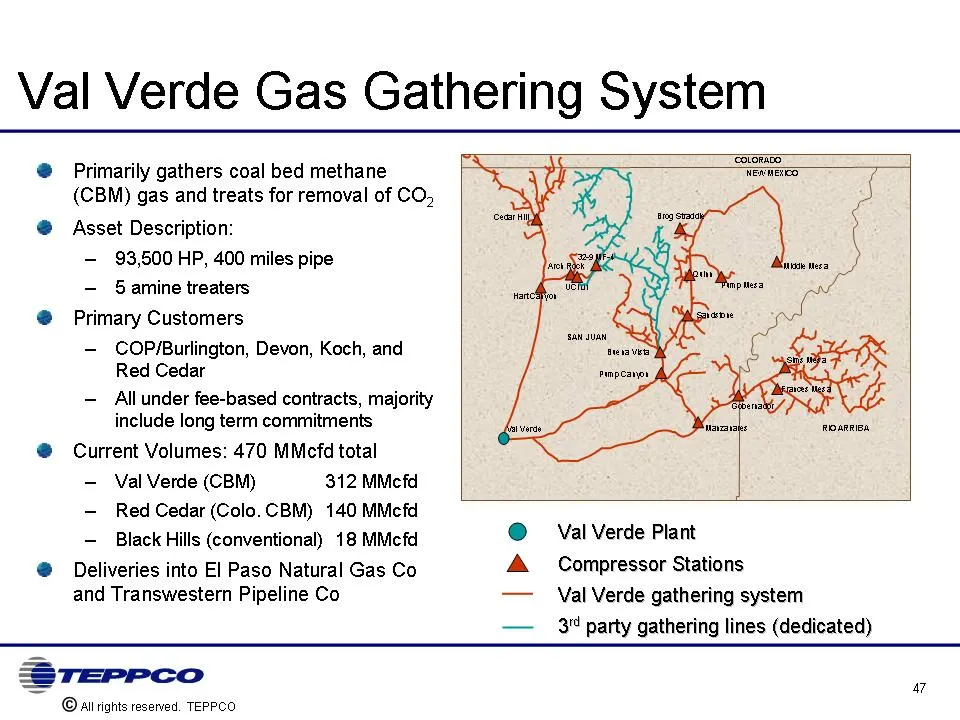
Slide 47: Val Verde Gas Gathering System
Val Verde Gas Gathering System Primarily gathers coal bed methane (CBM) gas and treats for removal of CO2 Asset Description: 93,500 HP, 400 miles pipe 5 amine treaters Primary Customers COP/Burlington, Devon, Koch, and Red Cedar All under fee-based contracts, majority include long term commitments C
Slide 48: Val Verde Gas Gathering Overview
Val Verde Gas Gathering Overview Val Verde plant is a highly reliable facility of modern design (fabricated with non-corrosive steel alloy) Existing system capacity provides opportunities to capture new business with minimal additional capital Commercial reach expanded with new connections to adjace
Slide 49: NGL Pipelines Overview
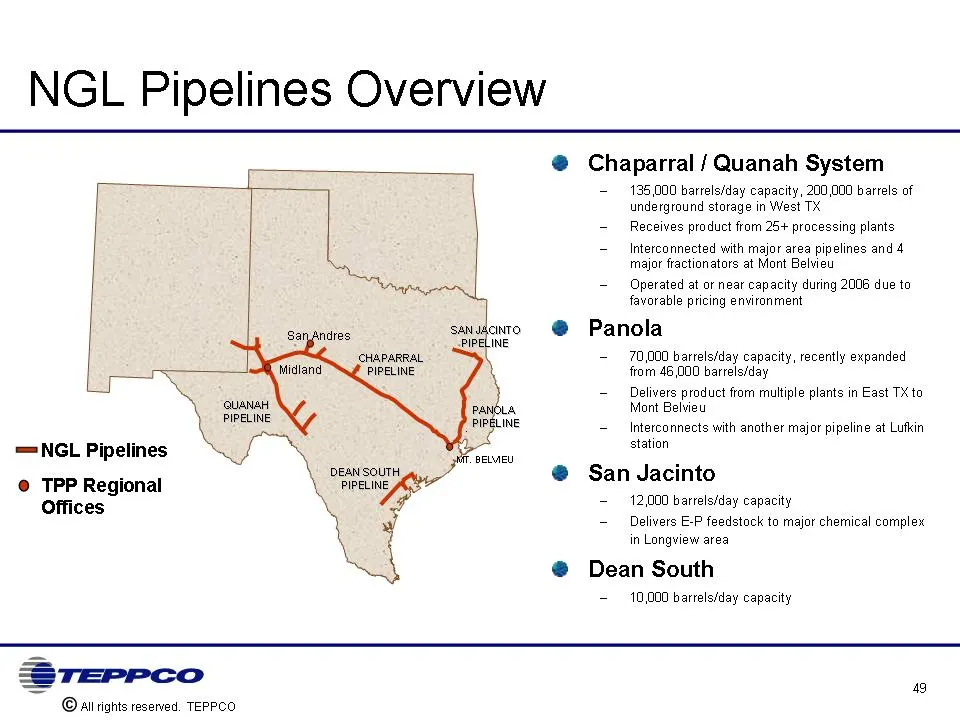
NGL Pipelines Overview Chaparral / Quanah System 135,000 barrels/day capacity, 200,000 barrels of underground storage in West TX Receives product from 25+ processing plants Interconnected with major area pipelines and 4 major fractionators at Mont Belvieu Operated at or near capacity during 2006 due
Slide 50: Business Drivers for Growth
Business Drivers for Growth Drilling/development in the Jonah and Pinedale fields are expected to remain active Both fields characterized by high drilling success rates, low finding costs, with significant remaining recoverable reserves Anticipated volume growth should result in further expansion of
Slide 51: Growth Strategy
Growth Strategy Build on excellent relationship as a service provider to the Jonah and Pinedale producers Completion of Phase V expansion provides adequate system capacity to handle substantial additional volumes Make additional investments as necessary to expand currently installed gathering capaci
Slide 52: Midstream Strategy Execution
Midstream Strategy Execution
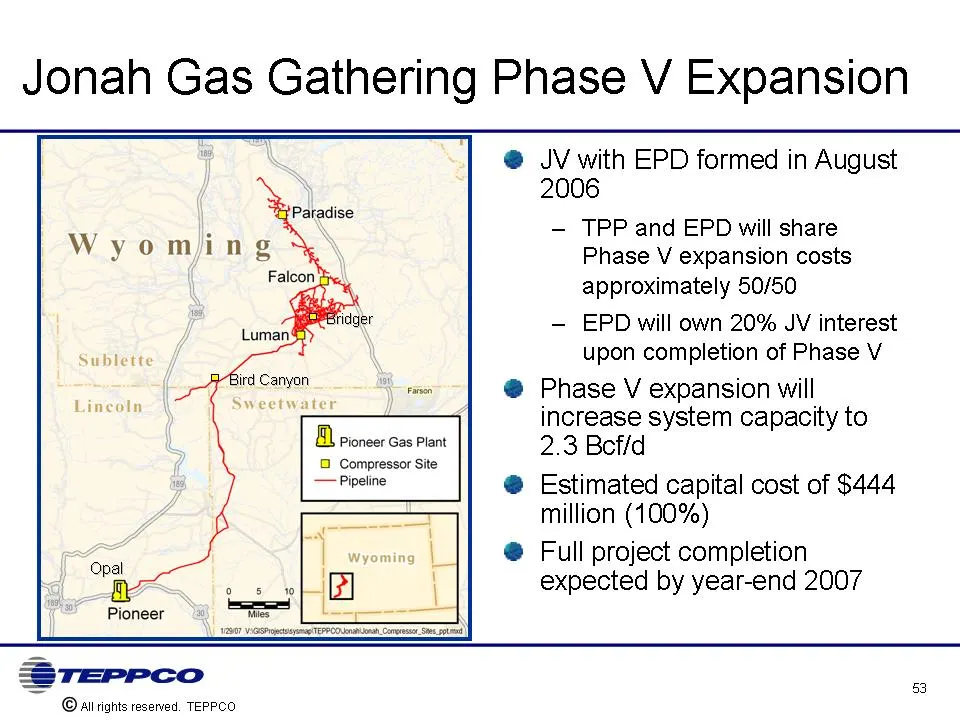
Slide 53: Jonah Gas Gathering Phase V Expansion
Jonah Gas Gathering Phase V Expansion JV with EPD formed in August 2006 TPP and EPD will share Phase V expansion costs approximately 50/50 EPD will own 20% JV interest upon completion of Phase V Phase V expansion will increase system capacity to 2.3 Bcf/d Estimated capital cost of $444 million (100%
Slide 54: Jonah Gas Gathering Phase V Expansion Project Objectives
Jonah Gas Gathering Phase V Expansion Project Objectives Segregate Jonah and Pinedale Systems 1.3 Bcf/day for Jonah Field 1.0 Bcf/day for Pinedale Field Reduce wellhead pressures in both fields (below 300 psi in the Jonah Field) Increase production rates and ultimate reserve recoveries Realize highe
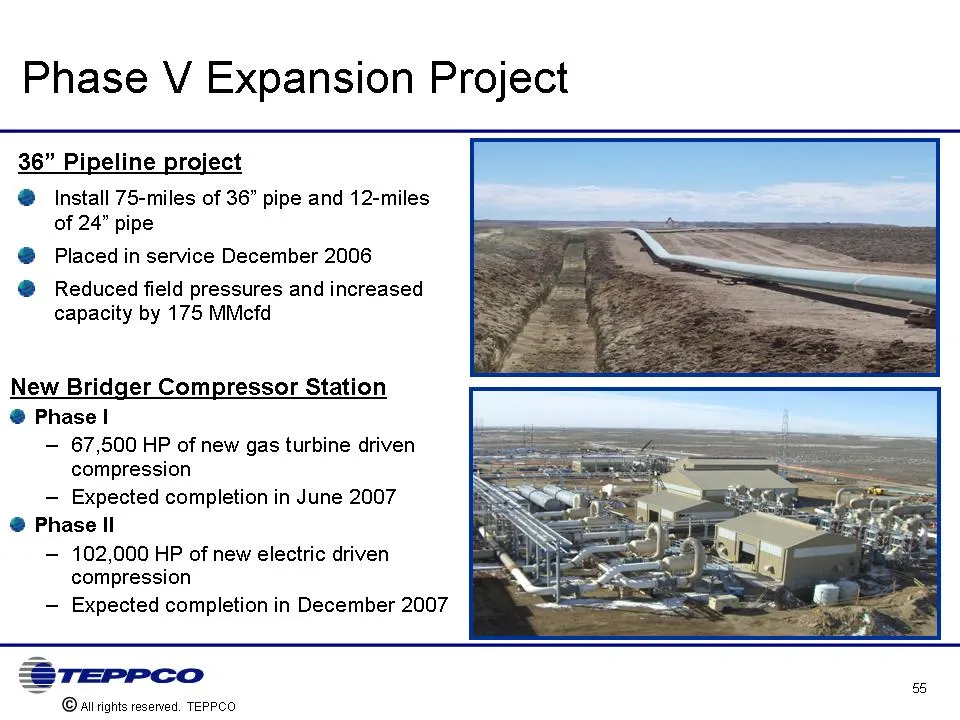
Slide 55: Phase V Expansion Project
Phase V Expansion Project 36" Pipeline project Install 75-miles of 36" pipe and 12-miles of 24" pipe Placed in service December 2006 Reduced field pressures and increased capacity by 175 MMcfd
Slide 56: Financial Overview
Financial Overview Bill Manias
Slide 57: Financial Strategy
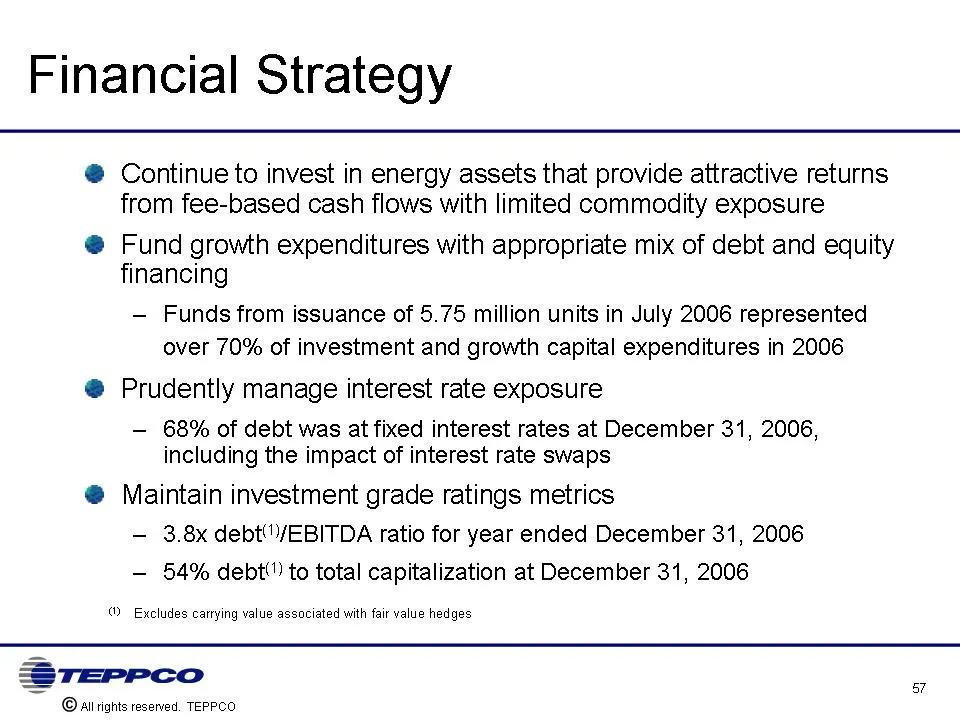
Financial Strategy Continue to invest in energy assets that provide attractive returns from fee-based cash flows with limited commodity exposure Fund growth expenditures with appropriate mix of debt and equity financing Funds from issuance of 5.75 million units in July 2006 represented over 70% of i
Slide 58: Record 2006 Performance
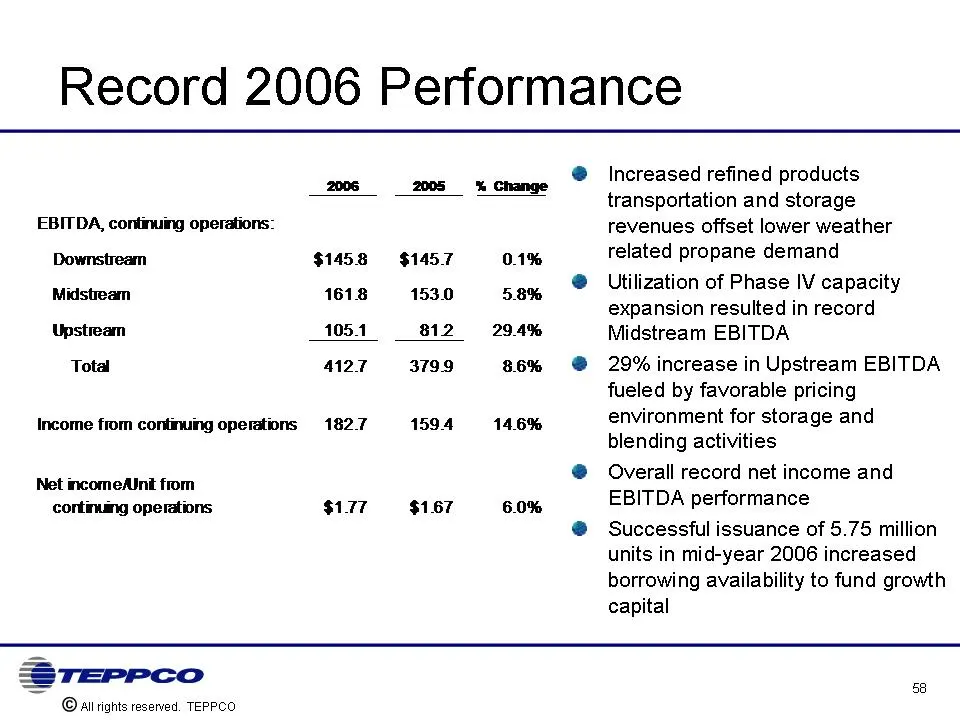
Record 2006 Performance Increased refined products transportation and storage revenues offset lower weather related propane demand Utilization of Phase IV capacity expansion resulted in record Midstream EBITDA 29% increase in Upstream EBITDA fueled by favorable pricing environment for storage and bl
Slide 59: Increased Level of Organic Growth in 2007
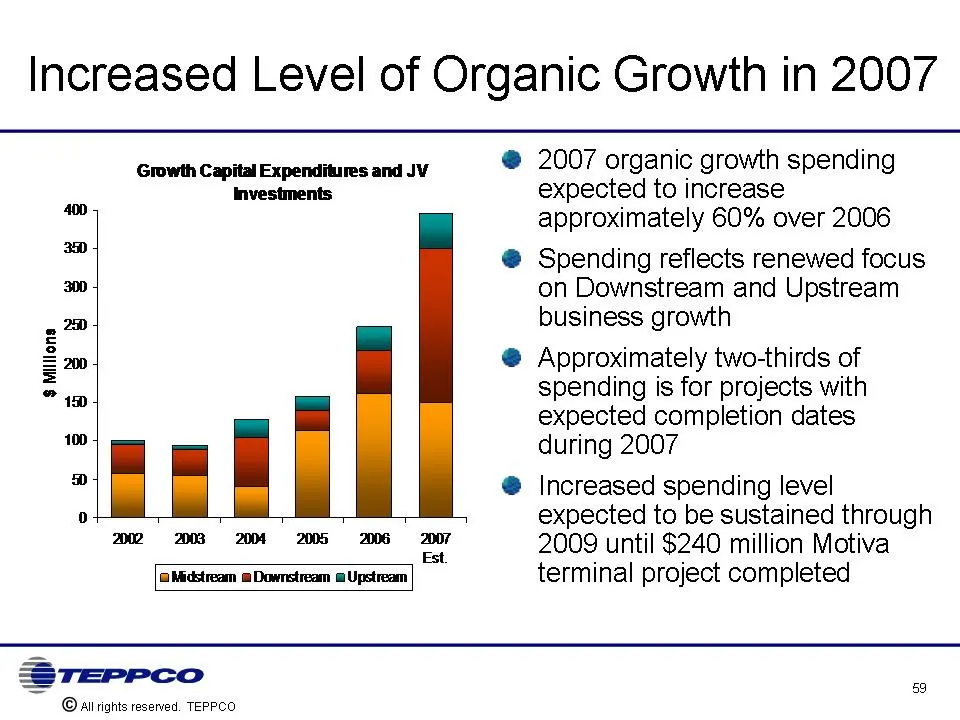
Increased Level of Organic Growth in 2007 2007 organic growth spending expected to increase approximately 60% over 2006 Spending reflects renewed focus on Downstream and Upstream business growth Approximately two-thirds of spending is for projects with expected completion dates during 2007 Increased
Slide 60: 2007 Growth Capital Spending Detail
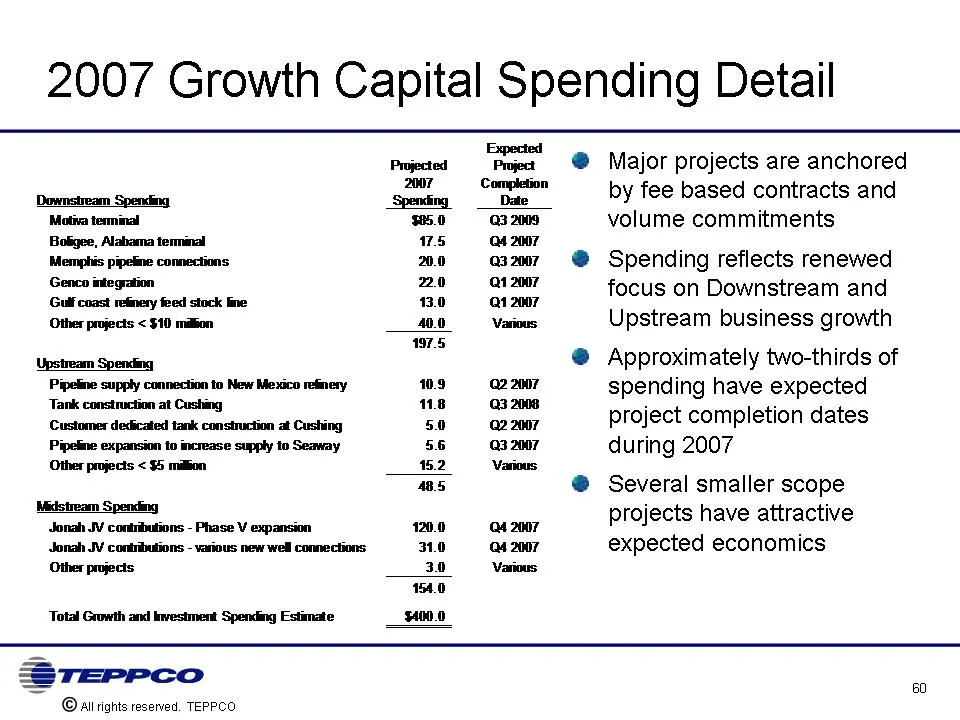
2007 Growth Capital Spending Detail Major projects are anchored by fee based contracts and volume commitments Spending reflects renewed focus on Downstream and Upstream business growth Approximately two-thirds of spending have expected project completion dates during 2007 Several smaller scope proje
Slide 61: Flexibility to Fund 2007 Capital Spending
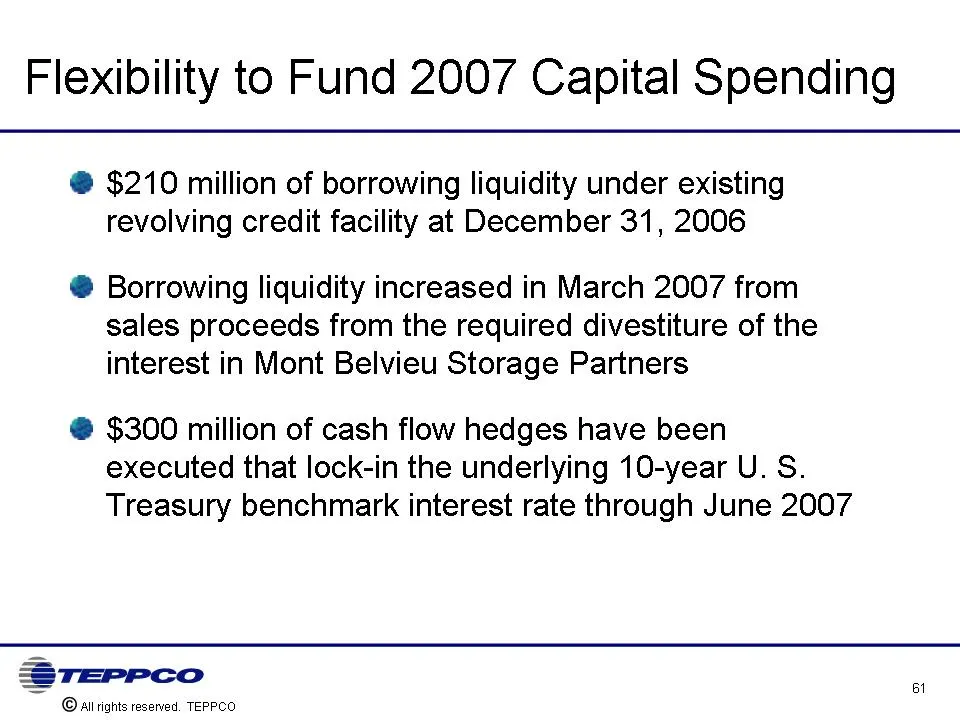
Flexibility to Fund 2007 Capital Spending $210 million of borrowing liquidity under existing revolving credit facility at December 31, 2006 Borrowing liquidity increased in March 2007 from sales proceeds from the required divestiture of the interest in Mont Belvieu Storage Partners $300 million of c
Slide 62: Reduced GP Incentive Distribution Structure Lowers Equity Cost of Capital
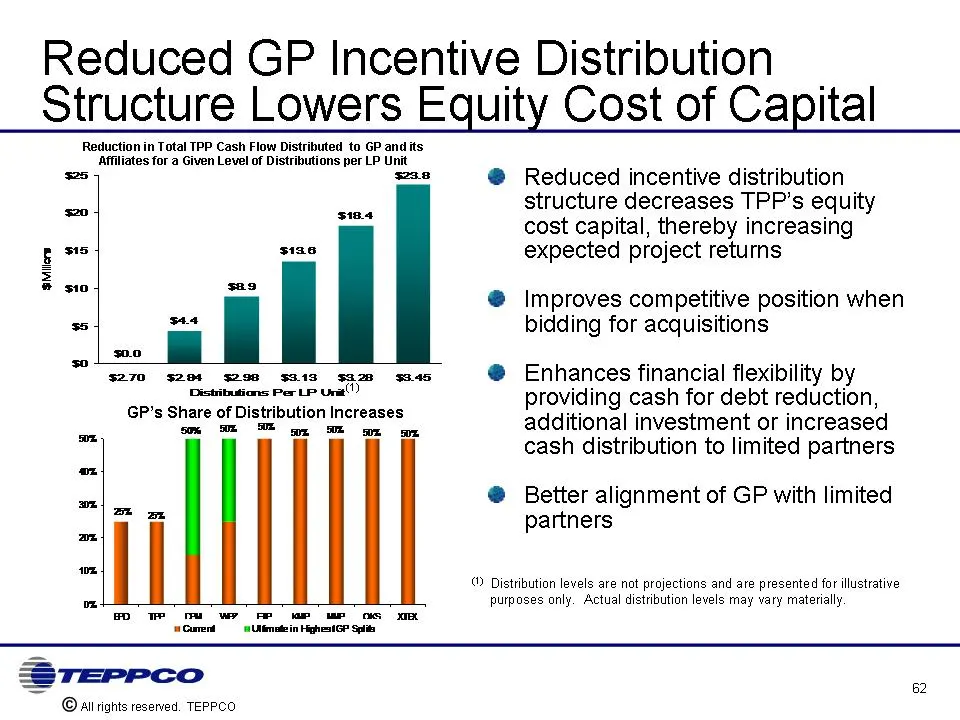
Reduced GP Incentive Distribution Structure Lowers Equity Cost of Capital Reduced incentive distribution structure decreases TPP's equity cost capital, thereby increasing expected project returns Improves competitive position when bidding for acquisitions Enhances financial flexibility by providing
Slide 63: Consistent Investment Grade Financial Metrics
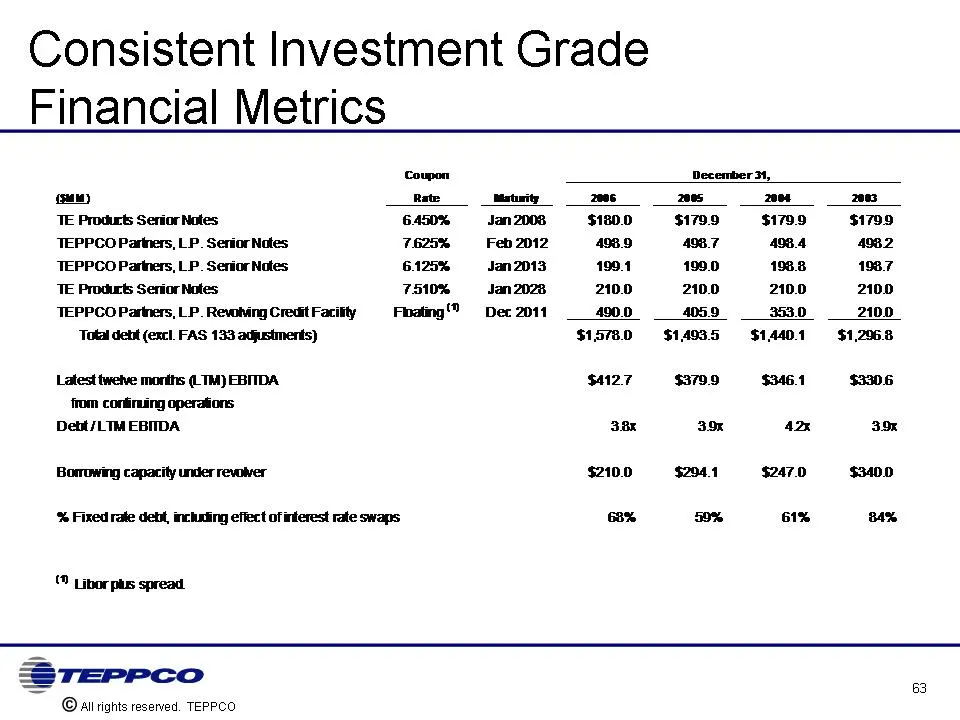
Consistent Investment Grade Financial Metrics
Slide 64: Financial Strengths
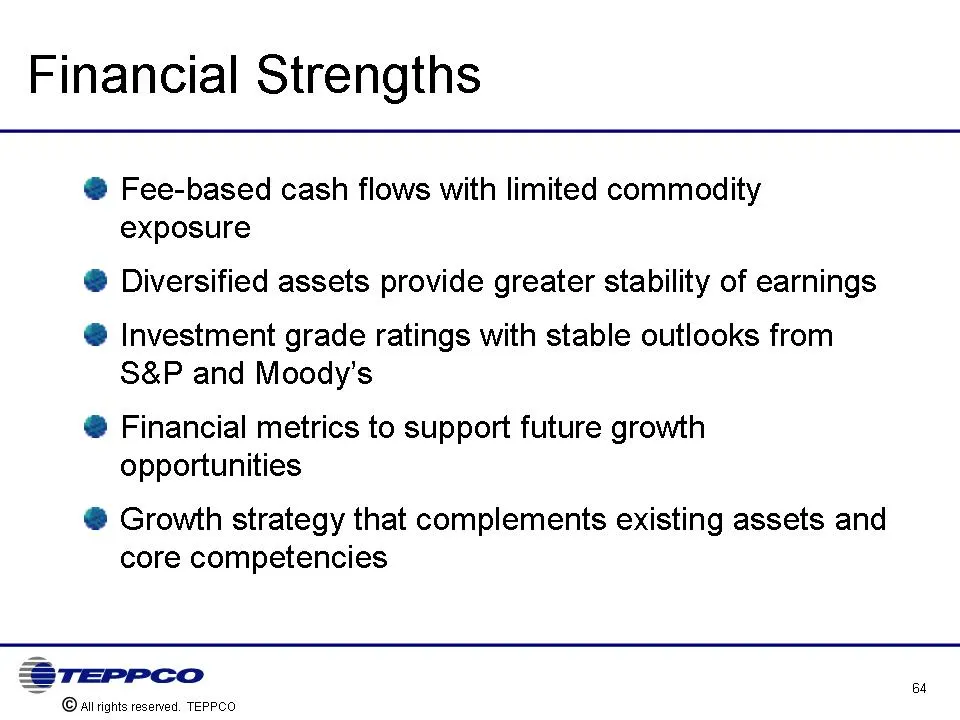
Financial Strengths Fee-based cash flows with limited commodity exposure Diversified assets provide greater stability of earnings Investment grade ratings with stable outlooks from SP and Moody's Financial metrics to support future growth opportunities Growth strategy that complements existing asset
Slide 65: Summary
TEPPCO ©alirights reserved. TEPPCO Summary Jerry Thompson 65
Slide 66: 2007 Outlook
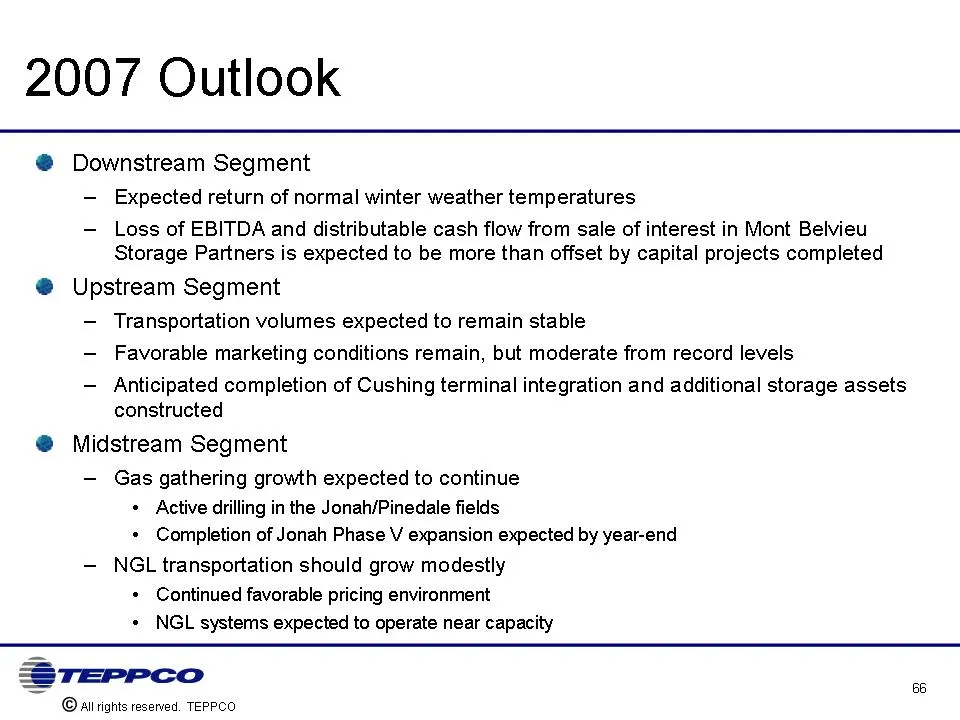
2007 Outlook Downstream Segment Expected return of normal winter weather temperatures Loss of EBITDA and distributable cash flow from sale of interest in Mont Belvieu Storage Partners is expected to be more than offset by capital projects completed Upstream Segment Transportation volumes expected to
Slide 67: Well Positioned for Future Growth
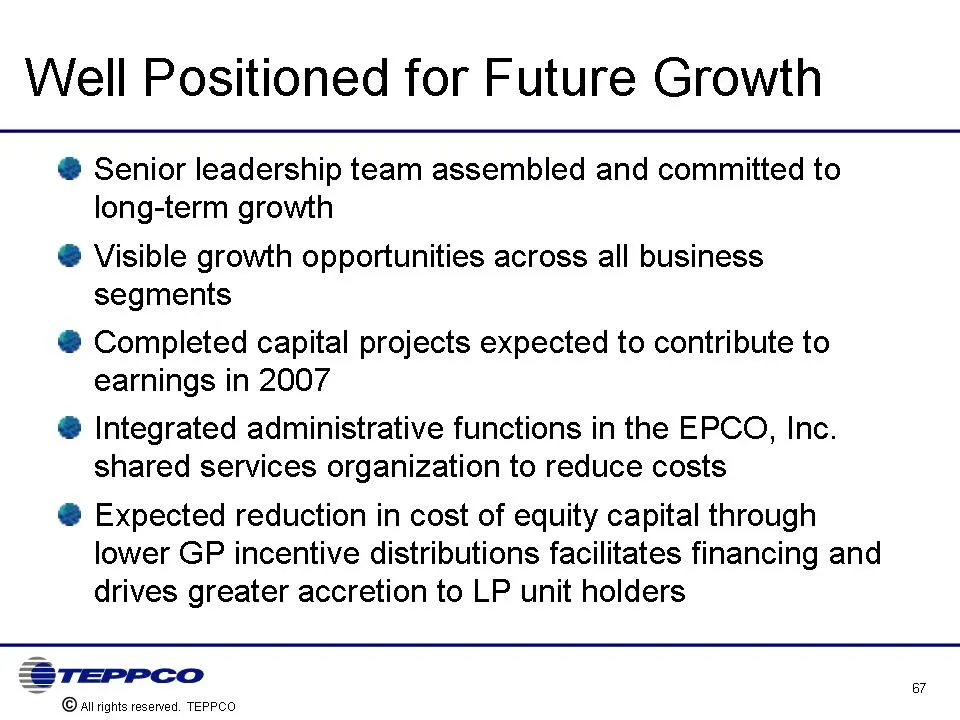
Well Positioned for Future Growth Senior leadership team assembled and committed to long-term growth Visible growth opportunities across all business segments Completed capital projects expected to contribute to earnings in 2007 Integrated administrative functions in the EPCO, Inc. shared services o
Slide 68: Questions and Answers
Questions and Answers NYSE: TPP www.teppco.com (800) 659-0059
Slide 69: Appendix
TEPPCO ©alirights reserved. TEPPCO Appendix 69
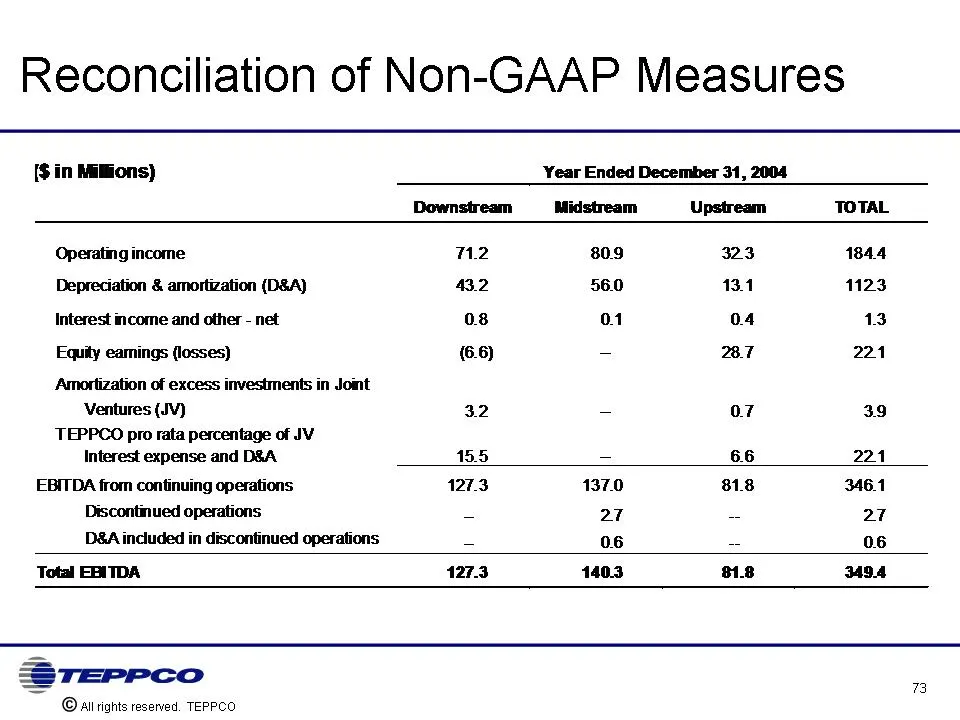
Slide 70: Reconciliation of Non-GAAP Measures
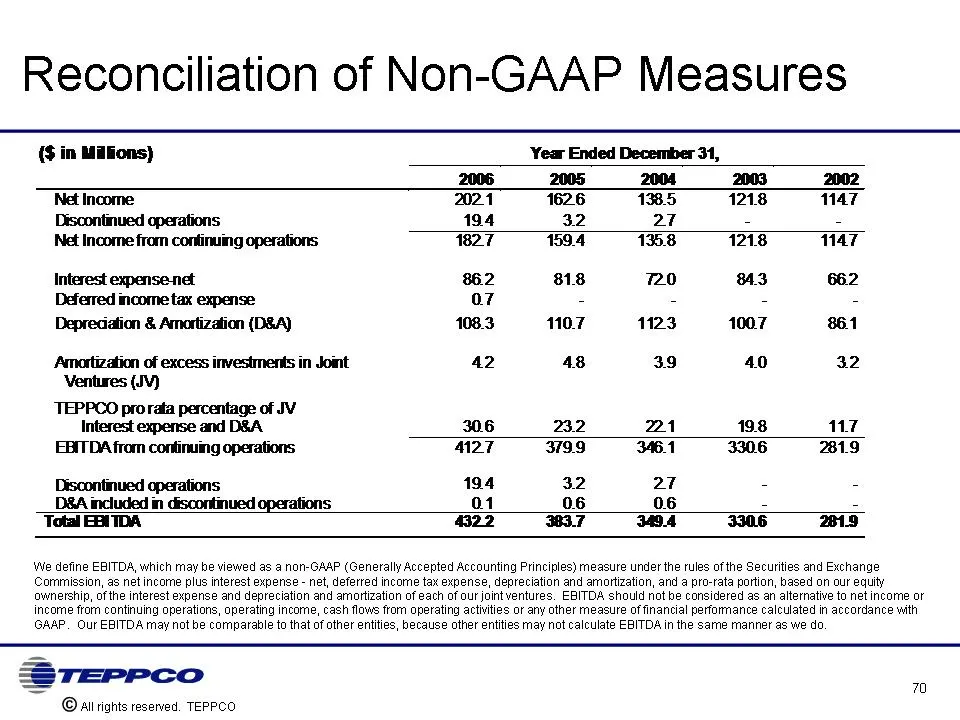
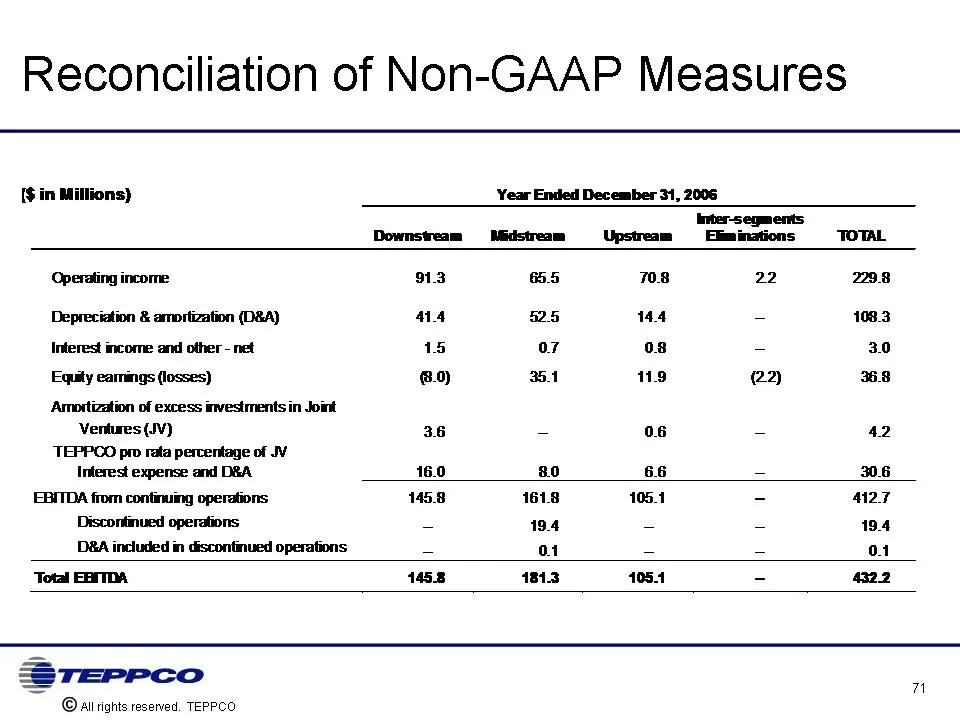
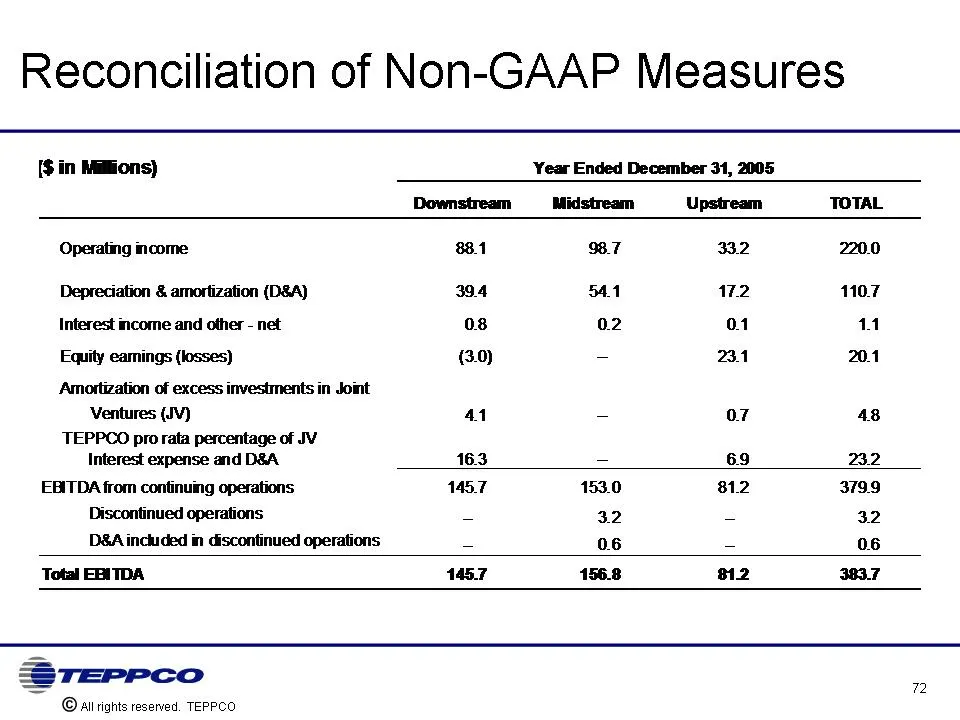
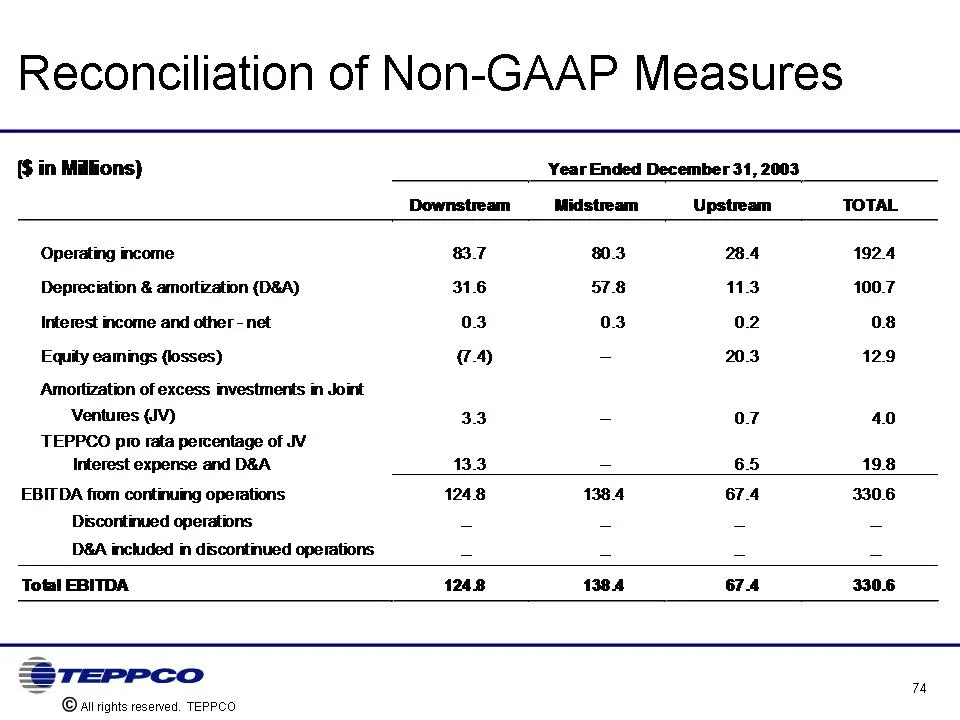
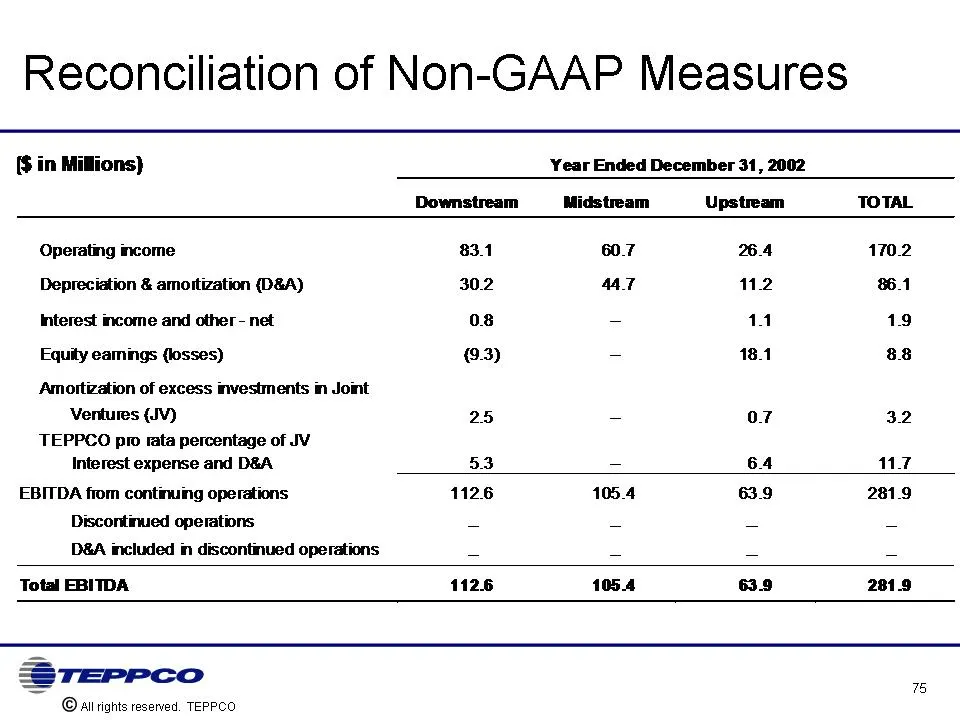
Reconciliation of Non-GAAP Measures We define EBITDA, which may be viewed as a non-GAAP (Generally Accepted Accounting Principles) measure under the rules of the Securities and Exchange Commission, as net income plus interest expense - net, deferred income tax expense, depreciation and amortization,
Slide 71: Reconciliation of Non-GAAP Measures
Reconciliation of Non-GAAP Measures
Slide 72: Reconciliation of Non-GAAP Measures
Reconciliation of Non-GAAP Measures
Slide 73: Reconciliation of Non-GAAP Measures
Reconciliation of Non-GAAP Measures
Slide 74: Reconciliation of Non-GAAP Measures
Reconciliation of Non-GAAP Measures
Slide 75: Reconciliation of Non-GAAP Measures
Reconciliation of Non-GAAP Measures
Source: SEC EDGAR · 8-K filed Mar 29, 2007
More decks from Teppco Partners LP
 Morgan Stanley MLP Reception (October 2009)26 slides · Oct 7, 2009
 Master Limited Partnerships Investor Conference (September 2009)27 slides · Sep 16, 2009
 Wells Fargo Retail Meeting (September 2009)27 slides · Sep 15, 2009
 Barclays Capital CEO Energy/Power Conference 200929 slides · Sep 9, 2009
 Merger or Acquisition (August 2009)29 slides · Aug 26, 2009
 Wachovia Securities Investor Presentation (June 2007)51 slides · Jun 1, 2007