Franklin Financial Network Inc
Franklin Financial Network — Q4 2018 Earnings Presentation
14 slides from Franklin Financial Network's earnings presentation, Jan 24, 2019
Slide 1: Fourth Quarter 2018 Investor Call
Franklin Financial Network, Inc. (NYSE:FSB) Fourth Quarter 2018 Investor Call January 24, 2019
Slide 2: Forward-Looking Statements
Forward - Looking Statements Except for the historical information contained herein, this presentation contains forward - looking statements within the meaning of Section 27A of the Securities Act of 1933, as amended, and Section 21E of the Securities Exchange Act of 1934, as amended. The forward -
Slide 3: Key Highlights: Financial Results and Recent Developments
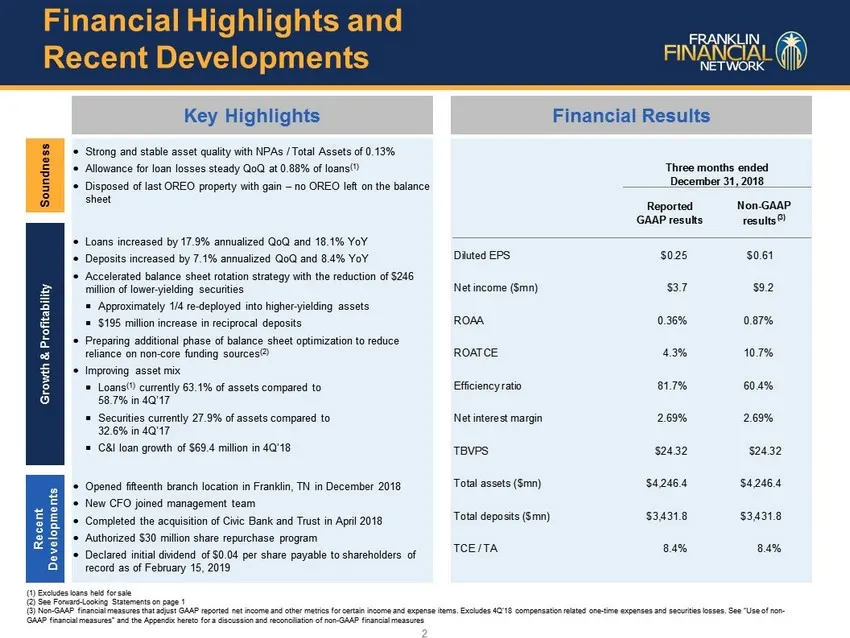
Key Highlights Financial Results (1) Excludes loans held for sale (2) See Forward - Looking Statements on page 1 (3) Non - GAAP financial measures that adjust GAAP reported net income and other metrics for certain income and expense items. Exc ludes 4Q’18 compensation related one - time expenses and
Slide 4: $19.7 $30.9 $41.8 $51.3 $60.8 $73.5 $16.0 $18.3 $21.7 70.0% 64.1% 56.4% 51.7% 54.4%
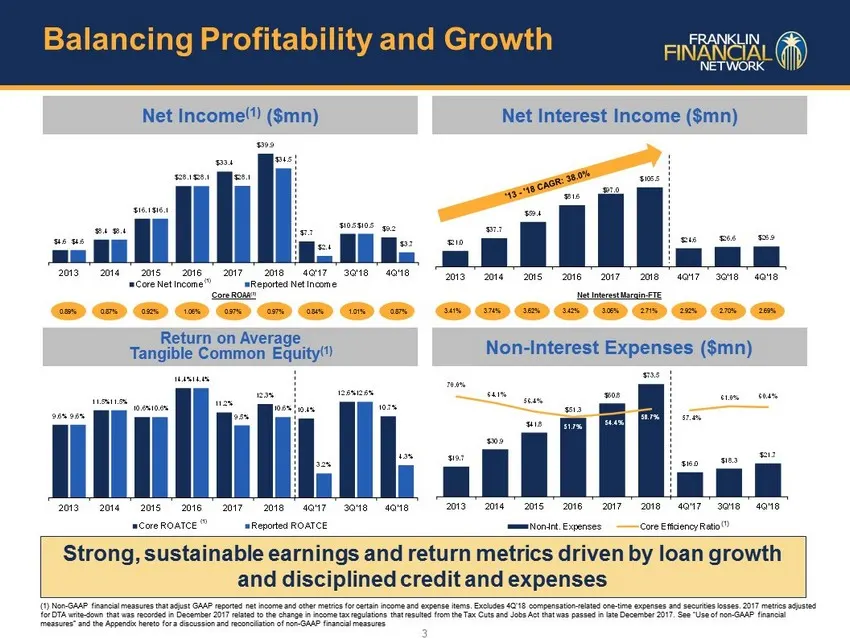
$19.7 $30.9 $41.8 $51.3 $60.8 $73.5 $16.0 $18.3 $21.7 70.0% 64.1% 56.4% 51.7% 54.4% 58.7% 57.4% 61.0% 60.4% 2013 2014 2015 2016 2017 2018 4Q'17 3Q'18 4Q'18 Non-Int. Expenses Core Efficiency Ratio $4.6 $8.4 $16.1 $28.1 $33.4 $39.9 $7.7 $10.5 $9.2 $4.6 $8.4 $16.1 $28.1 $28.1 $34.5 $2.4 $10.5 $3.7 2013
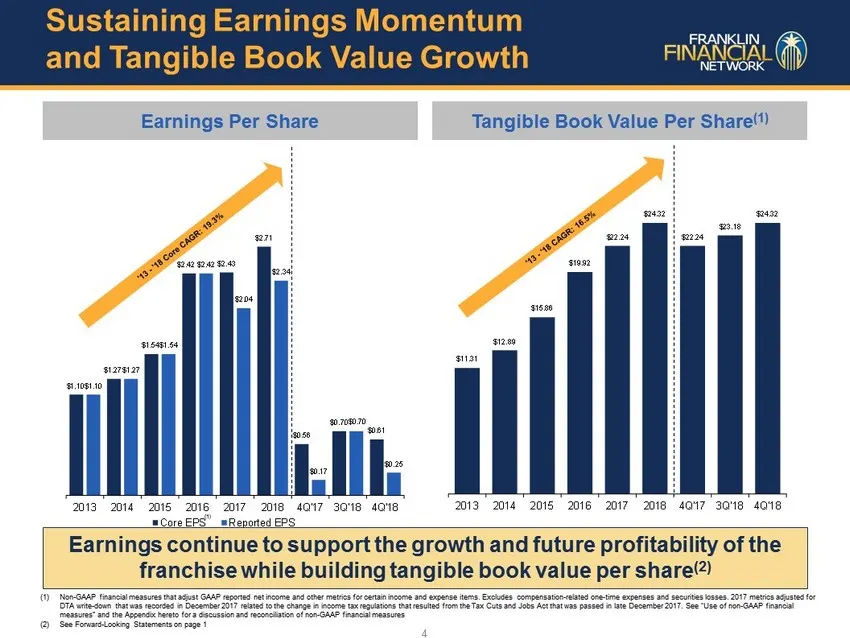
Slide 5: Sustaining Earnings Momentum and Tangible Book Value Growth
$1.10 $1.27 $1.54 $2.42 $2.43 $2.71 $0.56 $0.70 $0.61 $1.10 $1.27 $1.54 $2.42 $2.04 $2.34 $0.17 $0.70 $0.25 2013 2014 2015 2016 2017 2018 4Q'17 3Q'18 4Q'18 Core EPS Reported EPS $11.31 $12.89 $15.86 $19.92 $22.24 $24.32 $22.24 $23.18 $24.32 2013 2014 2015 2016 2017 2018 4Q'17 3Q'18 4Q'18 Earnings Pe
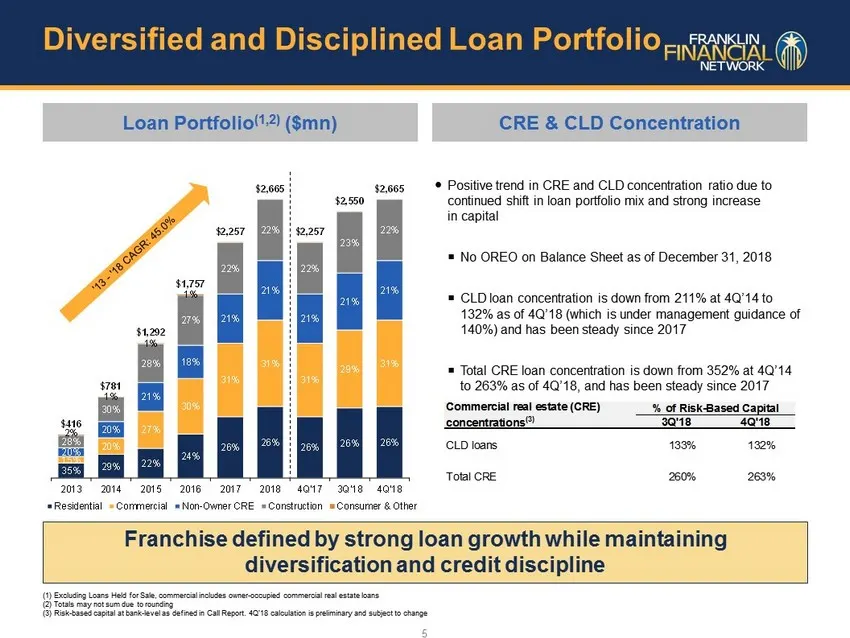
Slide 6: Diversified and Disciplined Loan Portfolio
Diversified and Disciplined Loan Portfolio Loan Portfolio (1,2) ($ mn ) CRE & CLD Concentration Franchise defined by strong loan growth while maintaining diversification and credit discipline (1) Excluding Loans Held for Sale, commercial includes owner - occupied commercial real estate loans (2) Tot
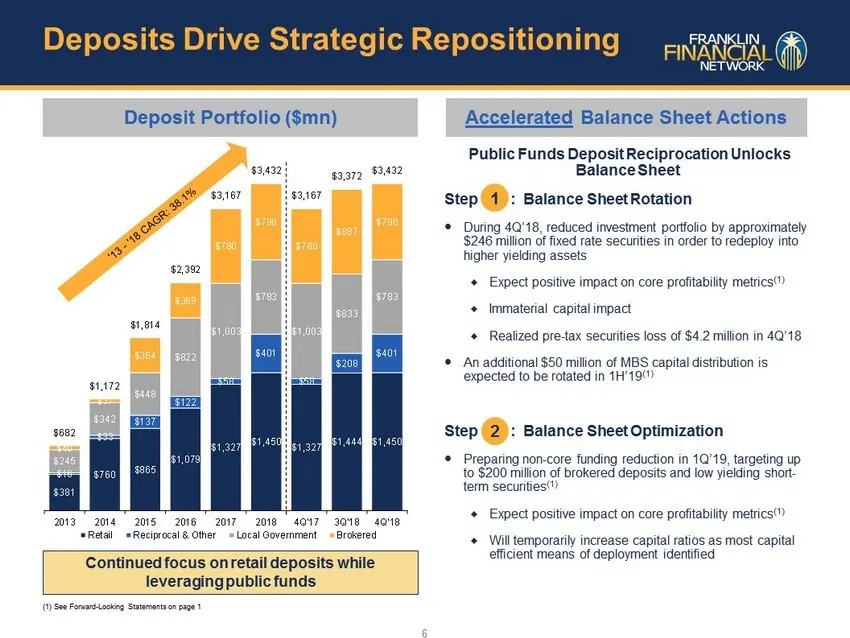
Slide 7: Deposit Reciprocation Unlocks Balance Sheet Rotation
$381 $760 $865 $1,079 $1,327 $1,450 $1,327 $1,444 $1,450 $16 $33 $137 $122 $58 $401 $58 $208 $401 $245 $342 $448 $822 $1,003 $783 $1,003 $833 $783 $40 $37 $364 $369 $780 $798 $780 $887 $798 $682 $1,172 $1,814 $2,392 $3,167 $3,432 $3,167 $3,372 $3,432 2013 2014 2015 2016 2017 2018 4Q'17 3Q'18 4Q'18 R
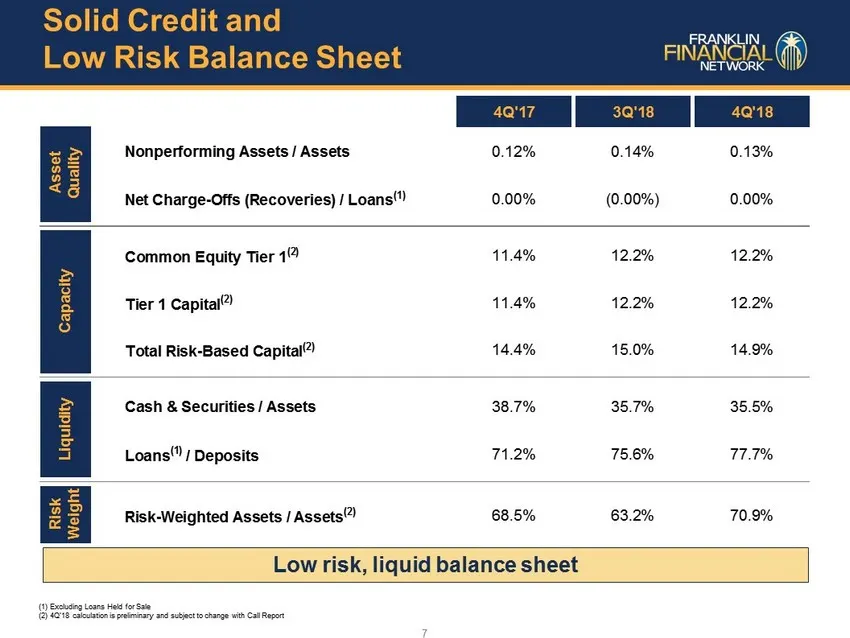
Slide 8: Solid Credit and Low Risk Balance Sheet
(1) Excluding Loans Held for Sale (2) 4Q’18 calculation is preliminary and subject to change with Call Report Low risk, liquid balance sheet 7 Solid Credit and Low Risk Balance Sheet 4Q'17 3Q'18 4Q'18 Nonperforming Assets / Assets 0.12% 0.14% 0.13% Net Charge-Offs (Recoveries) / Loans (1) 0.00% (0.0
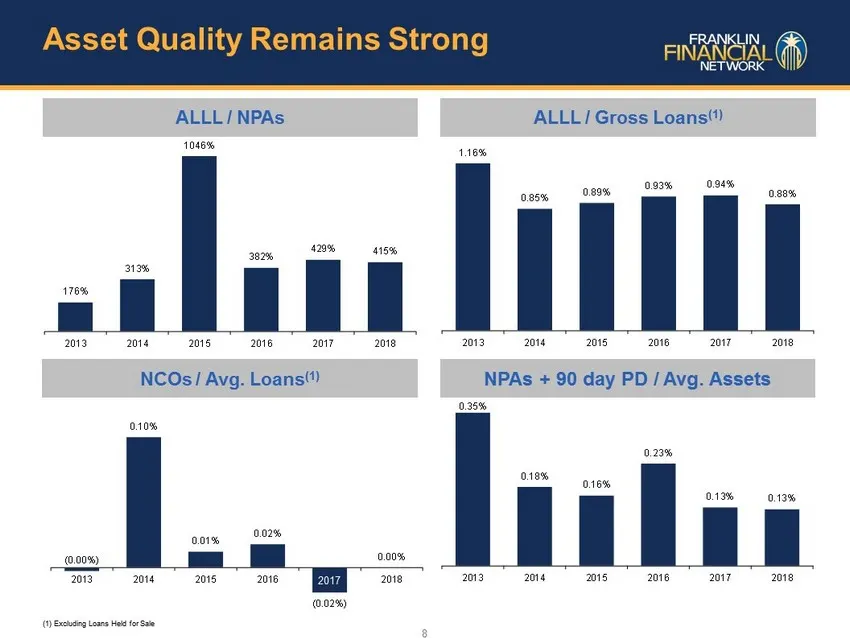
Slide 9: Asset Quality Remains Strong
0.35% 0.18% 0.16% 0.23% 0.13% 0.13% 2013 2014 2015 2016 2017 2018 ALLL / NPAs ALLL / Gross Loans (1) NCOs / Avg. Loans (1) NPAs + 90 day PD / Avg. Assets 176% 313% 1046% 382% 429% 415% 2013 2014 2015 2016 2017 2018 1.16% 0.85% 0.89% 0.93% 0.94% 0.88% 2013 2014 2015 2016 2017 2018 (0.00%) 0.10% 0.01%
Slide 10: Key Drivers of FSB Performance
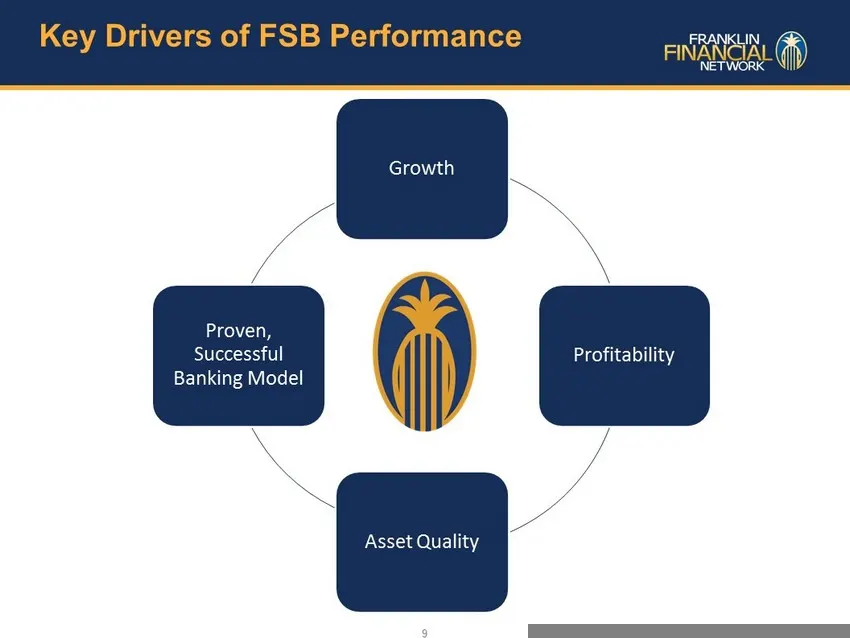
Growth Profitability Asset Quality Proven, Successful Banking Model Key Drivers of FSB Performance 9

Slide 11: Appendix
Appendix
Slide 12: Non-GAAP Reconciliations
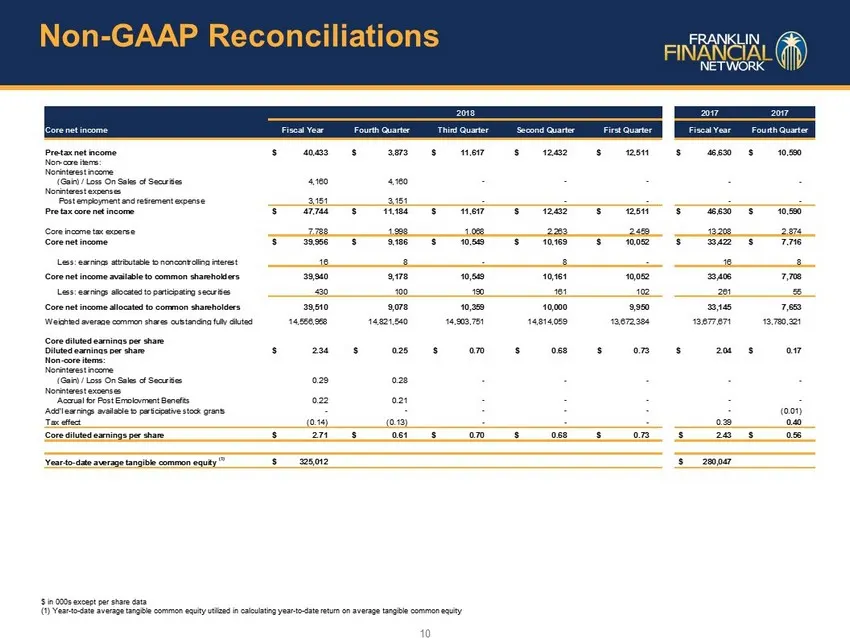
Non - GAAP Reconciliations 10 $ in 000s except per share data (1) Year - to - date average tangible common equity utilized in calculating year - to - date return on average tangible common equity Core net income Fiscal Year Pre-tax net income $ 40,433 $ 3,873 $ 11,617 $ 12,432 $ 12,511 $ 46,630 $ 10
Slide 13: Non-GAAP Reconciliations
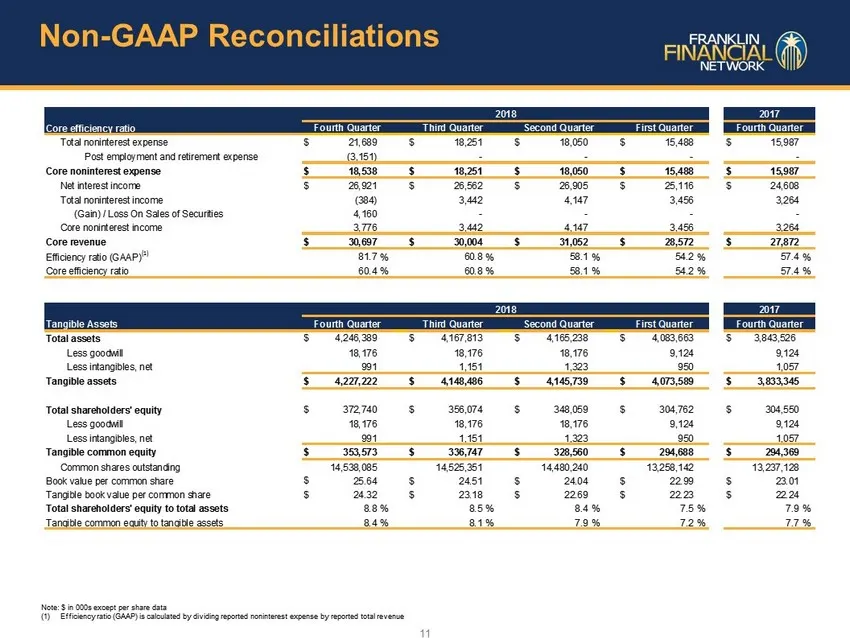
Non - GAAP Reconciliations 11 Note: $ in 000s except per share data (1) Efficiency ratio (GAAP) is calculated by dividing reported noninterest expense by reported total revenue Core efficiency ratio Total noninterest expense $ 21,689 $ 18,251 $ 18,050 $ 15,488 $ 15,987 Post employment and retirement
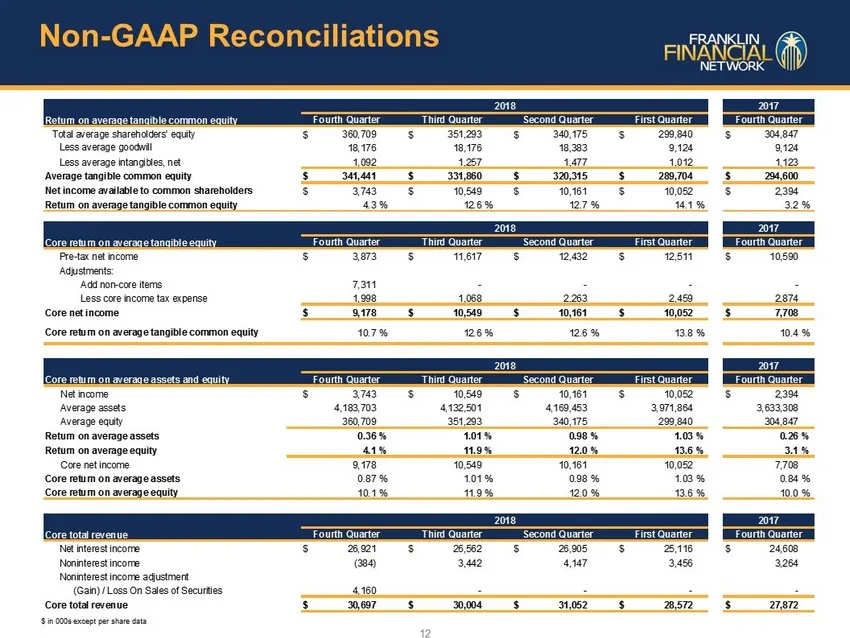
Slide 14: Non-GAAP Reconciliations
Non - GAAP Reconciliations 12 Return on average tangible common equity Total average shareholders' equity $ 360,709 $ 351,293 $ 340,175 $ 299,840 $ 304,847 Less average goodwill 18,176 18,176 18,383 9,124 9,124 Less average intangibles, net 1,092 1,257 1,477 1,012 1,123 Average tangible common equit
Source: SEC EDGAR · 8-K filed Jan 24, 2019
More decks from Franklin Financial Network Inc
 Merger or Acquisition (January 2020)17 slides · Jan 21, 2020
 Q3 2019 Earnings Presentation21 slides · Nov 1, 2019
 Q3 2019 Earnings Presentation15 slides · Oct 23, 2019
 Q2 2019 Earnings Presentation19 slides · Jul 26, 2019
 Q2 2019 Earnings Presentation15 slides · Jul 24, 2019
 Q1 2019 Earnings Presentation19 slides · May 10, 2019