Marubeni Corporation · TSE:8002
Marubeni — Q2 FY2010 Earnings Presentation
22 slides from Marubeni's earnings presentation, Nov 1, 2010
Slide 1: Briefing on Financial Results for the 2nd Quarter of FY2010
Briefing on Financial Results for the 2nd Quarter of FY2010 November 1, 2010 Marubeni Corporation 2010 Awards for Excellence in Corporate Disclosure (The Securities Analysts Association of Japan) Trading Industry No.1
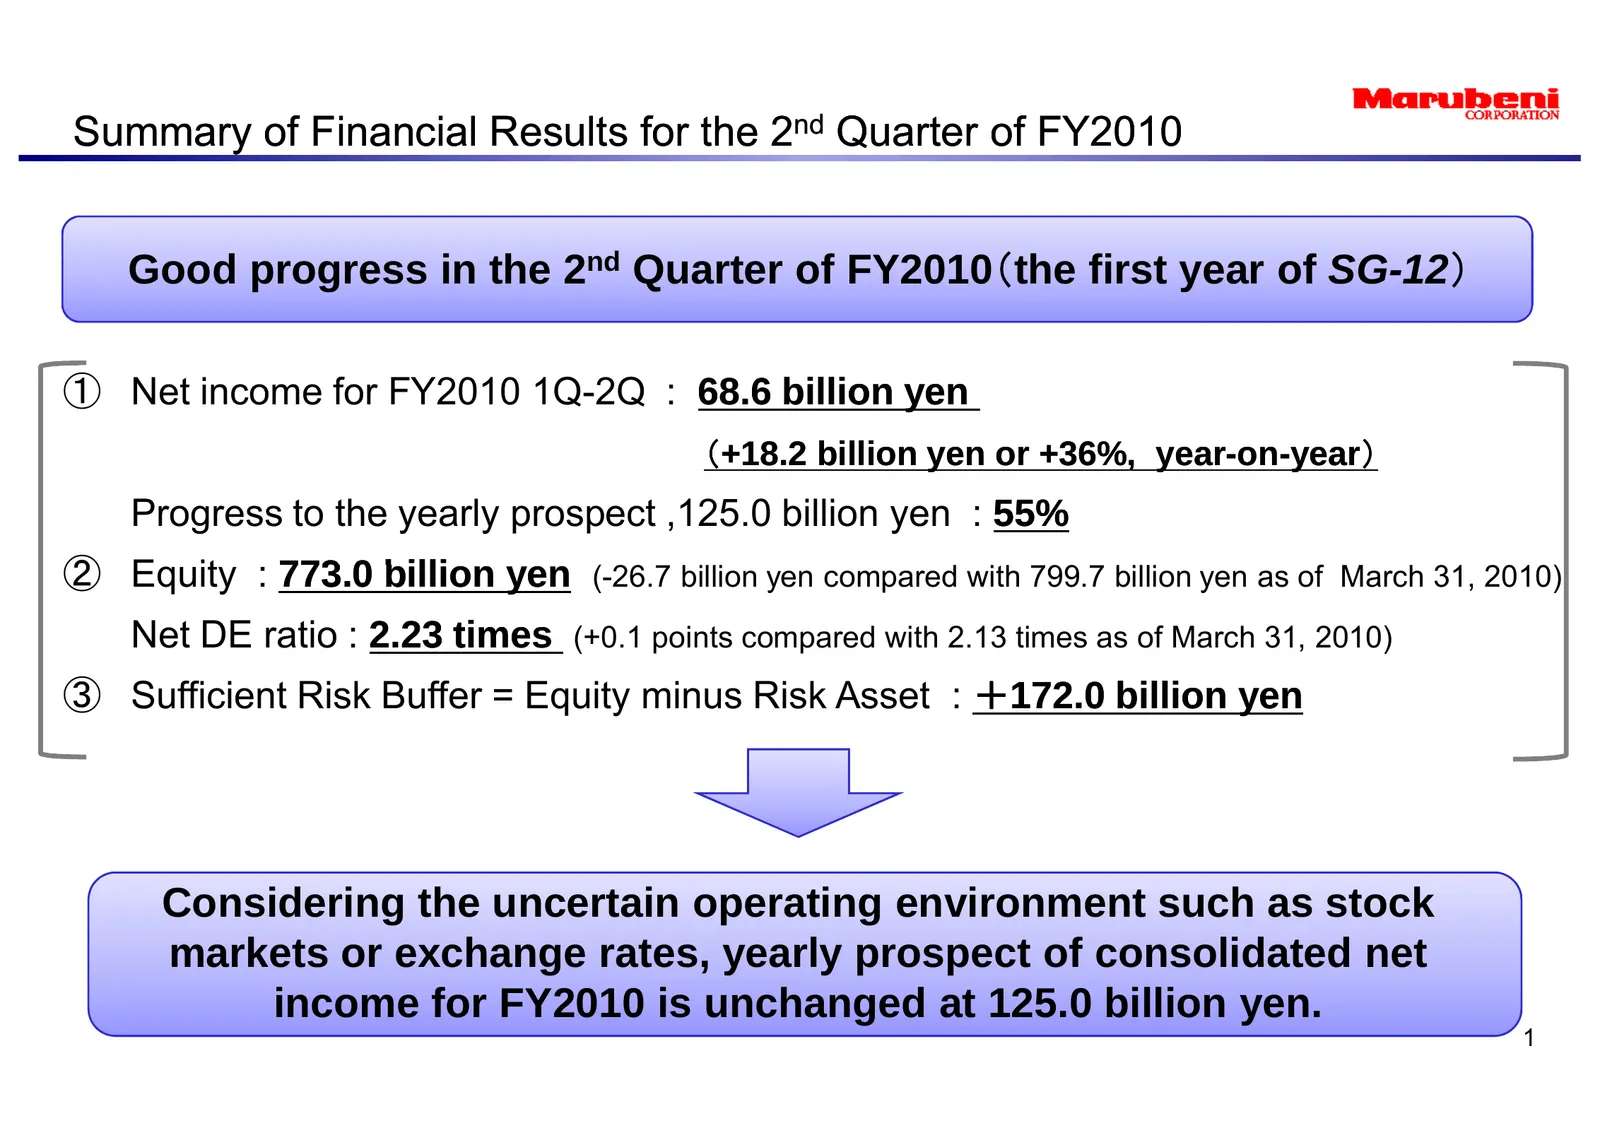
Slide 2: Summary of Financial Results for the 2nd Quarter of FY2010
Summary of Financial Results for the 2nd Quarter of FY2010 Good progress in the 2nd Quarter of FY2010(the first year of SG-12) ① Net income for FY2010 1Q-2Q : 68.6 billion yen (+18.2 billion yen or +36%, year- year-on- year)) on-year Progress to the yearly prospect ,125.0 billion yen : 55% ② Equity
Slide 3: Agenda: Business Environment Analysis
1. Business Environment Analysis 2. Earnings Power and Structure 3. Balance Sheets & Cash Flows 4. Stepping Stones to ‘Sustainable Growth’ 2
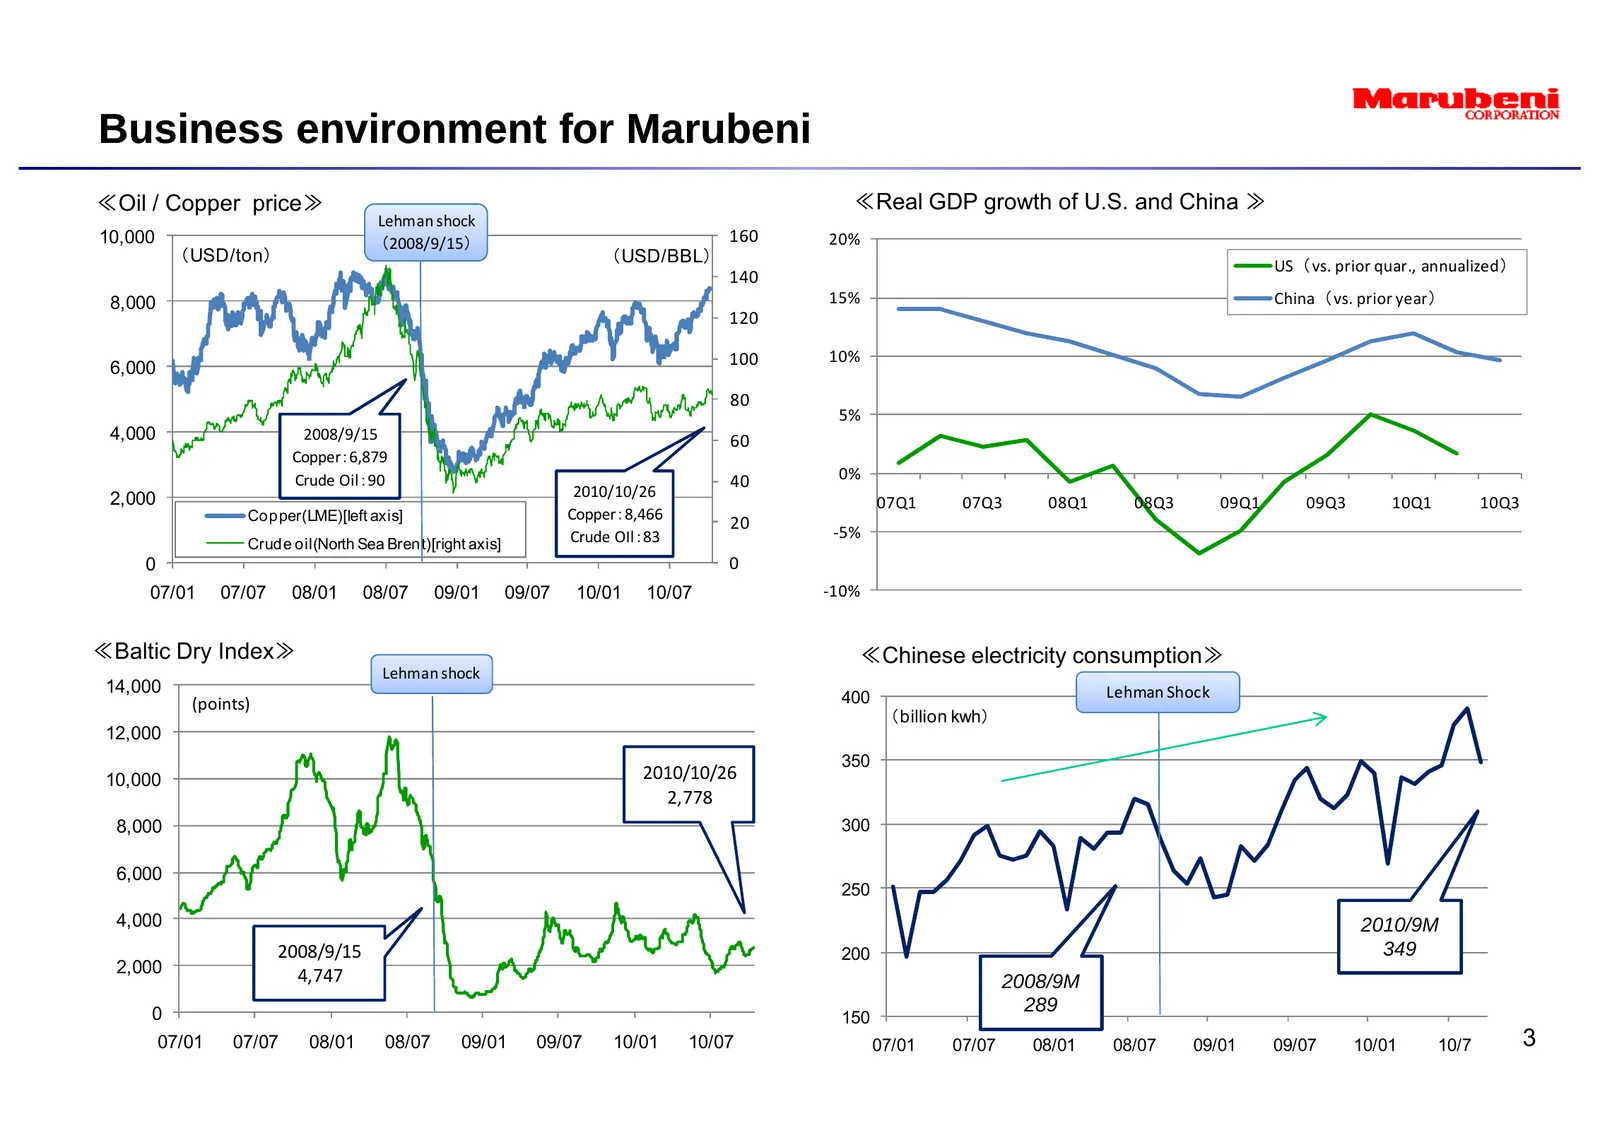
Slide 4: Business environment for Marubeni
Business environment for Marubeni ≪Oil / Copper price≫ ≪Real GDP growth of U.S. and China ≫ Lehman shock 10,000 (2008/9/15) 160 20% (USD/ton) (USD/BBL) US(vs. prior quar., annualized) 140 8,000 15% China(vs. prior year) 120 100 10% 6,000 80 5% 4,000 2008/9/15 60 Copper:6,879 Crude Oil:90 40 0% 2,000
Slide 5: Agenda: Earnings Power and Structure
1. Business Environment Analysis 2. Earnings Power and Structure 3. Balance Sheets & Cash Flows 4. Stepping Stones to ‘Sustainable Growth’ 4
Slide 6: Net Income
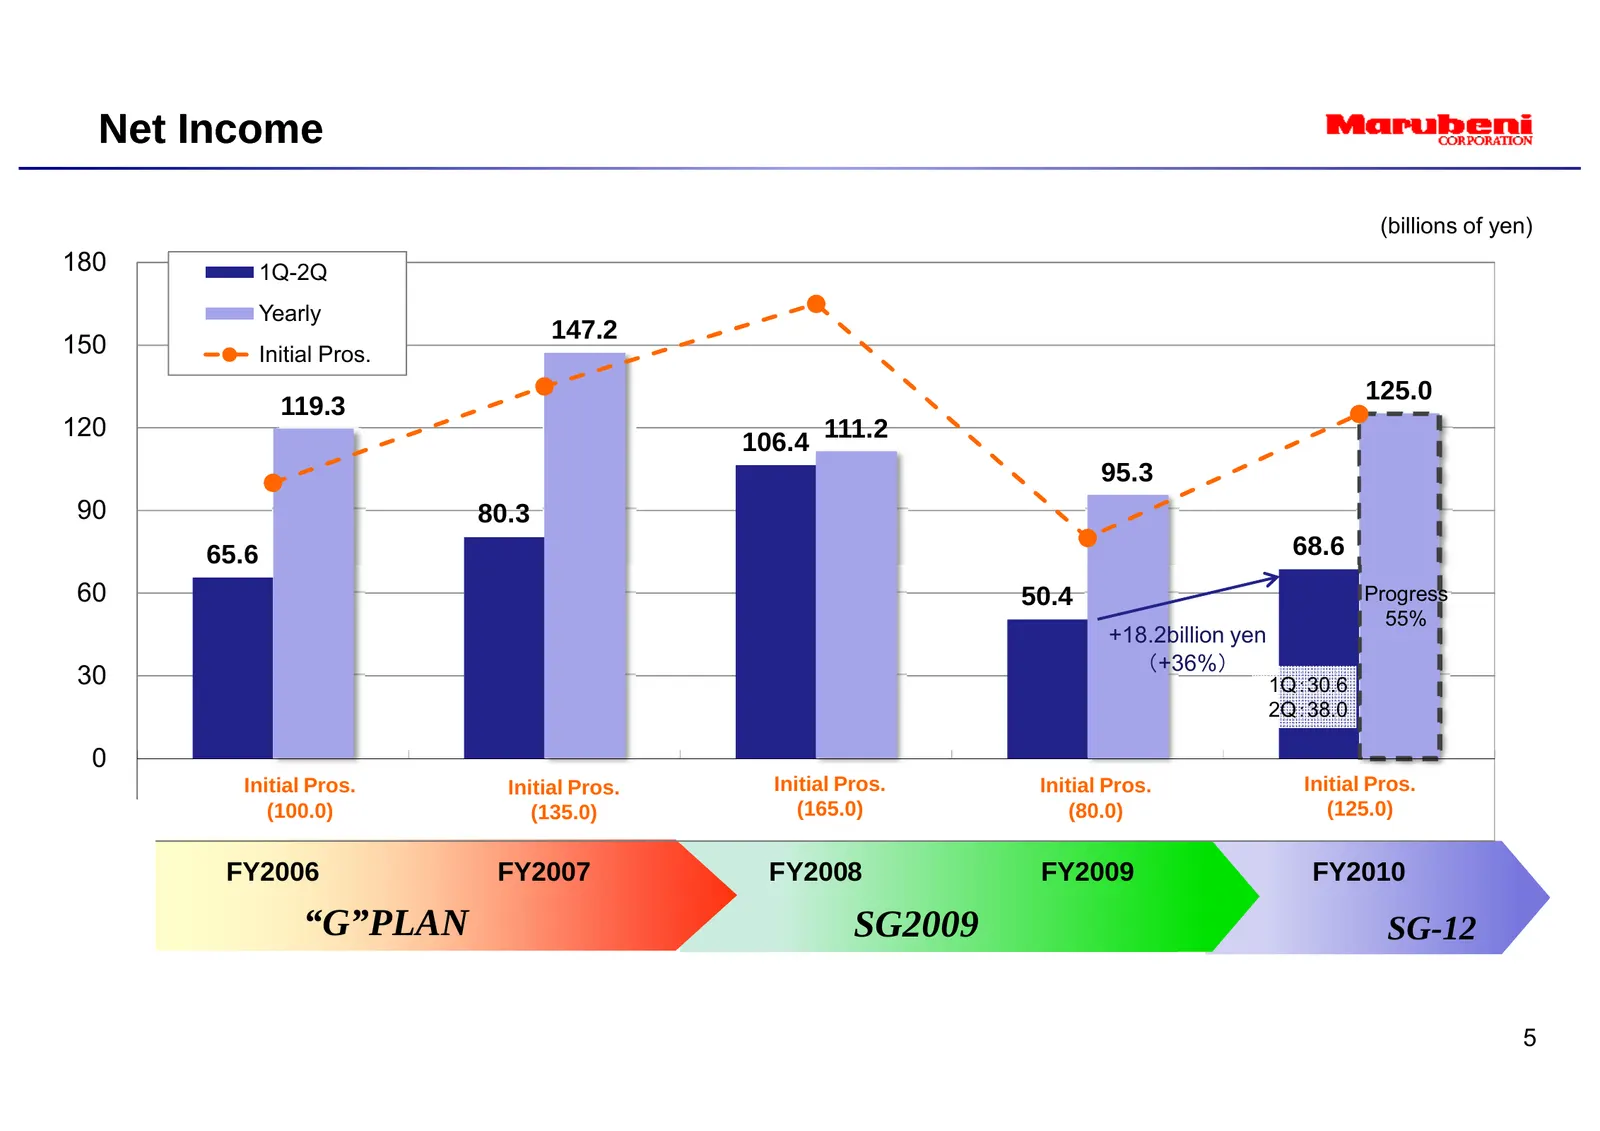
Net Income (billions of yen) 180 1Q-2Q Yearly 147.2 150 Initial Pros. 125.0 119.3 120 106.4 111.2 95.3 90 80.3 65.6 68.6 60 50.4 Progress 55% +18.2billion yen (+36%) 30 1Q:30.6 2Q:38.0 0 Initial Pros. Initial Pros. Initial Pros. Initial Pros. Initial Pros. (100.0) (135.0) (165.0) (80.0) (125.0) -30
Slide 7: Adjusted Operating Profit & Core Earnings
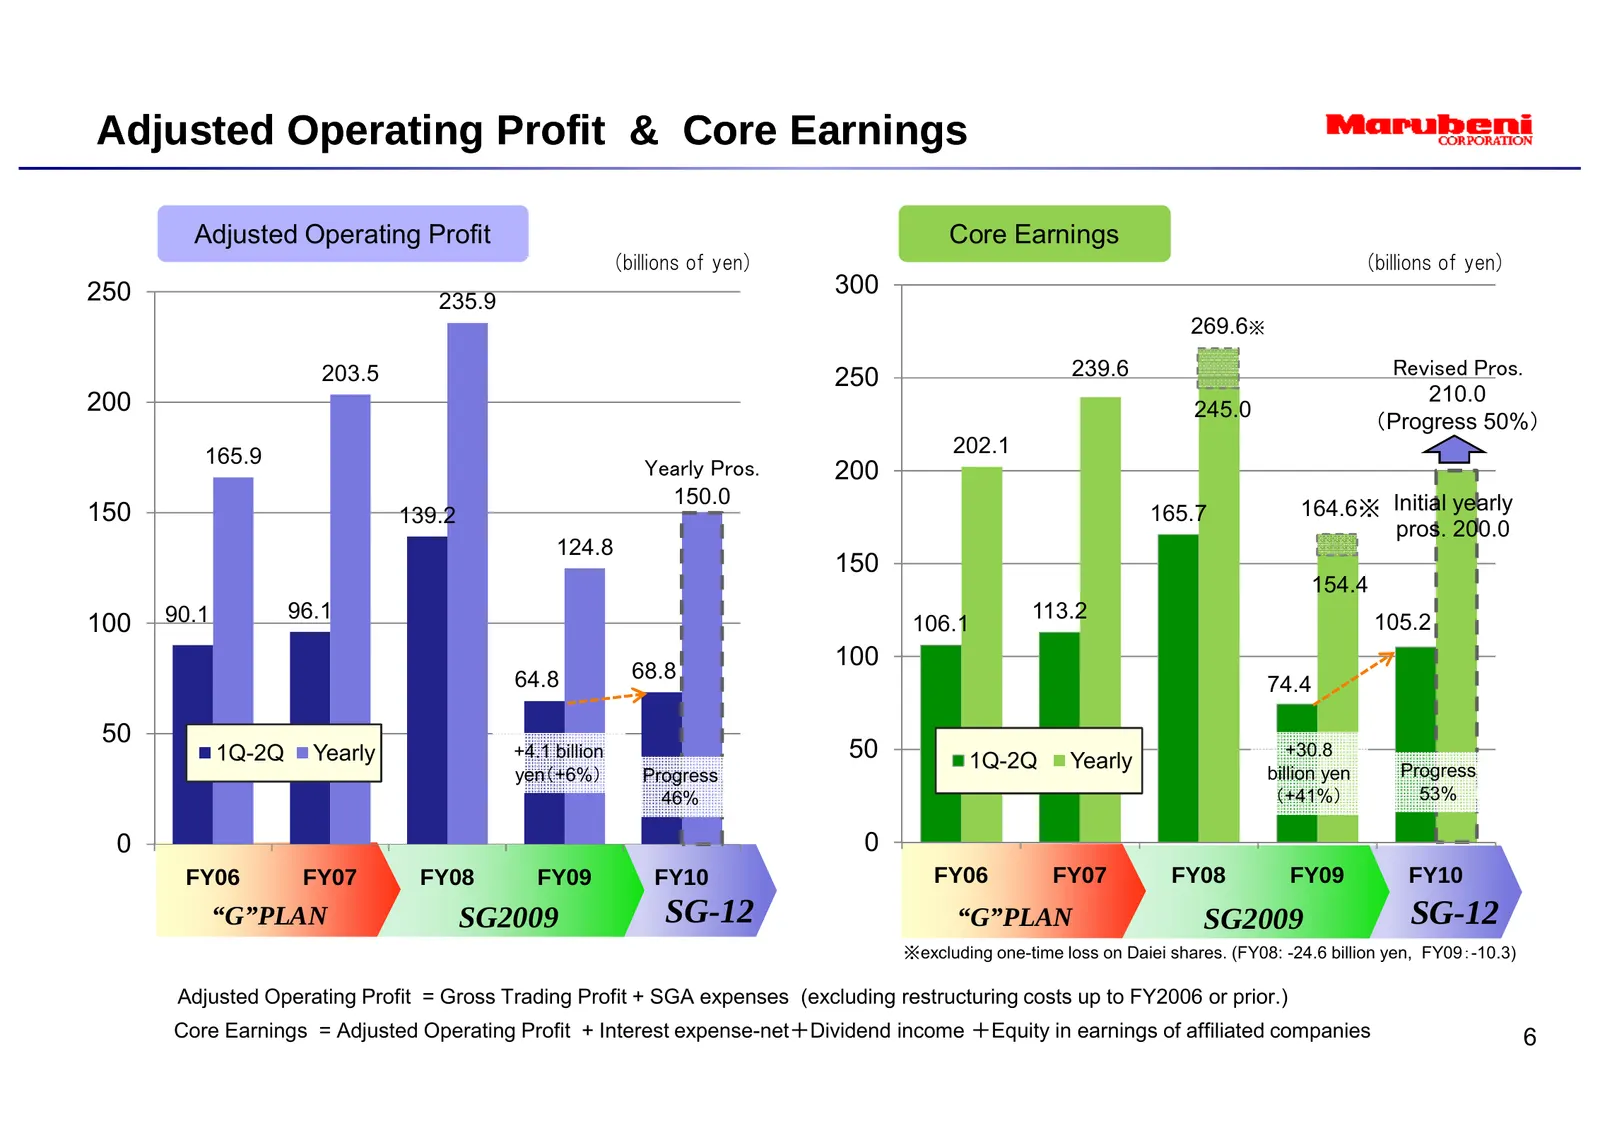
Adjusted Operating Profit & Core Earnings Adjusted Operating Profit Core Earnings (billions of yen) (billions of yen) 250 300 235.9 269.6※ 203.5 250 239.6 Revised Pros. 200 210.0 245.0 (Progress 50%) 165.9 202.1 Yearly Pros. 200 150.0 150 139.2 165.7 164.6※ Initial yearly pros. 200.0 124.8 150 154.4
Slide 8: Resources Ratio in Net Income
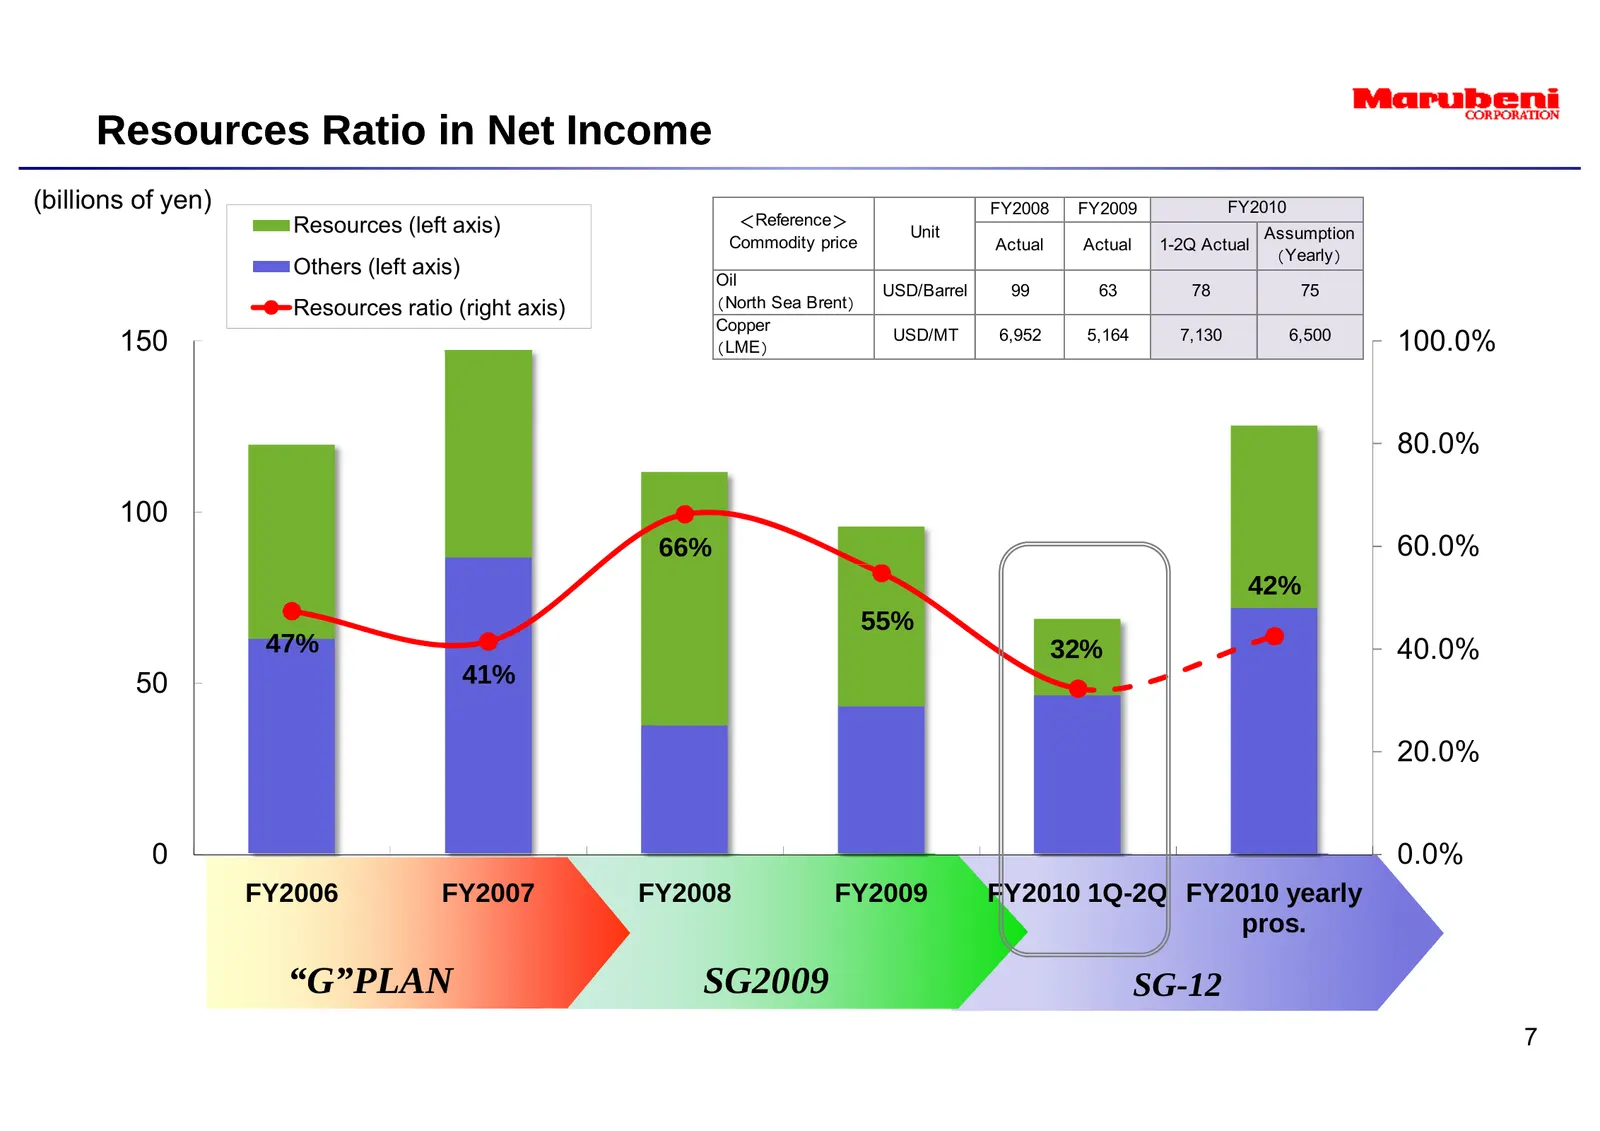
Resources Ratio in Net Income (billions of yen) FY2008 FY2009 FY2010 Resources (left axis) <Reference> Unit Assumption Commodity price Actual Actual 1-2Q Actual ( Yearly ) Others (left axis) Oil USD/Barrel 99 63 78 75 Resources ratio (right axis) ( North Sea Brent ) Copper 150 ( LME) USD/MT 6,952 5,
Slide 9: Earnings Structure & Business Portfolio
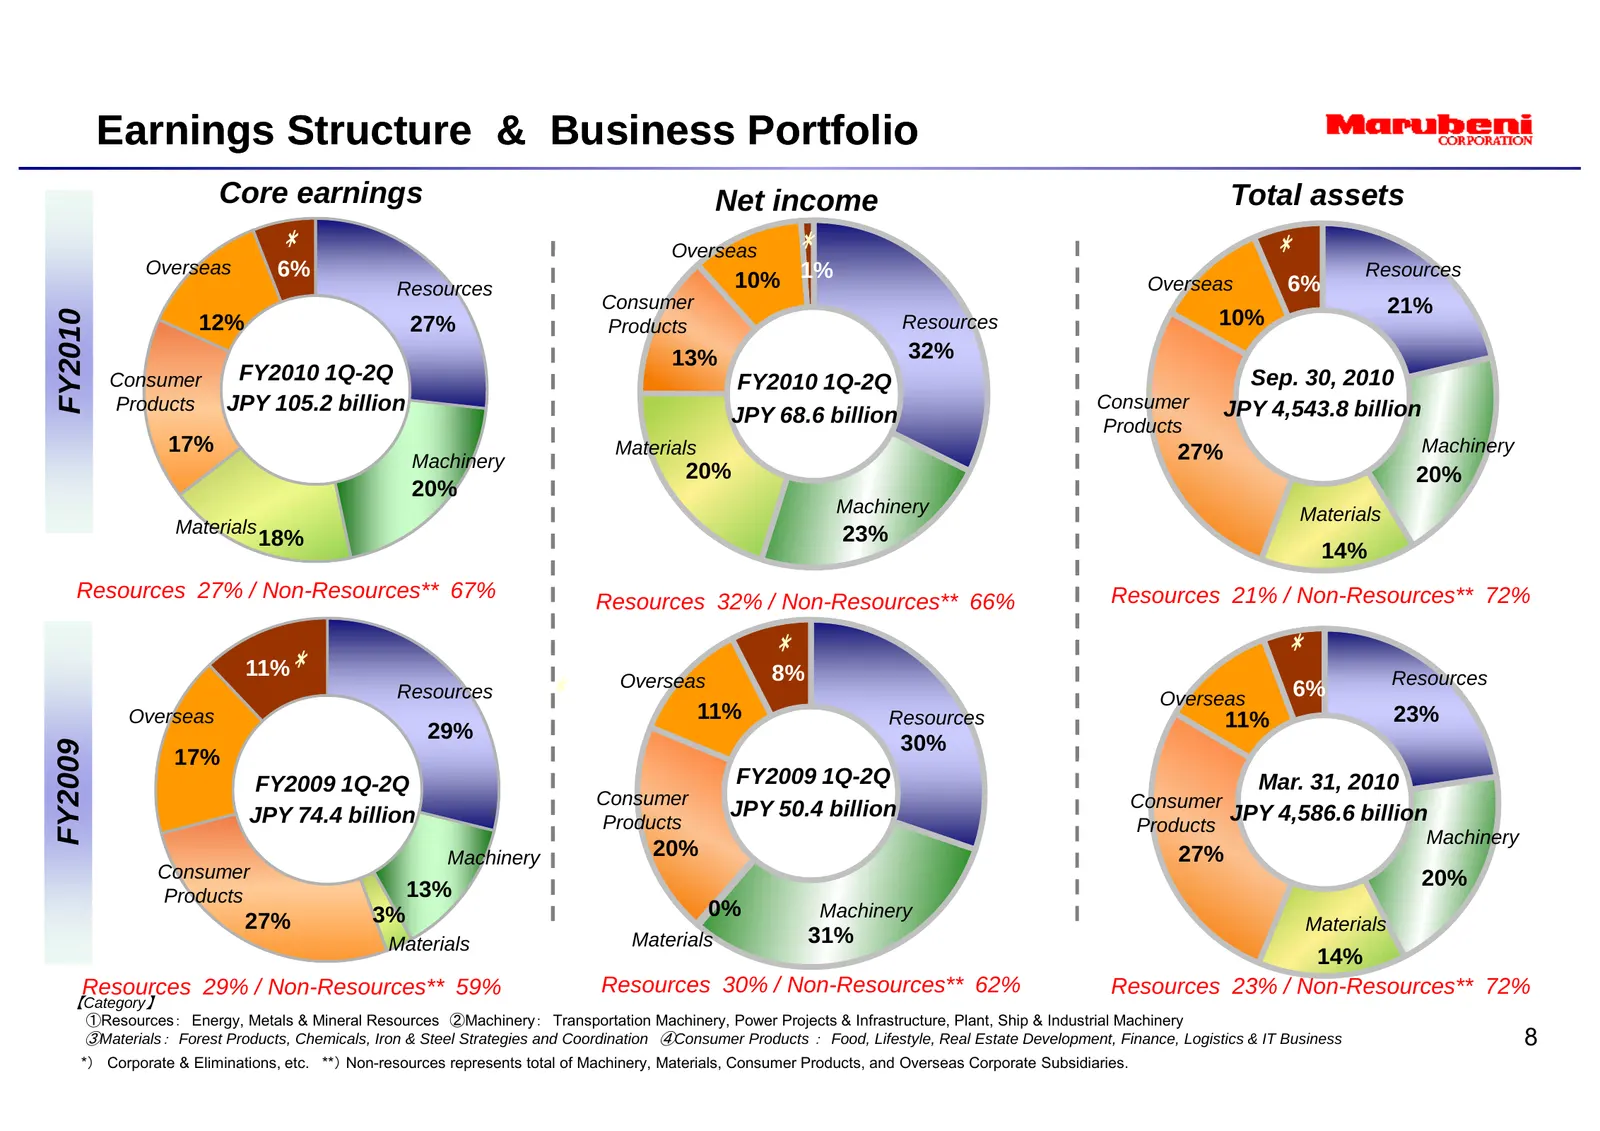
Earnings Structure & Business Portfolio Core earnings Net income Total assets * Overseas * * Overseas 6% 10% 1% Resources Resources Overseas 6% Consumer 21% FY2010 12% 27% Products Resources 10% 13% 32% Consumer FY2010 1Q-2Q FY2010 1Q-2Q Sep. 30, 2010 Products JPY 105.2 billion Consumer JPY 4,543.8
Slide 10: Agenda: Balance Sheets & Cash Flows
1. Business Environment Analysis 2. Earnings Power and Structure 3. Balance Sheets & Cash Flows 4. Stepping Stones to ‘Sustainable Growth’ 9
Slide 11: Equity and Net D/E Ratio
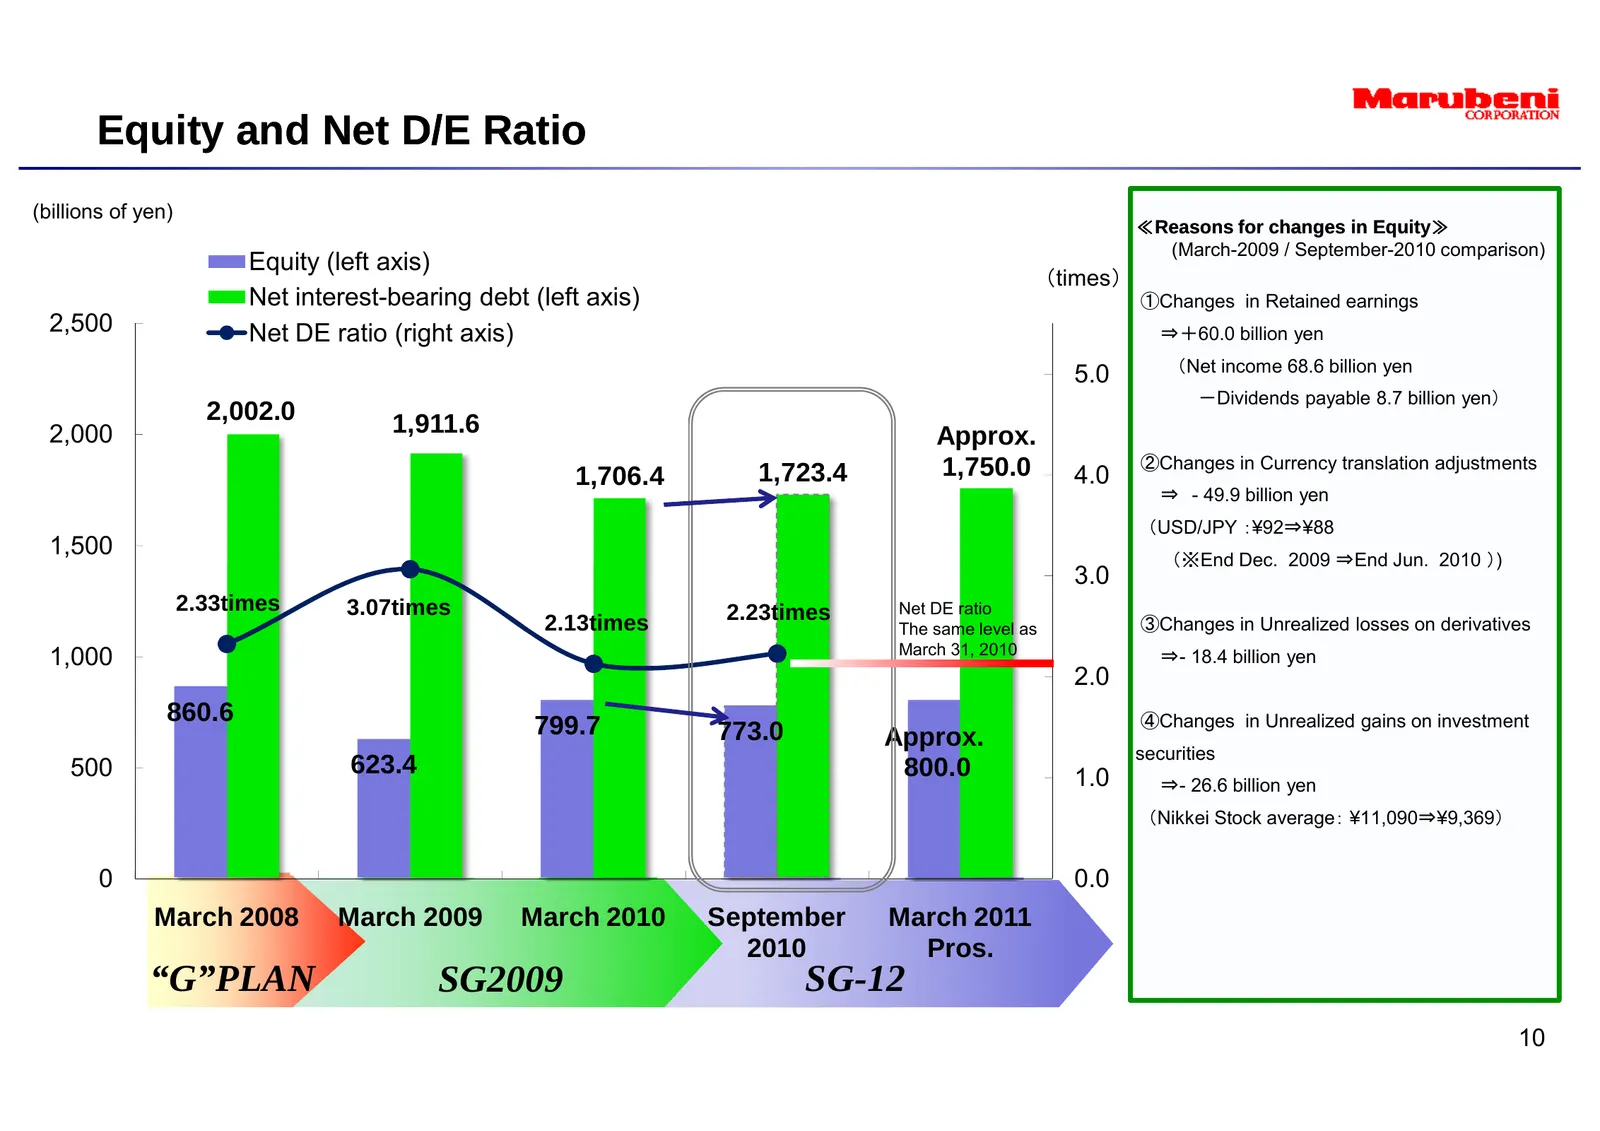
Equity and Net D/E Ratio (billions of yen) ≪Reasons for changes in Equity≫ Equity≫ (March-2009 / September-2010 comparison) Equity (left axis) (times) Net interest-bearing debt (left axis) ①Changes in Retained earnings 2,500 Net DE ratio (right axis) ⇒+60.0 billion yen (Net income 68.6 billion yen 5
Slide 12: Equity and Net Risk Assets
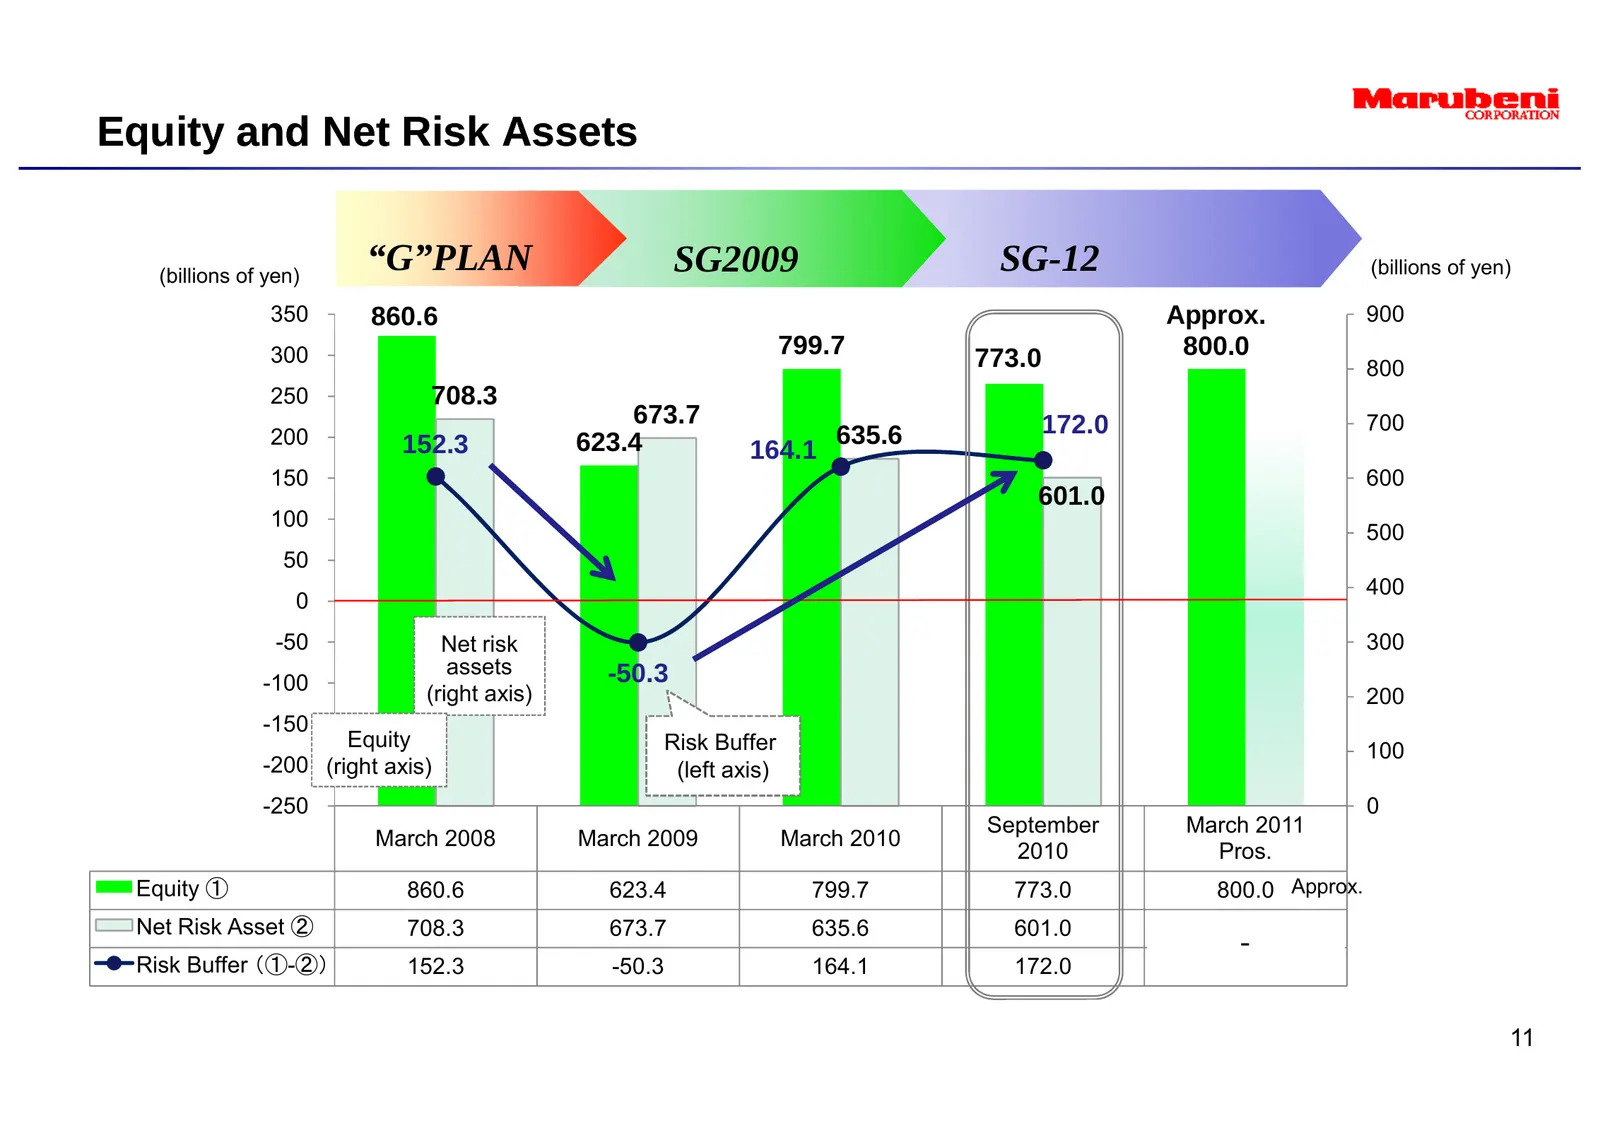
Equity and Net Risk Assets (billions of yen) “G”PLAN SG2009 SG-12 (billions of yen) 350 860.6 Approx. 900 300 799.7 773.0 800.0 800 250 708.3 673.7 172.0 700 200 152.3 623.4 635.6 164.1 150 600 601.0 100 500 50 400 0 -50 Net risk 300 assets -50.3 -100 (right axis) 200 -150 Equity Risk Buffer 100 -20
Slide 13: Cash Flows
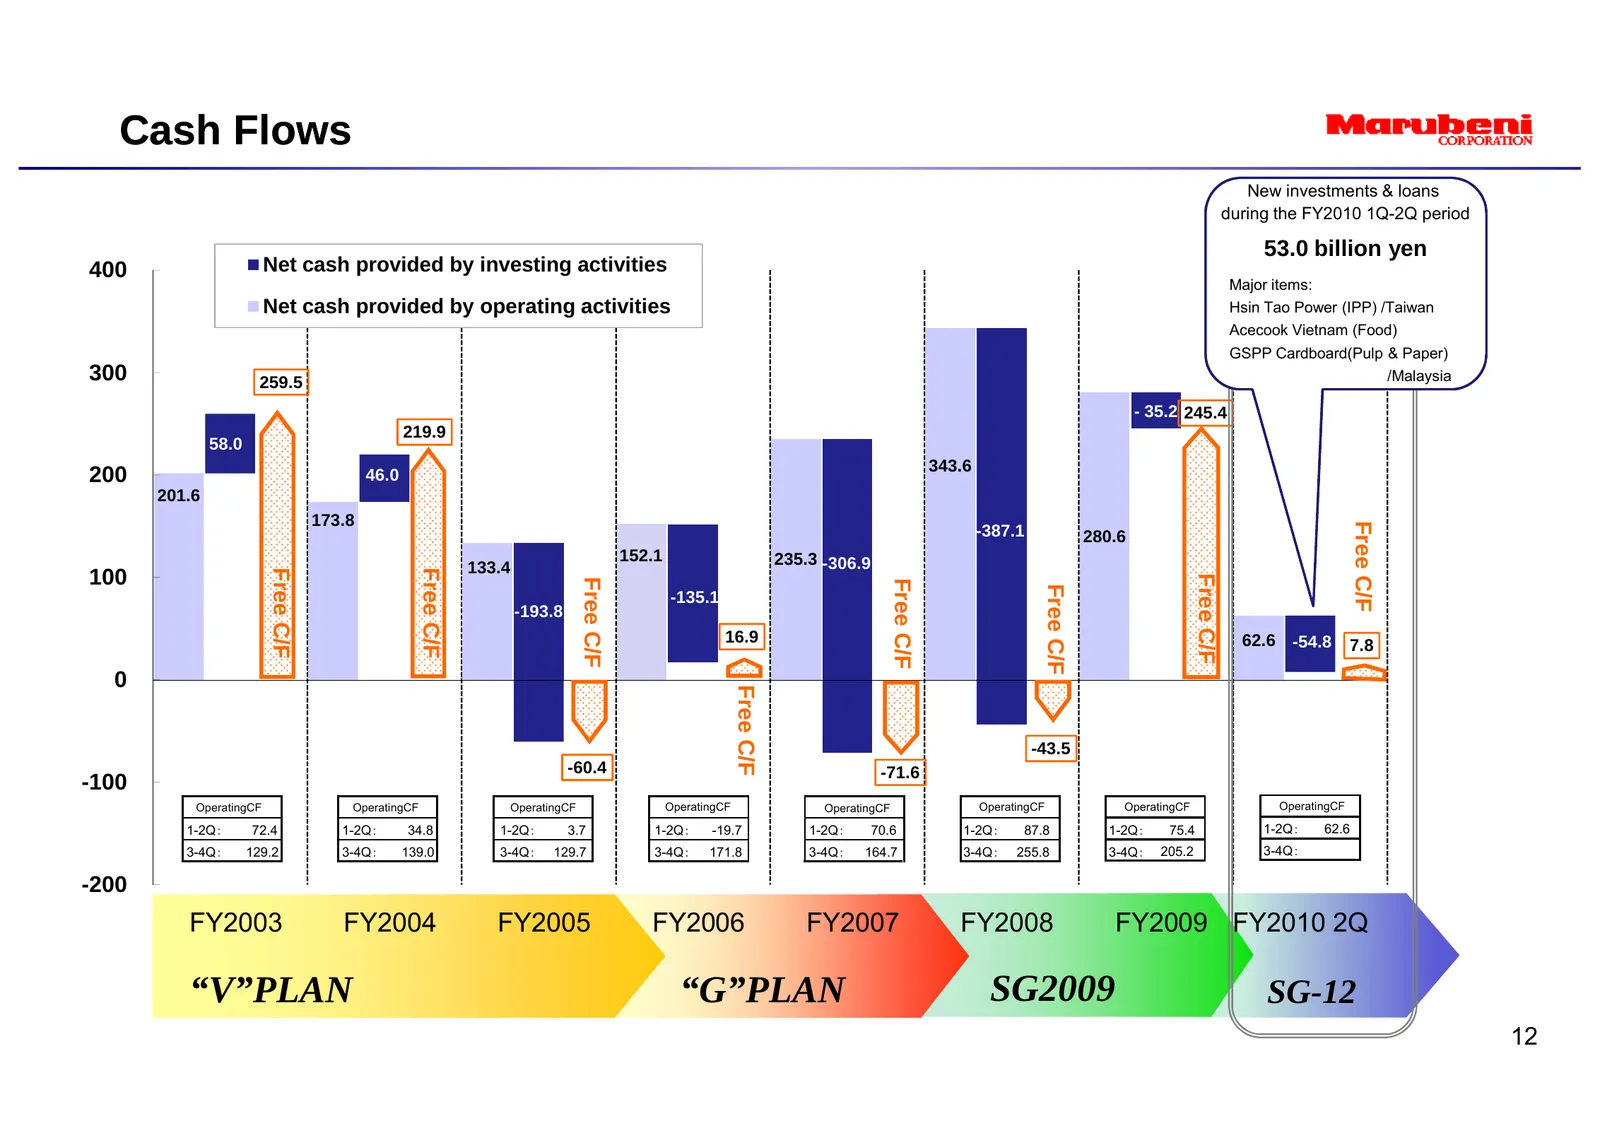
Cash Flows New investments & loans during the FY2010 1Q-2Q period 53.0 billion yen 400 Net cash provided by investing activities Major items: Net cash provided by operating activities Hsin Tao Power (IPP) /Taiwan Acecook Vietnam (Food) GSPP Cardboard(Pulp & Paper) 300 259.5 /Malaysia - 35.2 245.4 21
Slide 14: Agenda: Stepping Stones to Sustainable Growth
1. Business Environment Analysis 2. Earnings Power and Structure 3. Balance Sheets & Cash Flows 4. Stepping Stones to ‘Sustainable Growth’ 13
Slide 15: Major Projects: Metals & Mineral Resources
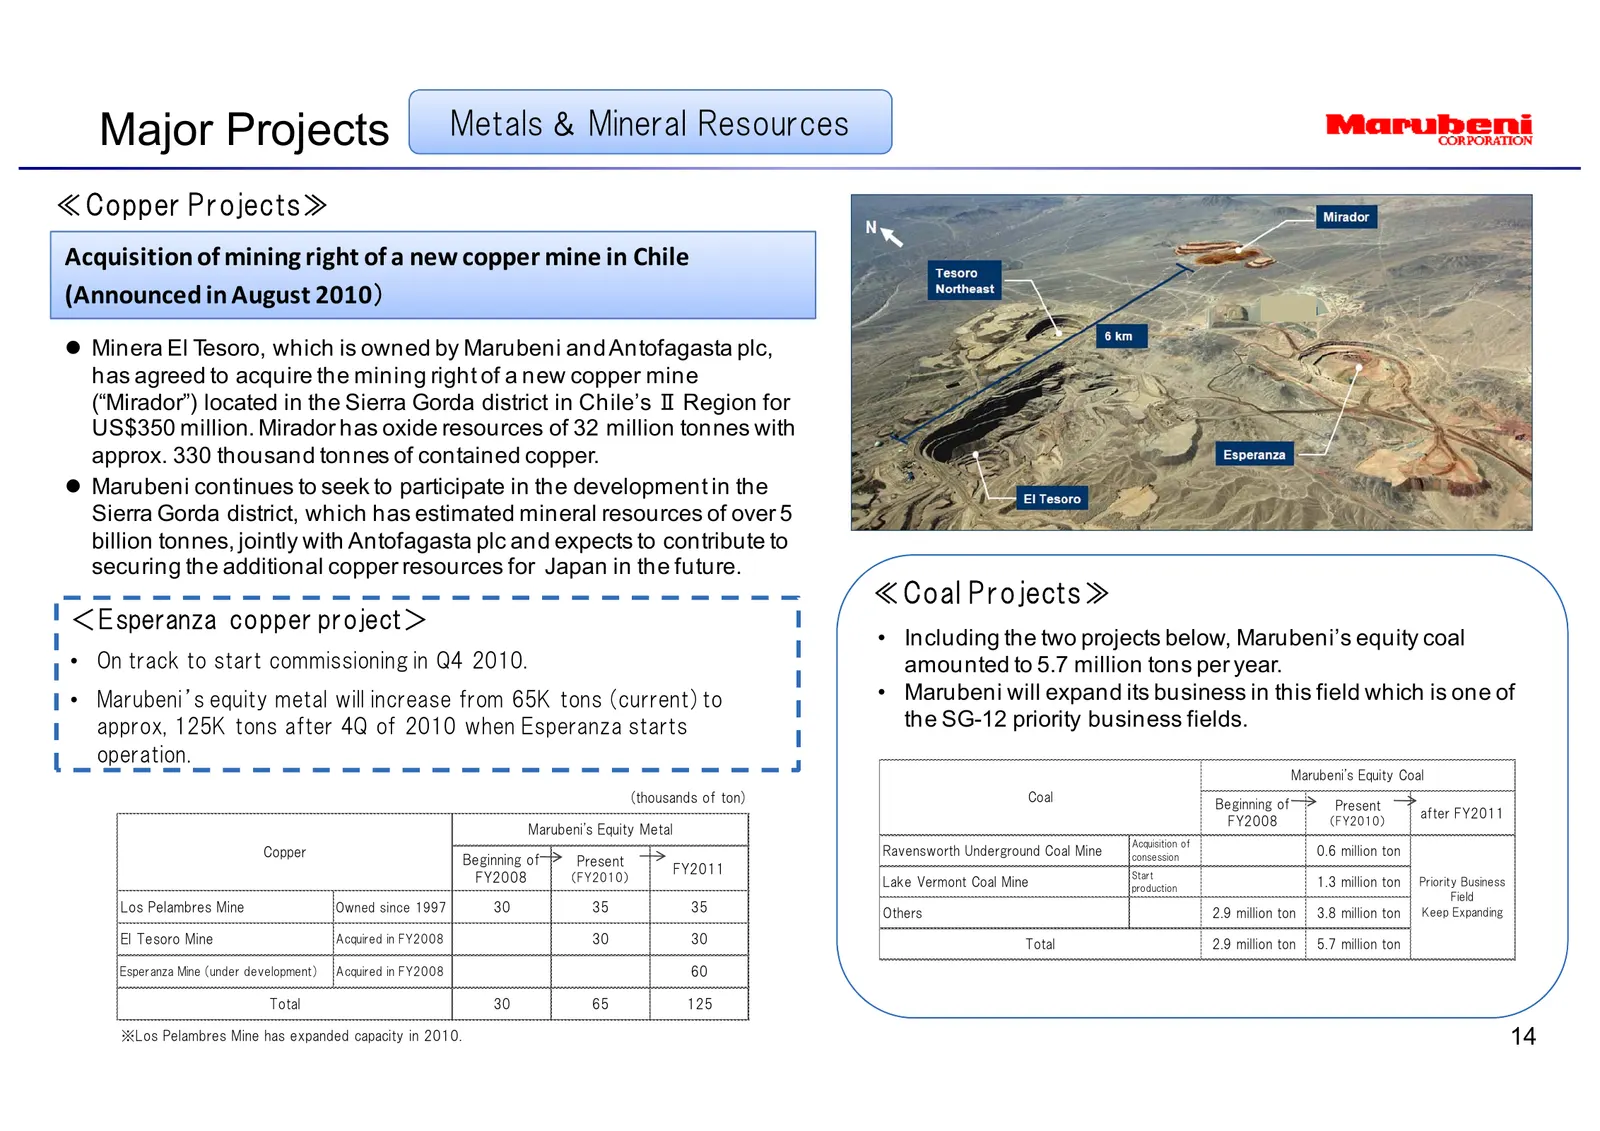
Major Projects Metals & Mineral Resources ≪Copper Projects≫ Acquisition of mining right of a new copper mine in Chile (Announced in August 2010) z Minera El Tesoro, which is owned by Marubeni and Antofagasta plc, has agreed to acquire the mining right of a new copper mine (“Mirador”) located in the
Slide 16: Major Projects: Oil & Gas
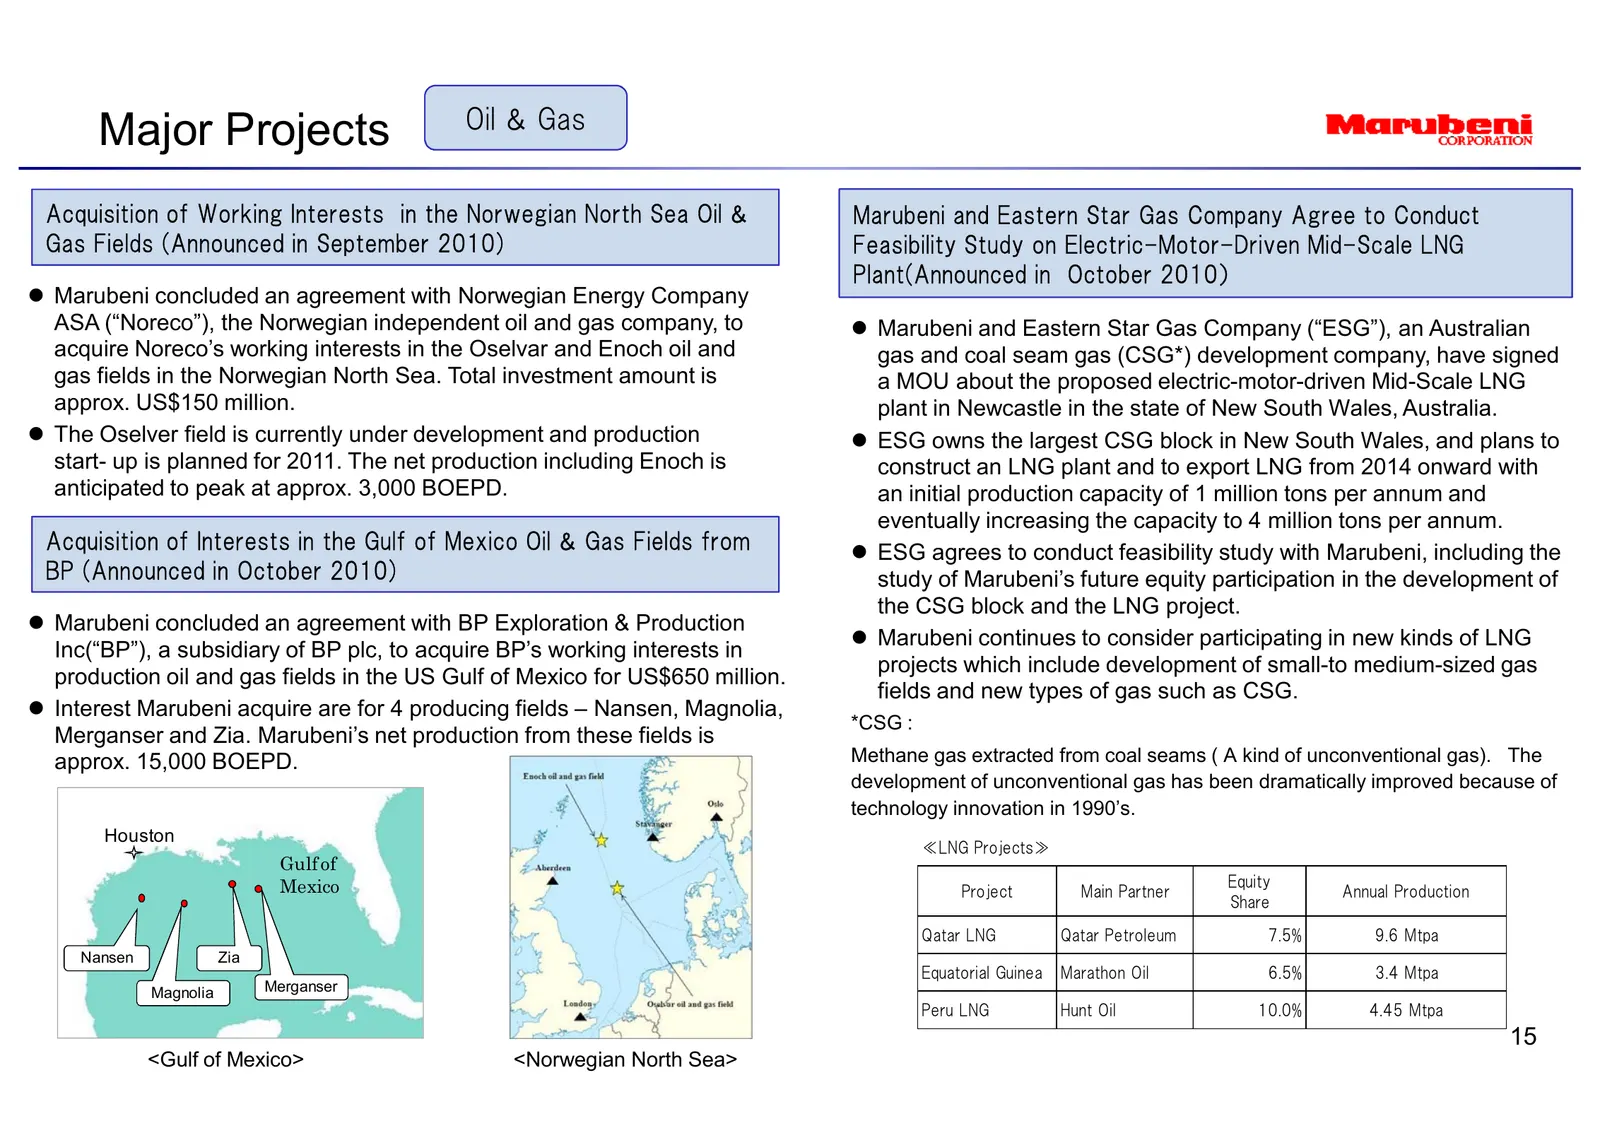
Major Projects Oil & Gas Acquisition of Working Interests in the Norwegian North Sea Oil & Marubeni and Eastern Star Gas Company Agree to Conduct Gas Fields (Announced in September 2010) Feasibility Study on Electric-Motor-Driven Mid-Scale LNG Plant(Announced in October 2010) z Marubeni concluded an
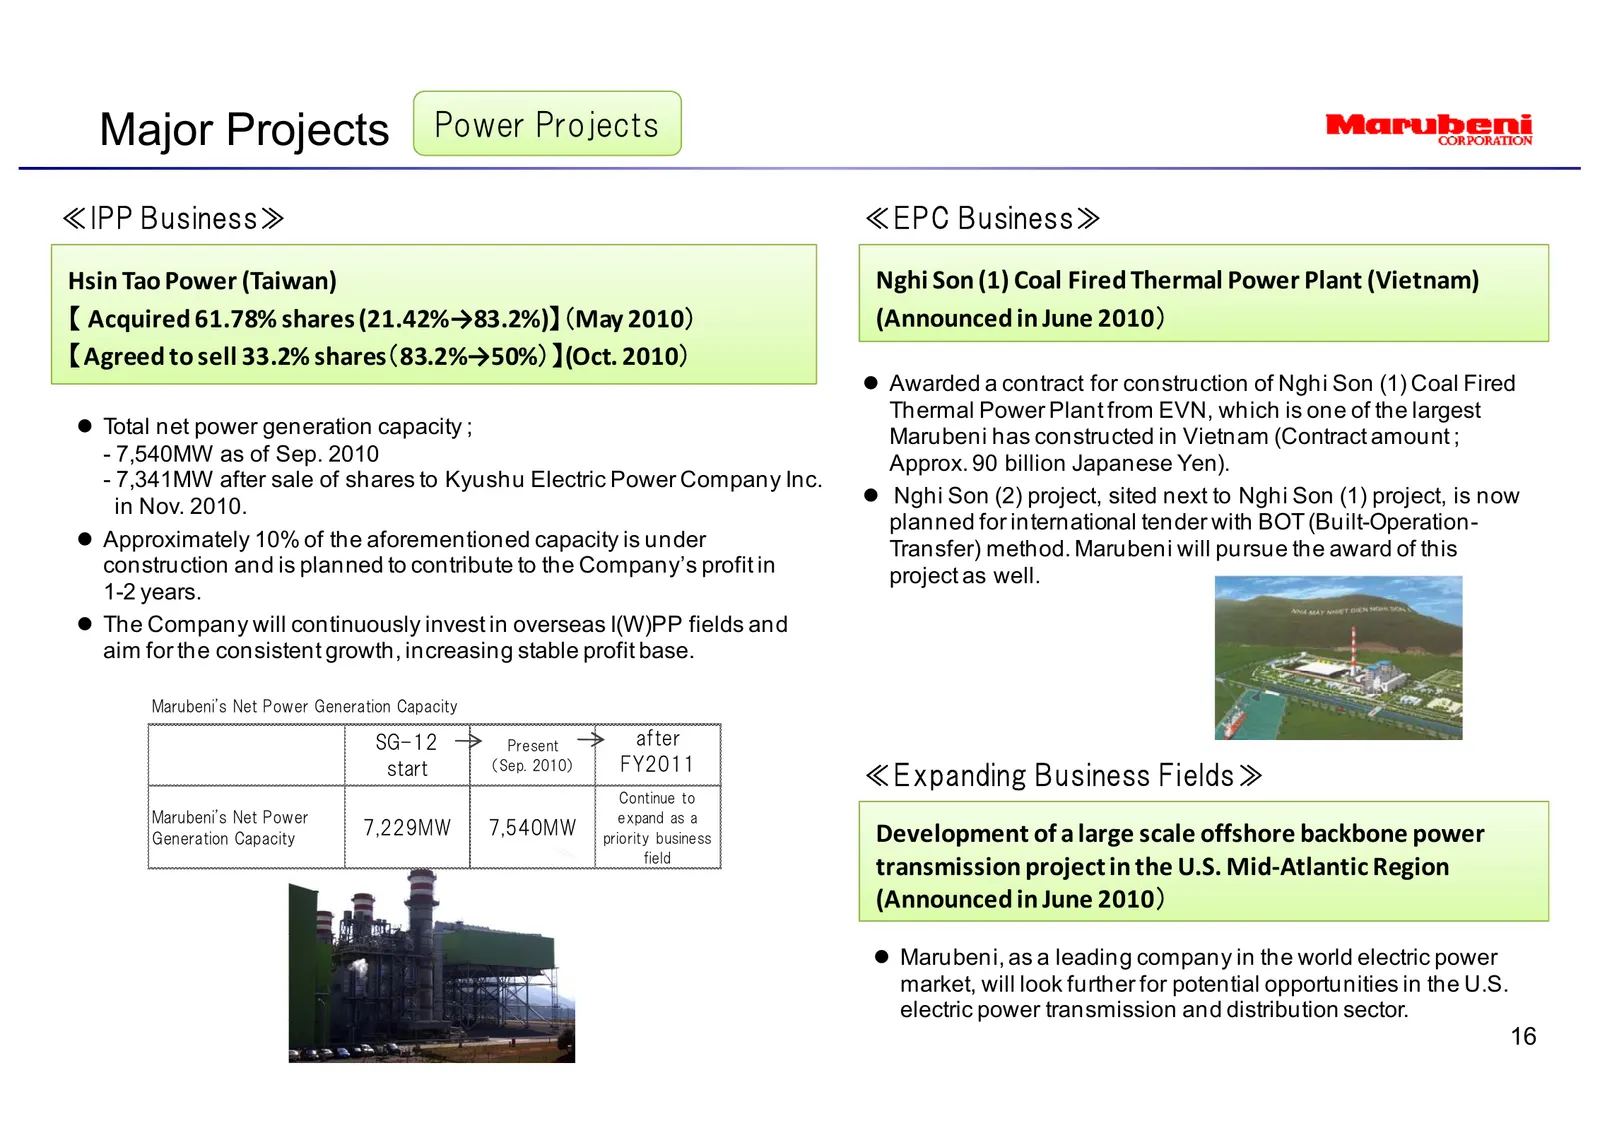
Slide 17: Major Projects: Power Projects
Major Projects Power Projects ≪IPP Business≫ ≪EPC Business≫ Hsin Tao Power (Taiwan) Nghi Son (1) Coal Fired Thermal Power Plant (Vietnam) 【 Acquired 61.78% shares (21.42%→83.2%)】(May 2010) (Announced in June 2010) 【Agreed to sell 33.2% shares(83.2%→50%)】(Oct. 2010) z Awarded a contract for construct
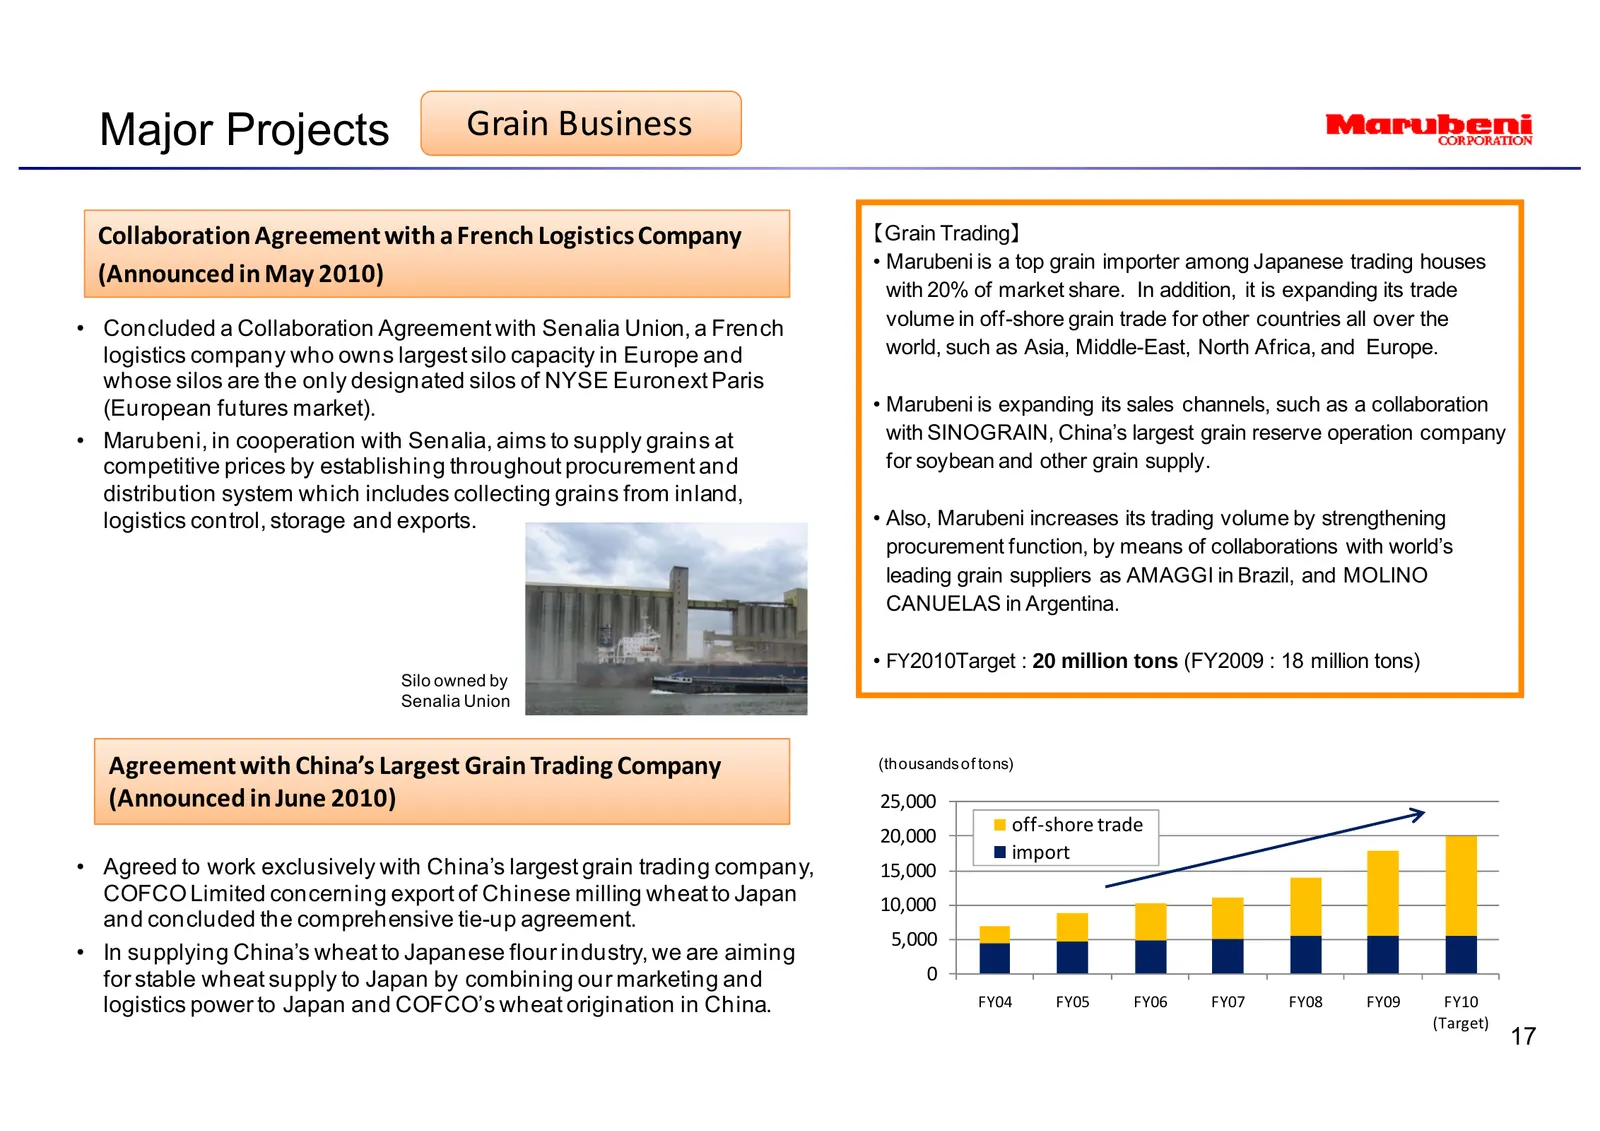
Slide 18: Major Projects: Grain Business
Major Projects Grain Business Collaboration Agreement with a French Logistics Company 【Grain Trading】 • Marubeni is a top grain importer among Japanese trading houses (Announced in May 2010) with 20% of market share. In addition, it is expanding its trade • Concluded a Collaboration Agreement with S
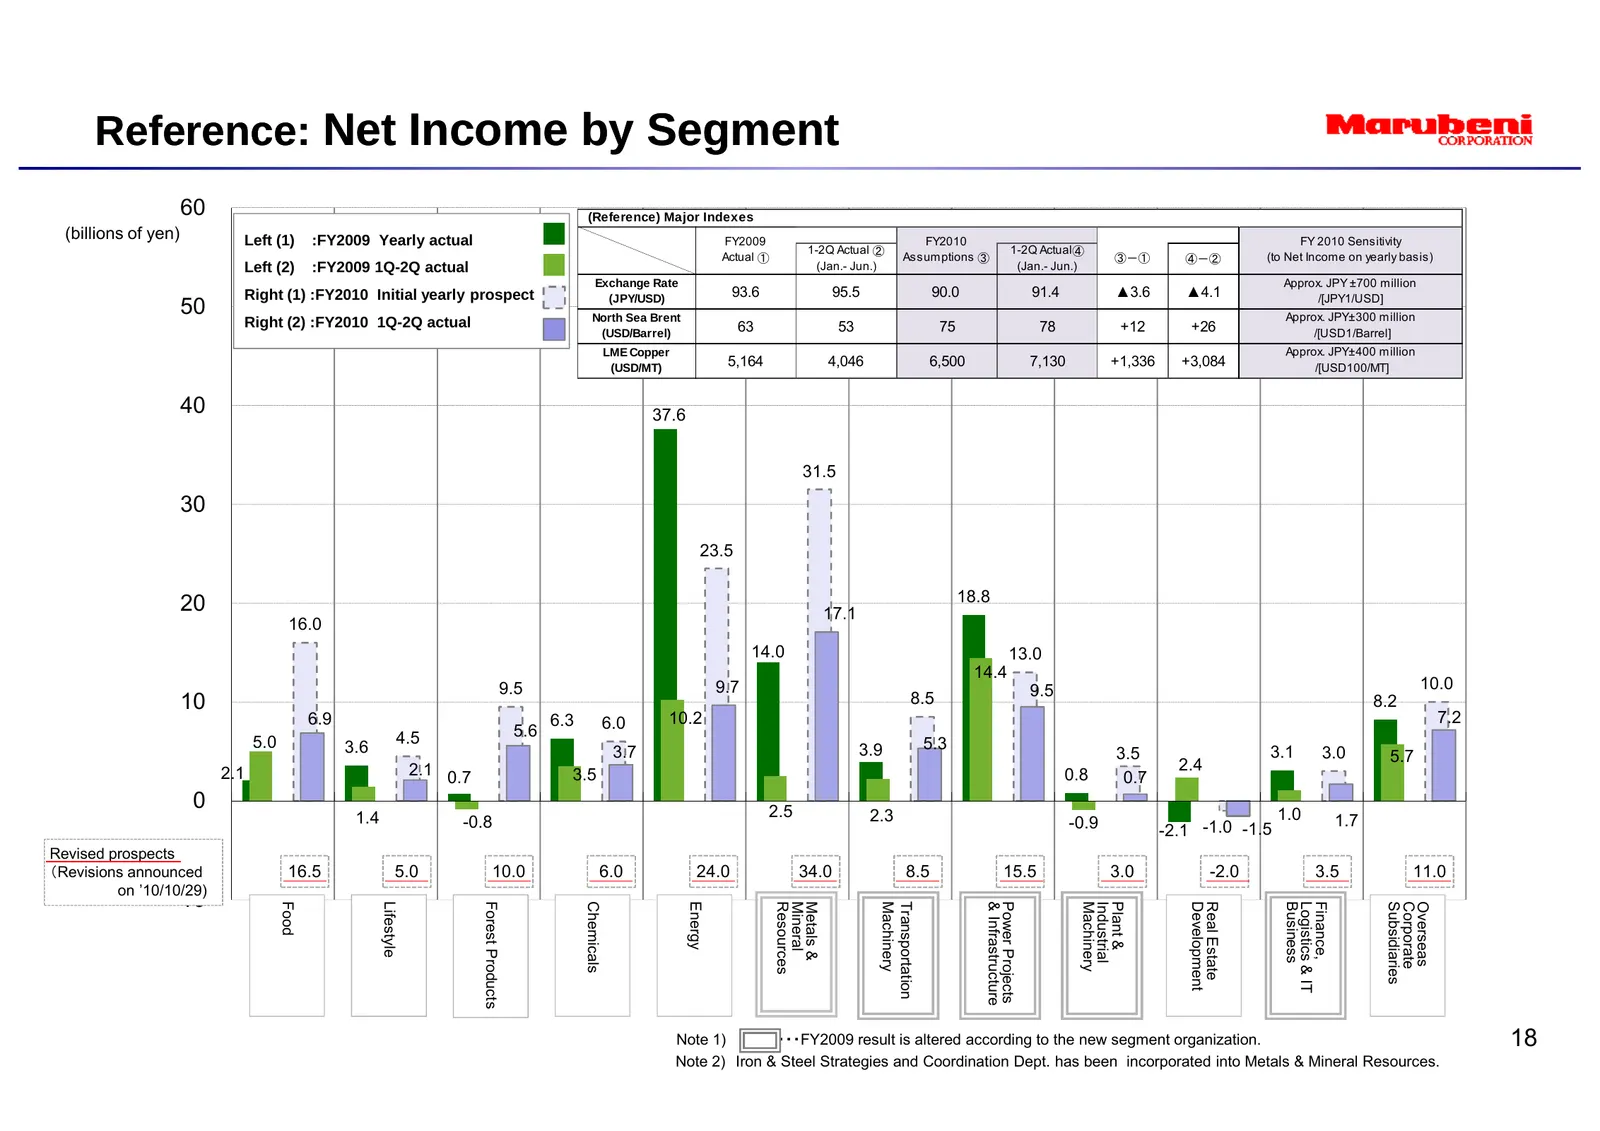
Slide 19: Reference: Net Income by Segment and Major Indexes
Reference: Net Income by Segment 60 (Reference) Major Indexes (billions of yen) Left (1) :FY2009 Yearly actual FY2009 FY2010 FY 2010 Sensitivity 1-2Q Actual ② 1-2Q Actual④ Actual ① Assumptions ③ ③-① ④-② (to Net Income on yearly basis) Left (2) :FY2009 1Q-2Q actual (Jan.- Jun.) (Jan.- Jun.) Exchange
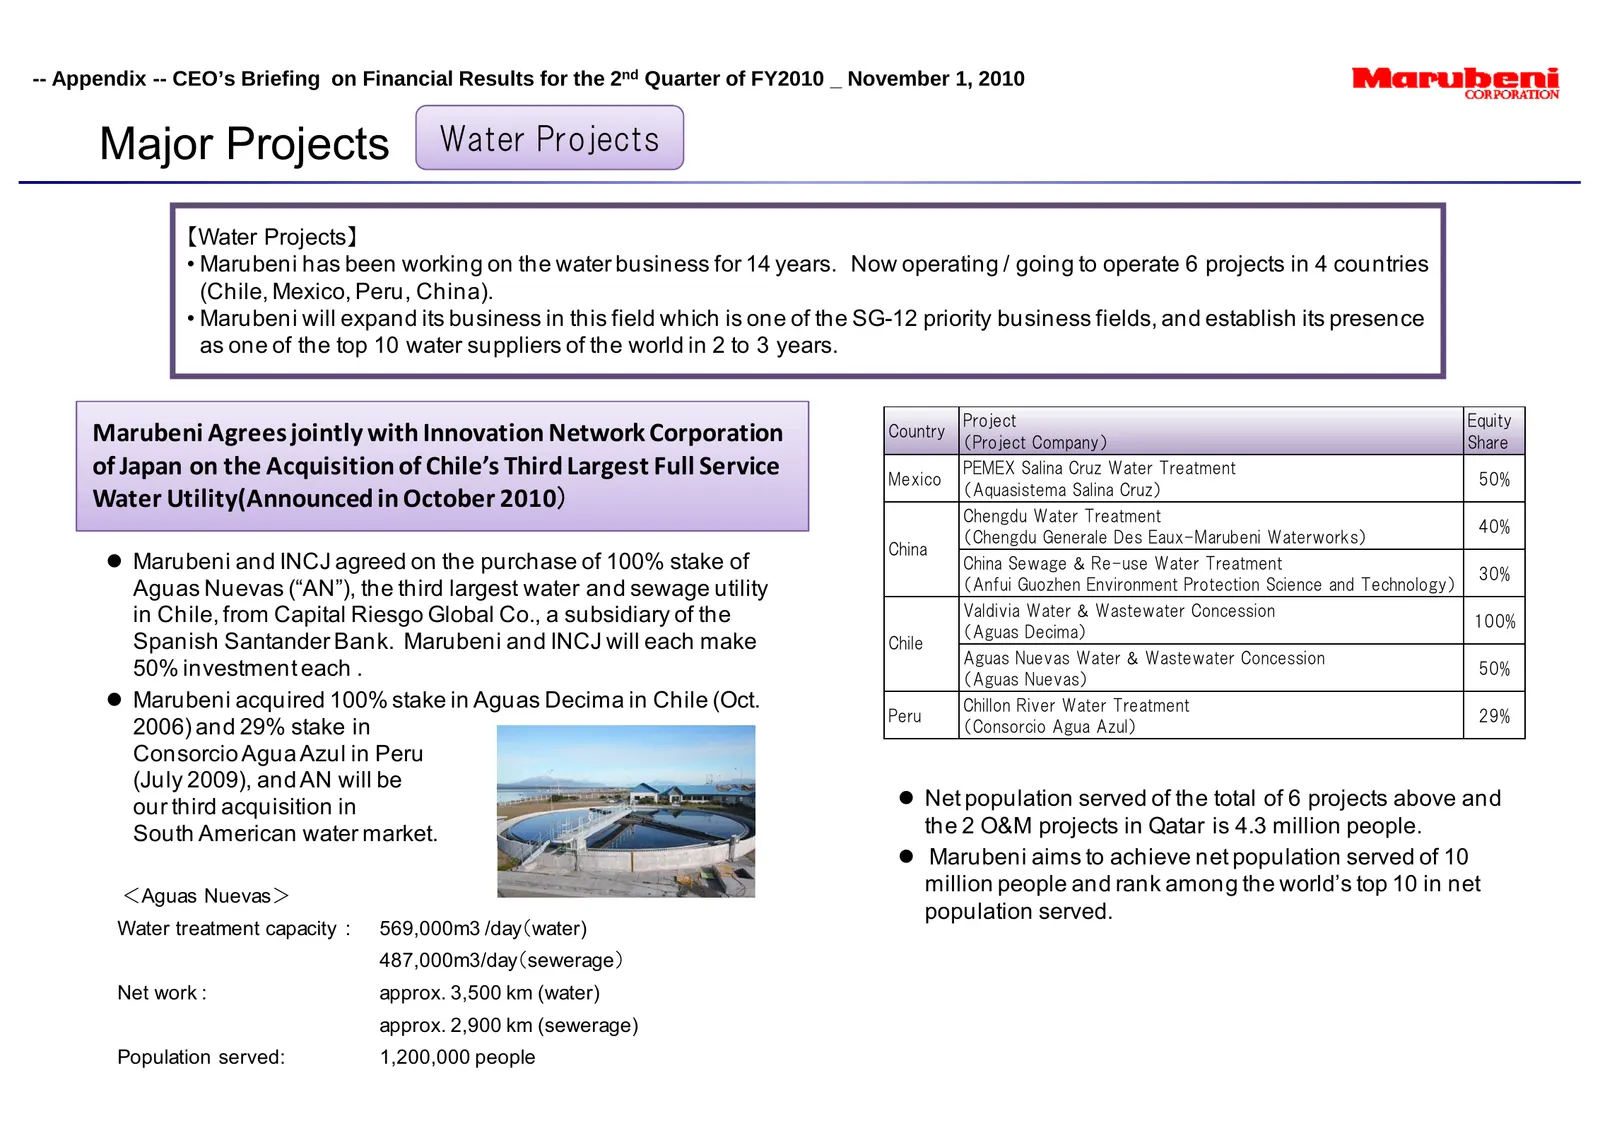
Slide 20: Major Projects: Water Projects
-- Appendix -- CEO’s Briefing on Financial Results for the 2nd Quarter of FY2010 _ November 1, 2010 Major Projects Water Projects 【Water Projects】 • Marubeni has been working on the water business for 14 years. Now operating / going to operate 6 projects in 4 countries (Chile, Mexico, Peru, China).
Slide 21: Translation and accounting notes
This document is an English translation of a statement written initially in Japanese. The original in Japanese should be considered the primary version. * Due to changes in accounting standards, from April 2009 the Company began reporting “Equity” instead of “Shareholders’ equity”. Newly reported “E
Slide 22: Disclaimer Regarding Forward-Looking Statements
DISCLAIMER REGARDING FORWARD-LOOKING STATEMENTS THIS DOCUMENT CONTAINS FORWARD-LOOKING STATEMENTS ABOUT THE PERFORMANCE OF MARUBENI AND ITS GROUP COMPANIES, BASED ON MANAGEMENT'S ASSUMPTIONS IN LIGHT OF CURRENT INFORMATION. THE FOLLOWING FACTORS MAY THEREFORE INFLUENCE ACTUAL RESULTS. THESE FACTORS
Source: Internet Archive copy of marubeni.com
More decks from Marubeni Corporation
 Investor Day (September 2026)64 slides · Sep 9, 2026
 Investor Presentation (June 2026)13 slides · June 2026
 ESG Presentation (December 2019)14 slides · Dec 5, 2019
 FY2013 Earnings Presentation36 slides · May 13, 2013
 FY2012 Earnings Presentation29 slides · May 10, 2012
 Q3 FY2012/3 Earnings Presentation21 slides · Feb 2, 2012