EPIQ Systems — Q2 2014 Earnings Presentation
13 slides from EPIQ Systems's earnings presentation, Jul 31, 2014

Slide 1: Second Quarter 2014 Earnings Conference Call
EpIQ Second Quarter 2014 Earnings Conference Call July 31, 2014 NASDAQ: EPIQ waww.epiqsystems.com
Slide 2: Forward Looking and Cautionary Statements
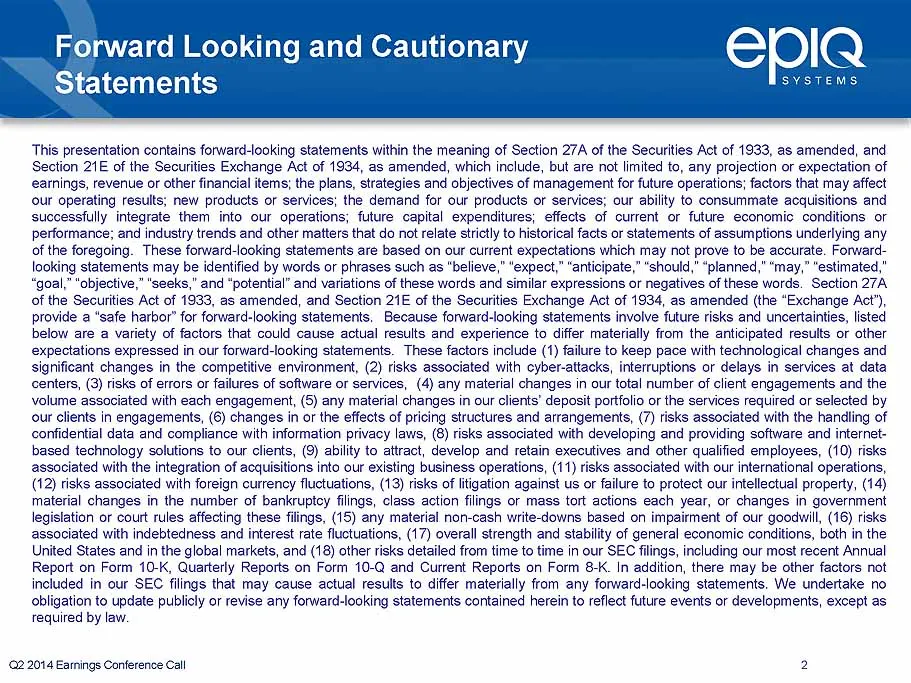
Forward Looking and Cautionary Statements SYSTEMS This presentation contains forward-looking statements within the meaning of Section 27A of the Secinies eh ste as parenies and Section Ze cL is Sea ies Exchange Act of 1934, as amended, which inclu are not limited to, premio rer fire Spactoe, “actors
Slide 3: Use of Non-GAAP Measures
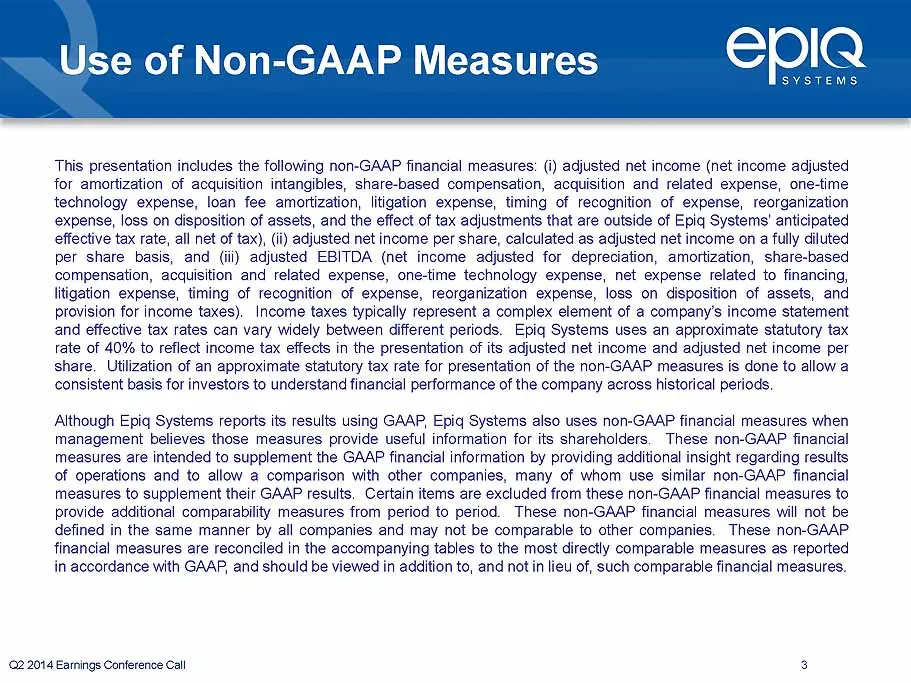
Use of Non-GAAP Measures SYSTEMS a amortization of acquisition intangibles, share-based compensation, acquisition and related expense, one-time technology expense, loan fee amortization, litigation expense, timing of recognition of expense, reorganization nse, f Epiq Systems on a ful tive tar at ft
Slide 4: Q2 Highlights
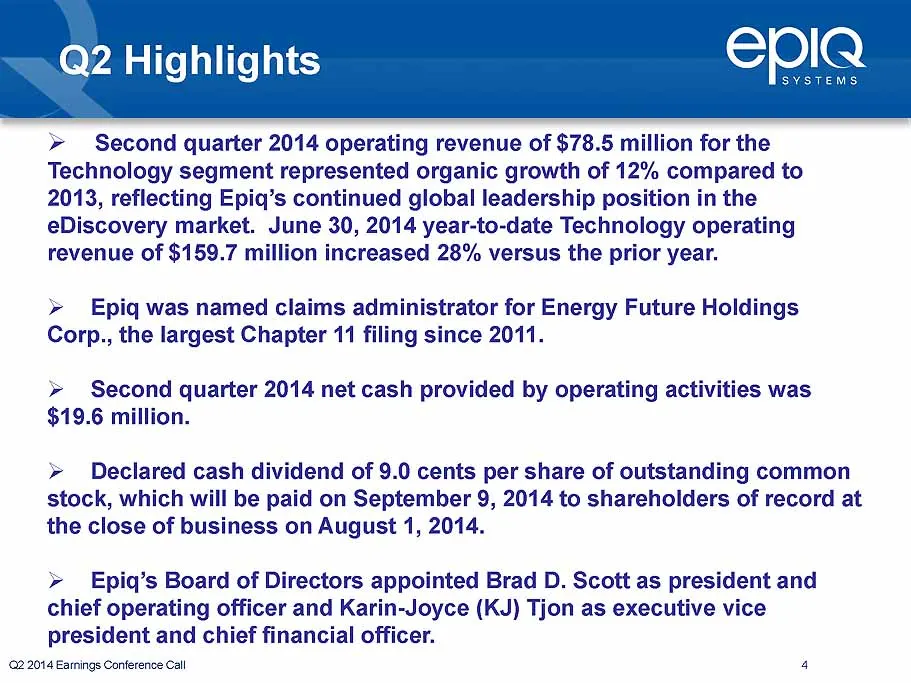
Q2 Highlights EplQ e709 h of 12% compared to va Reese quarter 2014 operating hnology 9 208, reflecting E Discovery t market. une 30, 2014 year- Neat Technology operating rsus the prior year. Holdi Ec d clai ini > Epiq for Energy F Corp., th 9 p 11 fil ; 2014 d rtar 2014 net h edad h ‘ tiviti ey OE >
Slide 5: Financial Results
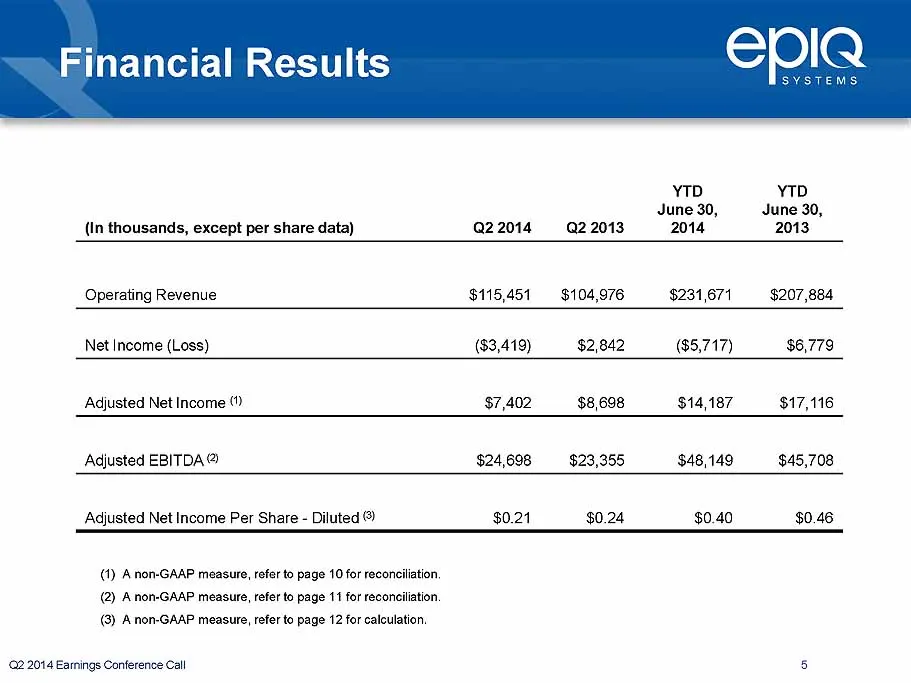
Financial Results EpPIQ YTD YTD June 30, June 30, (In thousand Q22014 _Q2.2013 2014 2013 Operating Revenue $116,451 $104,976 $231,671 $207,884 Net Income (Loss) ($3,419) $2,842 ($5,717) $6,779 $7,402 $8,698 $14,187 $17,116 Adjusted EBITDA@ $24,698 $23,355 $48,149 $45,708 Diluted ® $0.21 $0.24 $0.40
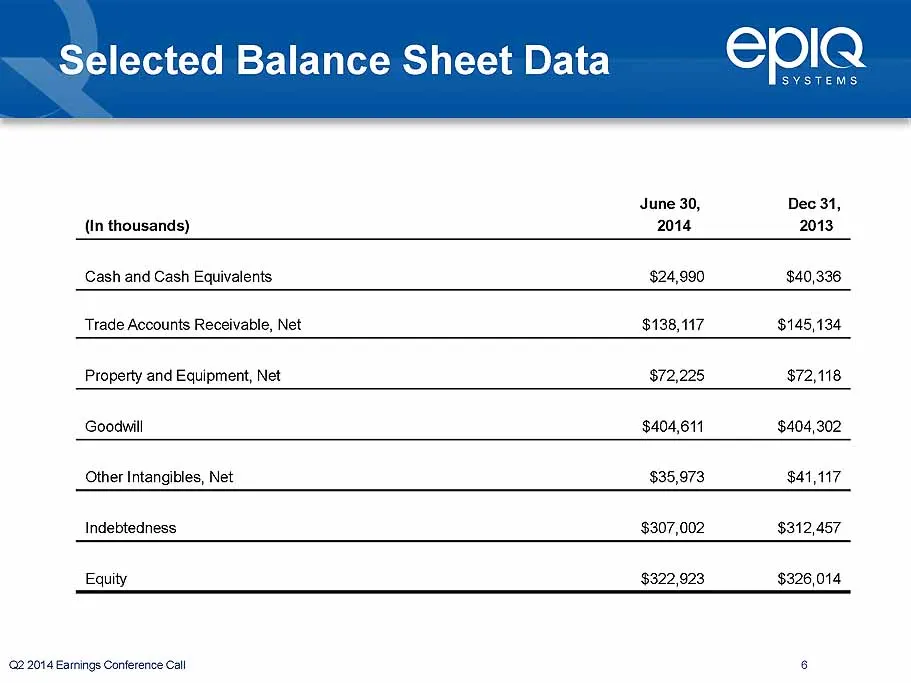
Slide 6: Selected Balance Sheet Data
Selected Balance Sheet Data Epla June 30, Dec 31, (in thousands) 2014 2013 $24,990 $40,336 Ne $138,117 $145,134 $72,225 $72,118 Goodwill $404,611 $404,302 Other Intangibles, Net $35,973 $41,117 Indebtedness $307,002 $312,457 Equity $322,923 $326,014 (22.2014 Eainings Conference Call 6
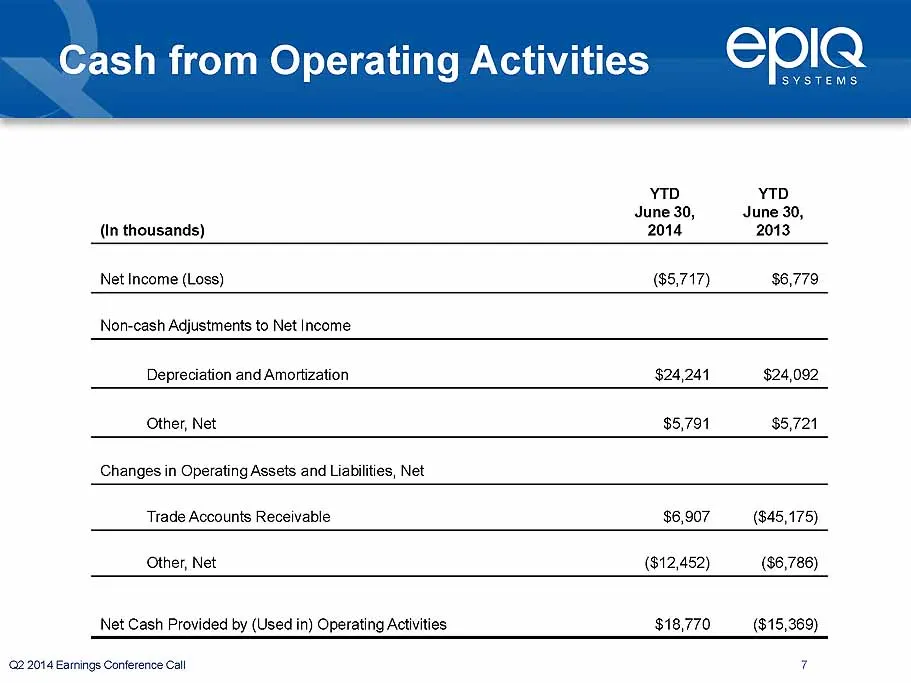
Slide 7: Cash from Operating Activities
Cash from Operating Activities epla SYSTEMS YTD YTD June 30, June 30, (In thousands) 2014 2013 Net Income (Loss) ($5,717) $6,779 $24,241 $24,092 Other, Net $5,791 $5,721 $6,907 ($45,175) Other, Net ($12,452) (86,786) $18,770 __ ($15,369) (22.2014 Eamings Conference Call 7
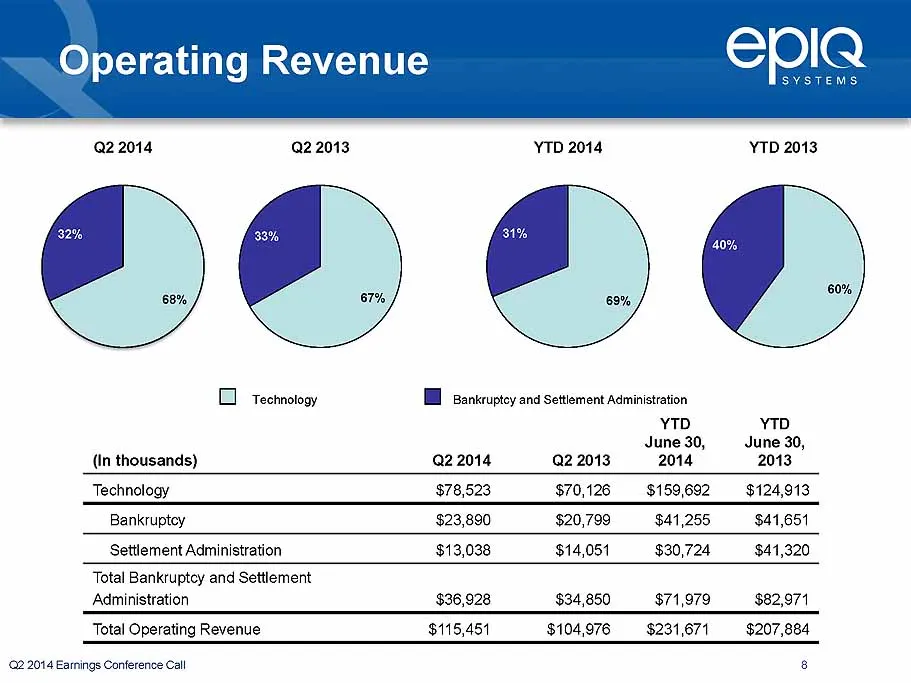
Slide 8: Operating Revenue
Operating Revenue Epla 2.2014 Q22013 YTD 2014 YTD 2013 technology TB Bankruptcy and Settlement Administration YTD June 30, June 30, (In thousands) 22014 Q2 2013 2014 2013 Technology $78,523 $70,126 _$159,692__$124,913 Bankruptey $23,890 $20,799 $41,255 $44,651 tie $13,038 $14,051 $30,724 $41,320 Tot
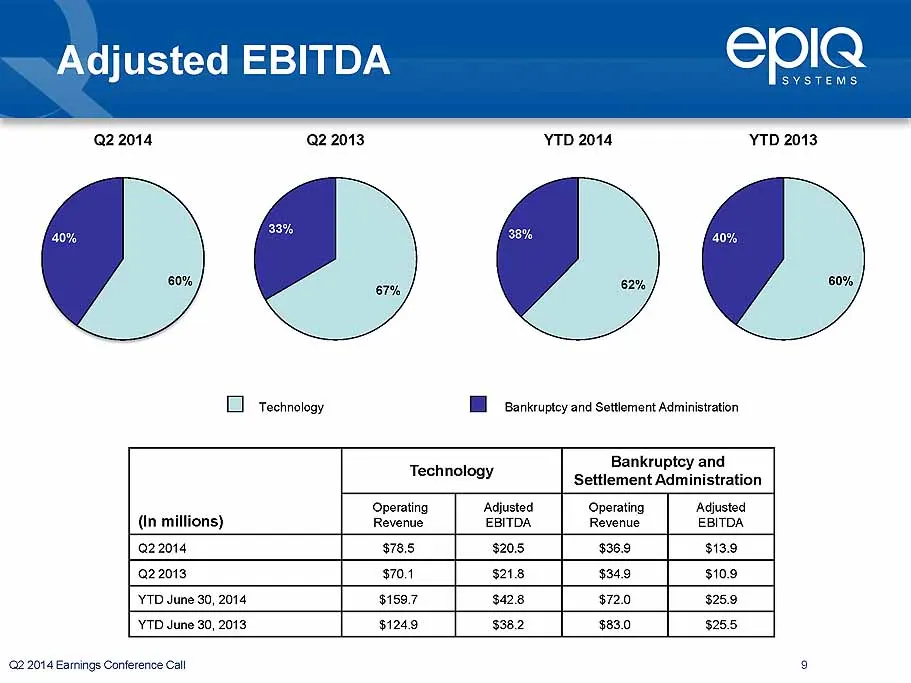
Slide 9: Adjusted EBITDA
Adjusted EBITDA EplQ 2.2014 2 2013 YTD 2014 YTD 2013 D1 technotoay TH Bankruptcy and Settlement Administration ty a er Bankruptcy and ey. Settlement Administration Operating ; Operating ‘Adjusted (in millions) Revenue Revenue EBITDA Q2 2014 $36.9 $13.9 022013 $349 $10.9 YTD June 30, 2014 $72.0 $25.9
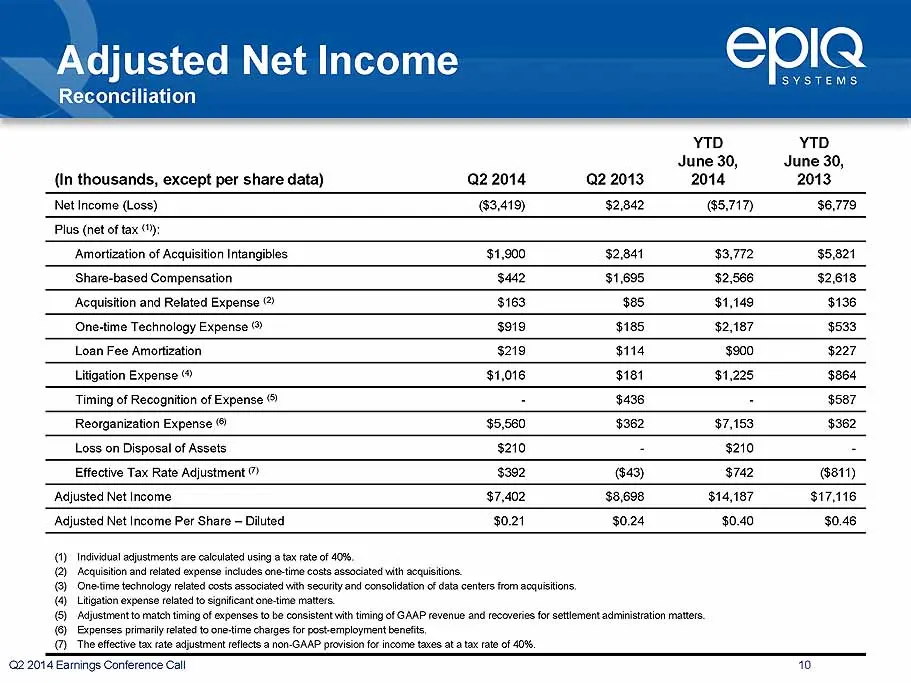
Slide 10: Adjusted Net Income Reconciliation
Adjusted Net Income SYSTEMS Reconciliation YTD YTD June 30, June 30, (In thousands, except per share data) Q2 2014 Q2 2013 2014 2013 Net Income (Loss) 63.419) $2,842 65.717) $6,779 Plus (net of tax ization of Acquisition Intangibles $1,900 32.841 $3,772 $5,821 Share-based Compensati $442 $1,695, $2,
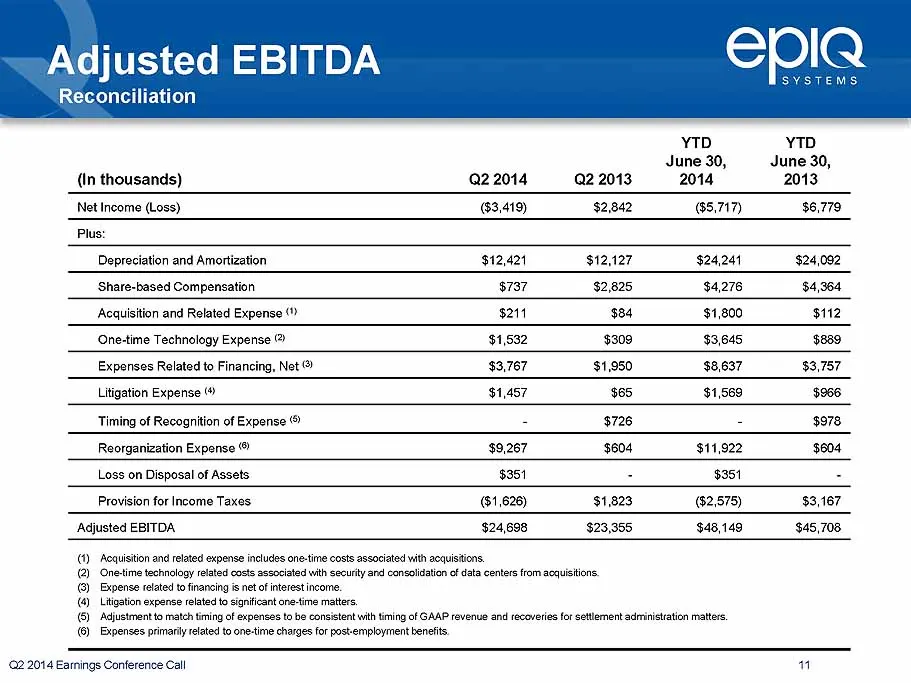
Slide 11: Adjusted EBITDA Reconciliation
SYSTEMS Adjusted EBITDA Reconcilia' (In thousands) Q2 2014 Q2 2013 2014 Net Income (Loss) 63.419) $2,842 (85.717) $6,779 d $12,421 $12,127 $24,241 $24,092 é $4276 $4,964 Acquisition and Related Expense (? $84 $1,800 $112 === Technology Expense ® $1,532 $309 $3,645 = 5 Related to Financing, Net ® $3,
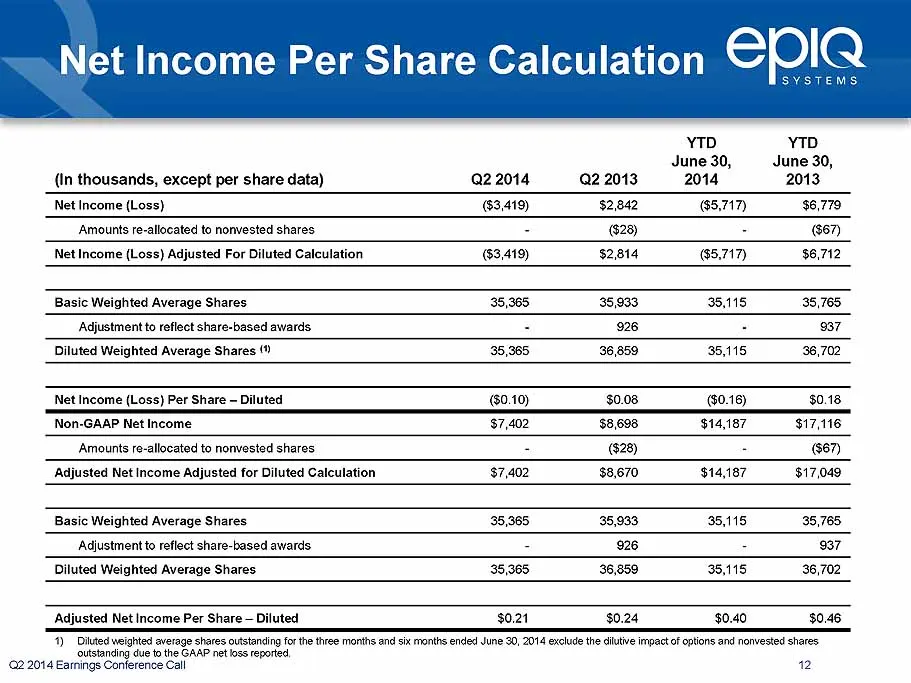
Slide 12: Net Income Per Share Calculation
Net Income Per Share Calculation €pl ie] SYSTEMS (In thousands, except per share data) ) ‘Amounts re-allocated to nonvested st Basic Weighted Average Shares Diluted Weighted Average Shares (0 Net Income (Loss) Per Share — Diluted SAAP Né jon-GAAP Net Income Basic Weighted Average Shares Adjustment t

Slide 13: Investor Relations Contact
EpIQ Lew Schroeber Investor Relations (913) 621-9500 IR@epiqsystems.com NASDAQ: EPIQ www.epigsystems.com
Source: SEC EDGAR · 8-K filed Jul 31, 2014
More decks from EPIQ Systems Inc
 Q2 2016 Earnings Presentation12 slides · Aug 9, 2016
 Q1 2016 Earnings Presentation12 slides · May 3, 2016
 FY2015 Earnings Presentation13 slides · Mar 1, 2016
 Q3 2015 Earnings Presentation11 slides · Nov 3, 2015
 Q2 2015 Earnings Presentation11 slides · Aug 3, 2015
 Q1 2015 Earnings Presentation11 slides · Apr 28, 2015