Marubeni Corporation · TSE:8002
Marubeni — FY2008 Earnings Presentation
25 slides from Marubeni's earnings presentation, May 11, 2009
Slide 1: Financial Results for FY2008
Financial Results for FY2008 May 11, 11 2009 Marubeni Corporation (TSE Code: 8002) This document is an English translation of a statement written initially in Japanese. The original in Japanese should be considered the primary version.

Slide 2: Disclaimer Regarding Forward-Looking Statements
DISCLAIMER REGARDING FORWARD-LOOKING STATEMENTS THIS DOCUMENT CONTAINS FORWARD-LOOKING STATEMENTS ABOUT THE PERFORMANCE OF MARUBENI AND ITS GROUP COMPANIES, BASED ON MANAGEMENT'S ASSUMPTIONS IN LIGHT OF CURRENT INFORMATION. THE FOLLOWING FACTORS MAY THEREFORE INFLUENCE ACTUAL RESULTS. THESE FACTORS
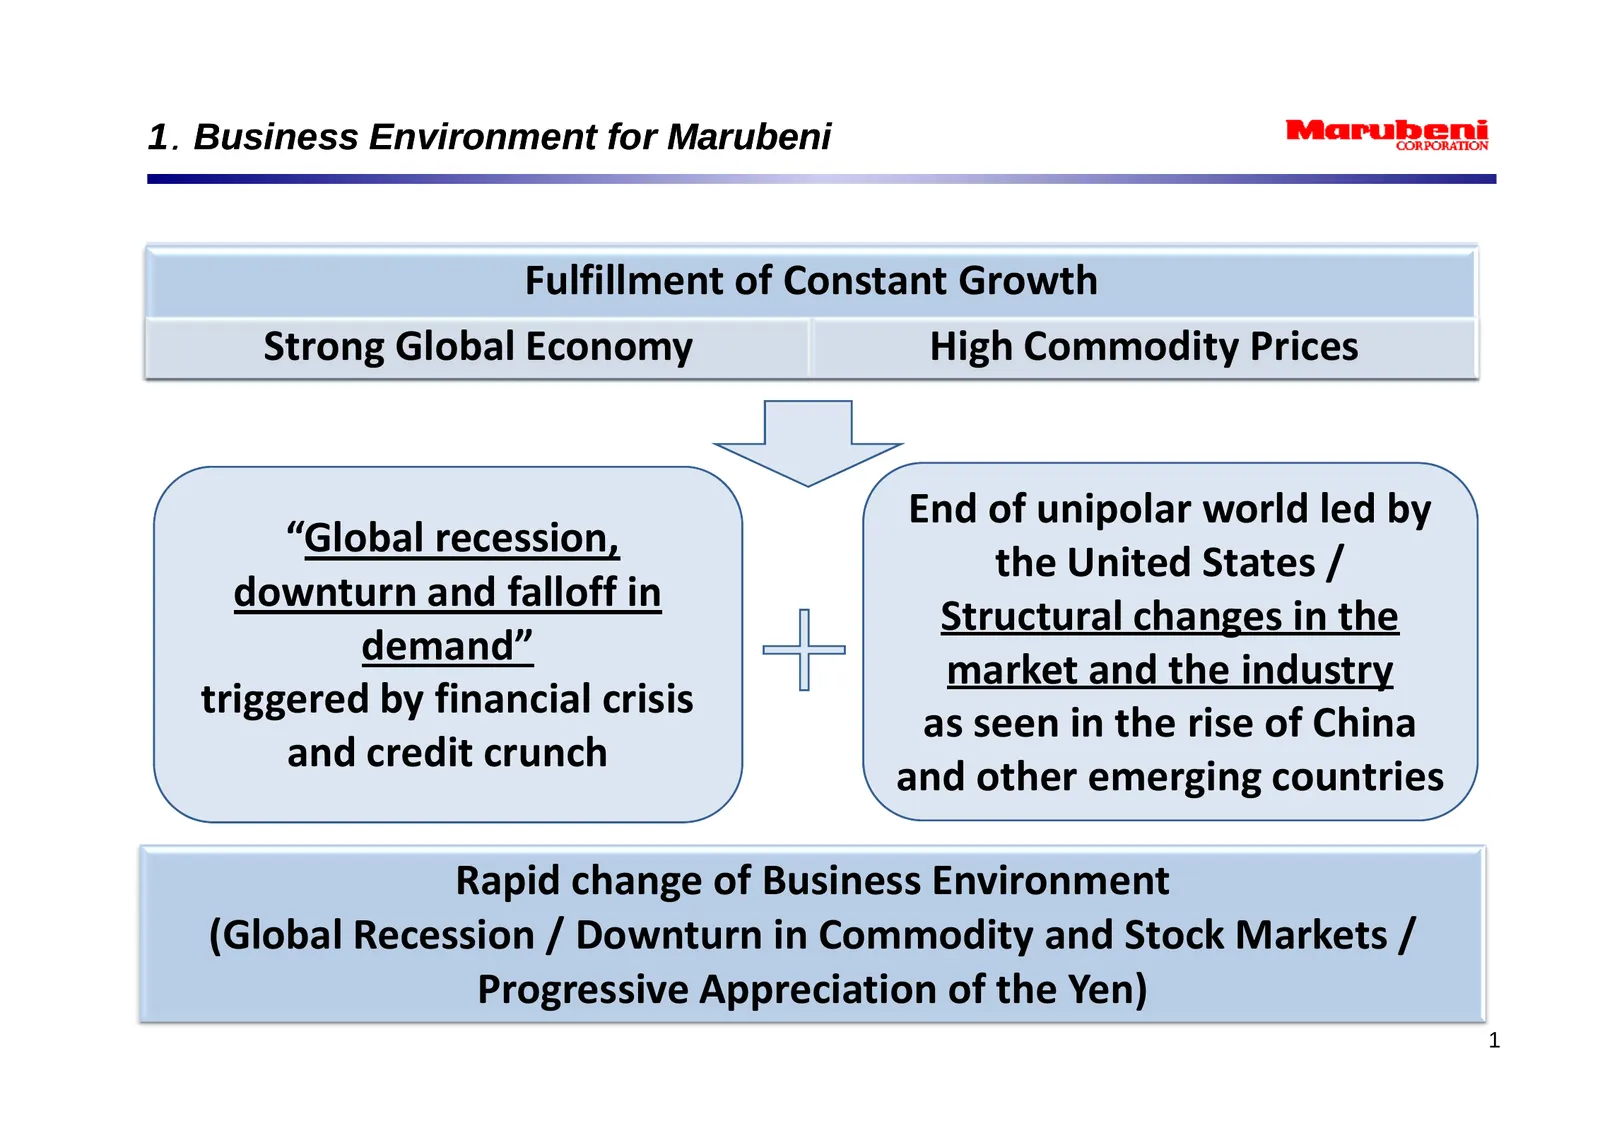
Slide 3: Business Environment for Marubeni
1.Business Environment for Marubeni Fulfillment of Constant Growth Strong Global Economy High Commodity Prices End of unipolar world led by “Global recession, the United States / downturn and falloff in Structural changes in the demand” market and the industry triggered by financial crisis as seen i
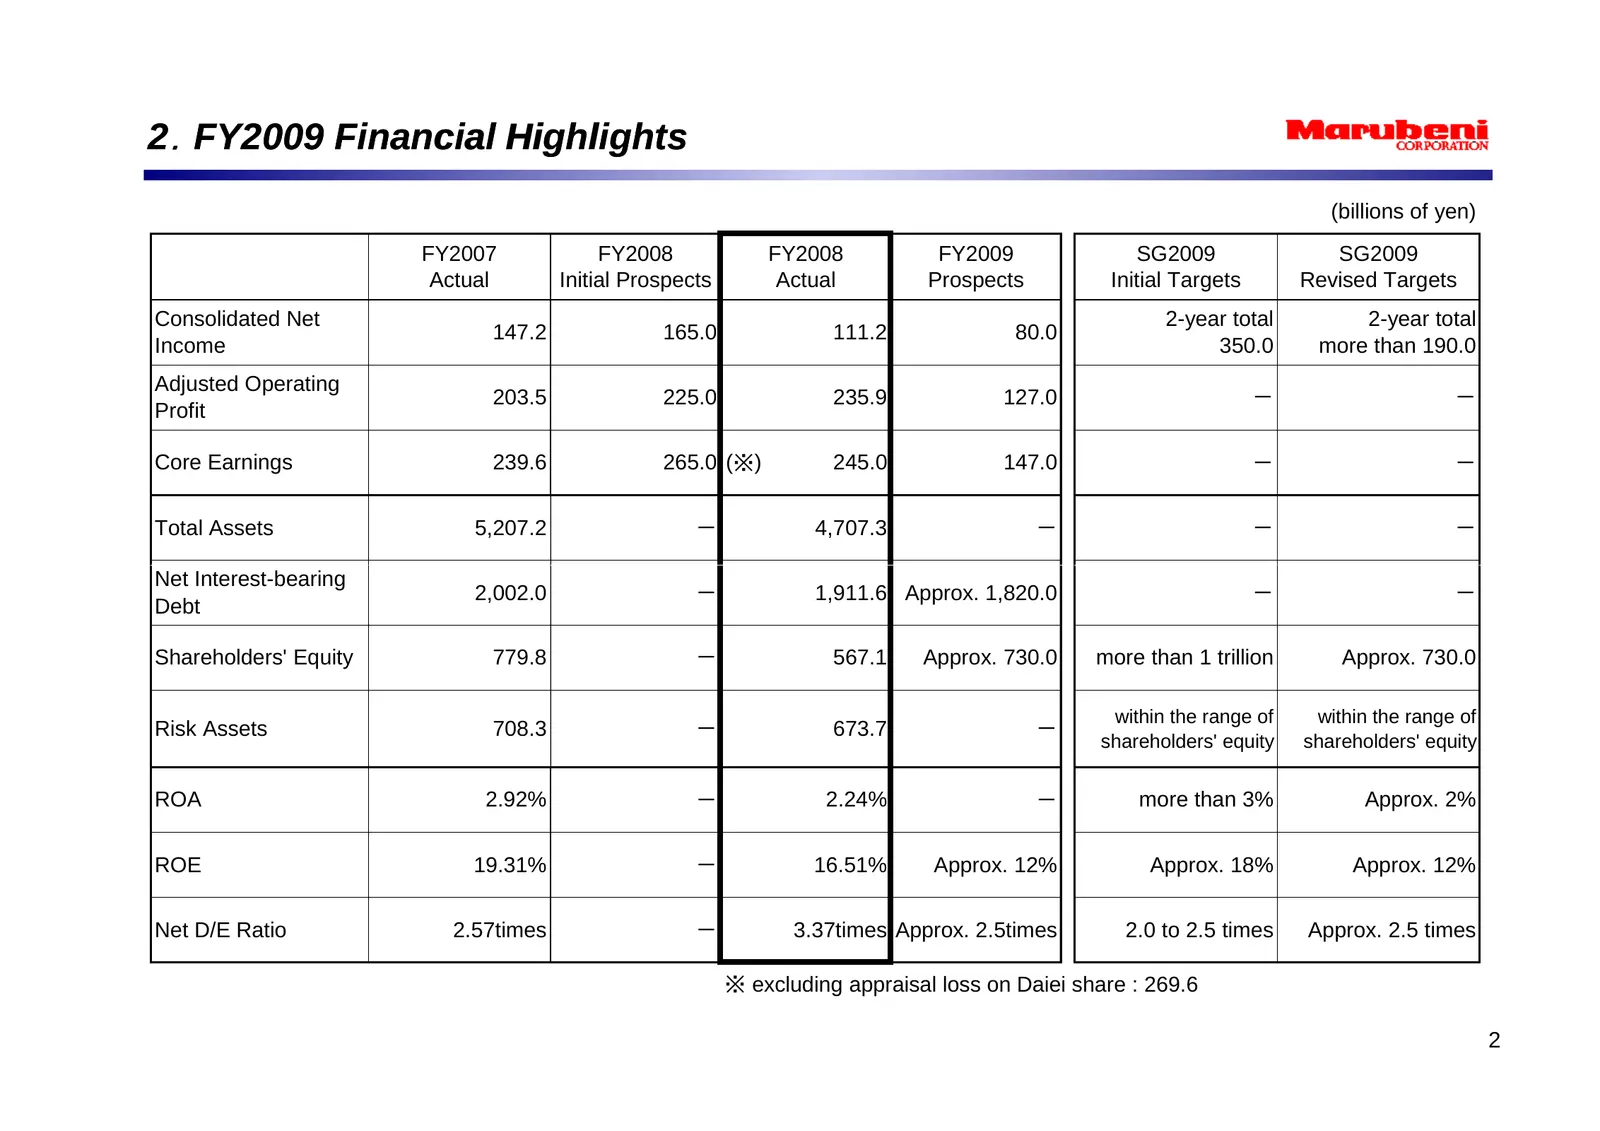
Slide 4: FY2009 Financial Highlights
2.FY2009 Financial Highlights (billions of yen) FY2007 FY2008 FY2008 FY2009 SG2009 SG2009 Actual Initial Prospects Actual Prospects Initial Targets Revised Targets Consolidated Net 2-year total 2-year total 147.2 165.0 111.2 80.0 Income 350.0 more than 190.0 Adjusted Operating 203.5 225.0 235.9 127.
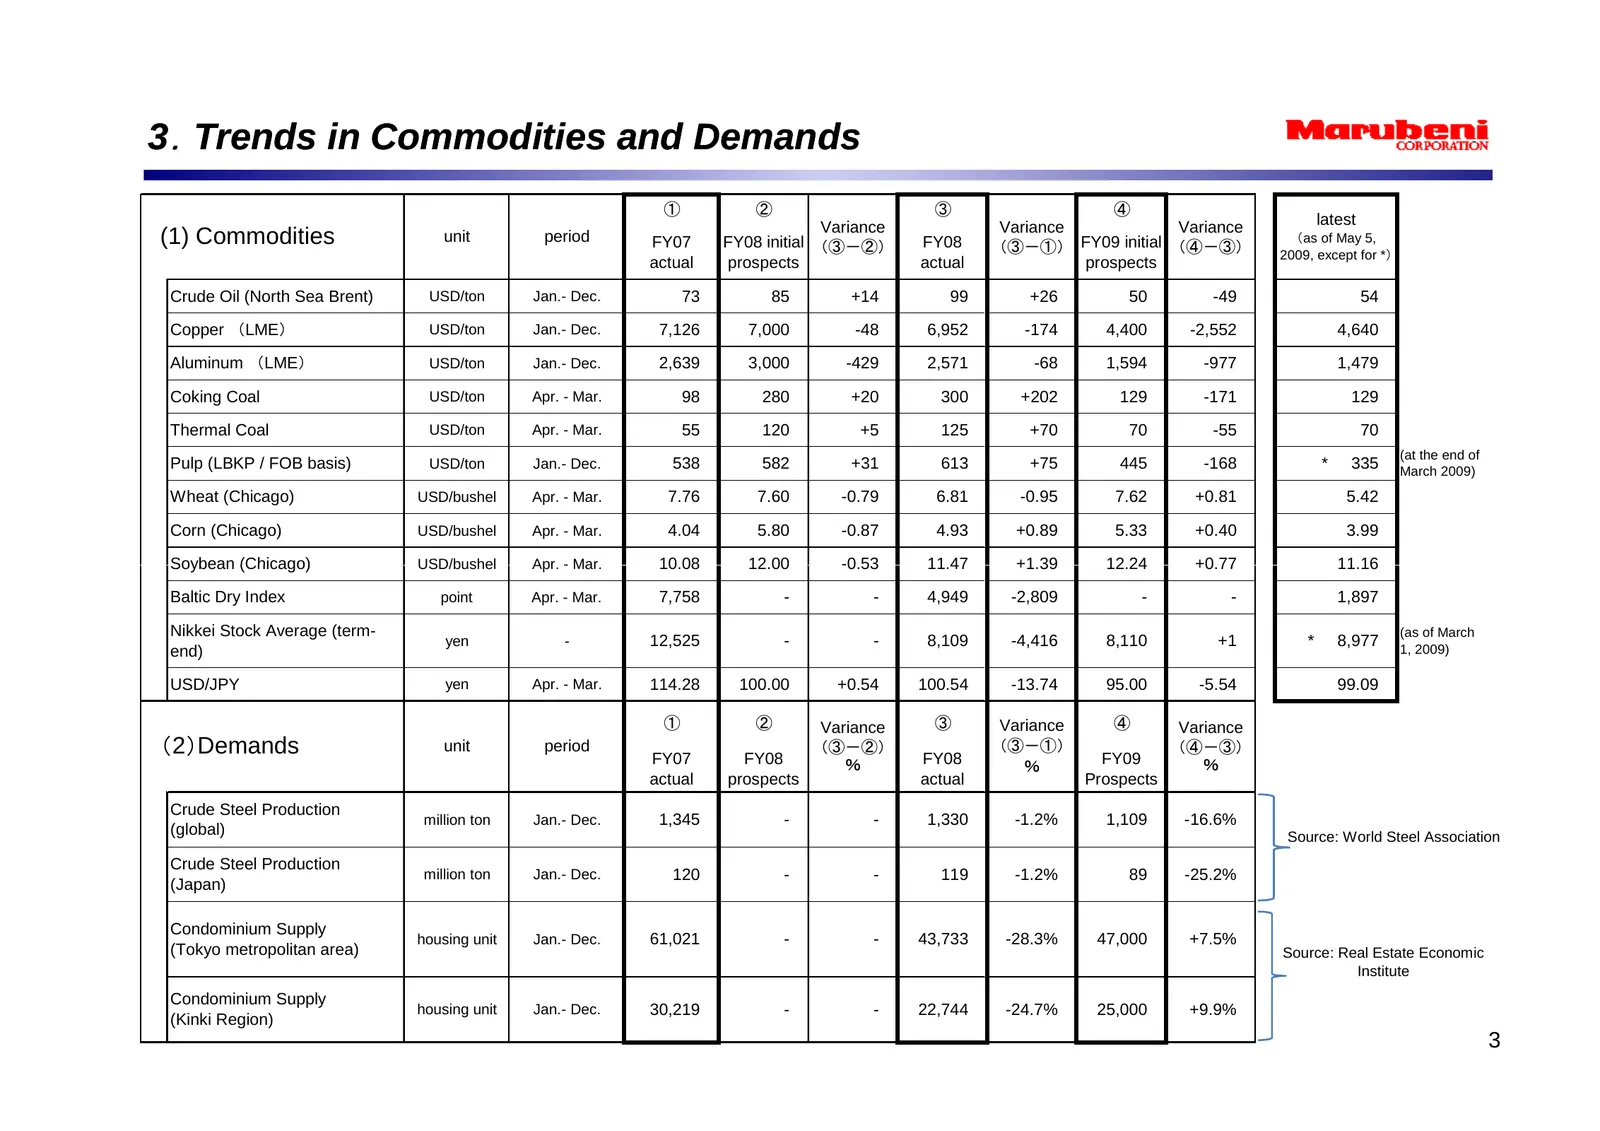
Slide 5: Trends in Commodities and Demands
3.Trends in Commodities and Demands ① ② ③ ④ Variance Variance Variance latest (1) Commodities unit period FY07 FY08 initial (③-②) FY08 (③-①) FY09 initial (④-③) (as of May 5, 2009, except for *) actual prospects actual prospects Crude Oil (North Sea Brent) USD/ton Jan.- Dec. 73 85 +14 99 +26 50 -49 5
Slide 6: Net Income
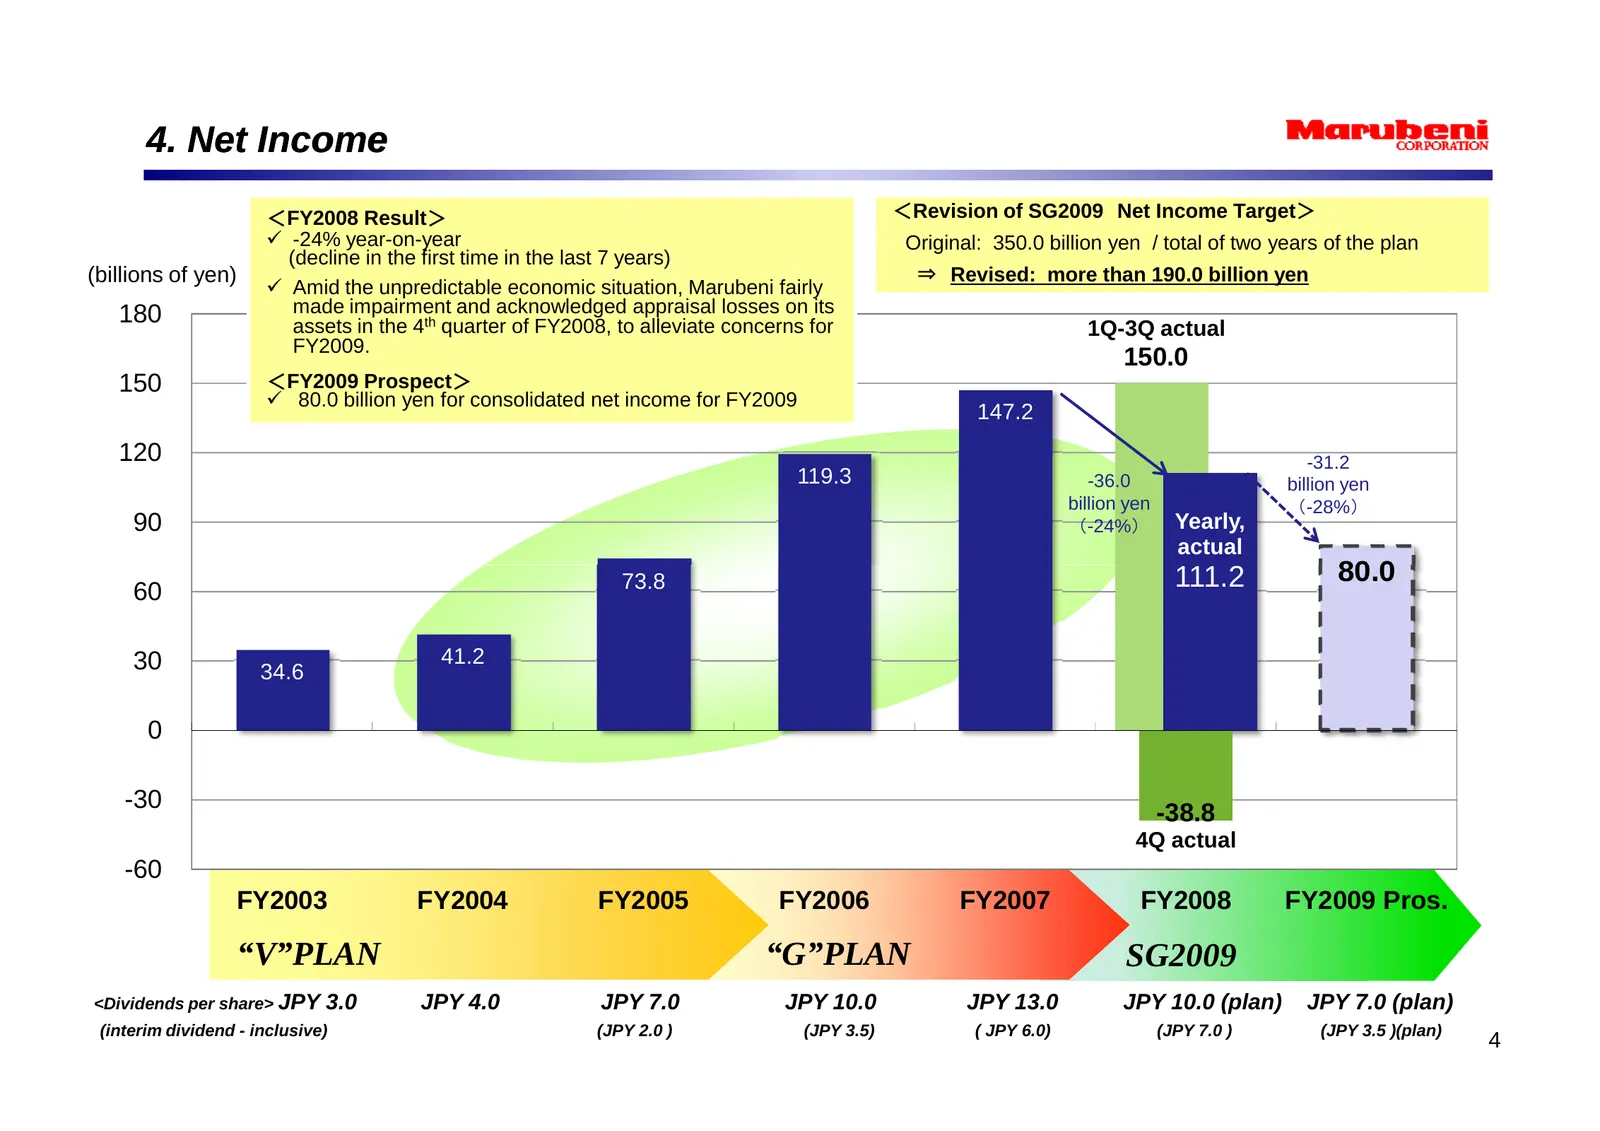
4. Net Income <FY2008 Result> <Revision of SG2009 Net Income Target> 9 -24% year-on-year Original: 350.0 billion yen / total of two years of the plan (decline in the first time in the last 7 years) (billions of yen) ⇒ Revised: more than 190.0 billion yen 9 Amid the unpredictable economic situation,
Slide 7: Adjusted Operating Profit & Core Earnings
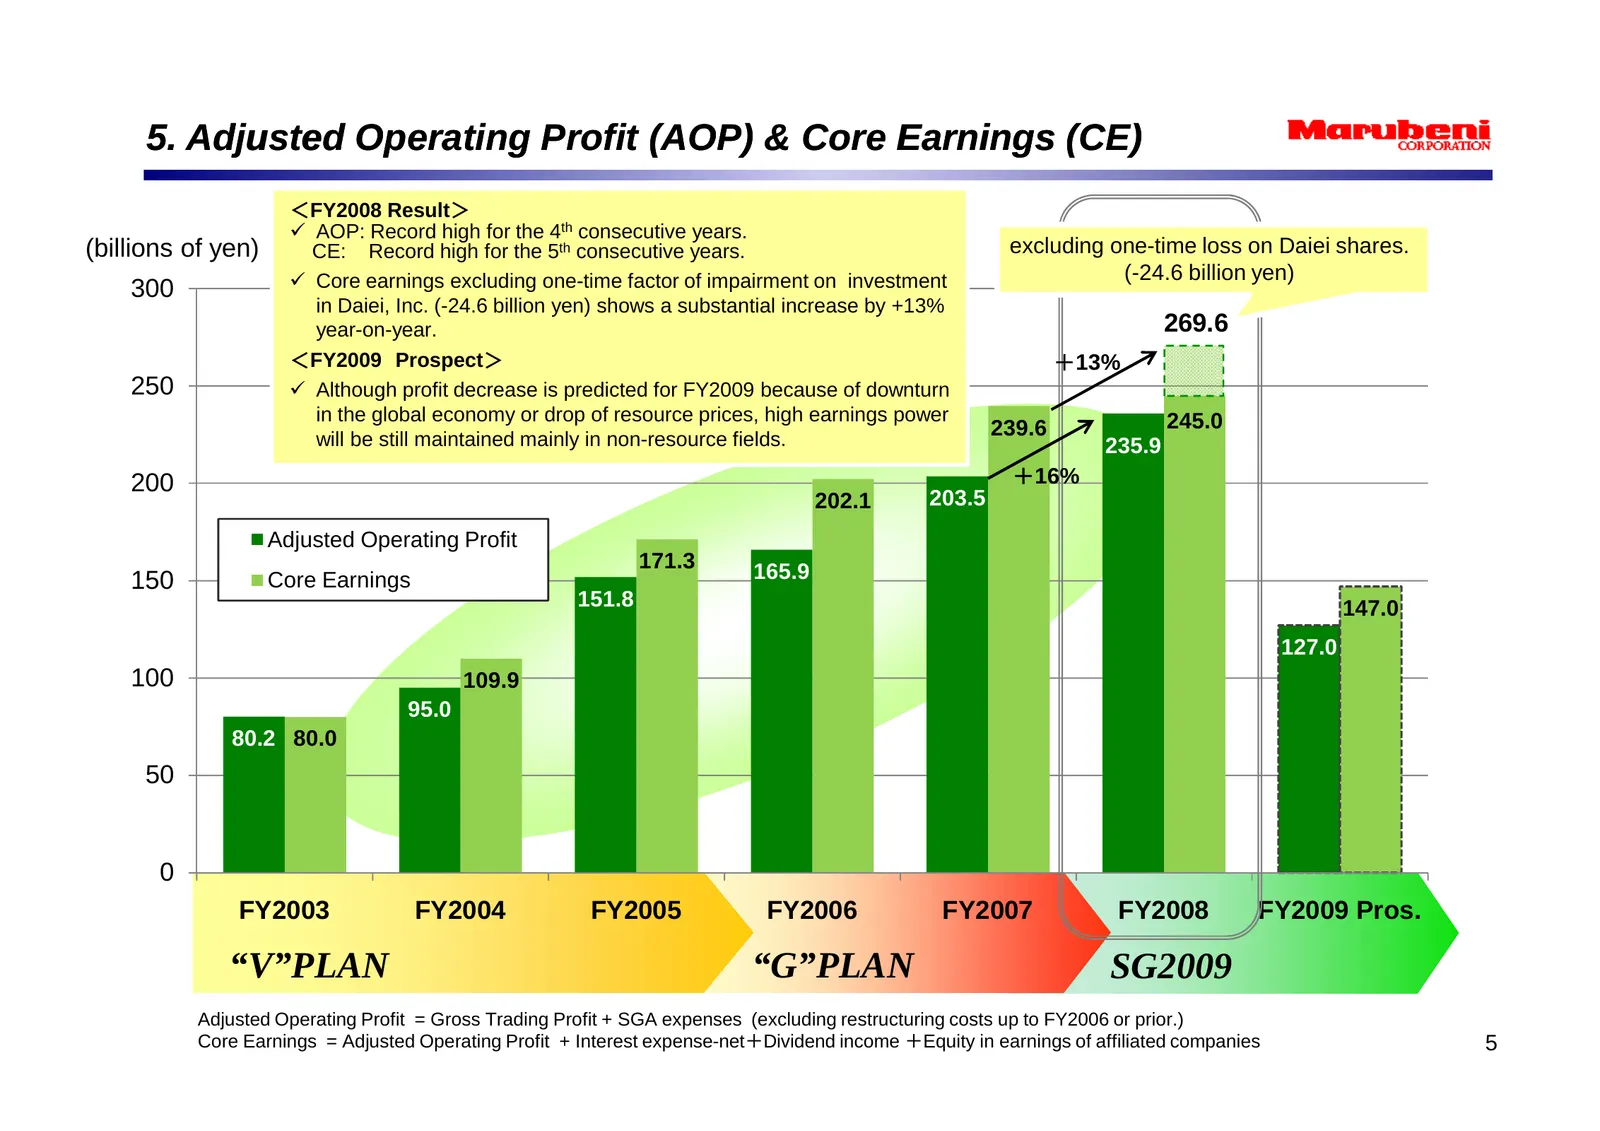
5. Adjusted Operating Profit (AOP) & Core Earnings (CE) <FY2008 Result> 9 AOP: Record high for the 4th consecutive years. (billions of yen) CE: Record high for the 5th consecutive years. excluding one-time loss on Daiei shares. 9 Core earnings excluding one-time factor of impairment on investment (-
Slide 8: Earnings Structure of Net Income
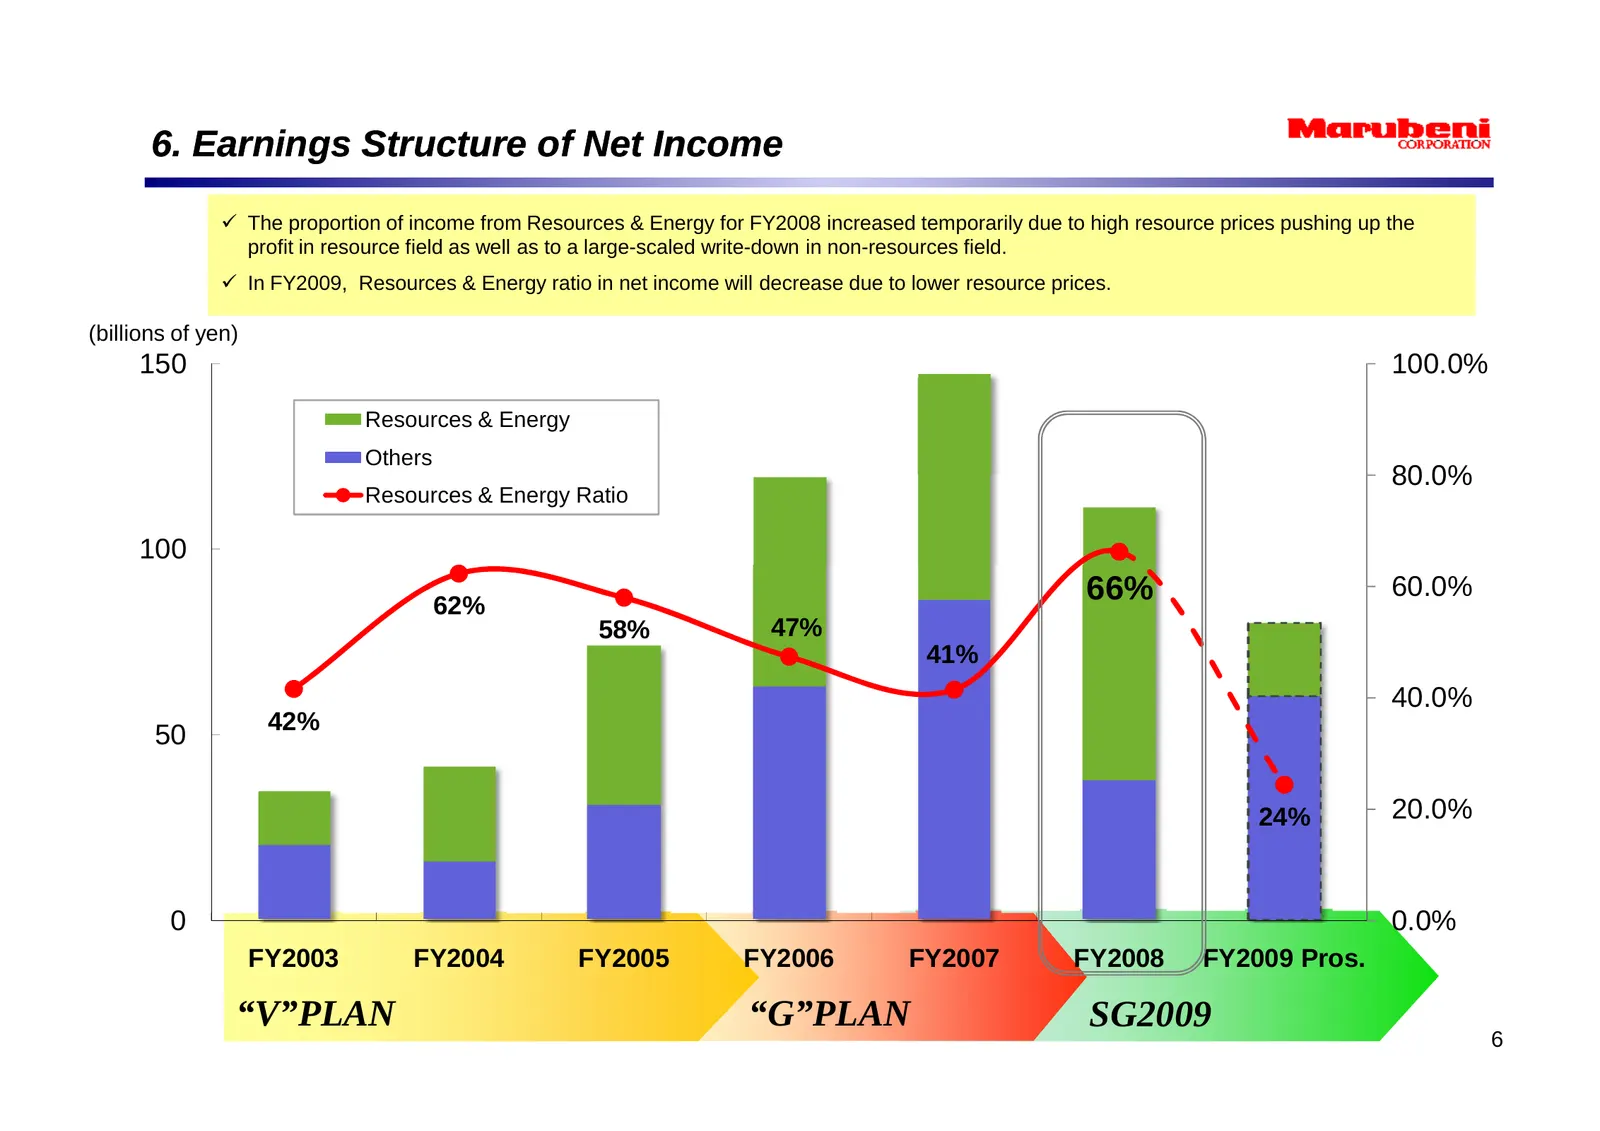
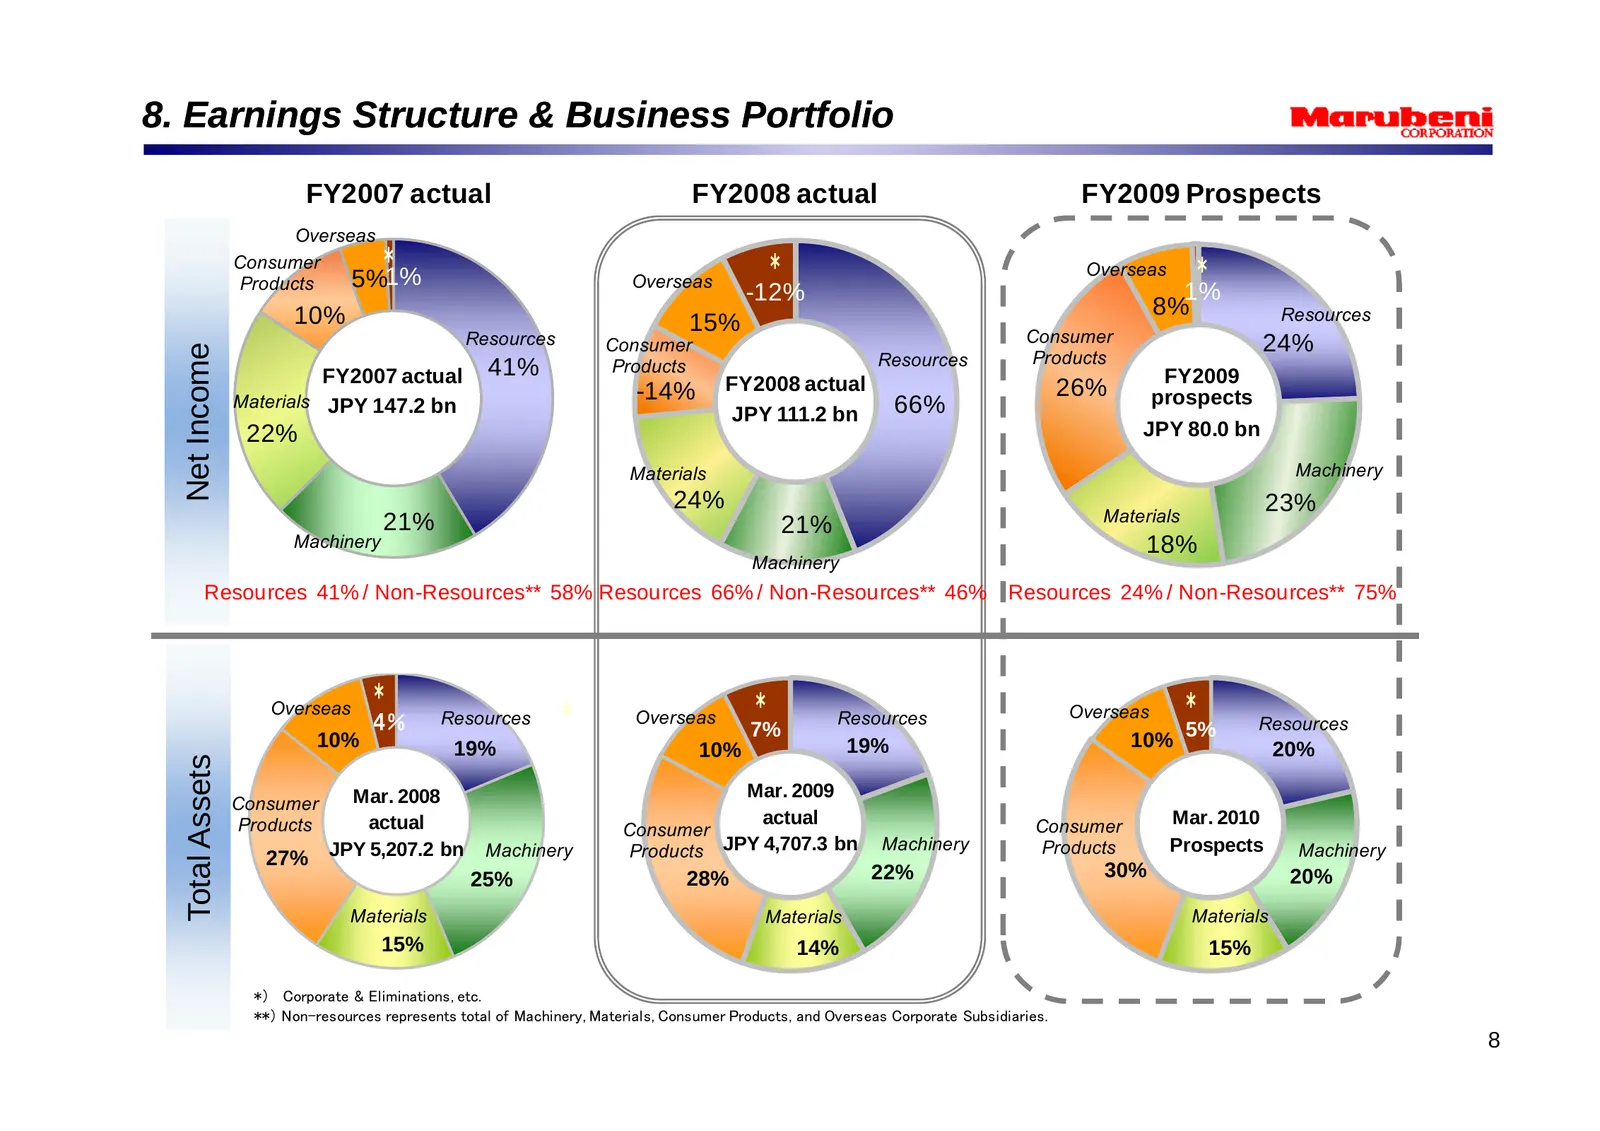
6. Earnings Structure of Net Income 9 The proportion of income from Resources & Energy for FY2008 increased temporarily due to high resource prices pushing up the profit in resource field as well as to a large-scaled write-down in non-resources field. 9 In FY2009, Resources & Energy ratio in net inc
Slide 9: Earnings Structure of Core Earnings
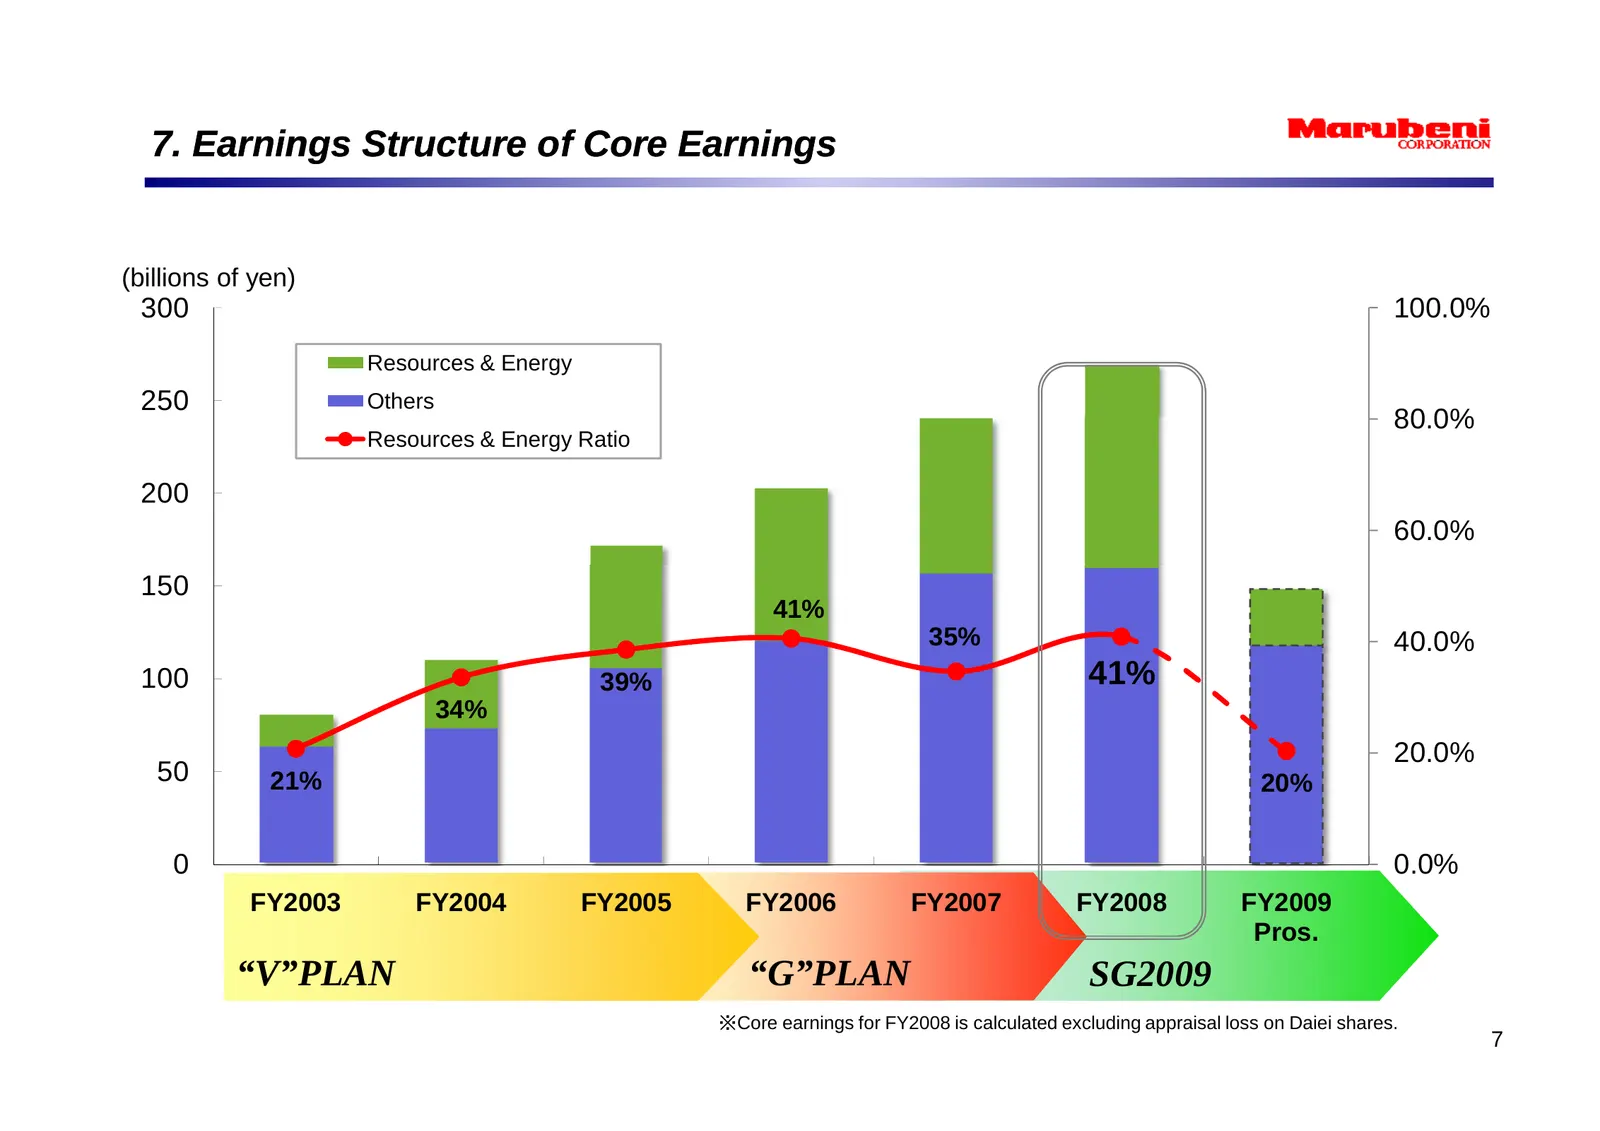
7. Earnings Structure of Core Earnings (billions of yen) 300 100.0% Resources & Energy 250 Others 80.0% Resources & Energy Ratio 200 60.0% 150 41% 35% 40.0% 100 39% 41% 34% 20.0% 50 21% 20% 0 0.0% FY2003 FY2004 FY2005 FY2006 FY2007 FY2008 FY2009 Pros. “V”PLAN “G”PLAN SG2009 ※Core earnings for FY2008
Slide 10: Earnings Structure & Business Portfolio
8. Earnings Structure & Business Portfolio FY2007 actual FY2008 actual FY2009 Prospects Overseas Consumer * * * Overseas Products 5% 1% Overseas -12% 1% 10% 8% Resources 15% Consumer Resources Consumer 24% Net Income Products Resources Products FY2007 actual 41% FY2008 actual FY2009 Materials JPY 14
Slide 11: Total Assets and ROA
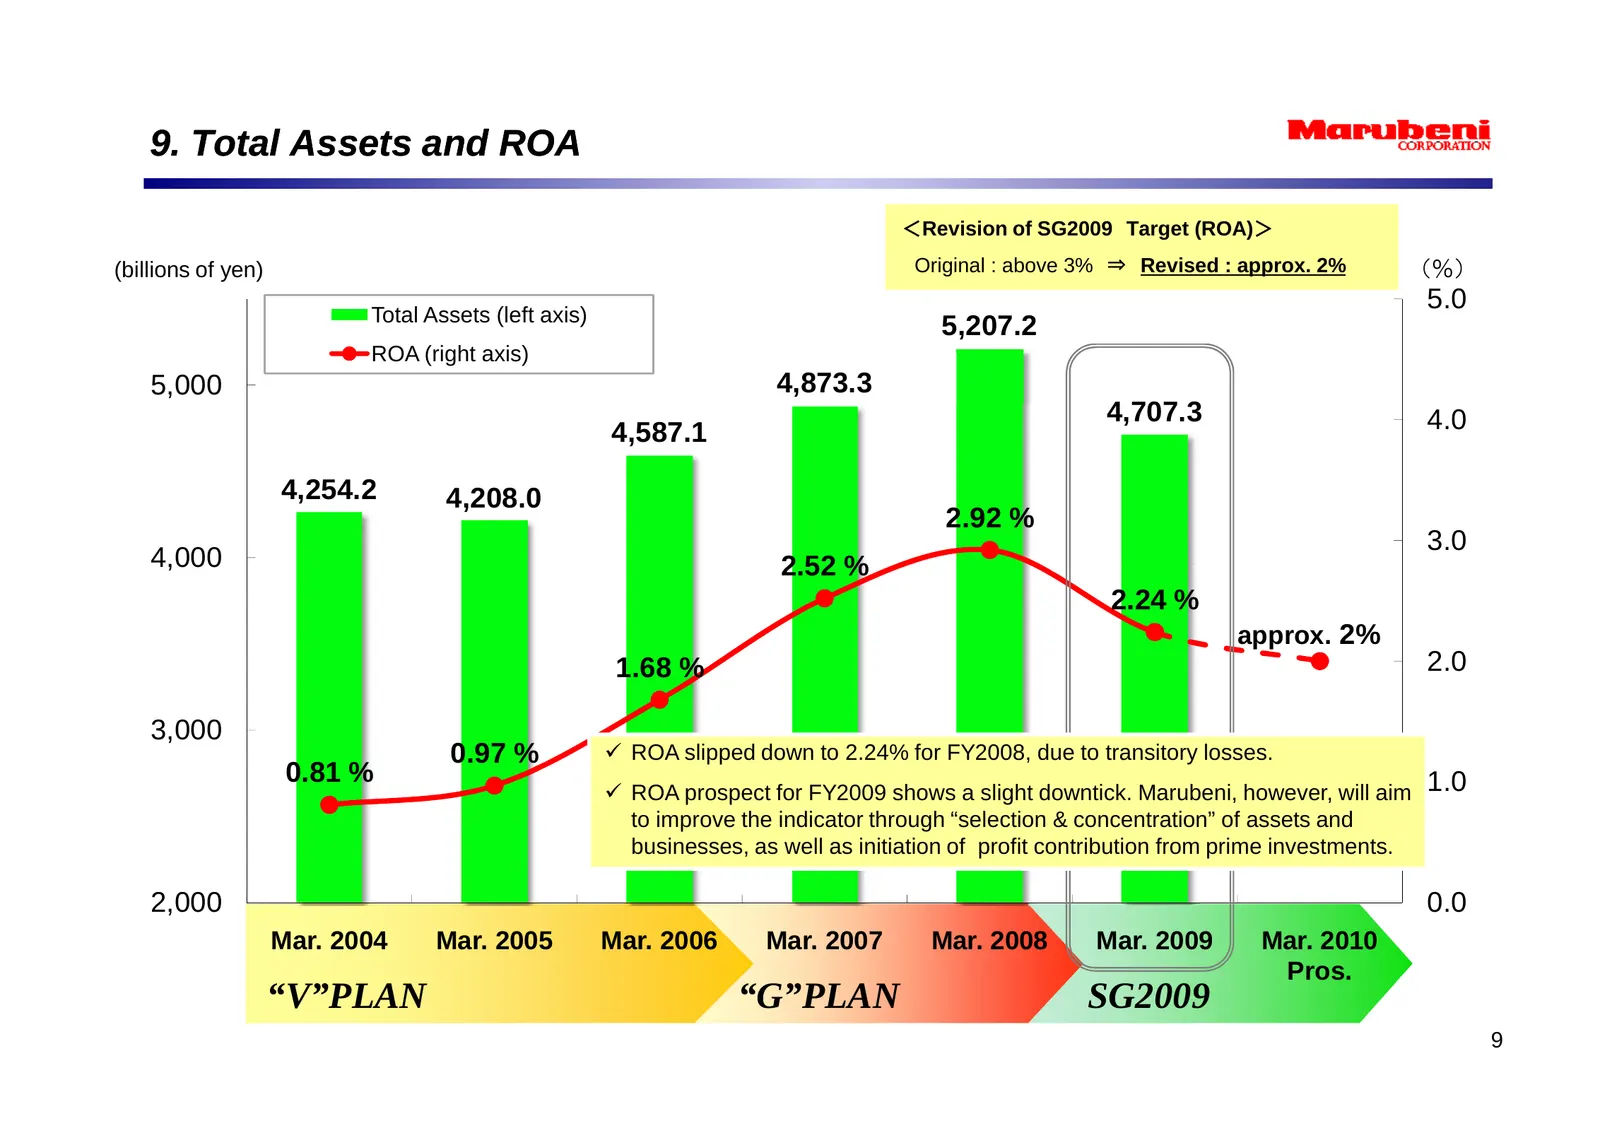
9. Total Assets and ROA <Revision of SG2009 Target (ROA)> (billions of yen) Original : above 3% ⇒ Revised : approx. 2% (%) Total Assets (left axis) 5.0 5,207.2 ROA (right axis) 5,000 4,873.3 4,707.3 4.0 4,587.1 4,254.2 4,208.0 2.92 % 3.0 4,000 2 52 % 2.52 2.24 % approx. 2% 1.68 % 2.0 3,000 0.97 % 9
Slide 12: Shareholders' Equity and Net D/E Ratio
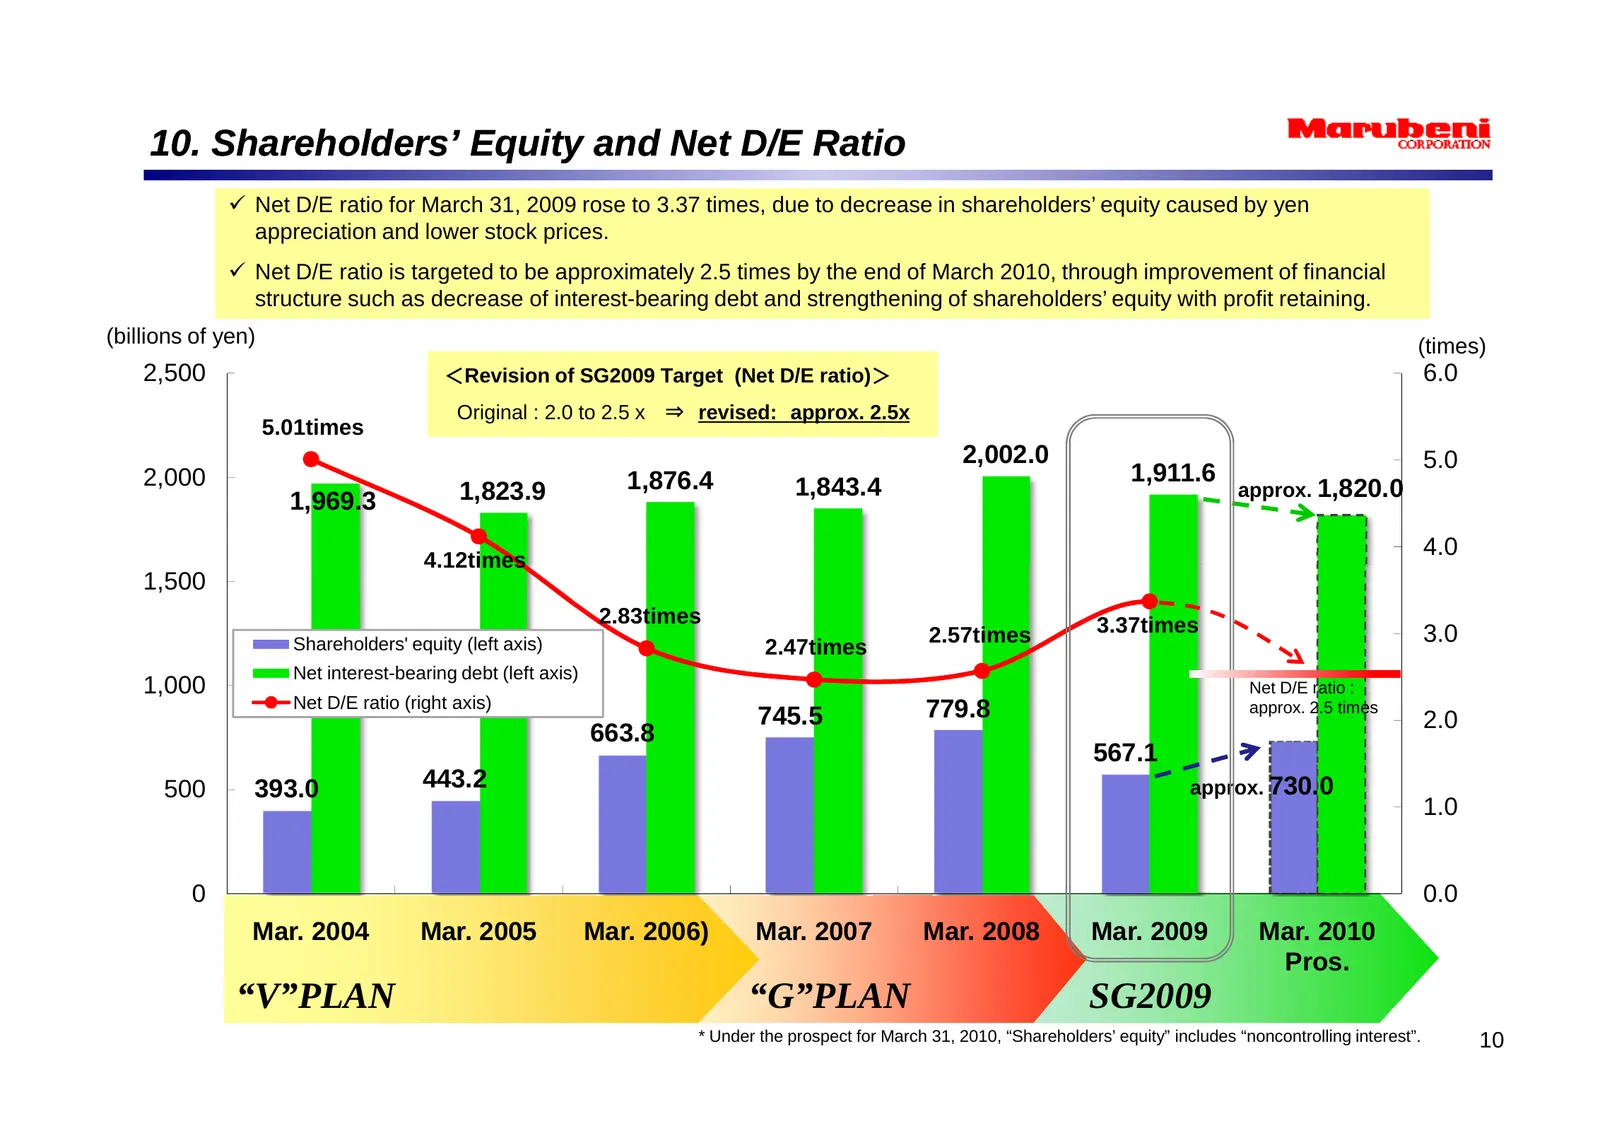
10. Shareholders’ Equity and Net D/E Ratio 9 Net D/E ratio for March 31, 2009 rose to 3.37 times, due to decrease in shareholders’ equity caused by yen appreciation and lower stock prices. 9 Net D/E ratio is targeted to be approximately 2.5 times by the end of March 2010, through improvement of fina
Slide 13: Cash Flows
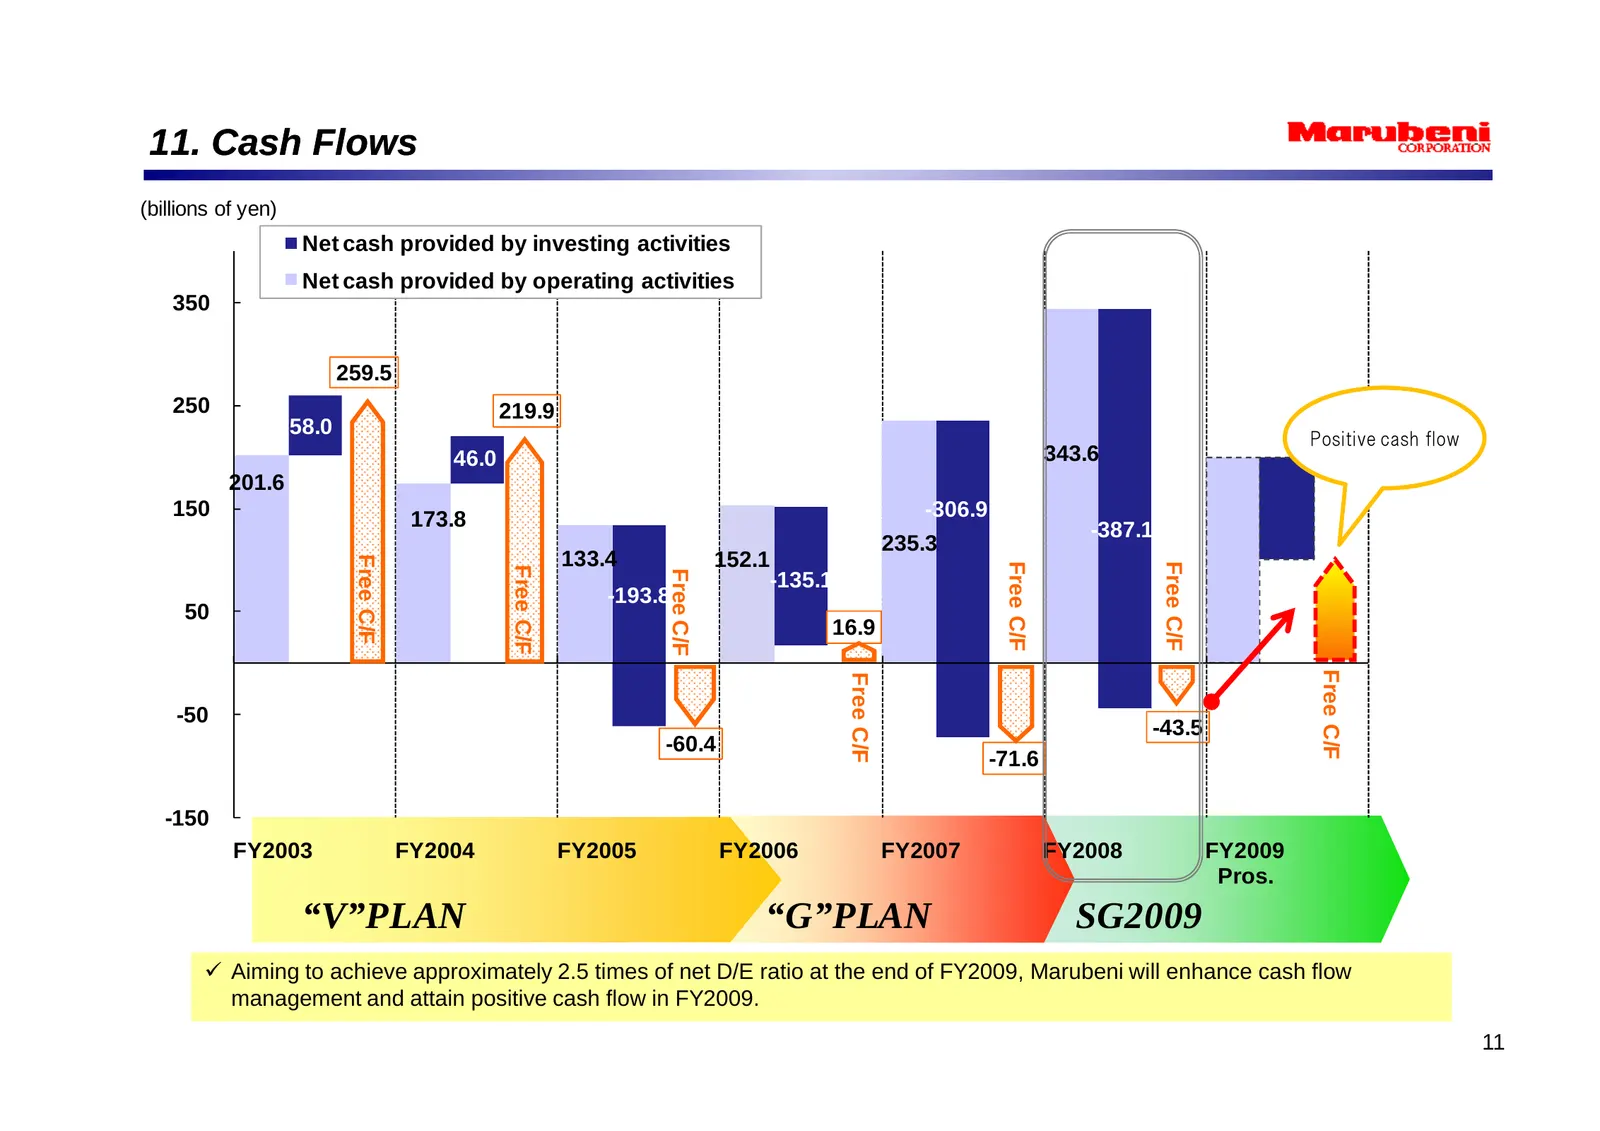
11. Cash Flows (billions of yen) Net cash provided by investing activities Net cash provided by operating activities 350 259.5 250 219.9 58.0 Positive cash flow 46.0 343.6 201.6 150 173.8 -306.9 -387.1 235.3 133.4 152.1 F Free F Free F Free Free C/F Free C/F -135.1 -193.8 50 C/F C/F C/F 16.9 Free C/
Slide 14: Shareholders' Equity and Net Risk Asset
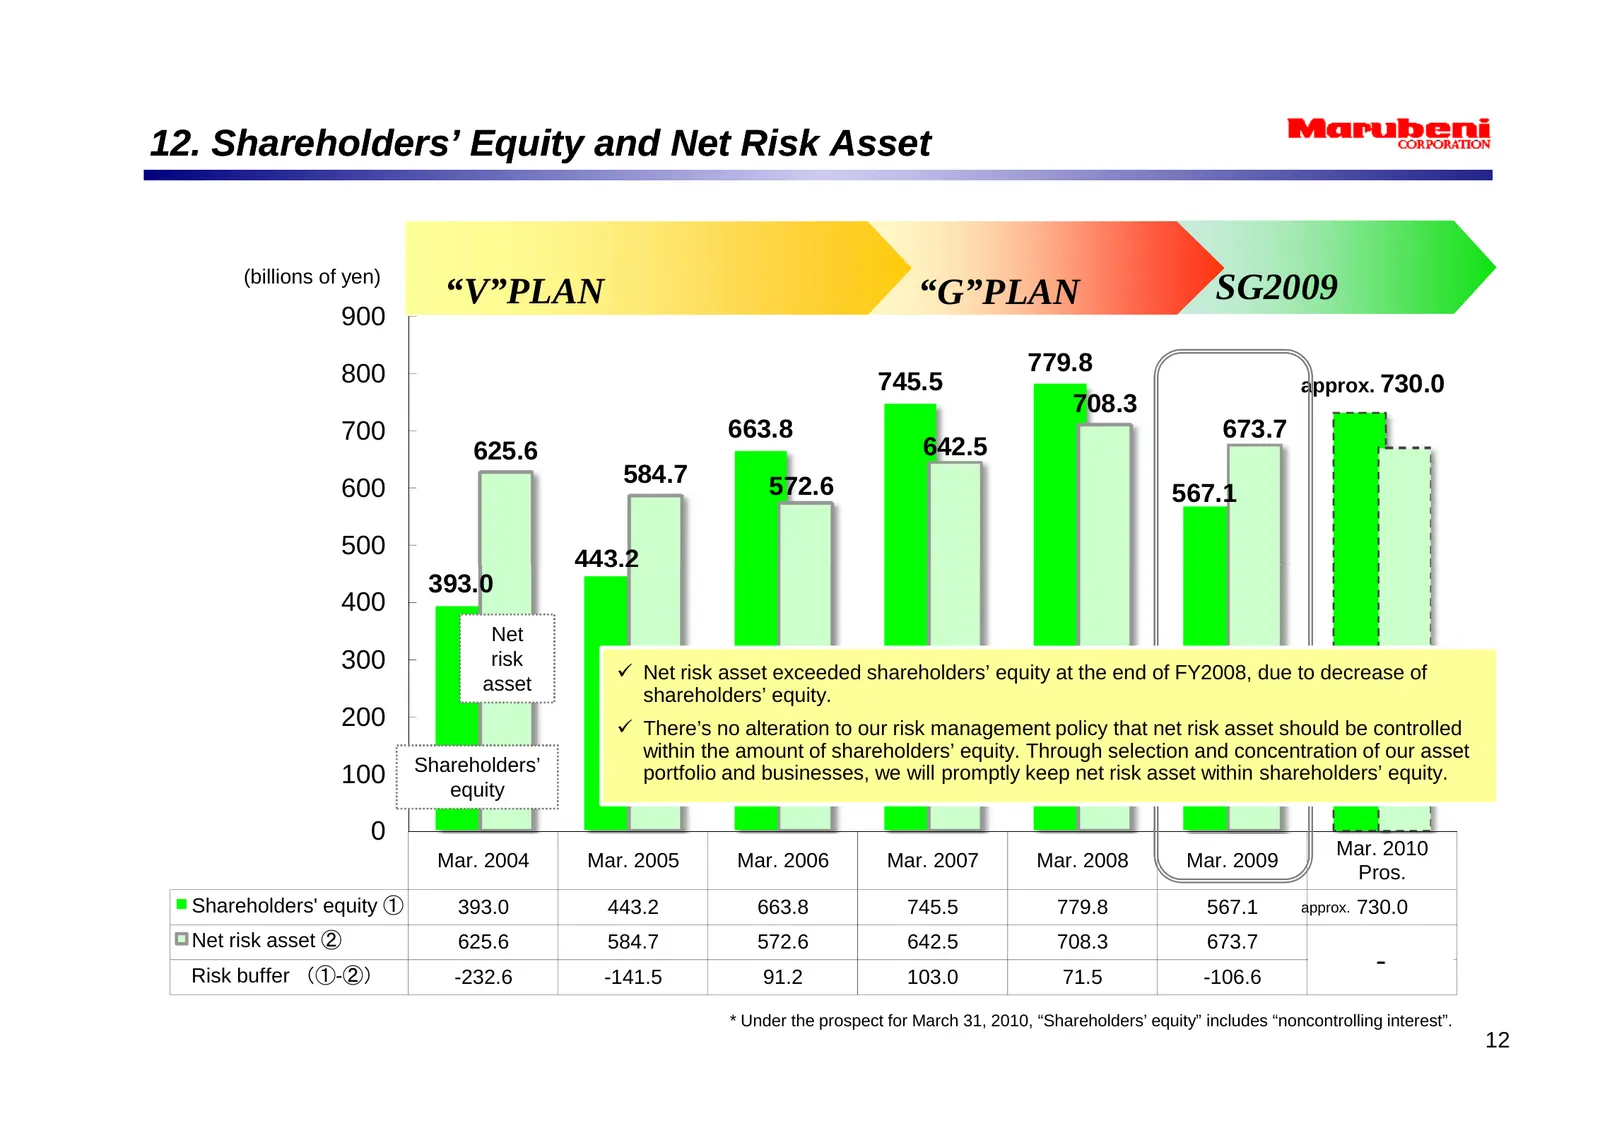
12. Shareholders’ Equity and Net Risk Asset (billions of yen) “V”PLAN “G”PLAN SG2009 900 800 779.8 745.5 approx. 730.0 708.3 700 663.8 673.7 625.6 642.5 584.7 572.6 600 567.1 500 443.2 393.0 400 Net 300 risk 9 Net risk asset exceeded shareholders’ equity at the end of FY2008, due to decrease of asse
Slide 15: Revision of SG2009 Targets
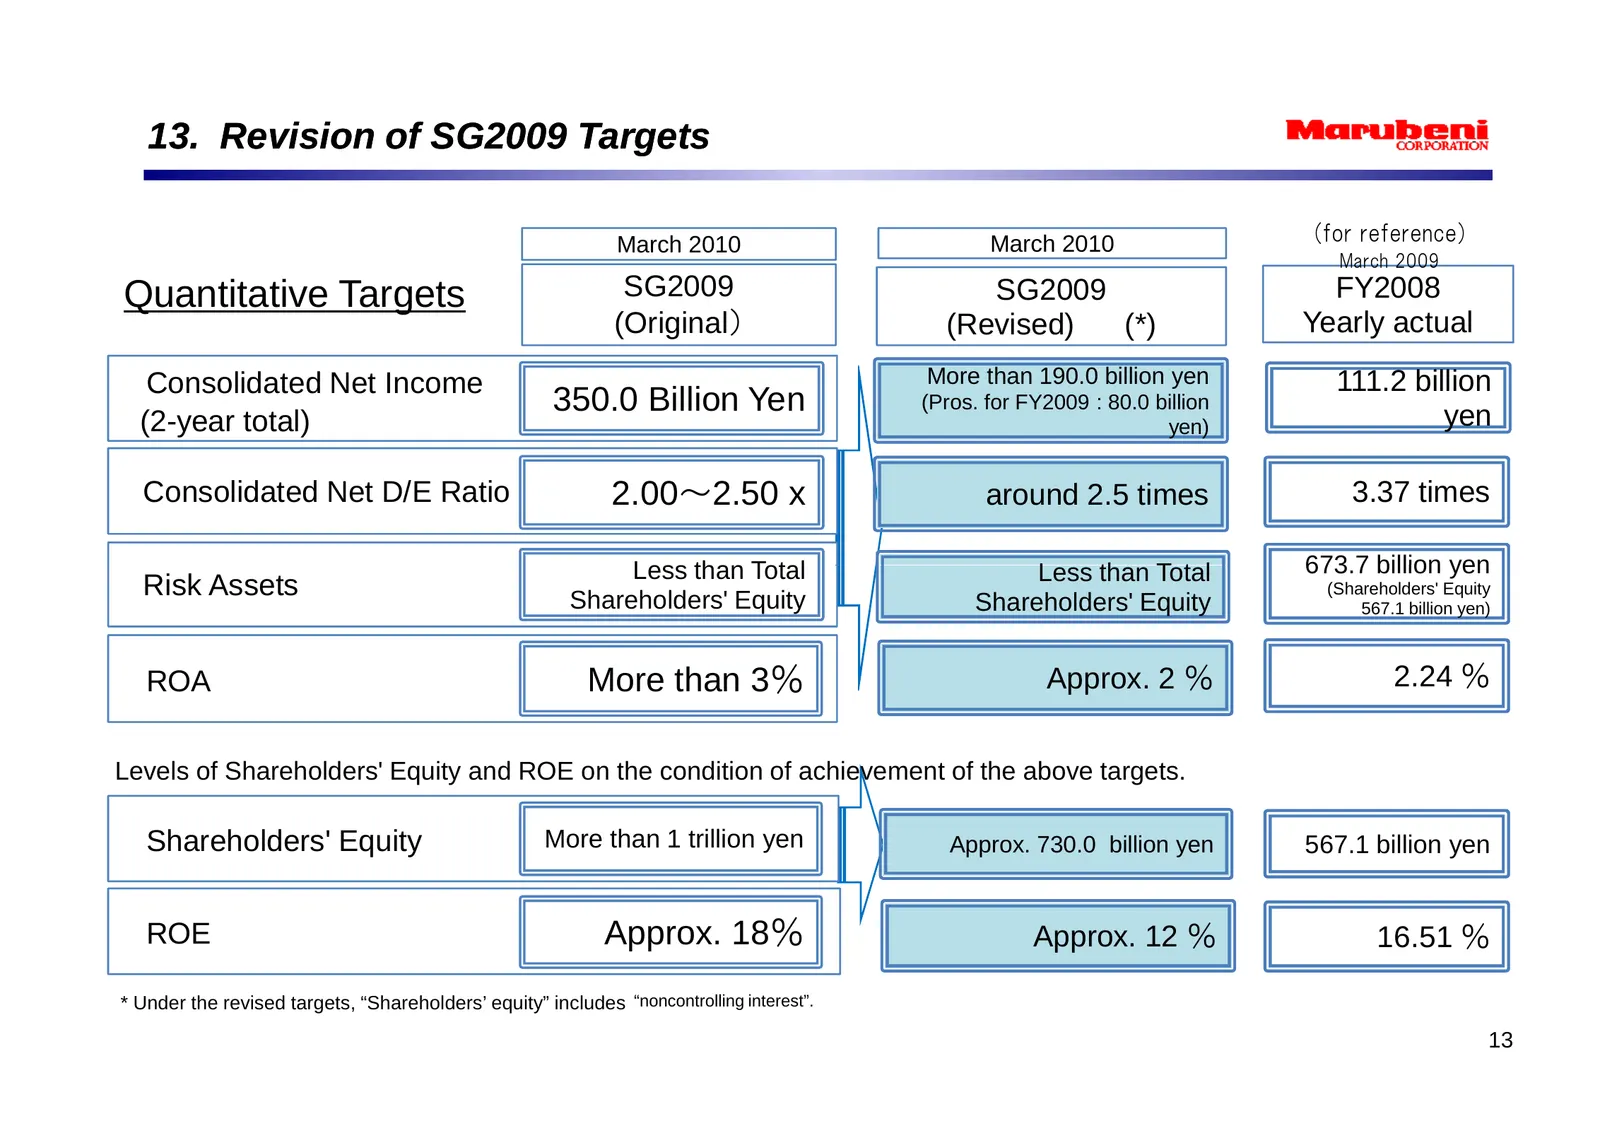
13. Revision of SG2009 Targets March 2010 March 2010 (for reference) March 2009 Quantitative Targets SG2009 SG2009 FY2008 (Original) (Revised) (*) Yearly actual Consolidated Net Income More than 190.0 billion yen 111.2 billion 350.0 Billion Yen (Pros. for FY2009 : 80.0 billion yen (2-year total) yen
Slide 16: New Investments
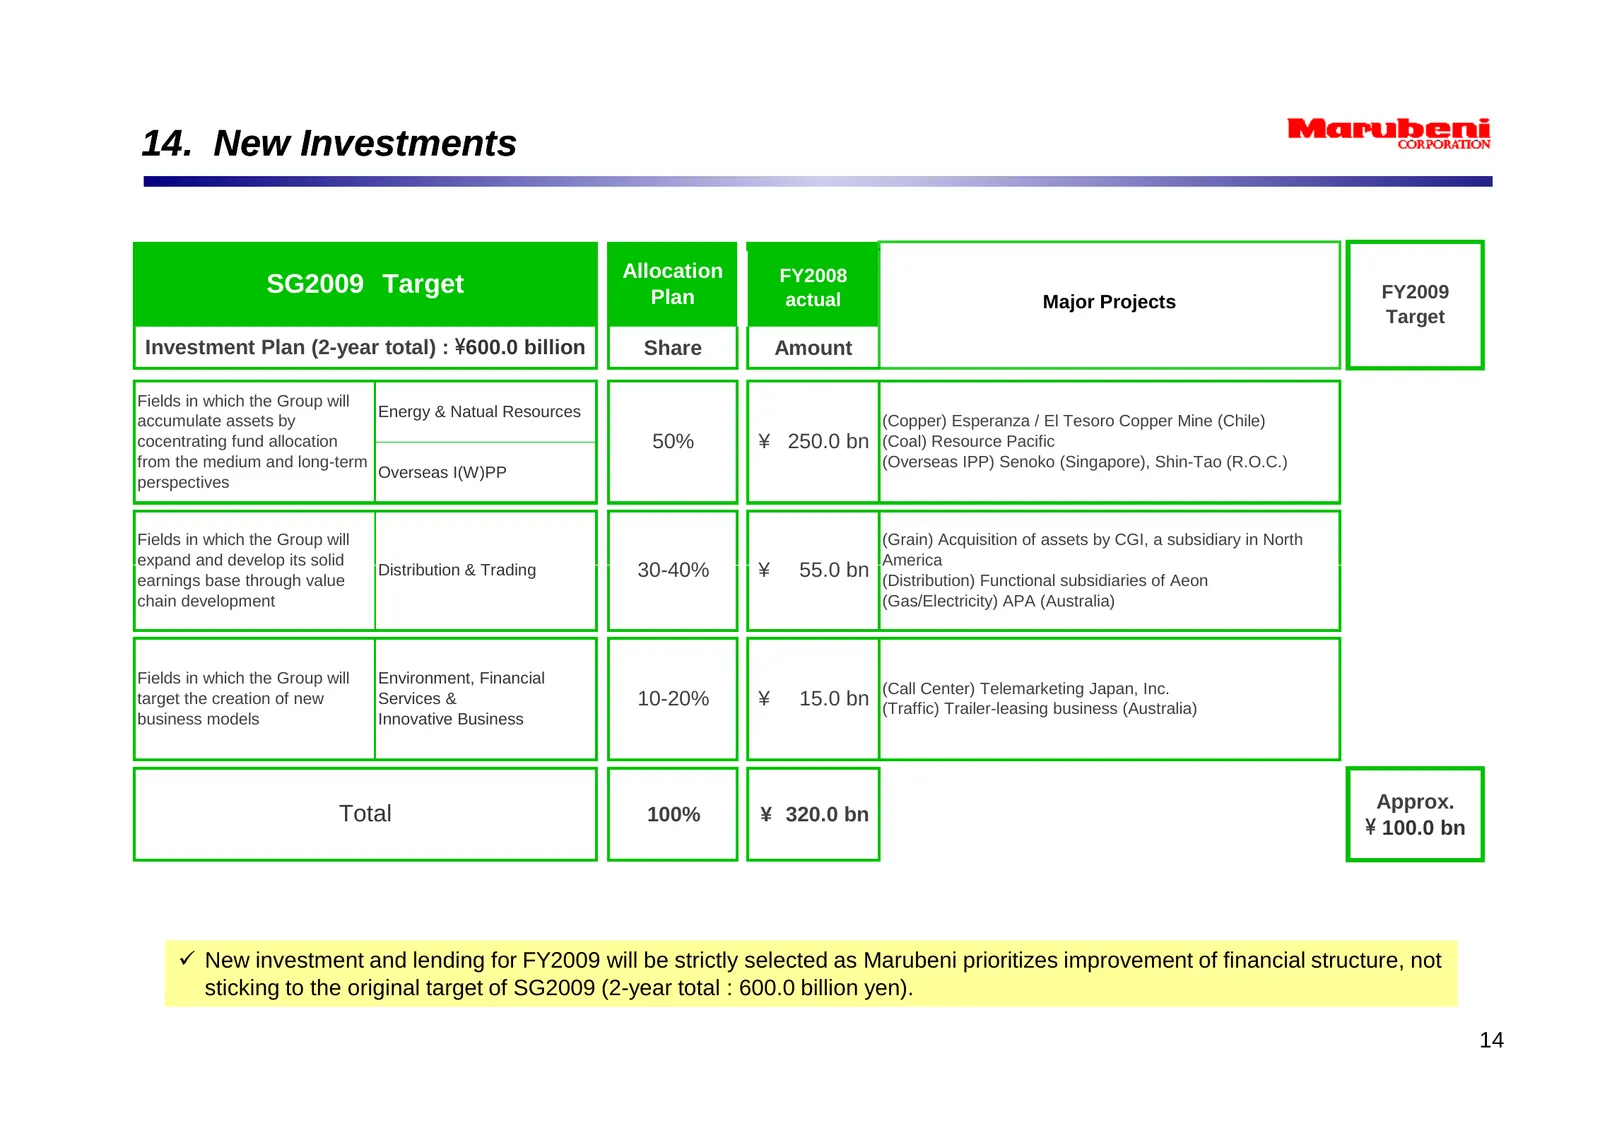
14. New Investments Allocation FY2008 SG2009 Target Plan FY2009 actual Major Projects Target Investment Plan (2-year total) : \600.0 billion Share Amount Fields in which the Group will Energy & Natual Resources accumulate assets by (Copper) Esperanza / El Tesoro Copper Mine (Chile) cocentrating fund
Slide 17: Dividends
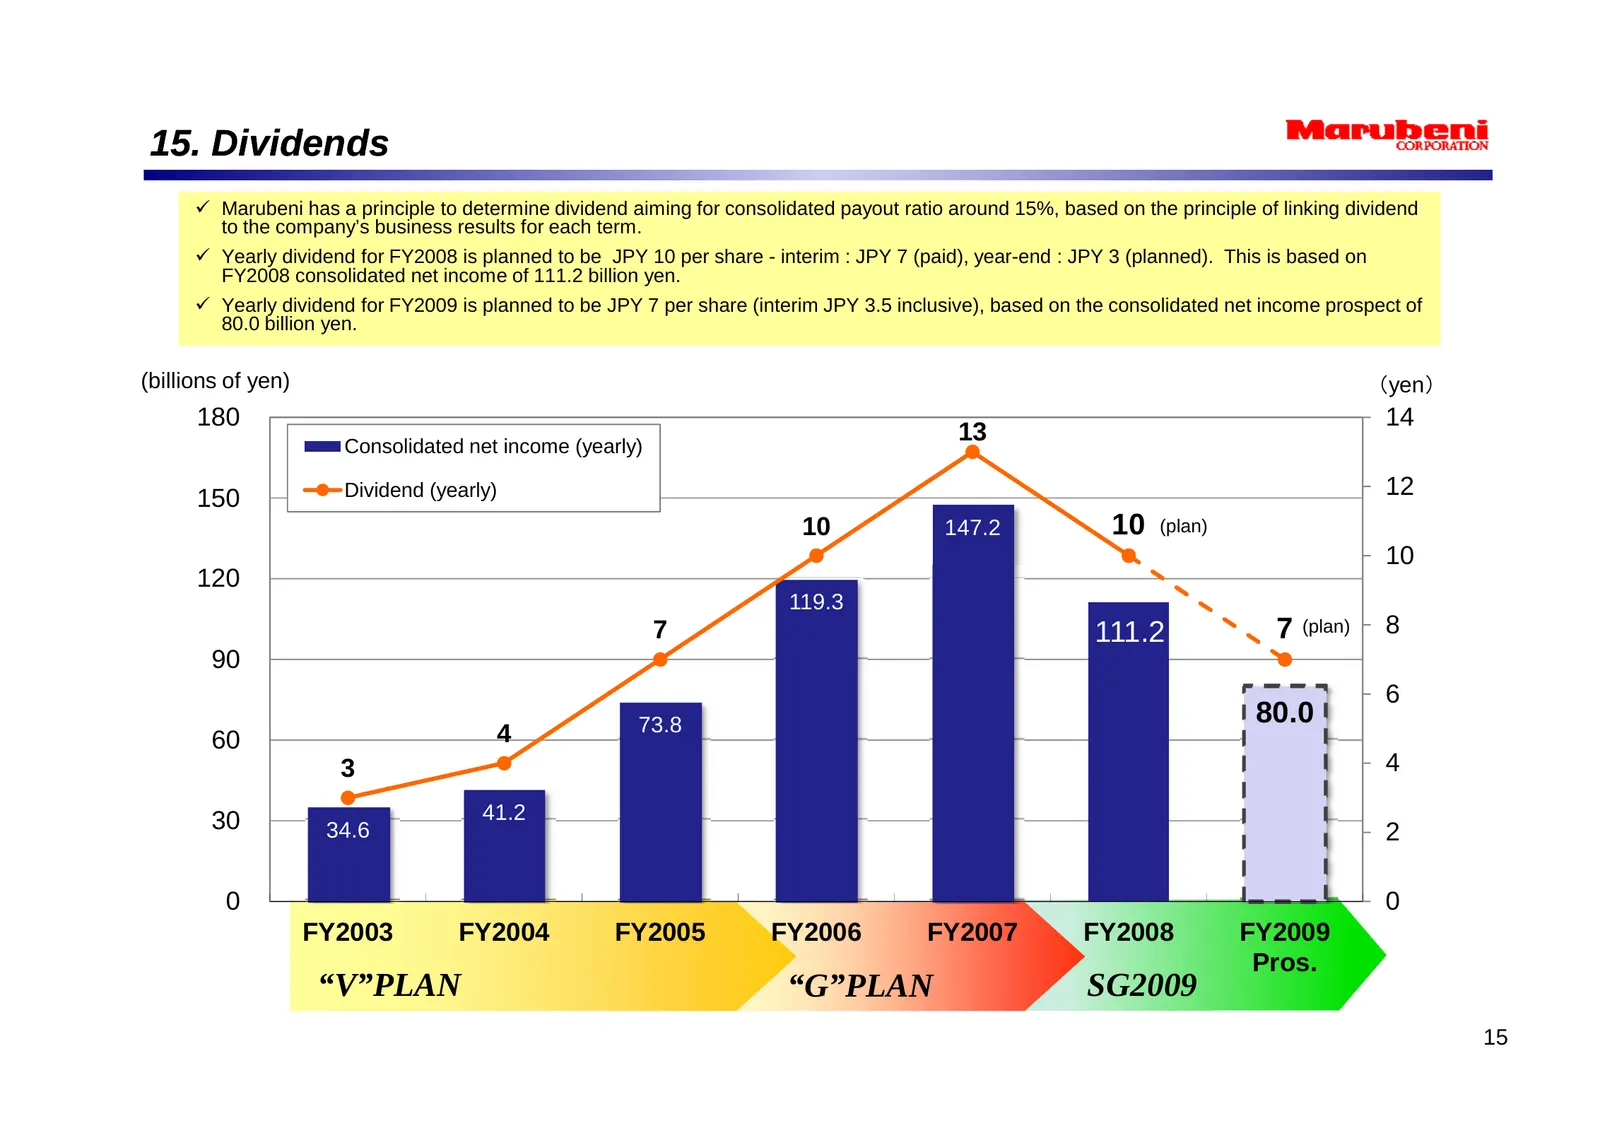
15. Dividends 9 Marubeni has a principle to determine dividend aiming for consolidated payout ratio around 15%, based on the principle of linking dividend to the company’s business results for each term. 9 Yearly dividend for FY2008 is planned to be JPY 10 per share - interim : JPY 7 (paid), year-en
Slide 18: Net Income by Segment
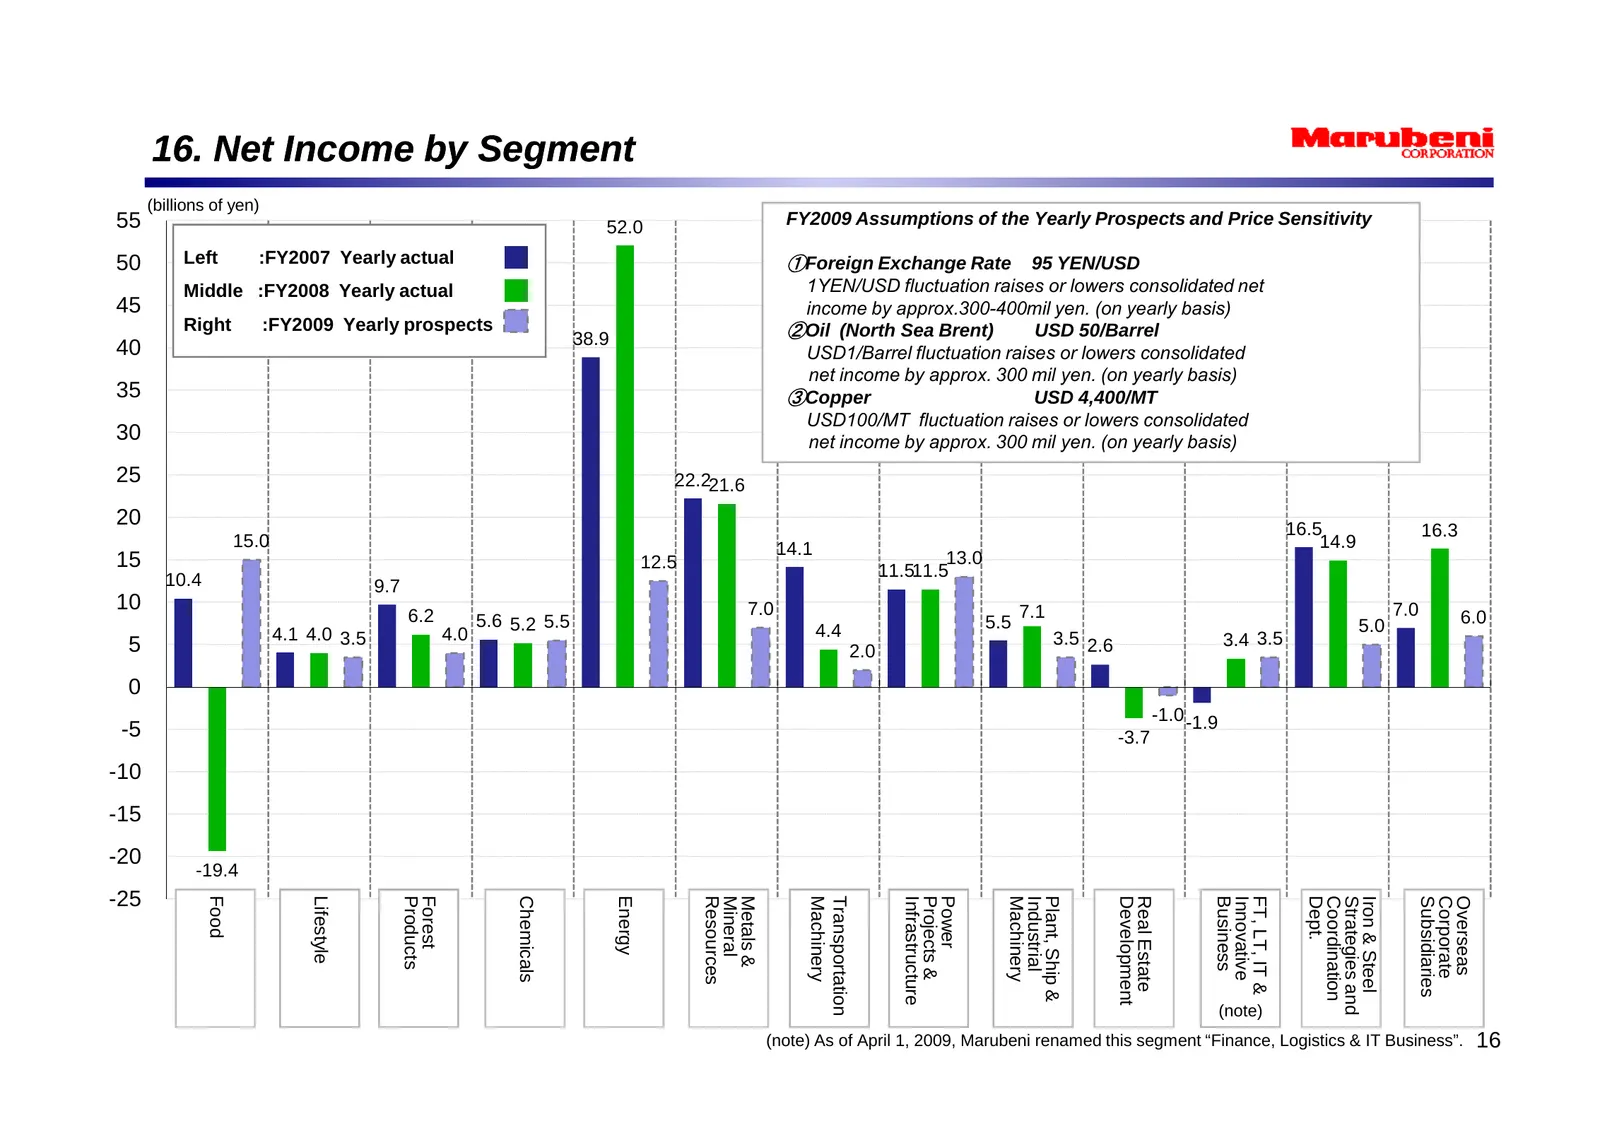
16. Net Income by Segment (billions of yen) 55 52.0 FY2009 Assumptions of the Yearly Prospects and Price Sensitivity 50 Left :FY2007 Yearly actual ①Foreign Exchange Rate 95 YEN/USD Middle :FY2008 Yearly actual 1YEN/USD fluctuation raises or lowers consolidated net 45 income by approx.300-400mil yen.
Slide 19: Reference 1: Worldwide Strategy of our Grain Trading Business
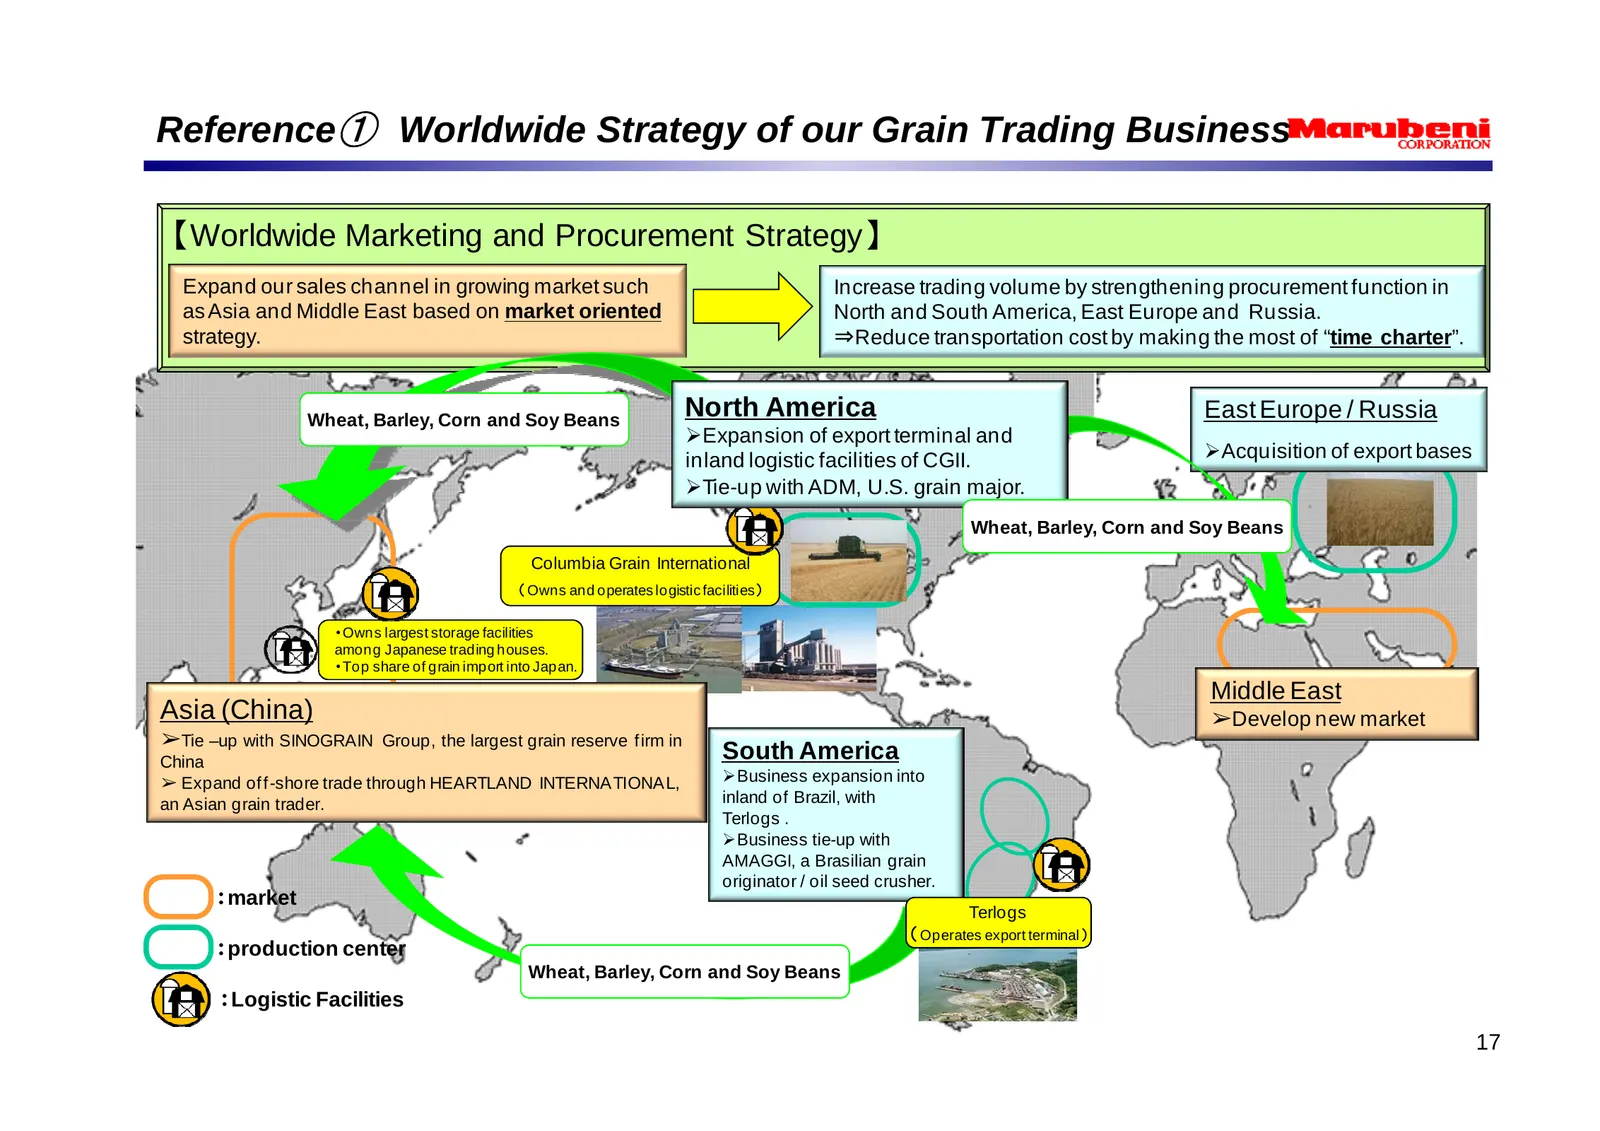
Reference① Worldwide Strategy of our Grain Trading Business 【Worldwide Marketing and Procurement Strategy】 Expand our sales channel in growing market such Increase trading volume by strengthening procurement function in as Asia and Middle East based on market oriented North and South America, East E
Slide 20: Reference 2: Overseas IPP
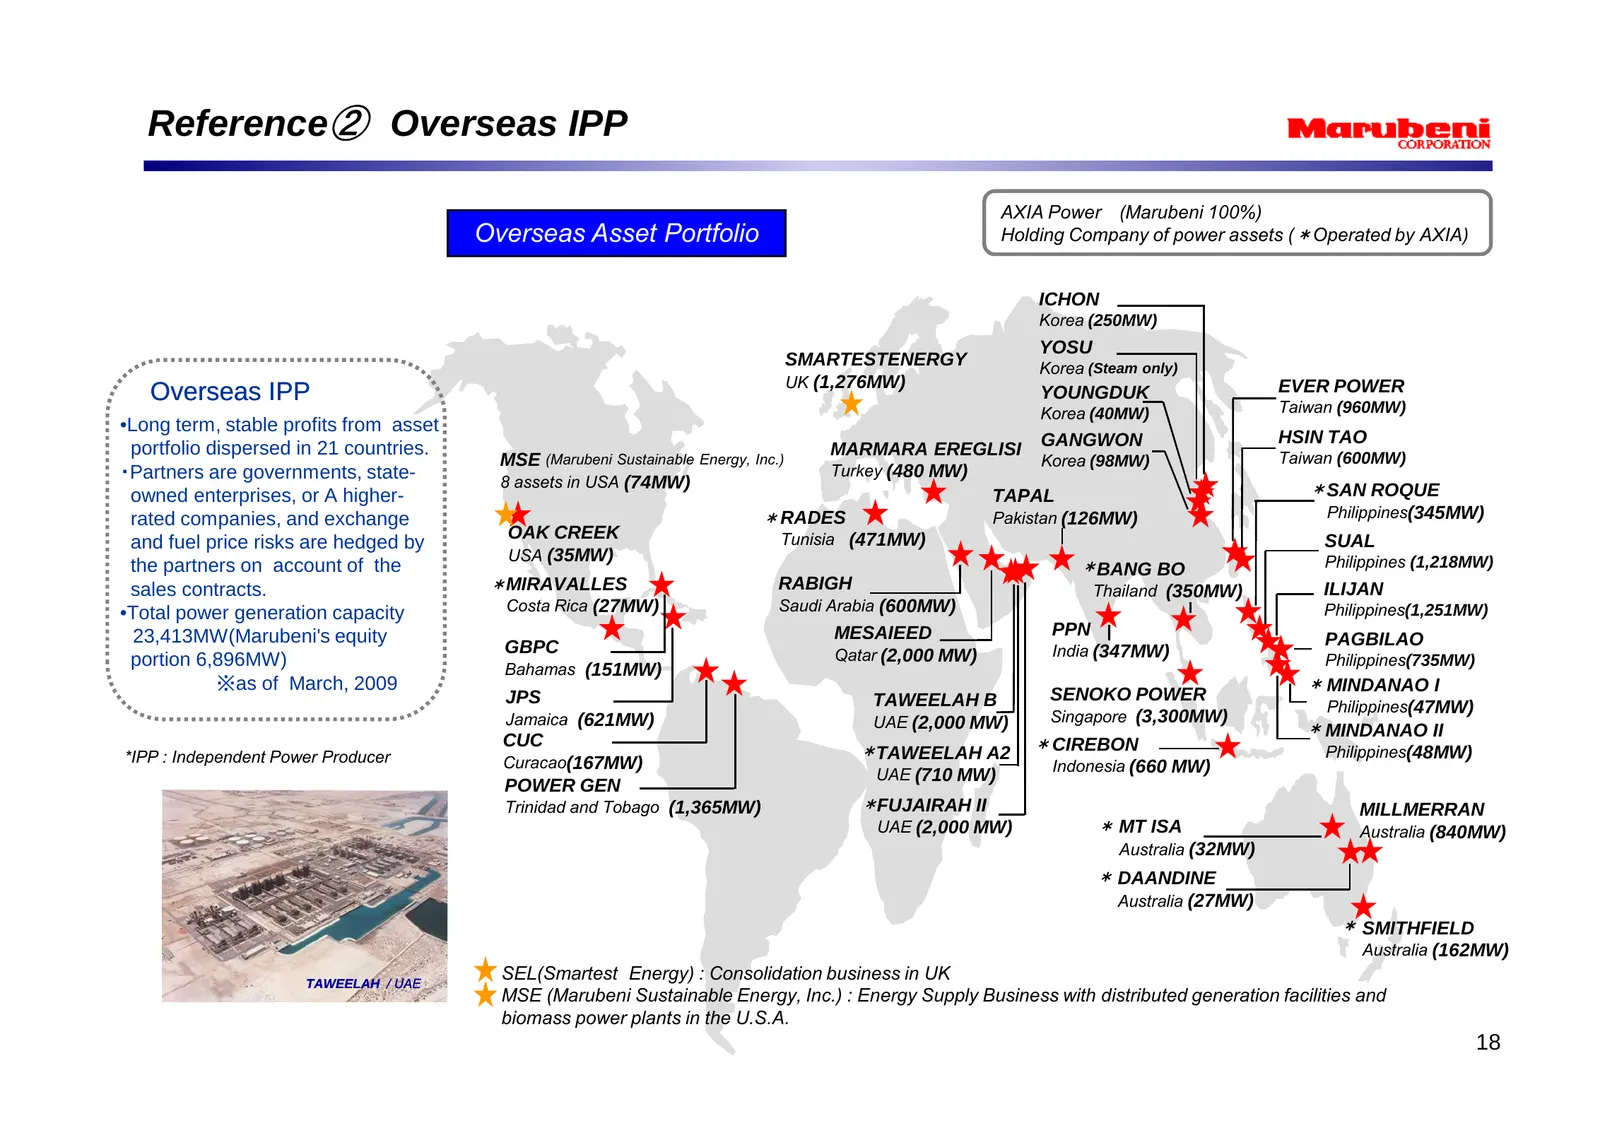
Reference② Overseas IPP AXIA Power (Marubeni 100%) Overseas Asset Portfolio Holding Company of power assets (*Operated by AXIA) ICHON Korea (250MW) YOSU SMARTESTENERGY Korea (Steam only) UK (1,276MW) EVER POWER Overseas IPP YOUNGDUK Taiwan (960MW) Korea (40MW) •Long term, stable profits from asset H
Slide 21: Reference 3-1: Recently Announced Major Projects
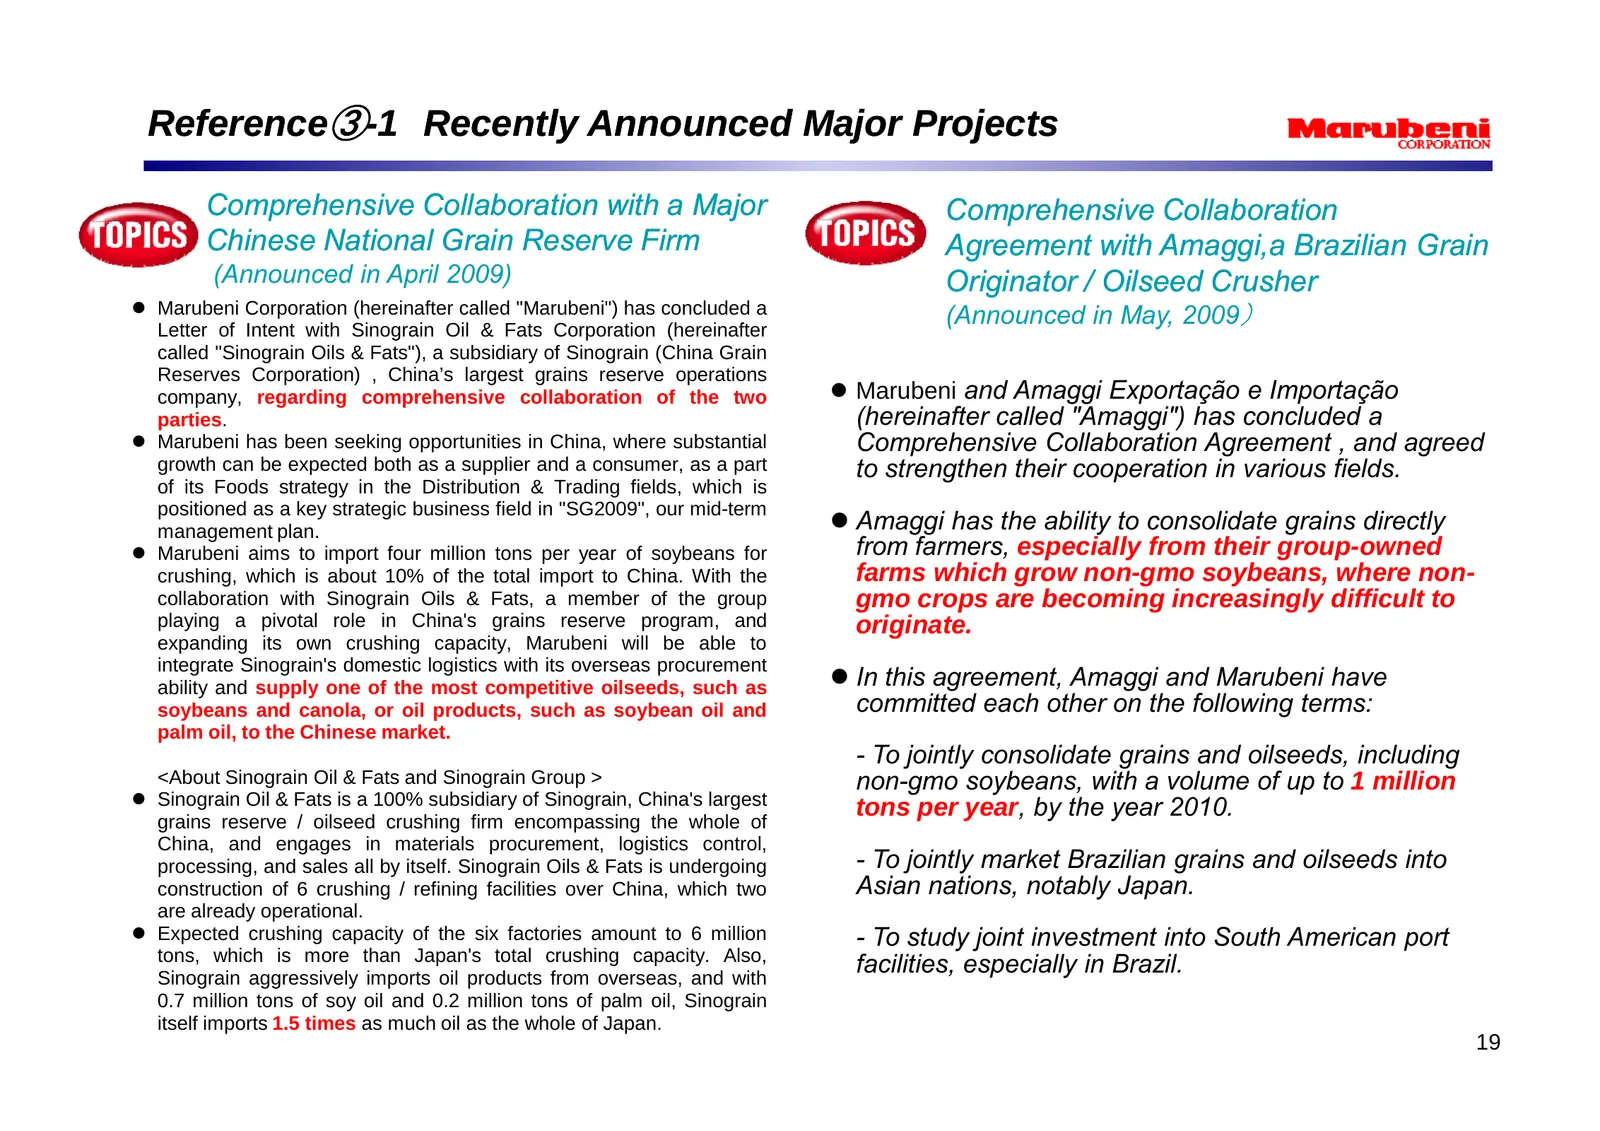
Reference③-1 Recently Announced Major Projects Comprehensive Collaboration with a Major Comprehensive Collaboration Chinese National Grain Reserve Firm Agreement with Amaggi,a Brazilian Grain (Announced in April 2009) Originator / Oilseed Crusher z Marubeni Corporation (hereinafter called "Marubeni"
Slide 22: Reference 3-2: Recently Announced Major Projects
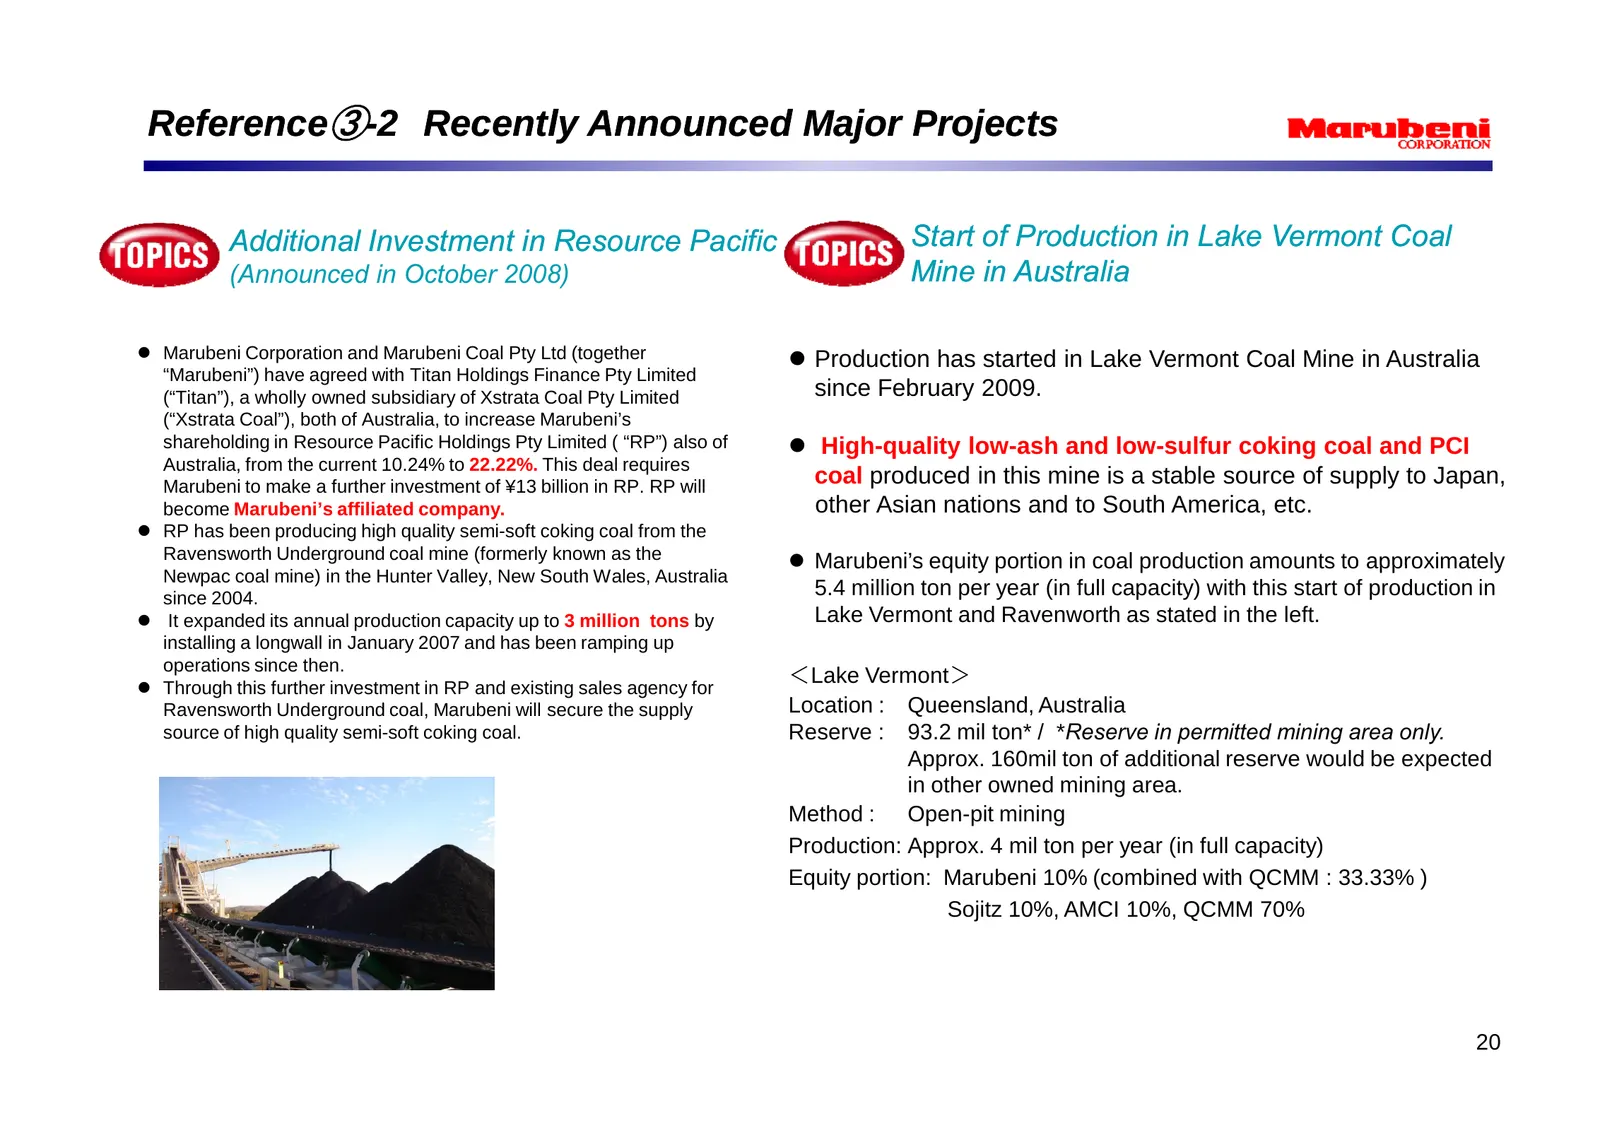
Reference③-2 Recently Announced Major Projects Additional Investment in Resource Pacific Start of Production in Lake Vermont Coal (Announced in October 2008) Mine in Australia z Marubeni Corporation and Marubeni Coal Pty Ltd (together z Production has started in Lake Vermont Coal Mine in Australia “
Slide 23: Reference 3-3: Recently Announced Major Projects
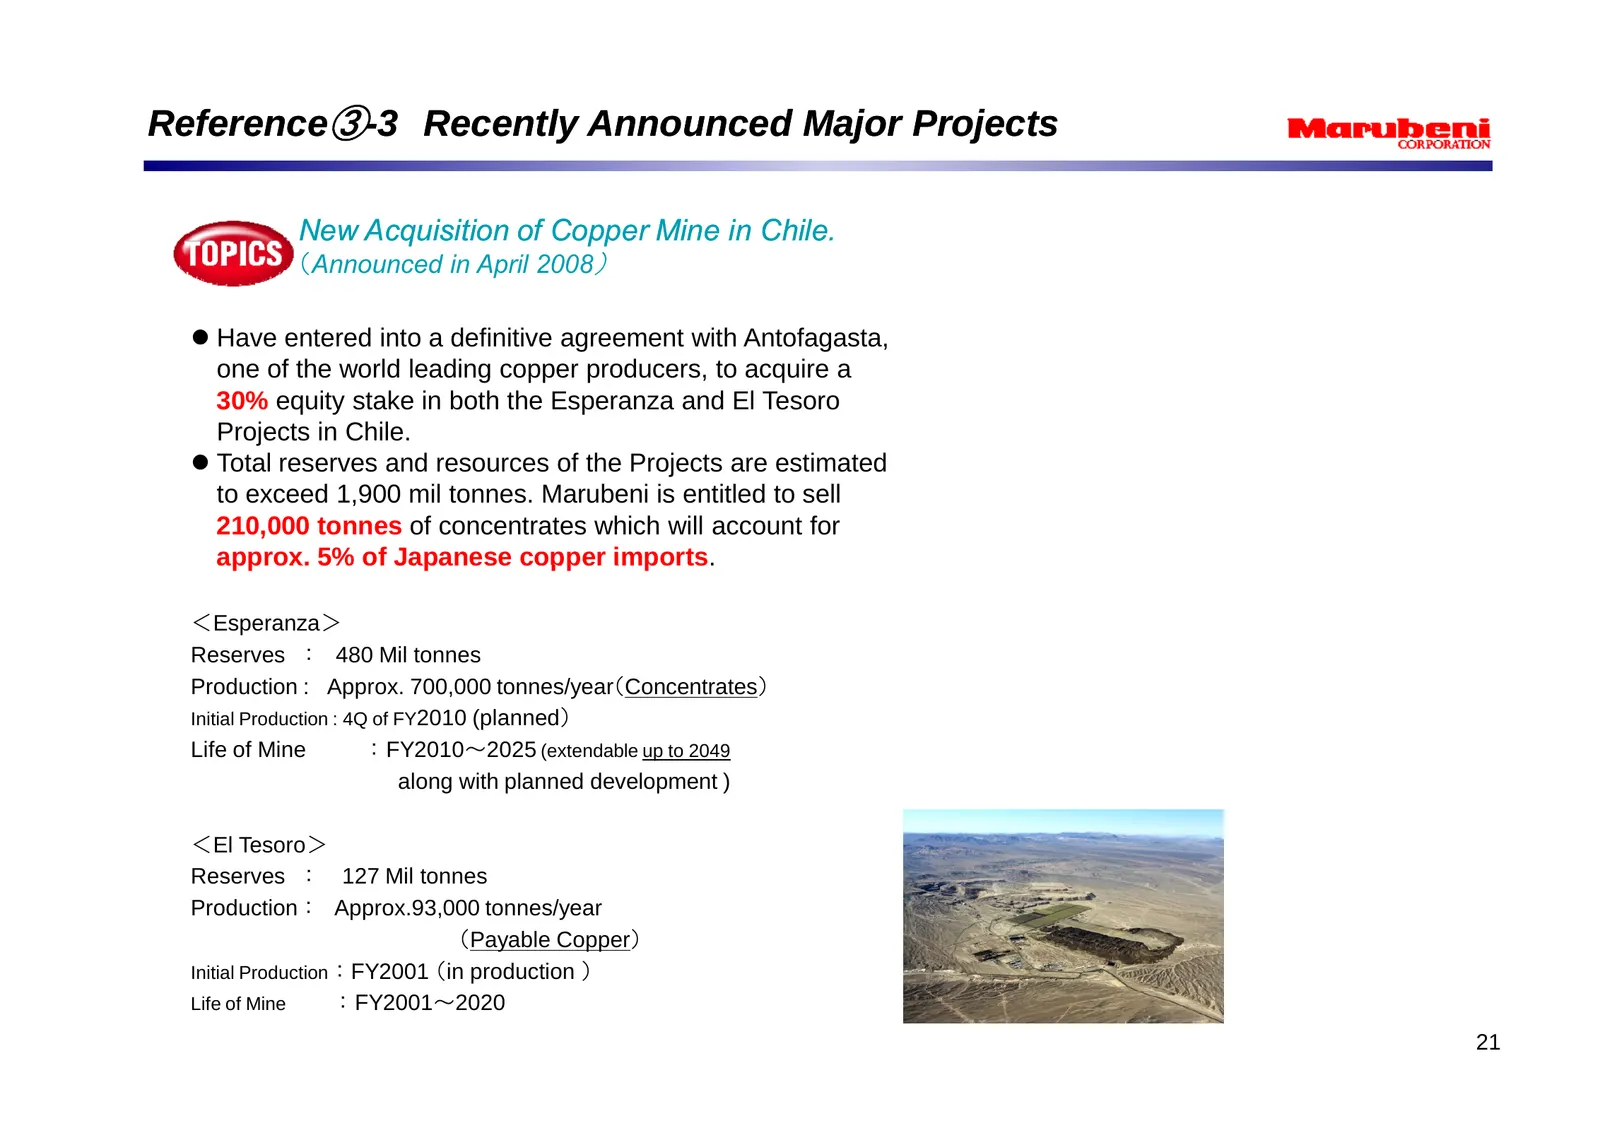
Reference③-3 Recently Announced Major Projects New Acquisition of Copper Mine in Chile. (Announced in April 2008) z Have entered into a definitive agreement with Antofagasta, one of the world leading copper producers, to acquire a 30% equity stake in both the Esperanza and El Tesoro Projects in Chil
Slide 24: Reference 4: Number and Net Profits & Losses of Group Firms
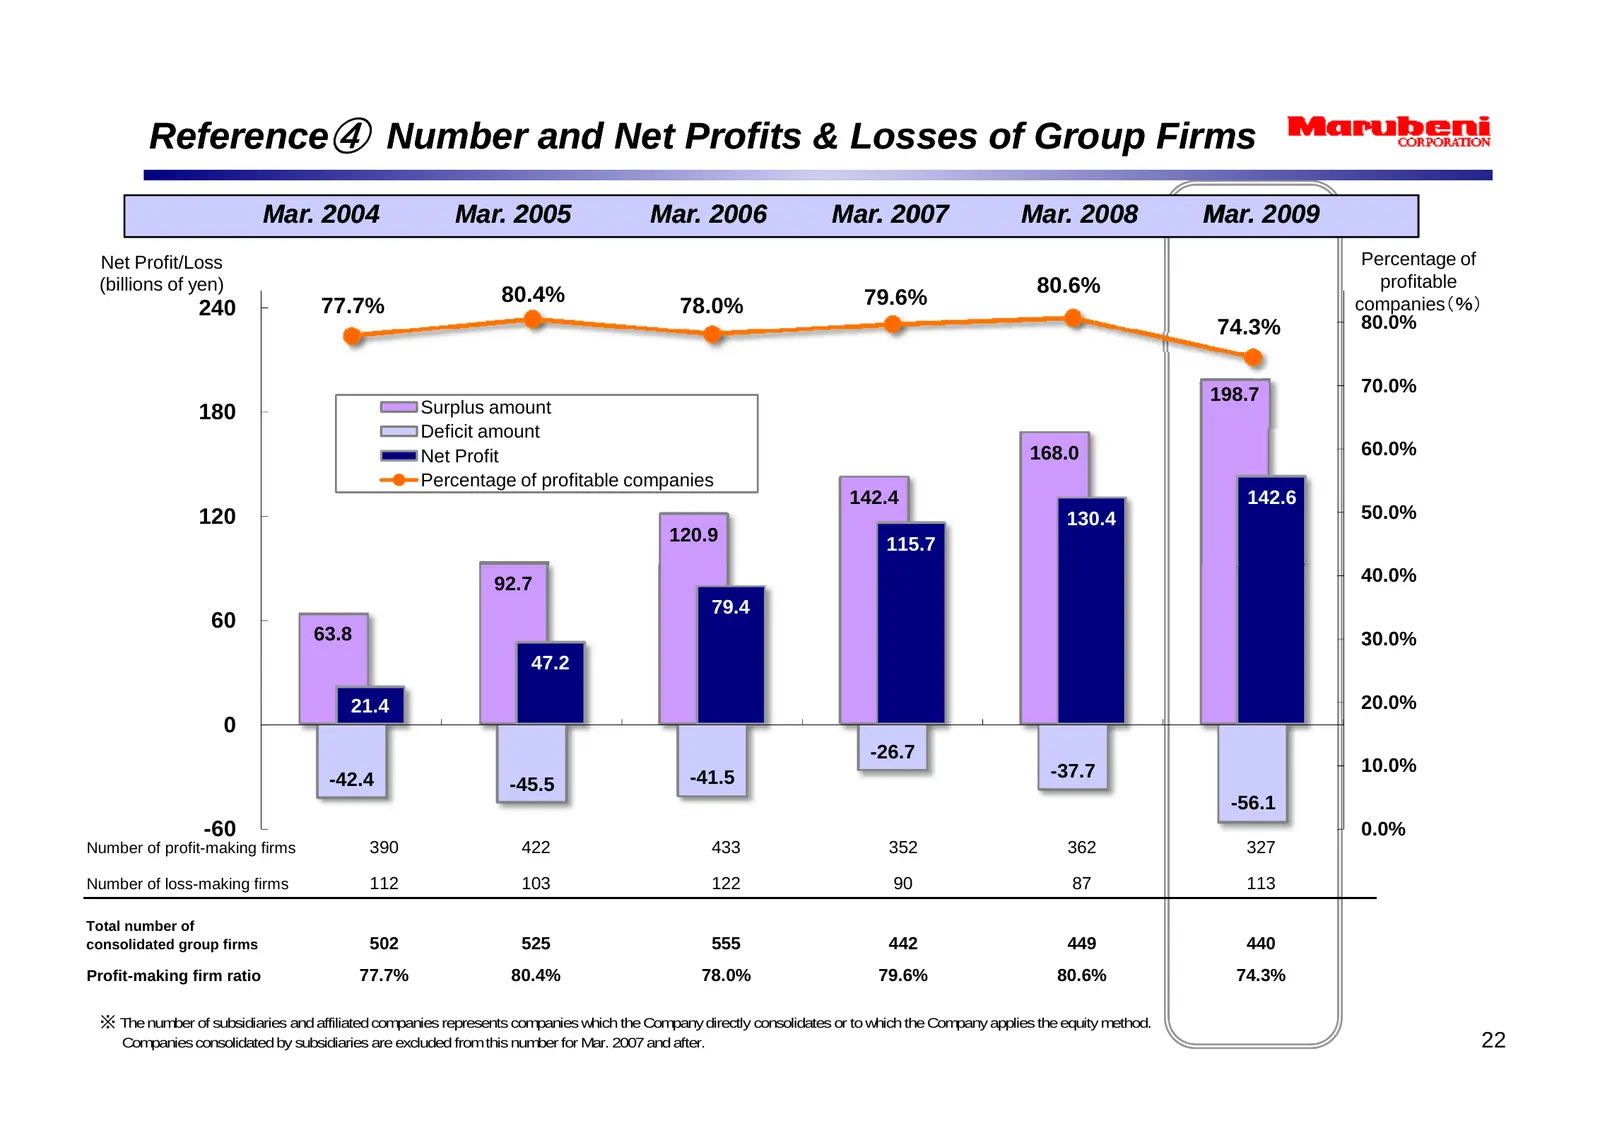
Reference④ Number and Net Profits & Losses of Group Firms Mar.. 2004 Mar Mar. Mar. 2005 Mar. 2006 Mar. 2007 Mar. 2008 Mar. 2009 Net Profit/Loss Percentage of (billions of yen) 80.6% profitable 80.4% 79.6% companies(%) 240 77.7% 78.0% 74.3% 80.0% 198.7 70.0% 180 Surplus amount Deficit amount Net Prof
Slide 25: Reference 5: Trends in Company Ratings
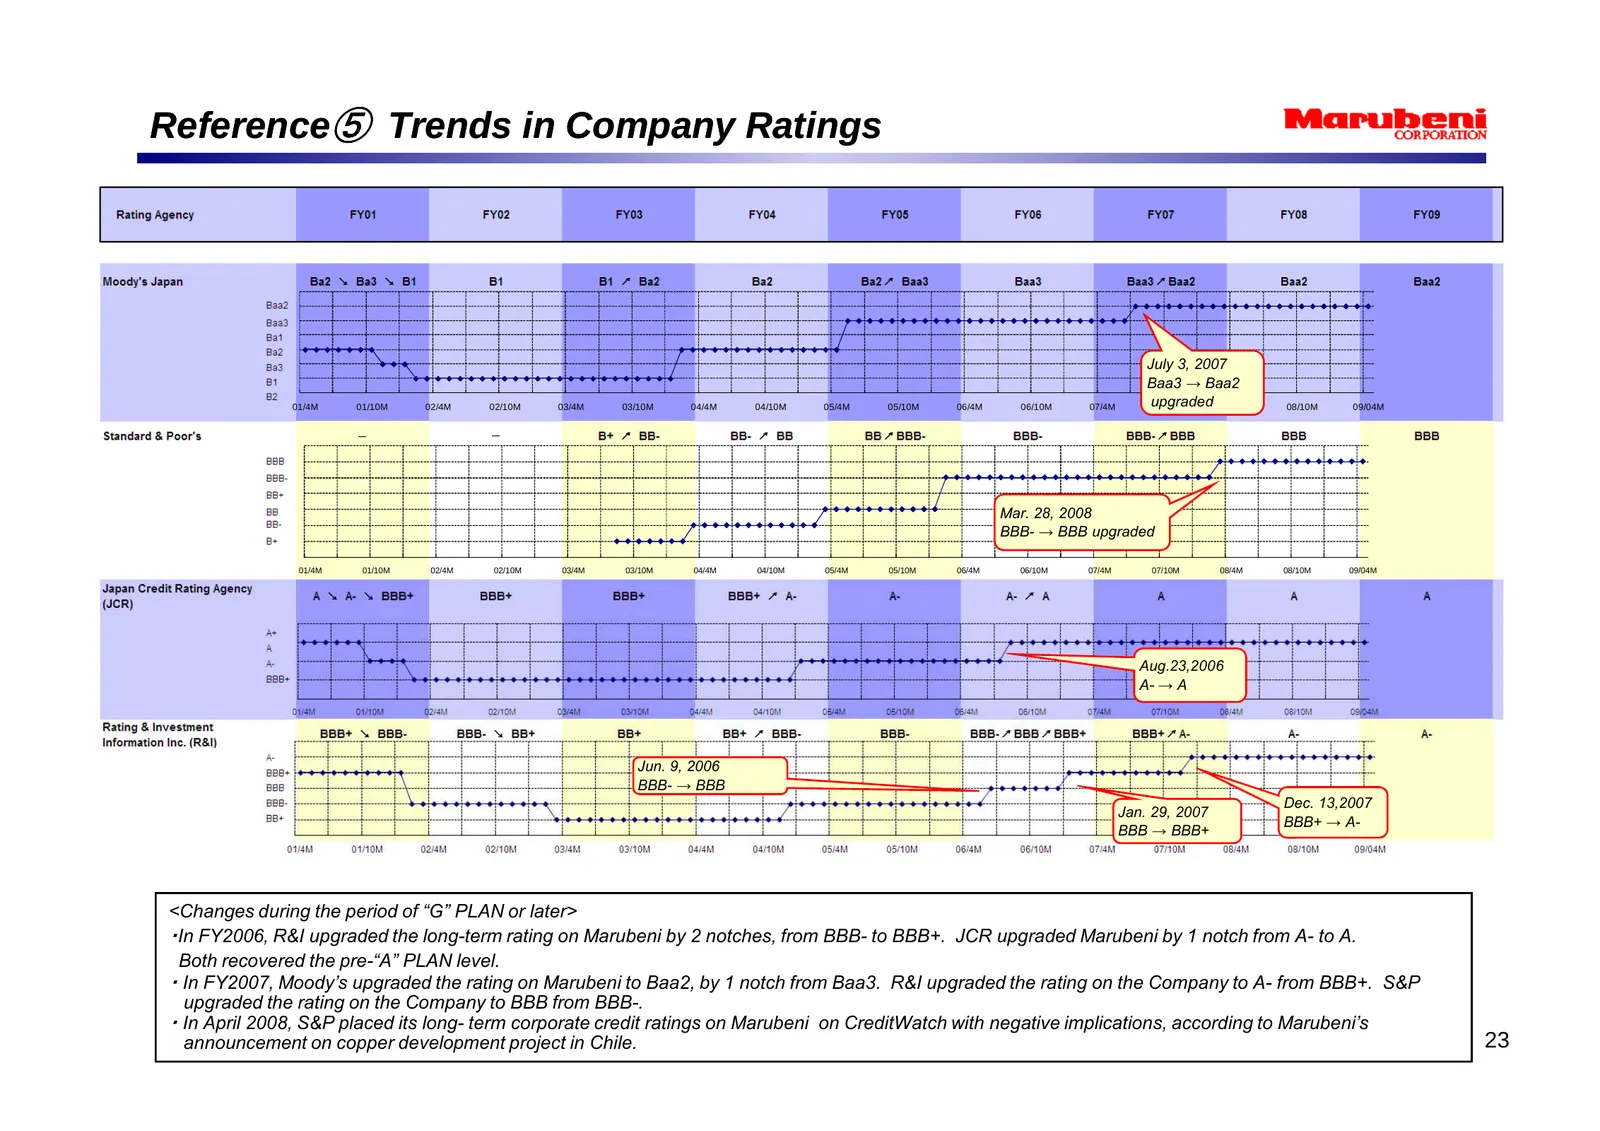
Reference⑤ Trends in Company Ratings July 3, 2007 Baa3 → Baa2 01/4M 01/10M 02/4M 02/10M 03/4M 03/10M 04/4M 04/10M 05/4M 05/10M 06/4M 06/10M 07/4M upgraded 07/10M 08/4M 08/10M 09/04M Mar. 28, 2008 BBB- → BBB upgraded 01/4M 01/10M 02/4M 02/10M 03/4M 03/10M 04/4M 04/10M 05/4M 05/10M 06/4M 06/10M 07/4M
Source: Internet Archive copy of marubeni.com
More decks from Marubeni Corporation
 Investor Day (September 2026)64 slides · Sep 9, 2026
 Investor Presentation (June 2026)13 slides · June 2026
 ESG Presentation (December 2019)14 slides · Dec 5, 2019
 FY2013 Earnings Presentation36 slides · May 13, 2013
 FY2012 Earnings Presentation29 slides · May 10, 2012
 Q3 FY2012/3 Earnings Presentation21 slides · Feb 2, 2012