EPIQ Systems — FY2014 Earnings Presentation
11 slides from EPIQ Systems's earnings presentation, Mar 2, 2015
Slide 1: Fourth Quarter and Fiscal Year 2014 Earnings Conference Call
epia SYSTEMS Fourth Quarter and Fiscal Year 2014 Earnings Conference Call March 2, 2015 NASDAQ: EPIQ www.epiqsystems.com
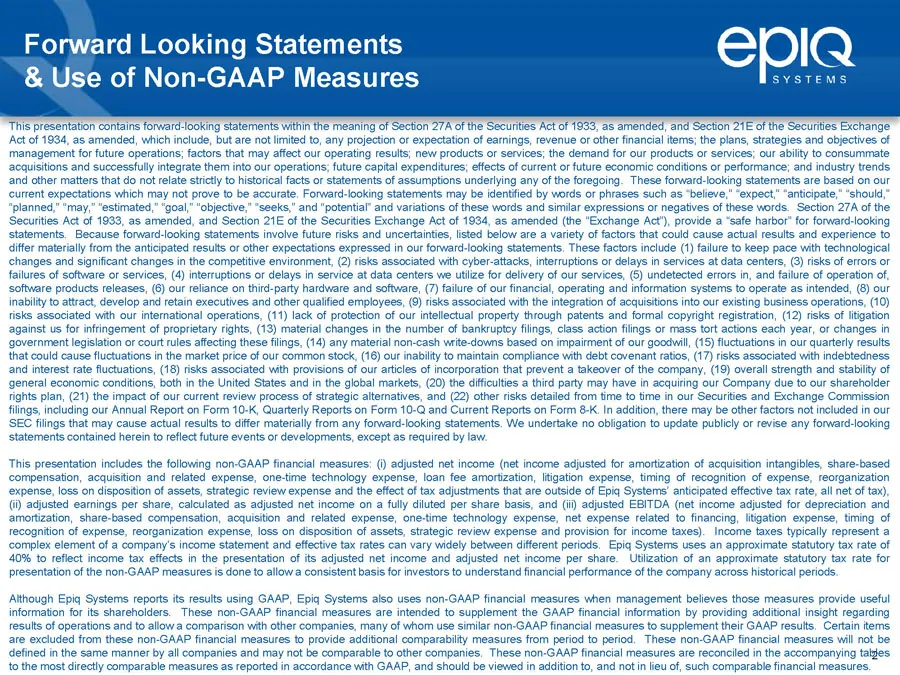
Slide 2: Forward Looking Statements & Use of Non-GAAP Measures
Forward Looking Statements EplQ & Use of Non-GAAP Measures SYSTEM This presentation contains forward-looking statements within the meaning of Section 27A of the Securities Act of 1933, as amended, and Section 21E of the Securities Exchange Act of 1934, as amended, which include, but are not limited
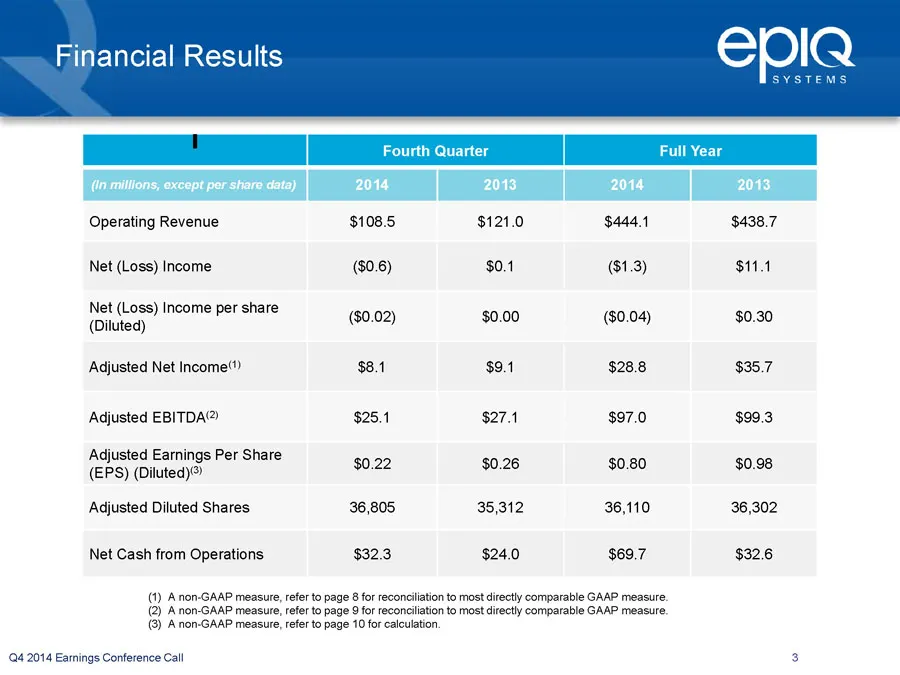
Slide 3: Financial Results
Financial Results EplQ SYSTEMS Ge Operating Revenue $121.0 $444.1 $438.7 Net (Loss) Income (90.6) $0.1 ($1.3) sit Net (Loss) Income per share (luted) ($0.02) $0.00 ($0.04) $0.30 Adjusted Net Income‘) $8.1 so $28.8 $95.7 Adjusted EBITDA® $25.1 $27.4 $97.0 $99.3 Adjusted Earnings Per Share (EPS) (Dilu
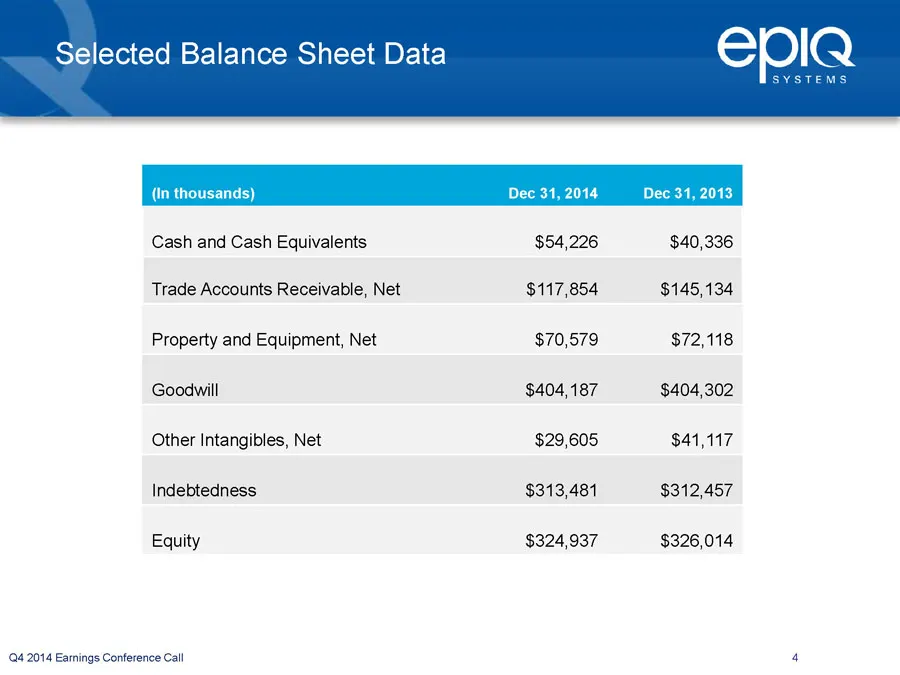
Slide 4: Selected Balance Sheet Data
Selected Balance Sheet Data (in thousands) Dec 31, 2014 Dec 31, 2013 Cash and Cash Equivalents $54,226 $40,336 Trade Accounts Receivable, Net $117,854 $145,134 Property and Equipment, Net $70,579 $72,118 Goodwill $404,187 $404,302 Other Intangibles, Net $29,605 $41,117 Indebtedness $313,481 $312,457
Slide 5: Cash from Operating Activities
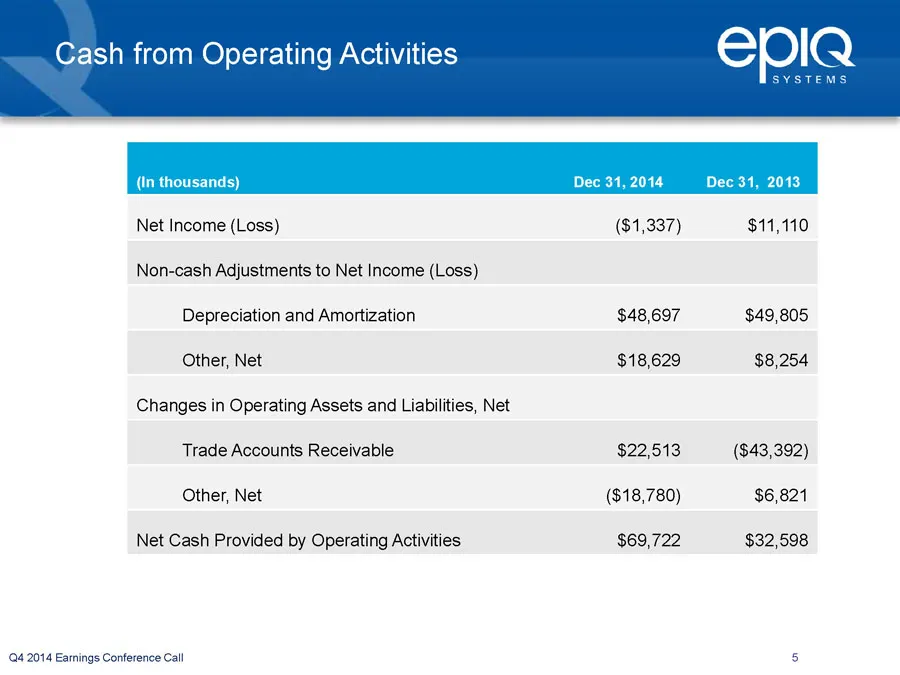
Cash from Operating Activities (in thousands) Dec 31,2014 Dec 31 Net Income (Loss) ($1,337) $11,110 Non-cash Adjustments to Net Income (Loss) Depreciation and Amortization $48,697 $49,805 Other, Net $18,629 $8,254 Changes in Operating Assets and Liabilities, Net Trade Accounts Receivable $22,513 ($4
Slide 6: Segment Operating Results
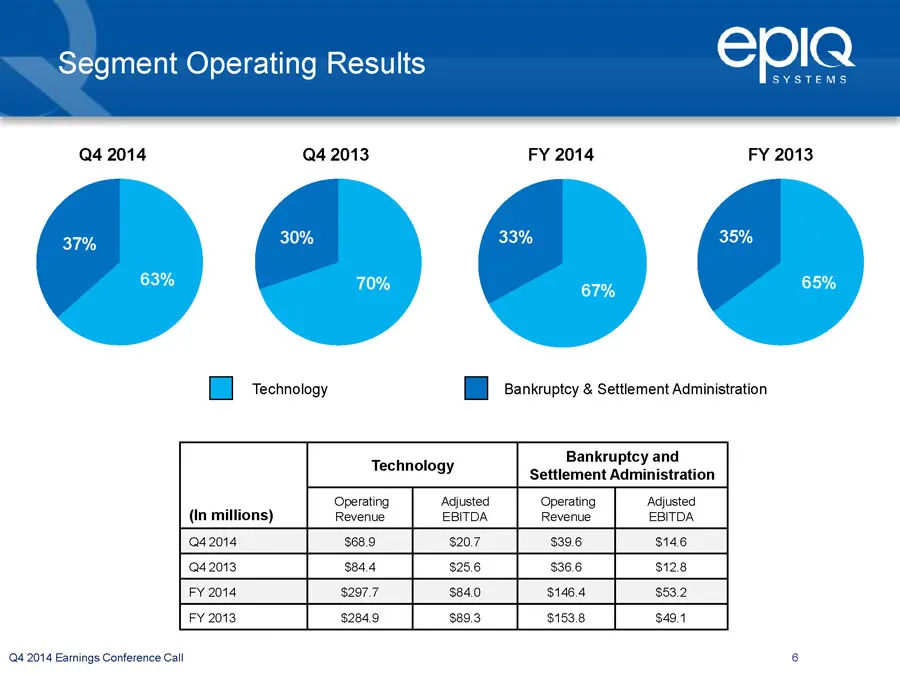
Segment Operating Results Q4 2014 Q4 2013 FY 2014 FY 2013 [Bh technology [BB Bankruptcy & settlement Administration Bankruptcy and Technology Settlement Administration Operating ‘Adjusted Operating ‘Adjusted (In millions) Revenue EBITDA Revenue EBITDA 042014 $68.9 $207 $396 $146 042013, $04.4 $256 $
Slide 7: 2015 Financial Guidance
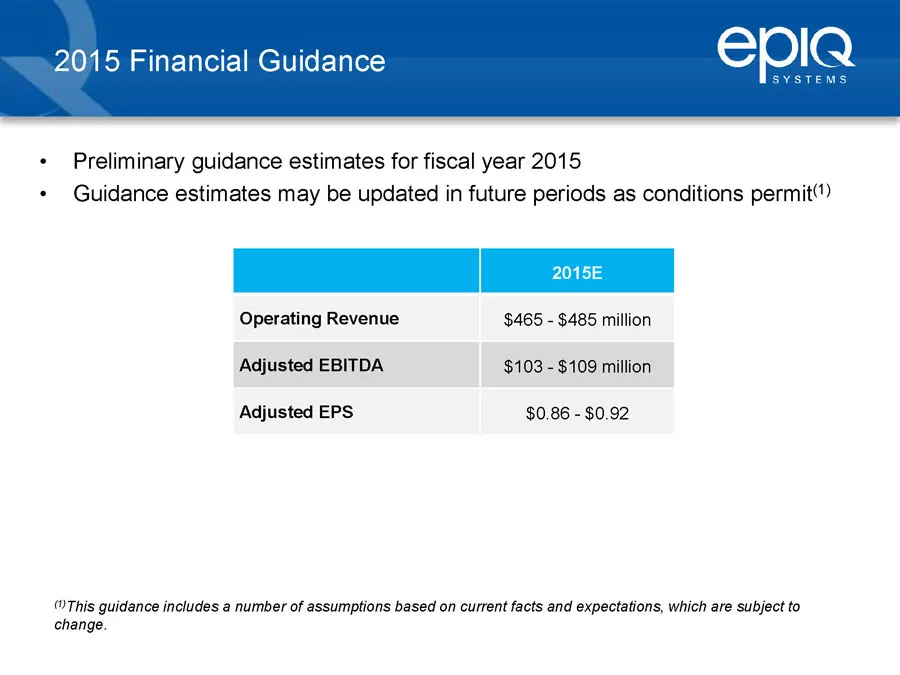
2015 Financial Guidance Preliminary guidance estimates for fiscal year 2015 Guidance estimates may be updated in future periods as conditions permit‘) Operating Revenue $465 - $485 million Adjusted EBITDA $103 - $109 million Adjusted EPS $0.86 - $0.92 This guidance includes a number of assumptions b
Slide 8: Adjusted Net Income Reconciliation
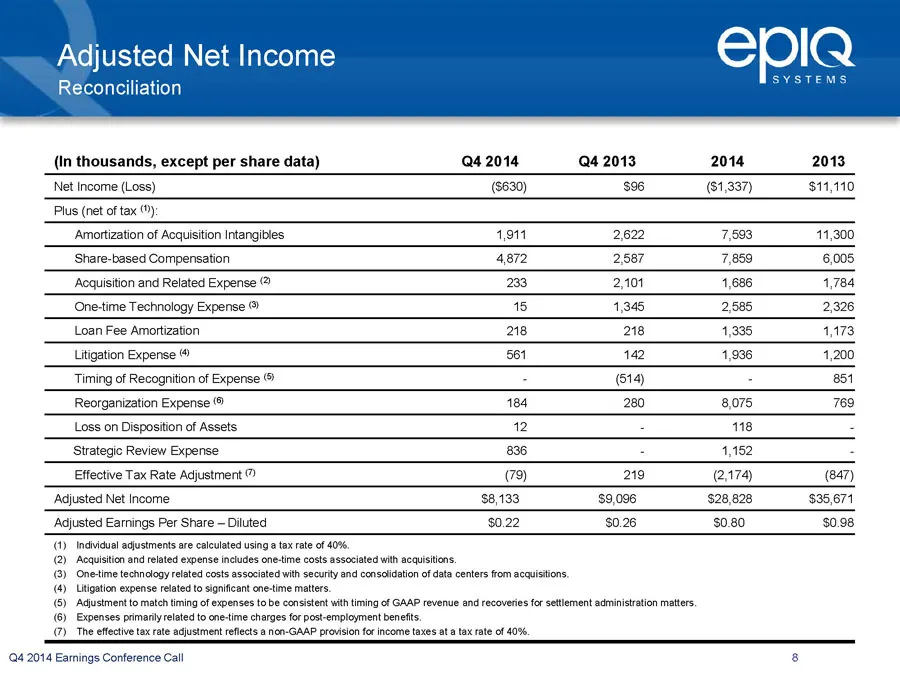
Adjusted Net Income EplQ SYSTEMS Reconciliation (In thousands, except per share data) 4 2014 4 2013 2014 2013 Net Income (Loss) ($630) $96 (61,337) $14,110 Plus (net of tax (): Amortization of Acquisition Intangibles 4.911 2.622 7,593 11,300 ‘Share-based Compensation 4872 2.587 7,859 6,005, ‘Acquist
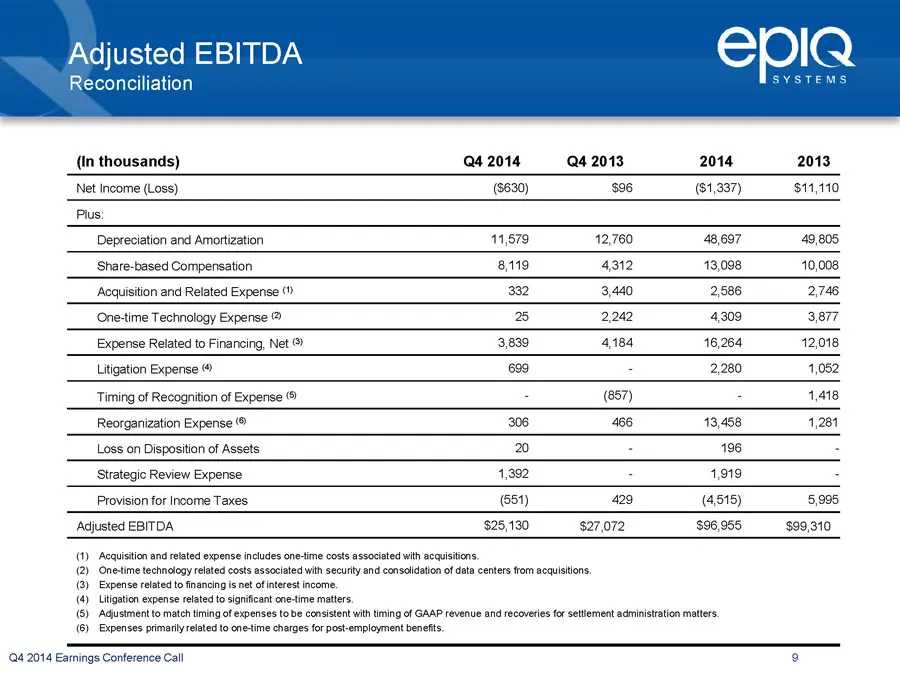
Slide 9: Adjusted EBITDA Reconciliation
Adjusted EBITDA edlQ Reconciliation SYSTEM (In thousands) Q4 2014 Q4 2013 2014 2013 ‘Net Income (Loss) ($630) $96 (81,337) $11,110 Plus: Depreciation and Amortization 11,579 12,760 (48,697 49,805 ‘Share-based Compensation 8,119 4312 13,098 10,008 Acquistion and Related Expense ( 332 3,440 2,586 2,74
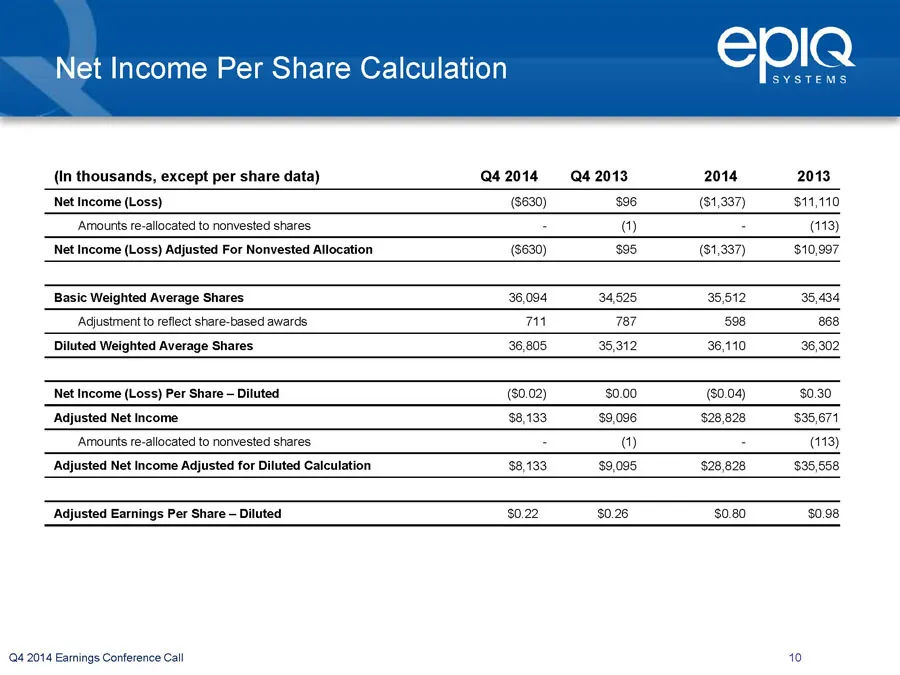
Slide 10: Net Income Per Share Calculation
Net Income Per Share Calculation (In thousands, except per share data) 42014 4.2013 2014 2013 Net Income (Loss) (8630) 396 (61,337) 311,110 “Amounts re-allocated to nonvested shares : 0) = (113) Net Income (Loss) Adjusted For Nonvested Allocation (8630) $95 (61.337) $10,997 Basic Weighted Average Sh
Slide 11: Investor Contacts
epia SYSTEMS Investor Contacts Kelly Bailey Epiq Systems (913) 621-9500 IR@epiqsystems.com Chris Eddy Catalyst Global (212) 924-9800 epiq@catalyst-ir.com NASDAQ: EPIQ www.epigqsystems.com
Source: SEC EDGAR · 8-K filed Mar 2, 2015
More decks from EPIQ Systems Inc
 Q2 2016 Earnings Presentation12 slides · Aug 9, 2016
 Q1 2016 Earnings Presentation12 slides · May 3, 2016
 FY2015 Earnings Presentation13 slides · Mar 1, 2016
 Q3 2015 Earnings Presentation11 slides · Nov 3, 2015
 Q2 2015 Earnings Presentation11 slides · Aug 3, 2015
 Q1 2015 Earnings Presentation11 slides · Apr 28, 2015