Nstar — Wells Fargo Securities Annual Utility Symposium 2010
19 slides from Nstar's conference presentation, Dec 8, 2010

Slide 1: Wells Fargo Securities Annual Utility Symposium
Wells Fargo Securities Annual Utility Symposium New York, NY December 8, 2010 Jim Judge Senior Vice President and CFO th

Slide 2: Information Concerning Forward-Looking Statements
Information Concerning Forward-Looking Statements In addition to historical information, this presentation may contain a number of “forward-looking statements” as defined in the Private Securities Litigation Reform Act of 1995. Words such as anticipate, expect, project, intend, plan, believe, and wo

Slide 3: Additional Information and Where To Find It
Additional Information and Where To Find It This communication does not constitute an offer to sell or the solicitation of an offer to buy any securities or a solicitation of any vote or approval. In connection with the proposed merger between Northeast Utilities and NSTAR, on November 22, 2010, Nor

Slide 4: Today's Agenda
Today’s Agenda NSTAR and Northeast Utilities Merger Structure Benefits Executive Team Regulatory Timeframe NSTAR Update Performance Results Current Transmission Projects Future Transmission Opportunities
Slide 5: Key Merger Terms
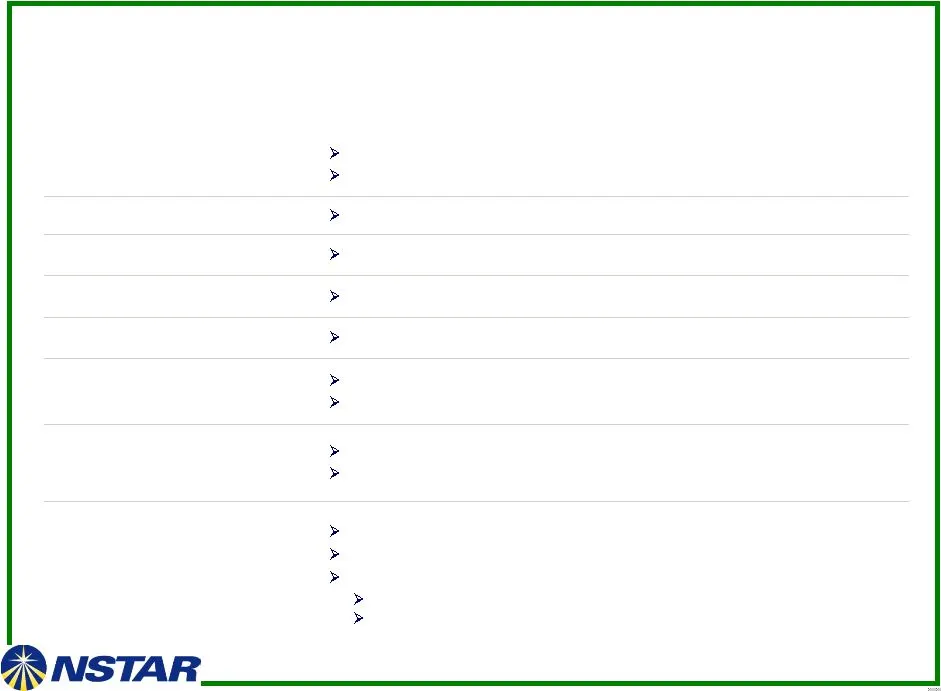
Key Merger Terms Timing / Approvals: Expected to close within – months Shareholders, federal, and state Headquarters: Dual – Hartford and Boston Company Name: Northeast Utilities Consideration: 100% NU shares Exchange Ratio: 1.312 shares of NU per NSTAR share Pro Forma Ownership: 56% NU shareholders
Slide 6: NSTAR and NU Merger – Creates Largest Utility Company in New England
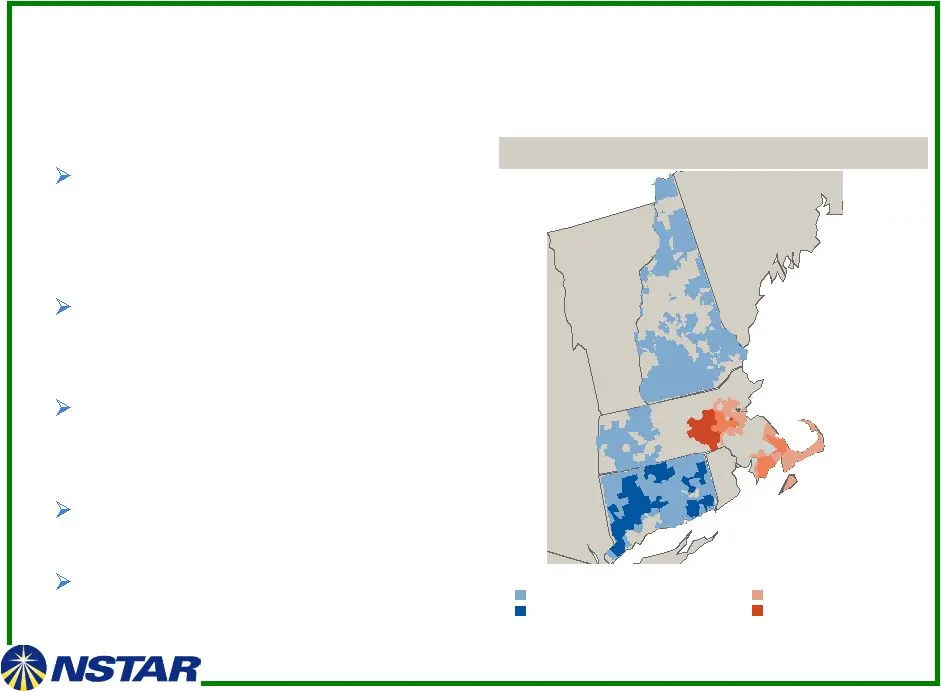
NSTAR and NU Merger – Creates Largest Utility Company in New England Significant transmission investment opportunities combined with balance sheet strength provides for substantial growth potential Larger, more diverse and better positioned to support economic growth in New England Accretive to earn
Slide 7: Building A Larger, More Diverse and Better Positioned Regulated Utility Business
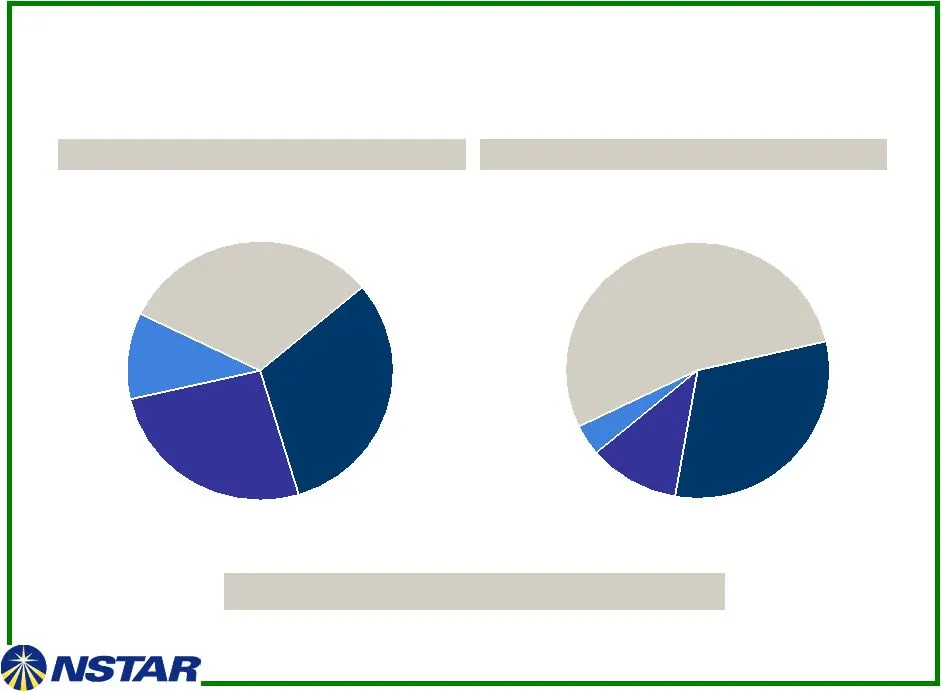
Building A Larger, More Diverse and Better Positioned Regulated Utility Business FERC 31% CT 26% NH 11% MA 32% Rate Base By State / Federal Electric Generation 4% Electric Distribution 54% Gas Distribution 11% Electric Transmission 31% Rate Base By Business Combined 2009 Rate Base: $10.8 billion
Slide 8: Transaction is Accretive
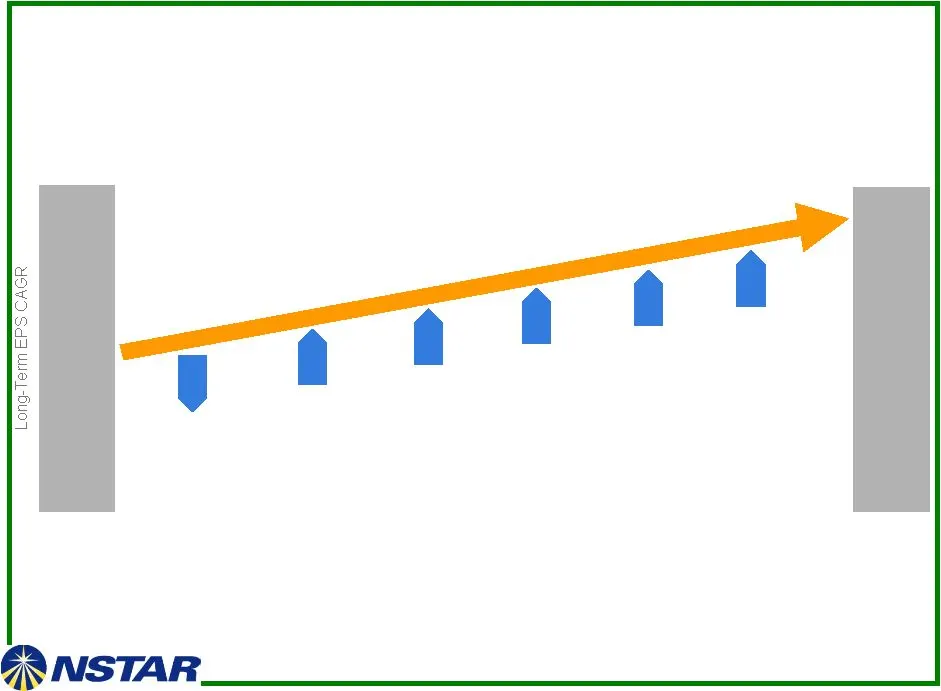
Transaction is Accretive NU Stand Alone Growth Rate Avoidance of Equity Issuance NSTAR Earnings Growth Additional Shares Less NU Parent Debt Issuance Lower Financing Costs Implementing Best Practices Illustrative Impact on Growth Rate 9% Merged Company Growth Rate 9% Components Affecting Expected Ac
Slide 9: Executive Management Organization
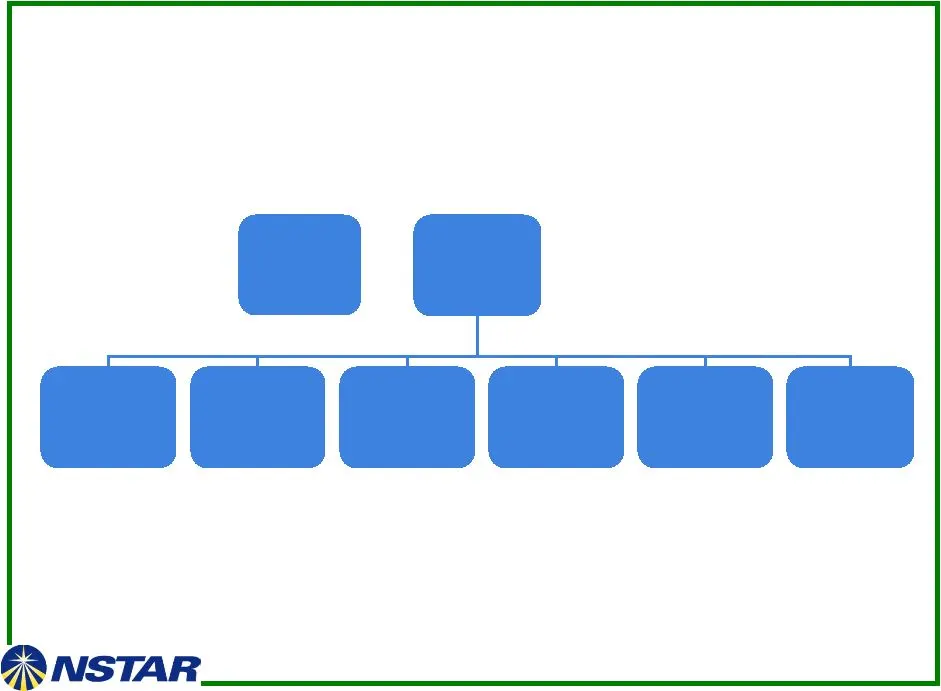
Tom May President & Chief Executive Officer Greg Butler General Counsel David McHale Chief Administrative Officer Lee Olivier Chief Operating Officer Christine Carmody Human Resources Jim Judge Chief Financial Officer Joe Nolan Corporate Relations Chuck Shivery Non-Executive Chairman Executive Manag
Slide 10: Regulatory Timeline
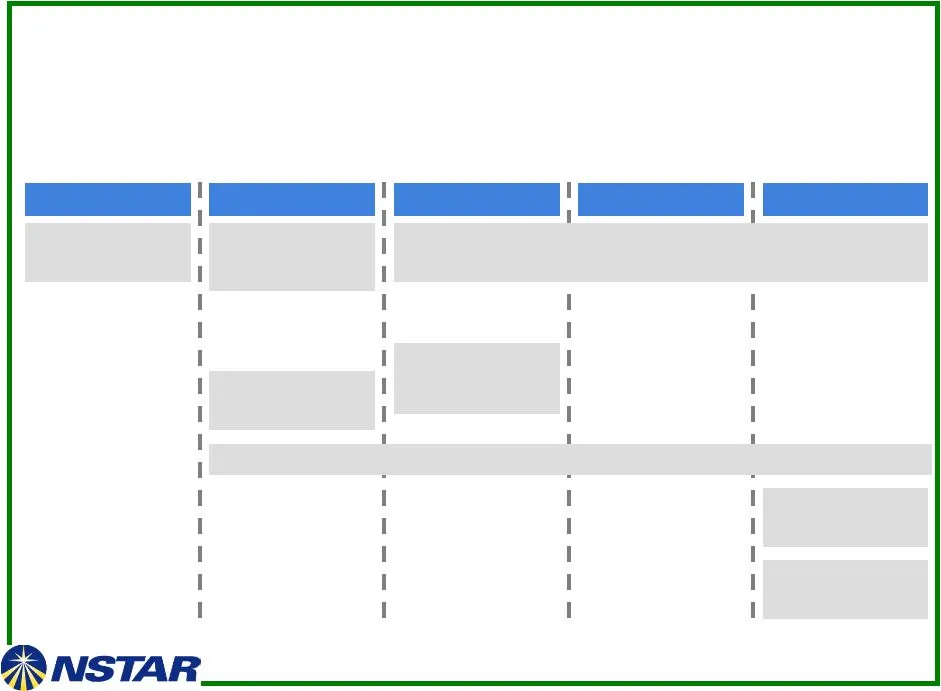
Oct 2010 Q4 2010 Q1 2011 Q2 2011 Q3 2011 Regulatory Timeline Closing Expected in 9 – 12 months Merger Announced Commenced Regulatory Filings Filed Joint Proxy Statement/Prospectus on November 22 Secure Regulatory Approvals FERC, SEC, NRC, DOJ, MDPU, FCC Northeast Utilities and NSTAR Shareholder Meet
Slide 11: NSTAR – A Track Record of Strong Performance
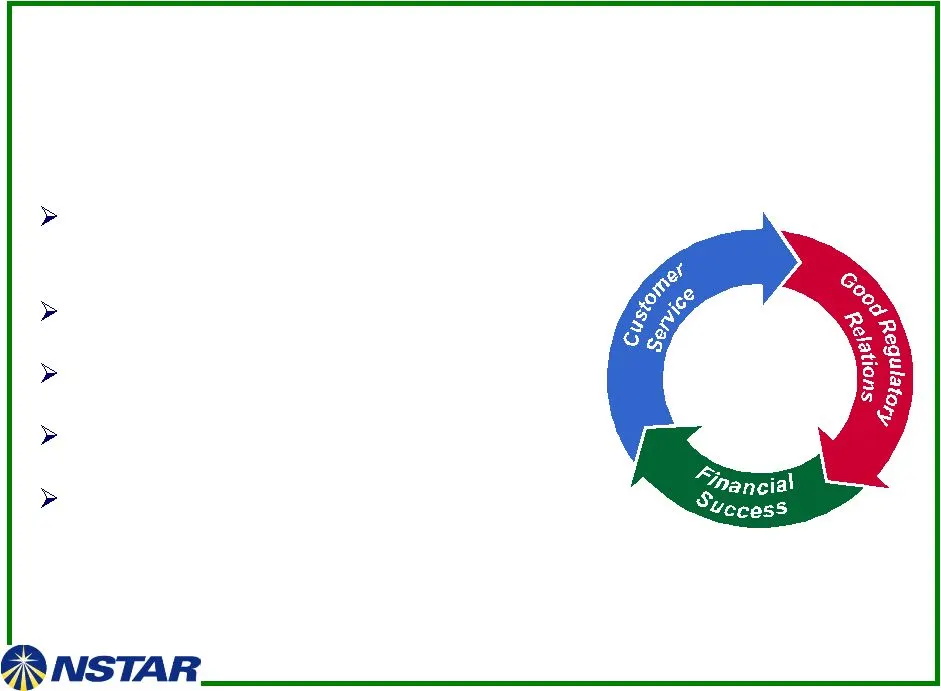
NSTAR – A Track Record of Strong Performance High levels of customer service and reliability Solid, consistent financial results Cost control Strong credit profile and positive cash flow Constructive regulatory outcomes

Slide 12: A Long History of Negotiated, Multi-Year Distribution Rate Agreements
A Long History of Negotiated, Multi-Year Distribution Rate Agreements years of rate agreements – last litigated rate increase in 1986 Fully reconciling pension & post-retirement mechanism and recovery of energy supply Current electric rate plan through December 31, 2012 10.5% ROE with +/- 2% neutral
Slide 13: Earnings Growth of 7% Outperforms Industry
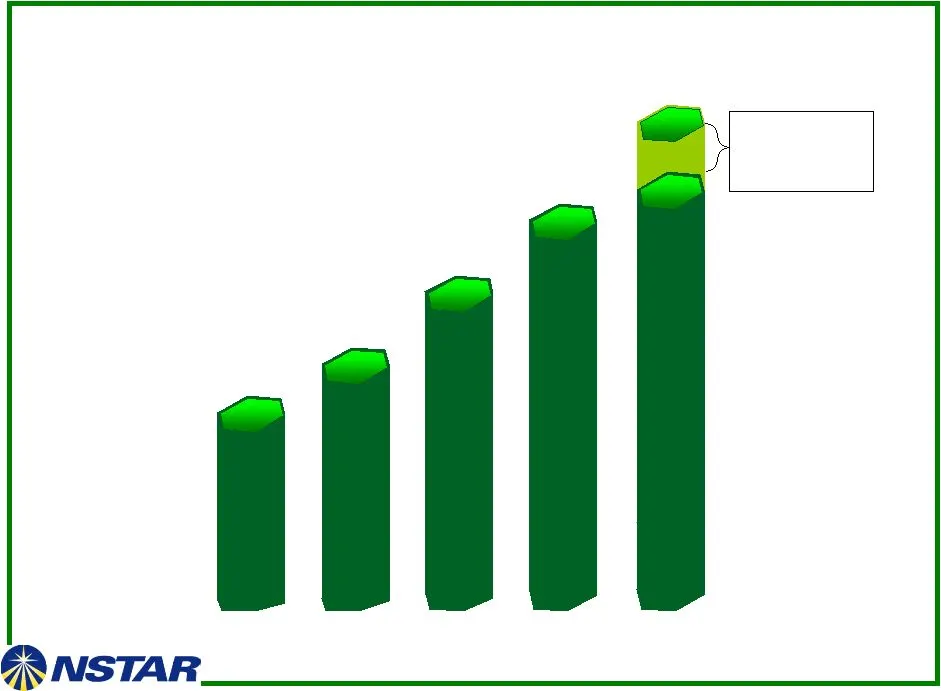
Earnings Growth of 7% Outperforms Industry …19 Consecutive Years of Operating Earnings Growth… $2.22 2006 2007 $1.93 $2.07 2008 2009 $2.37 $2.45 - $2.60 2010 Guidance
Slide 14: Consistent Dividend Growth
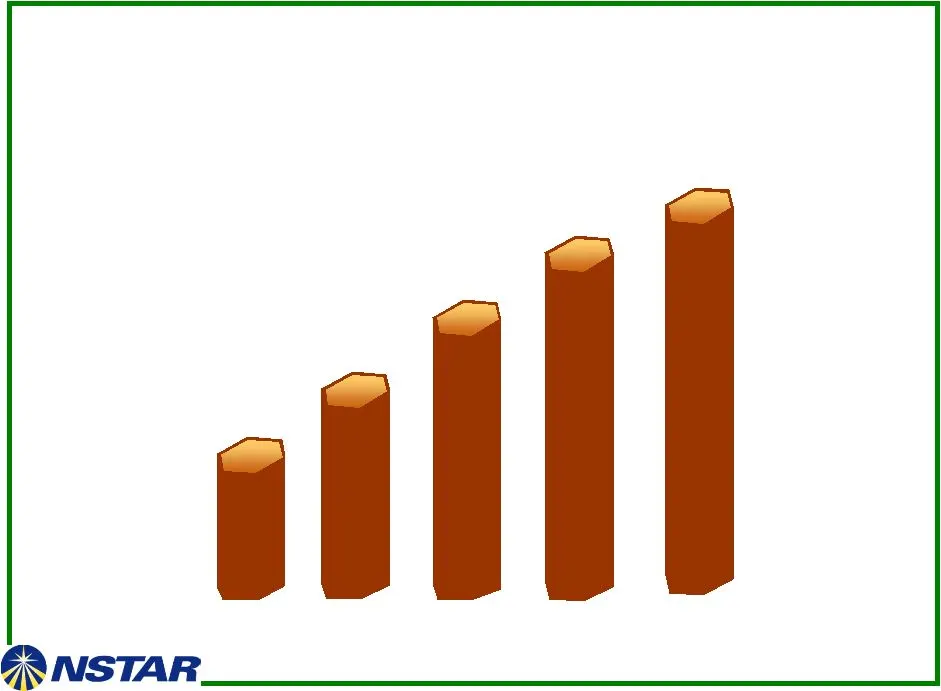
Consistent Dividend Growth …13 Consecutive Years of Increase… $1.30 $1.40 $1.50 2007 2008 $1.60 2009 2010 2011 $1.70
Slide 15: Total Shareholder Return Outperforms the Industry
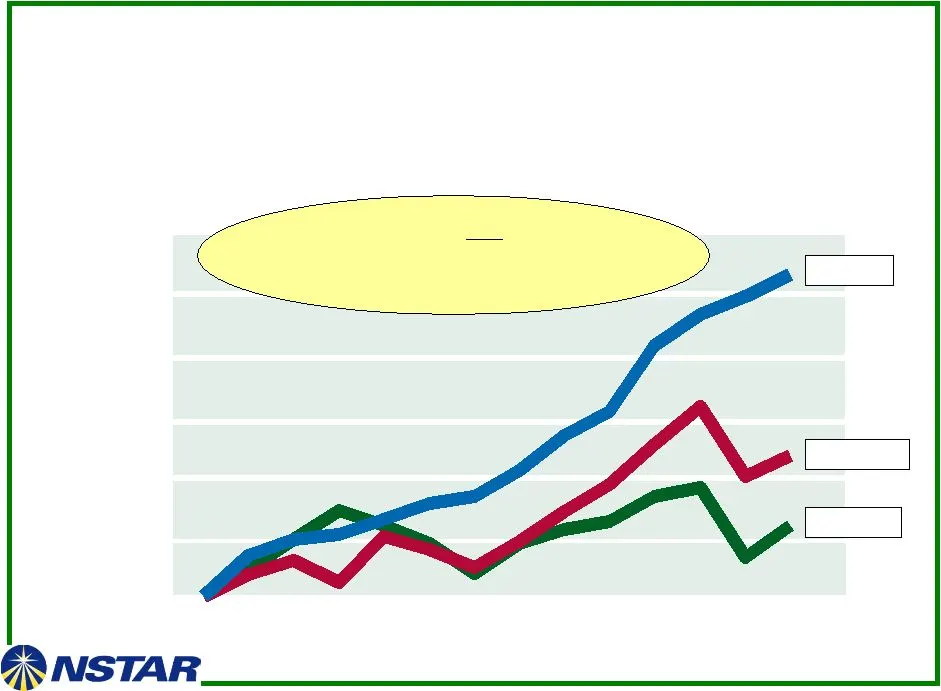
Total Shareholder Return Outperforms the Industry NSTAR Utility Index S&P 500 1996 2009 $1,000 $1,750 $2,500 $3,250 $4,000 $4,750 $5,500 Only company in any industry to deliver 13 consecutive years of positive total shareholder return
Slide 16: Highest Credit Ratings In The Industry
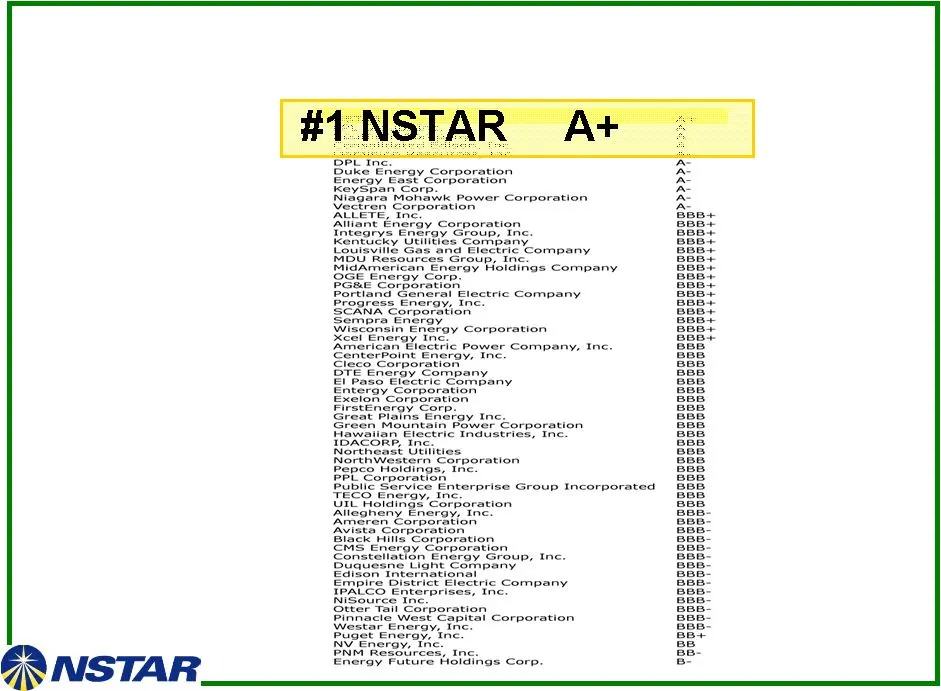
Highest Credit Ratings In The Industry
Slide 17: NSTAR System Has Significant Transmission Investment Ahead
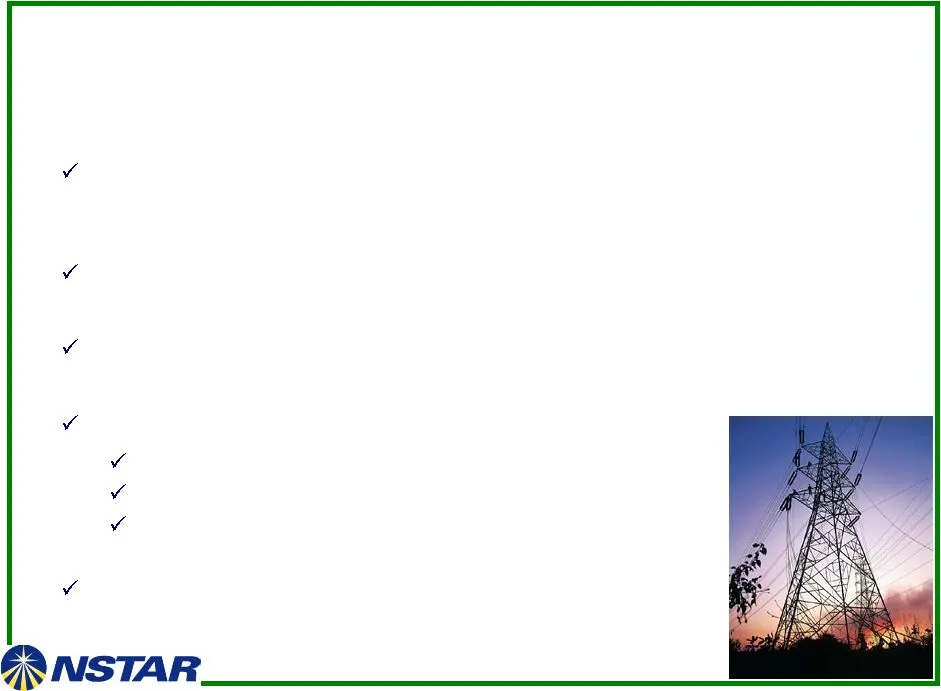
NSTAR System Has Significant Transmission Investment Ahead Transmission Rate Base is expected to double within 5 years to approximately $1.6 billion Northern Pass: $280 million (2012-2015) Growth/reliability spending averages $100 million per year Incremental Major Projects: Cape Cod Line $120 milli

Slide 18: Summary
Summary The merger creates New England’s premier energy provider More diverse, stable and higher earnings growth profile than could be achieved standalone Highly experienced management teams with proven track records of success Combined company will have one of the most attractive total return profi
Slide 19
Source: SEC EDGAR · 425 filed Dec 8, 2010
More decks from Nstar
 Merger or Acquisition (February 2012)38 slides · Feb 29, 2012
 EEI Financial Conference 201151 slides · Nov 7, 2011
 EEI Financial Conference 201149 slides · Nov 7, 2011
 Barclays CEO Energy-Power Conference 201132 slides · Sep 8, 2011
 Williams Capital East Coast Conference 201137 slides · Aug 10, 2011
 Deutsche Bank Conference (May 2011)24 slides · May 11, 2011