Hamborner REIT AG · XETR:HABA
Hamborner REIT — FY2013 Earnings Presentation
37 slides from Hamborner REIT's earnings presentation, February 2014
Slide 1: Company Presentation – Preliminary figures fiscal year 2013
Company Presentation HAMBORNER REIT AG Preliminary figures fiscal year 2013 ‐ February 2014
Slide 2: Agenda
Agenda 1 History / Capital markets track record 2 Organisation / Portfolio / Investments 2013 3 Asset Management 4 Financial Position / Preliminary figures 2013 Company Presentation February 2014 (Preliminary figures 2013) 2
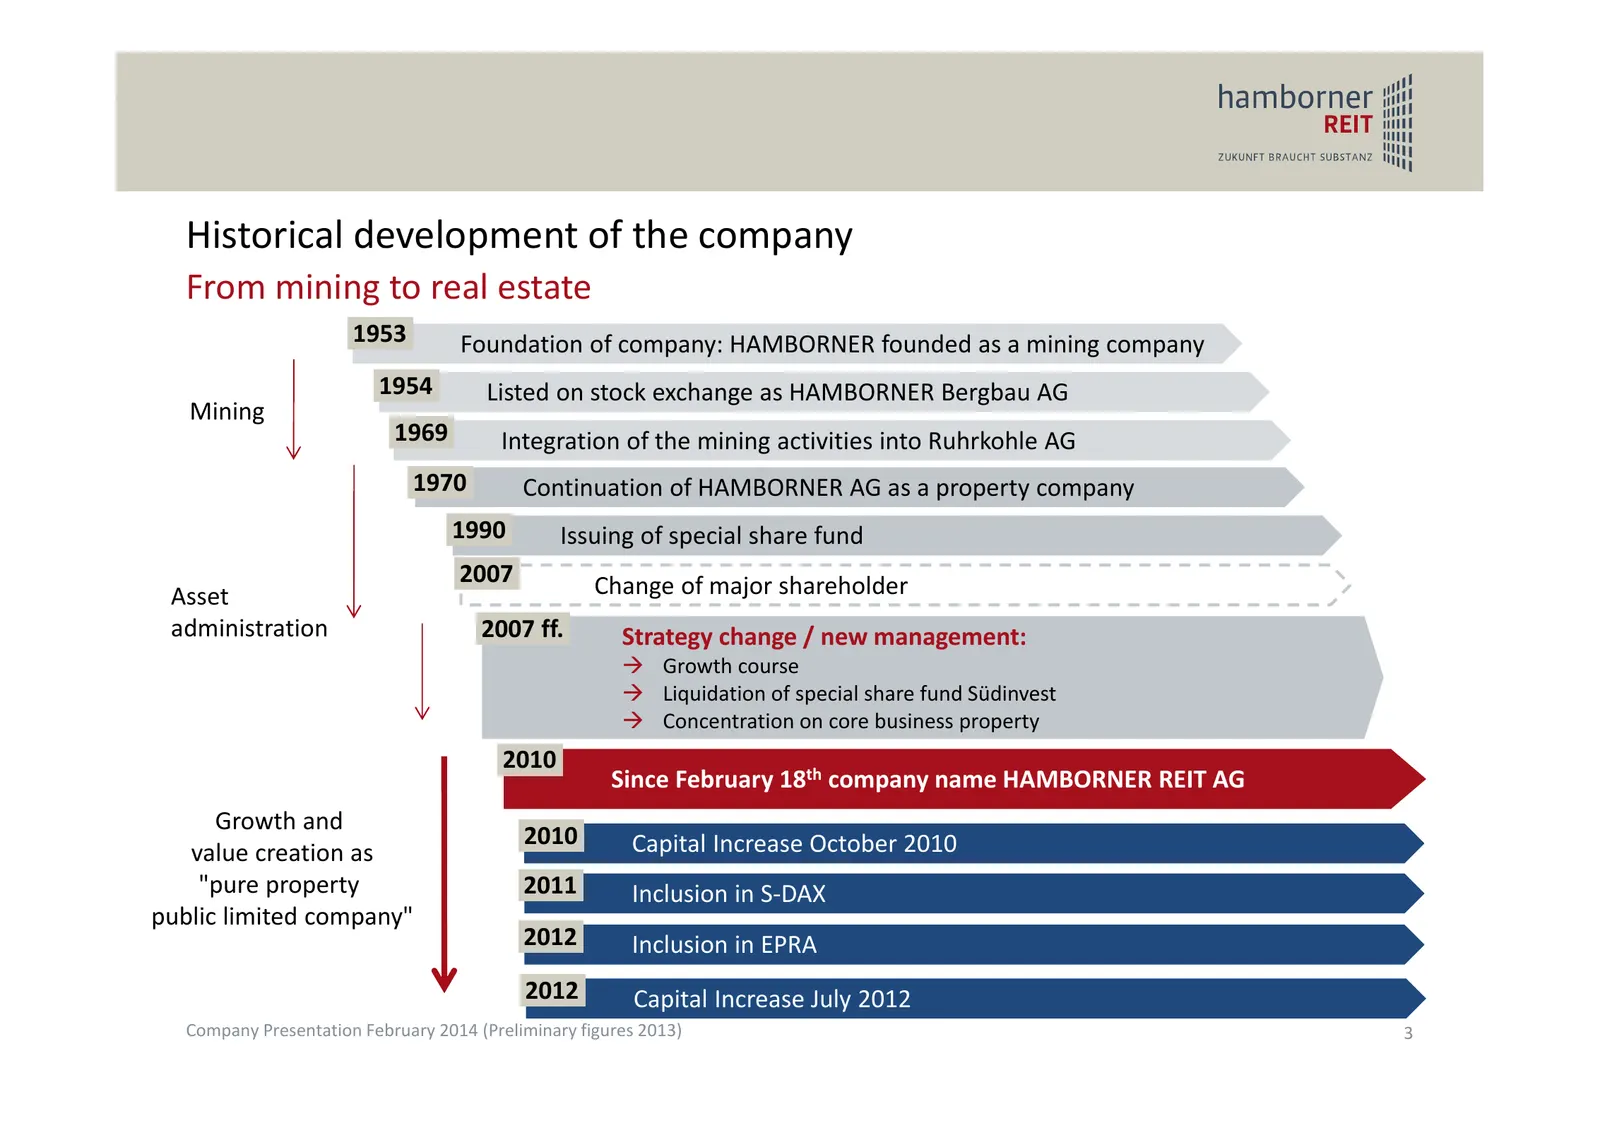
Slide 3: Historical development of the company
Historical development of the company From mining to real estate 1953 Foundation of company: HAMBORNER founded as a mining company 1954 Listed on stock exchange as HAMBORNER Bergbau AG Mining 1969 Integration of the mining activities into Ruhrkohle AG 1970 Continuation of HAMBORNER AG as a property
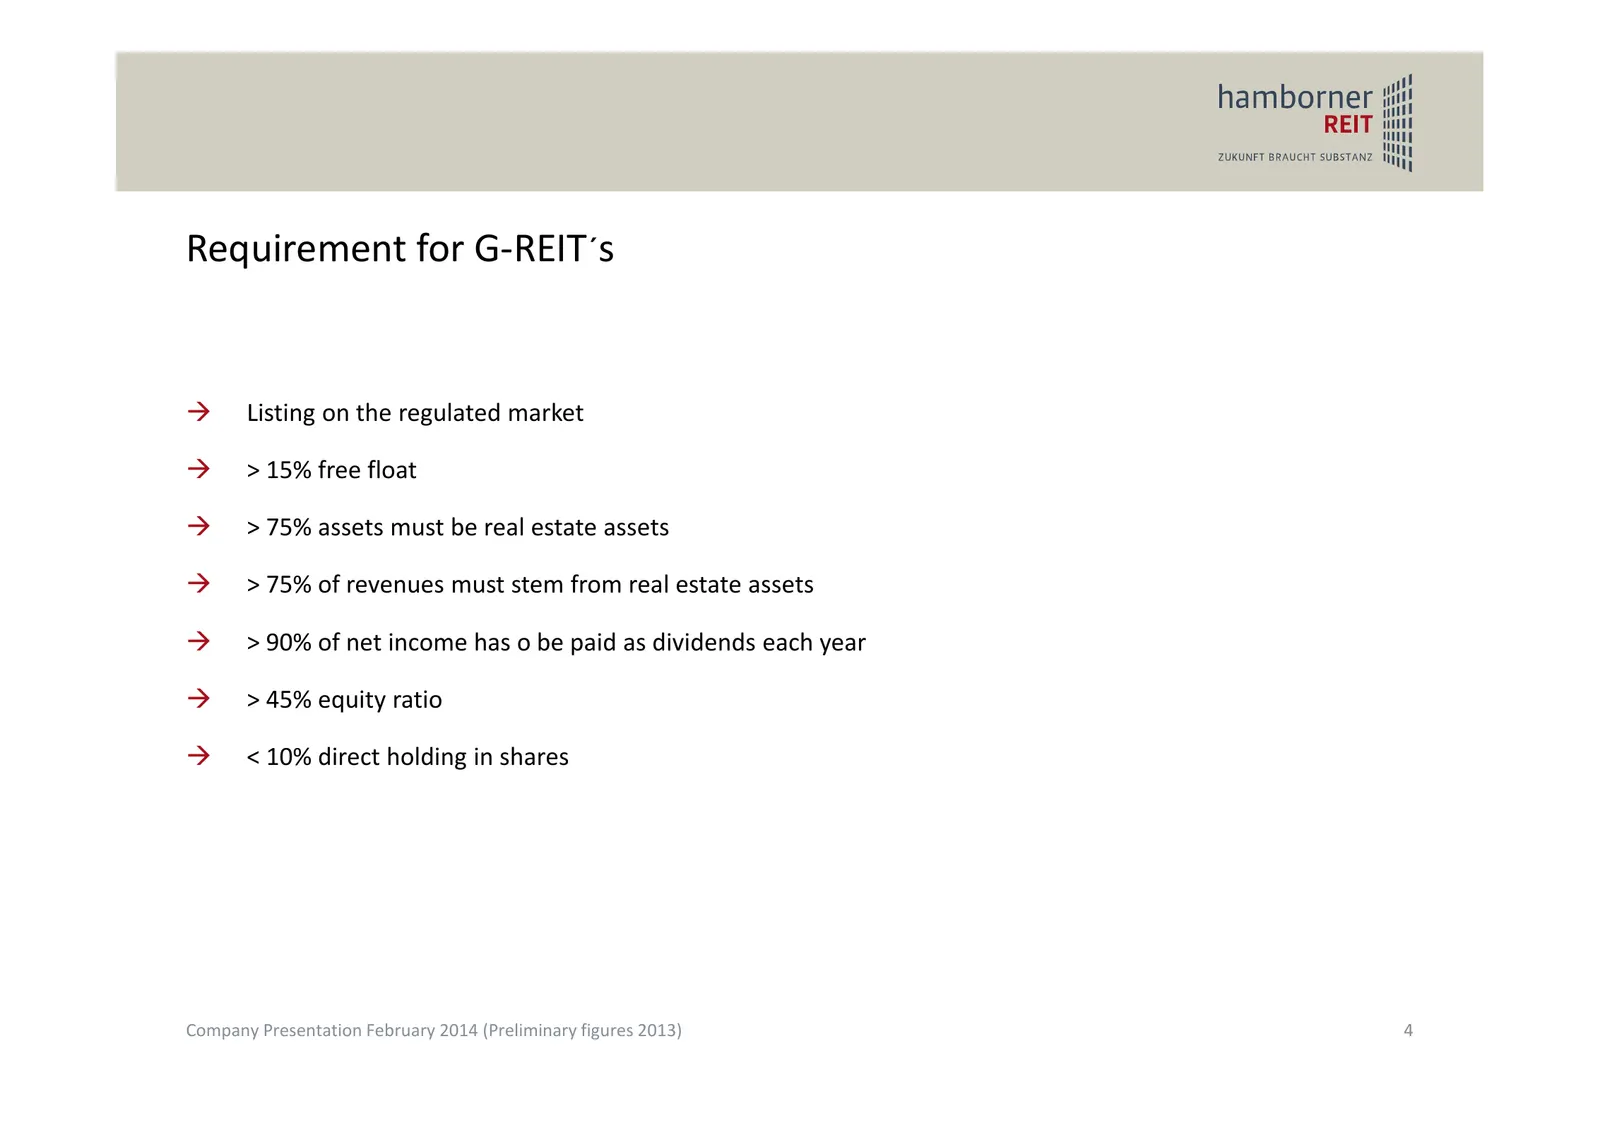
Slide 4: Requirement for G-REITs
Requirement for G‐REIT´s Listing on the regulated market > 15% free float > 75% assets must be real estate assets > 75% of revenues must stem from real estate assets > 90% of net income has o be paid as dividends each year > 45% equity ratio < 10% direct holding in shares Company Prese
Slide 5: Corporate structure
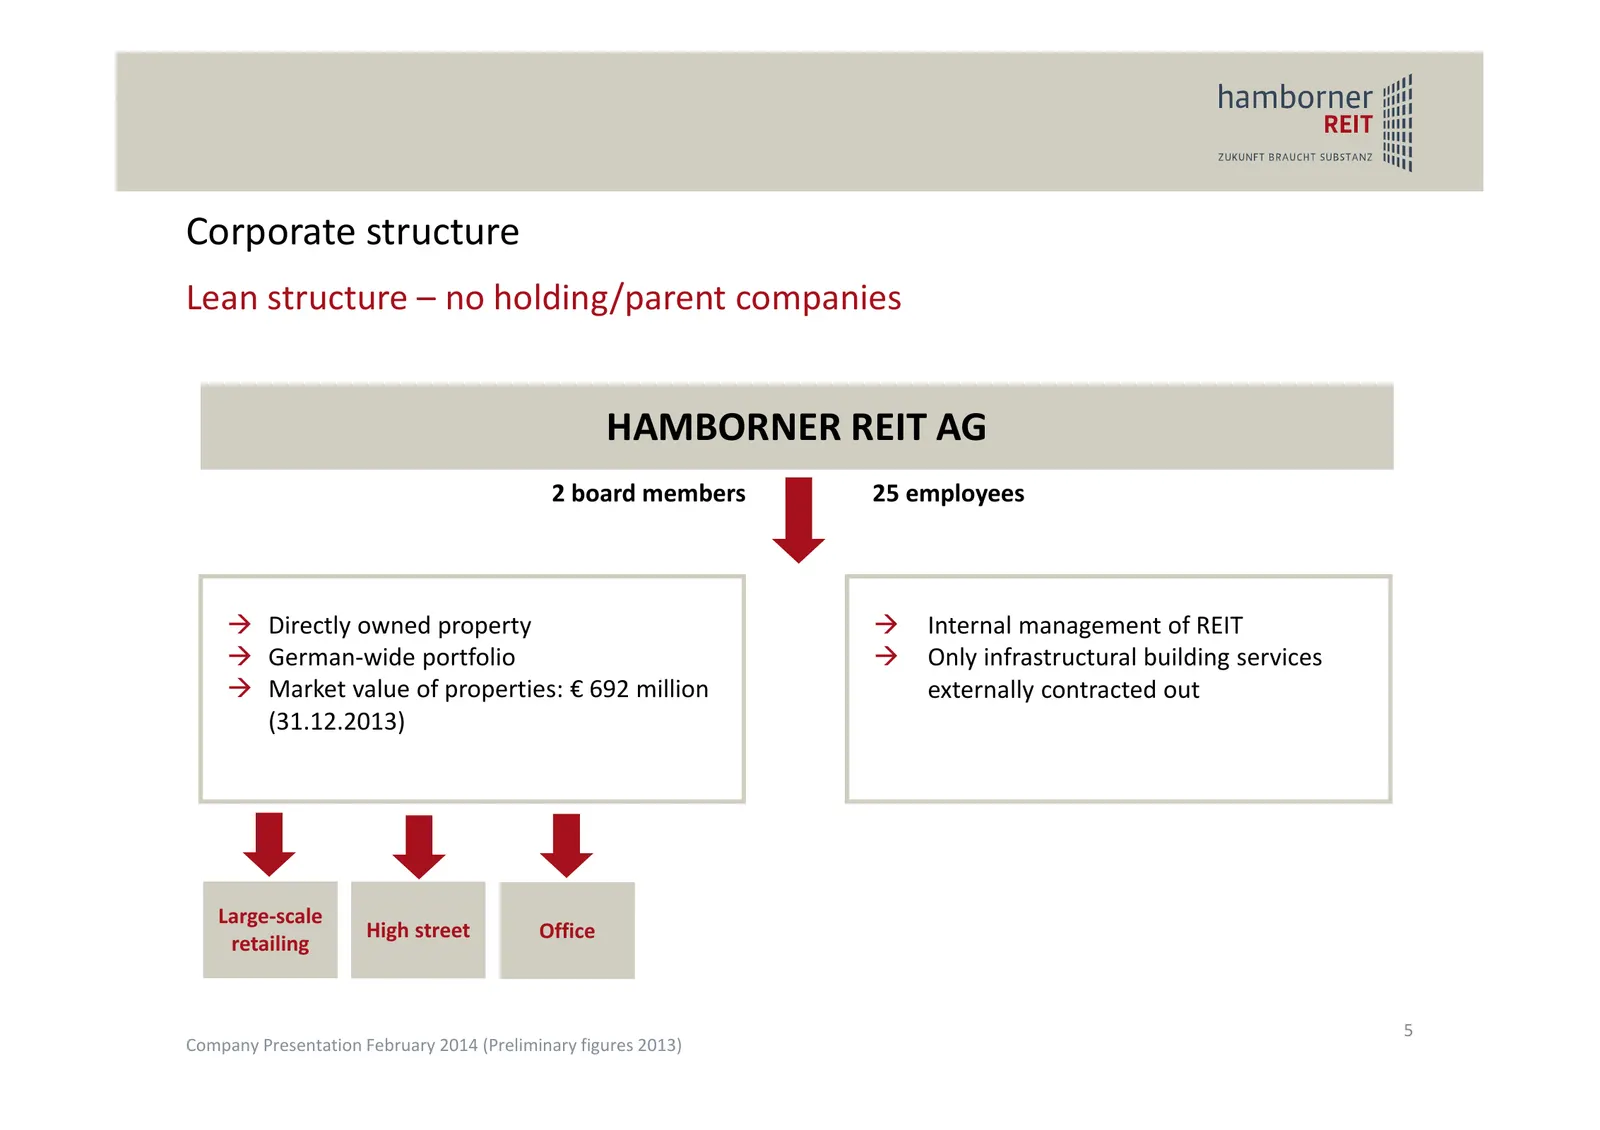
Corporate structure Lean structure – no holding/parent companies HAMBORNER REIT AG 2 board members 25 employees Directly owned property Internal management of REIT German‐wide portfolio Only infrastructural building services Market value of properties: € 692 million externally contracted o
Slide 6: Growing market capitalization and increasing free float
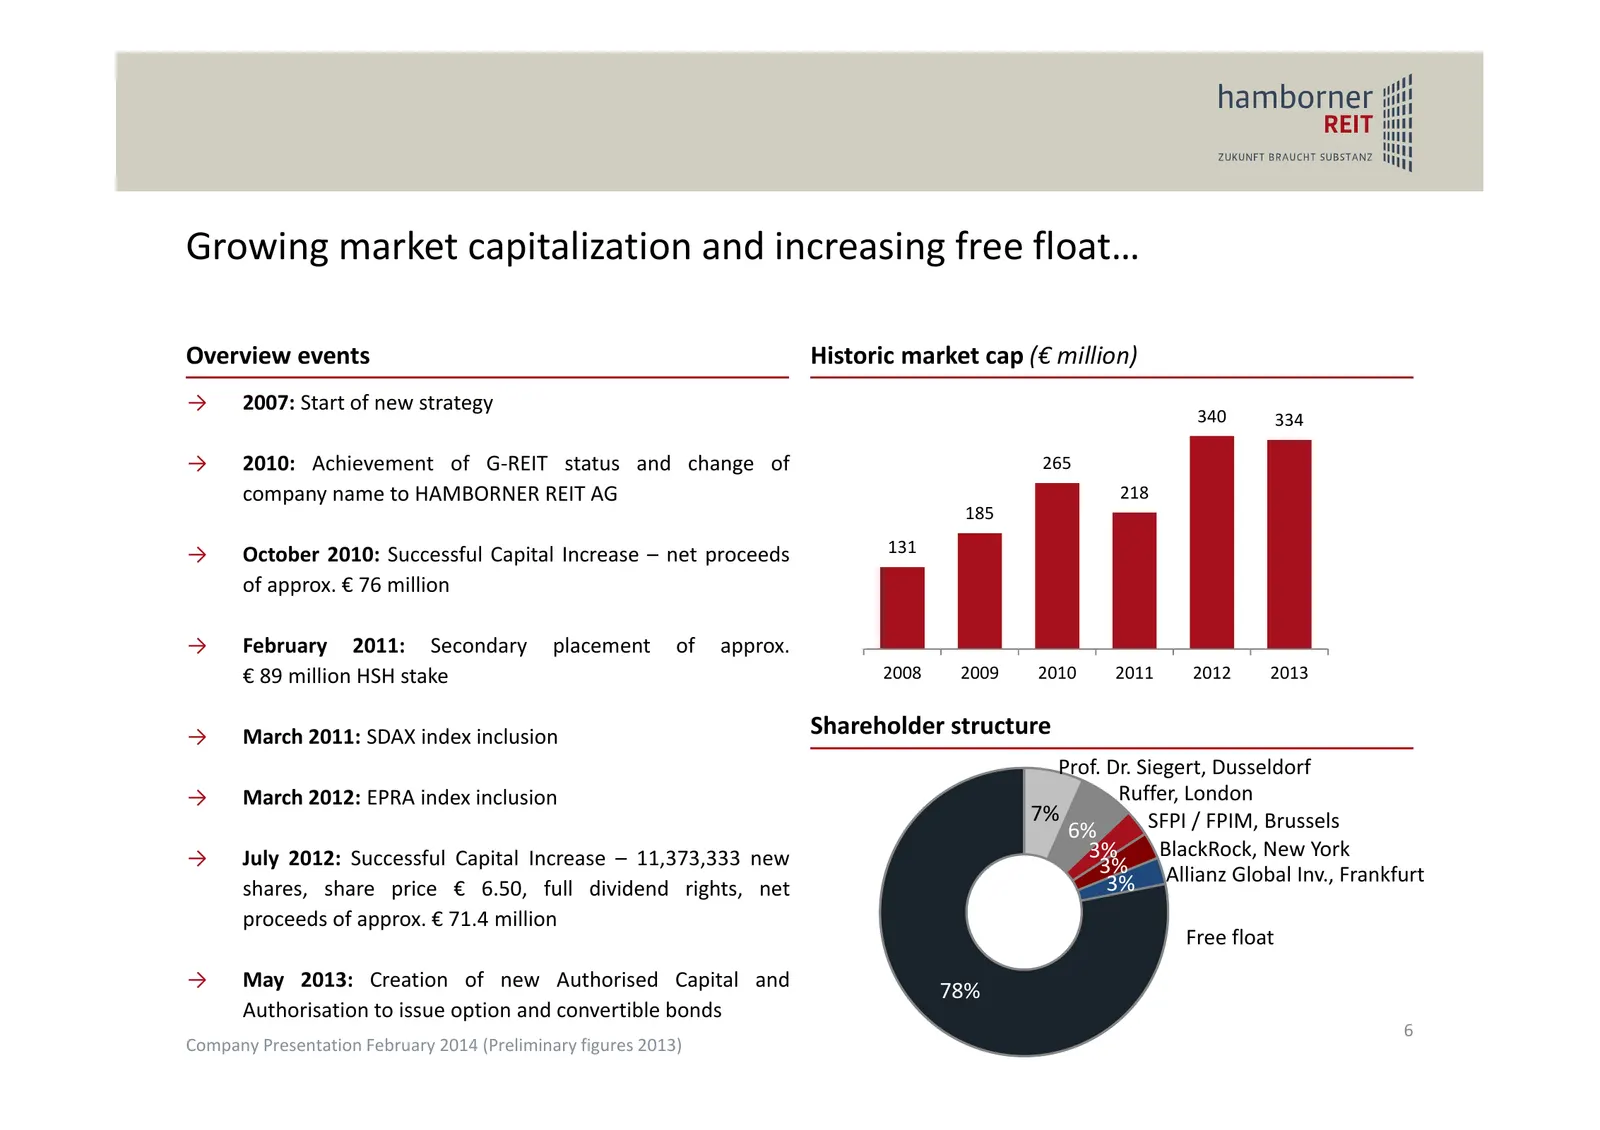
Growing market capitalization and increasing free float… Overview events Historic market cap (€ million) → 2007: Start of new strategy 340 334 → 2010: Achievement of G‐REIT status and change of 265 company name to HAMBORNER REIT AG 218 185 → October 2010: Successful Capital Increase – net proceeds 1
Slide 7: Resulting in increased liquidity
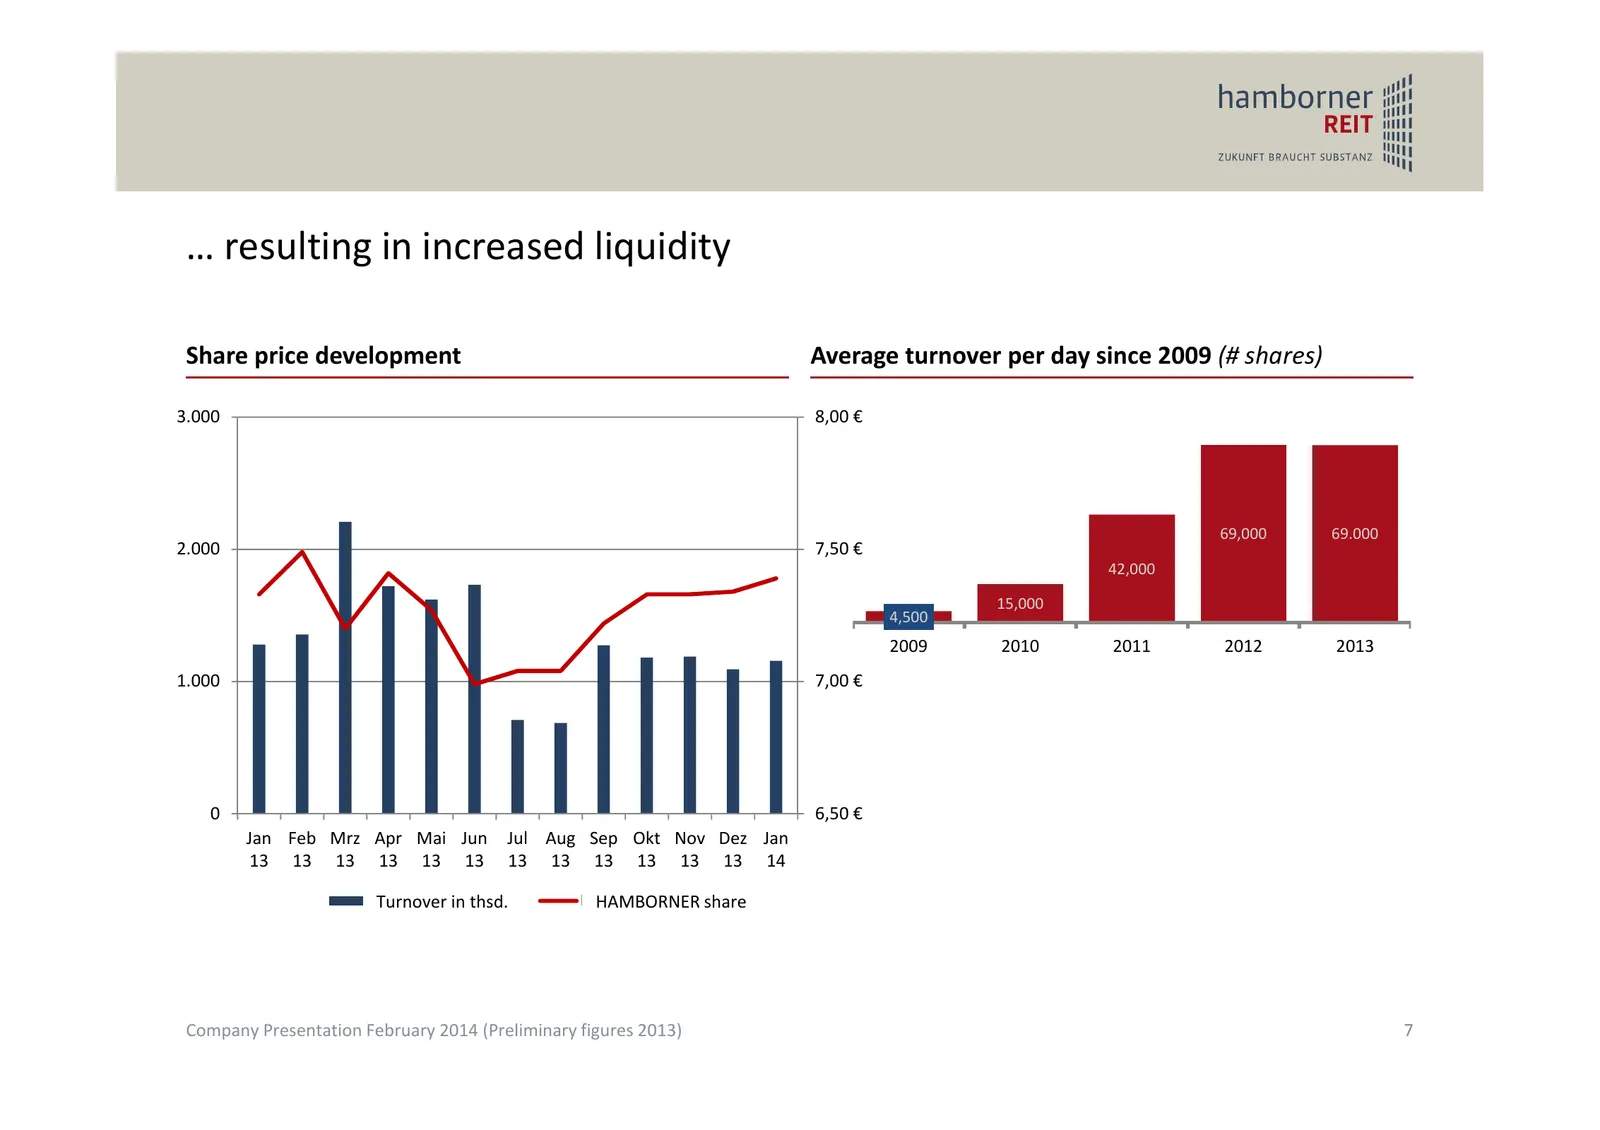
… resulting in increased liquidity Share price development Average turnover per day since 2009 (# shares) 3.000 8,00 € 69,000 69.000 2.000 7,50 € 42,000 15,000 4,500 2009 2010 2011 2012 2013 1.000 7,00 € 0 6,50 € Jan Feb Mrz Apr Mai Jun Jul Aug Sep Okt Nov Dez Jan 13 13 13 13 13 13 13 13 13 13 13 13
Slide 8: Agenda
Agenda 1 History / Capital markets track record 2 Organisation / Portfolio / Investments 2013 3 Asset Management 4 Financial Position / Preliminary figures 2013 Company Presentation February 2014 (Preliminary figures 2013) 8
Slide 9: Balanced portfolio with 100% German focus
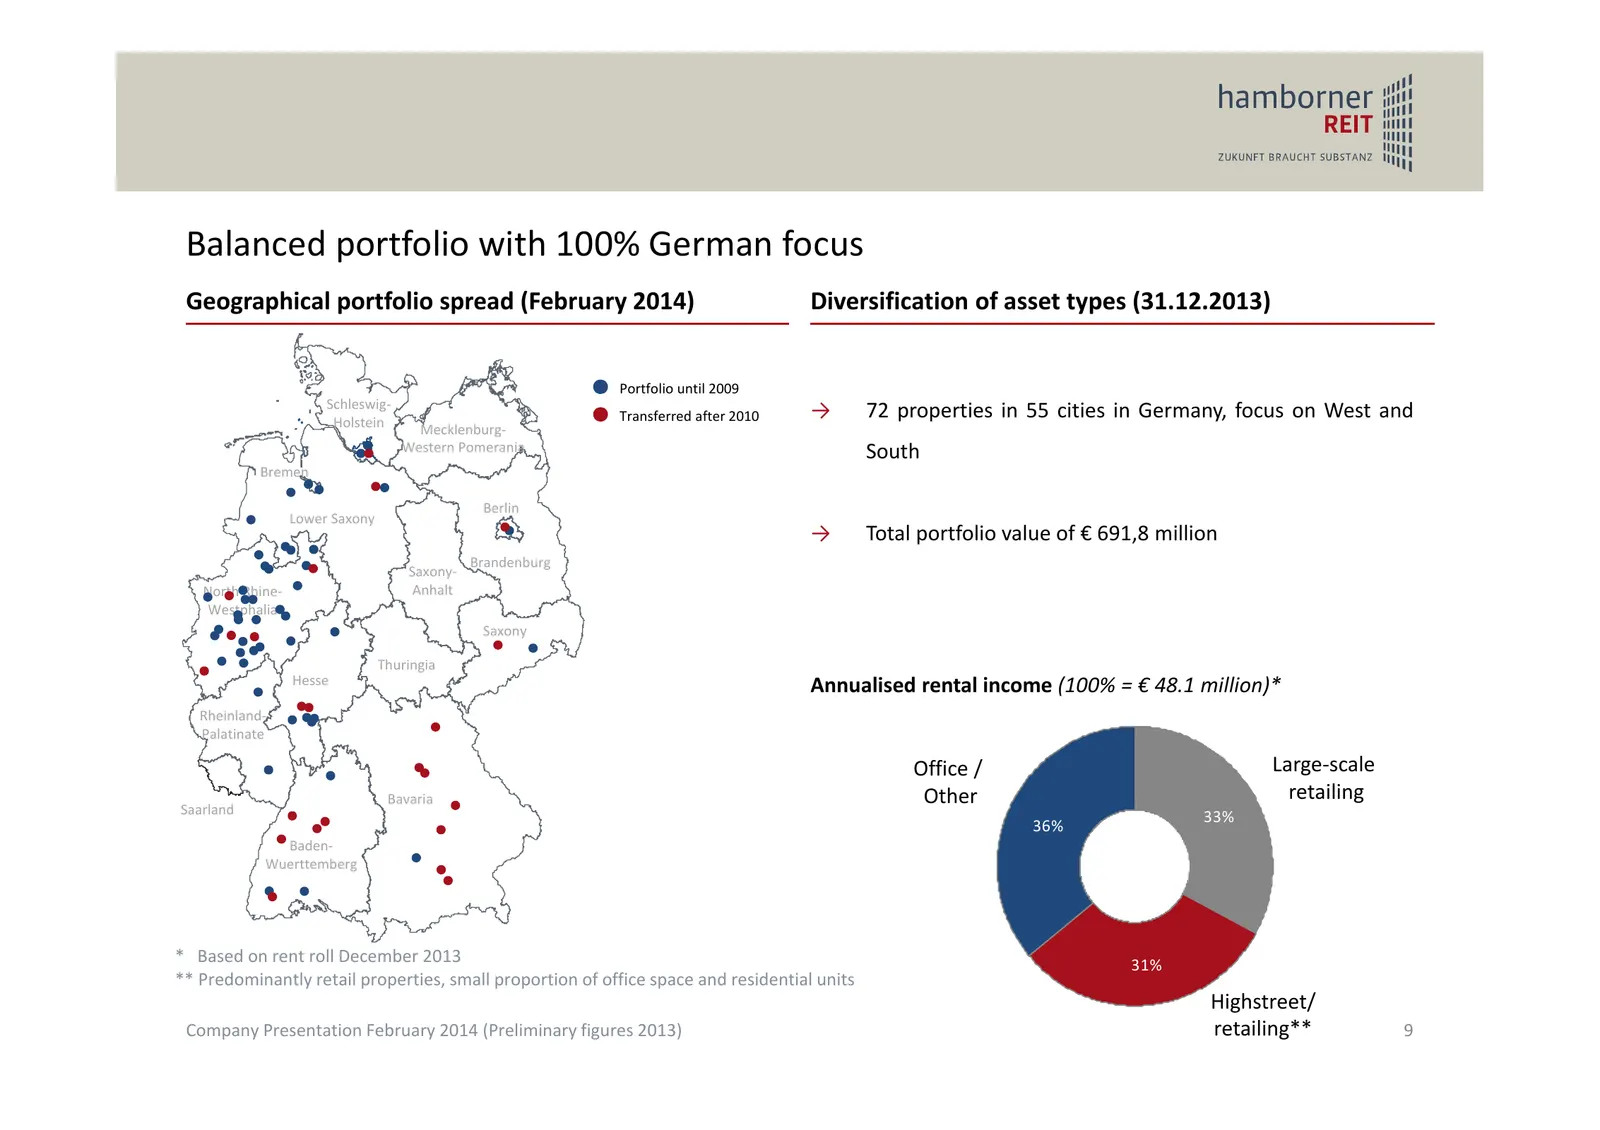
Balanced portfolio with 100% German focus Geographical portfolio spread (February 2014) Diversification of asset types (31.12.2013) Portfolio until 2009 Schleswig‐ Holstein Transferred after 2010 → 72 properties in 55 cities in Germany, focus on West and Mecklenburg‐ Western Pomerania South Bremen B
Slide 10: Well defined acquisition strategy
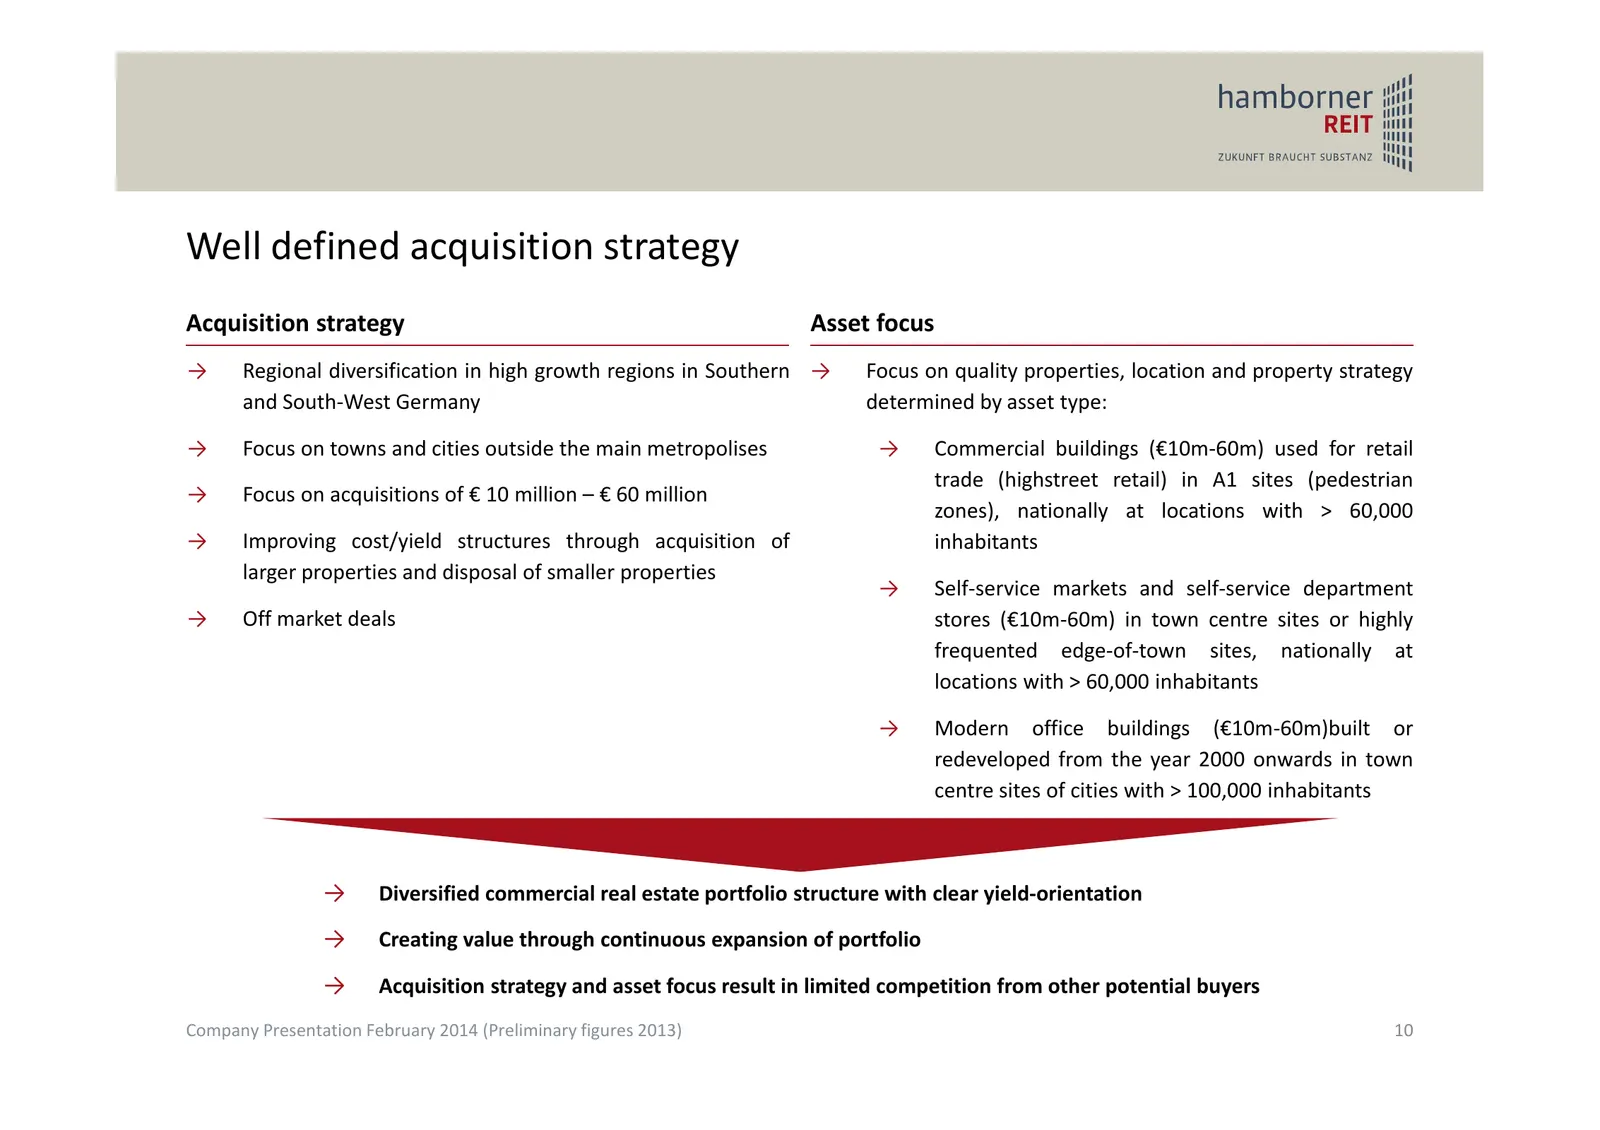
Well defined acquisition strategy Acquisition strategy Asset focus → Regional diversification in high growth regions in Southern → Focus on quality properties, location and property strategy and South‐West Germany determined by asset type: → Focus on towns and cities outside the main metropolises →
Slide 11: Development of the HAMBORNER portfolio value
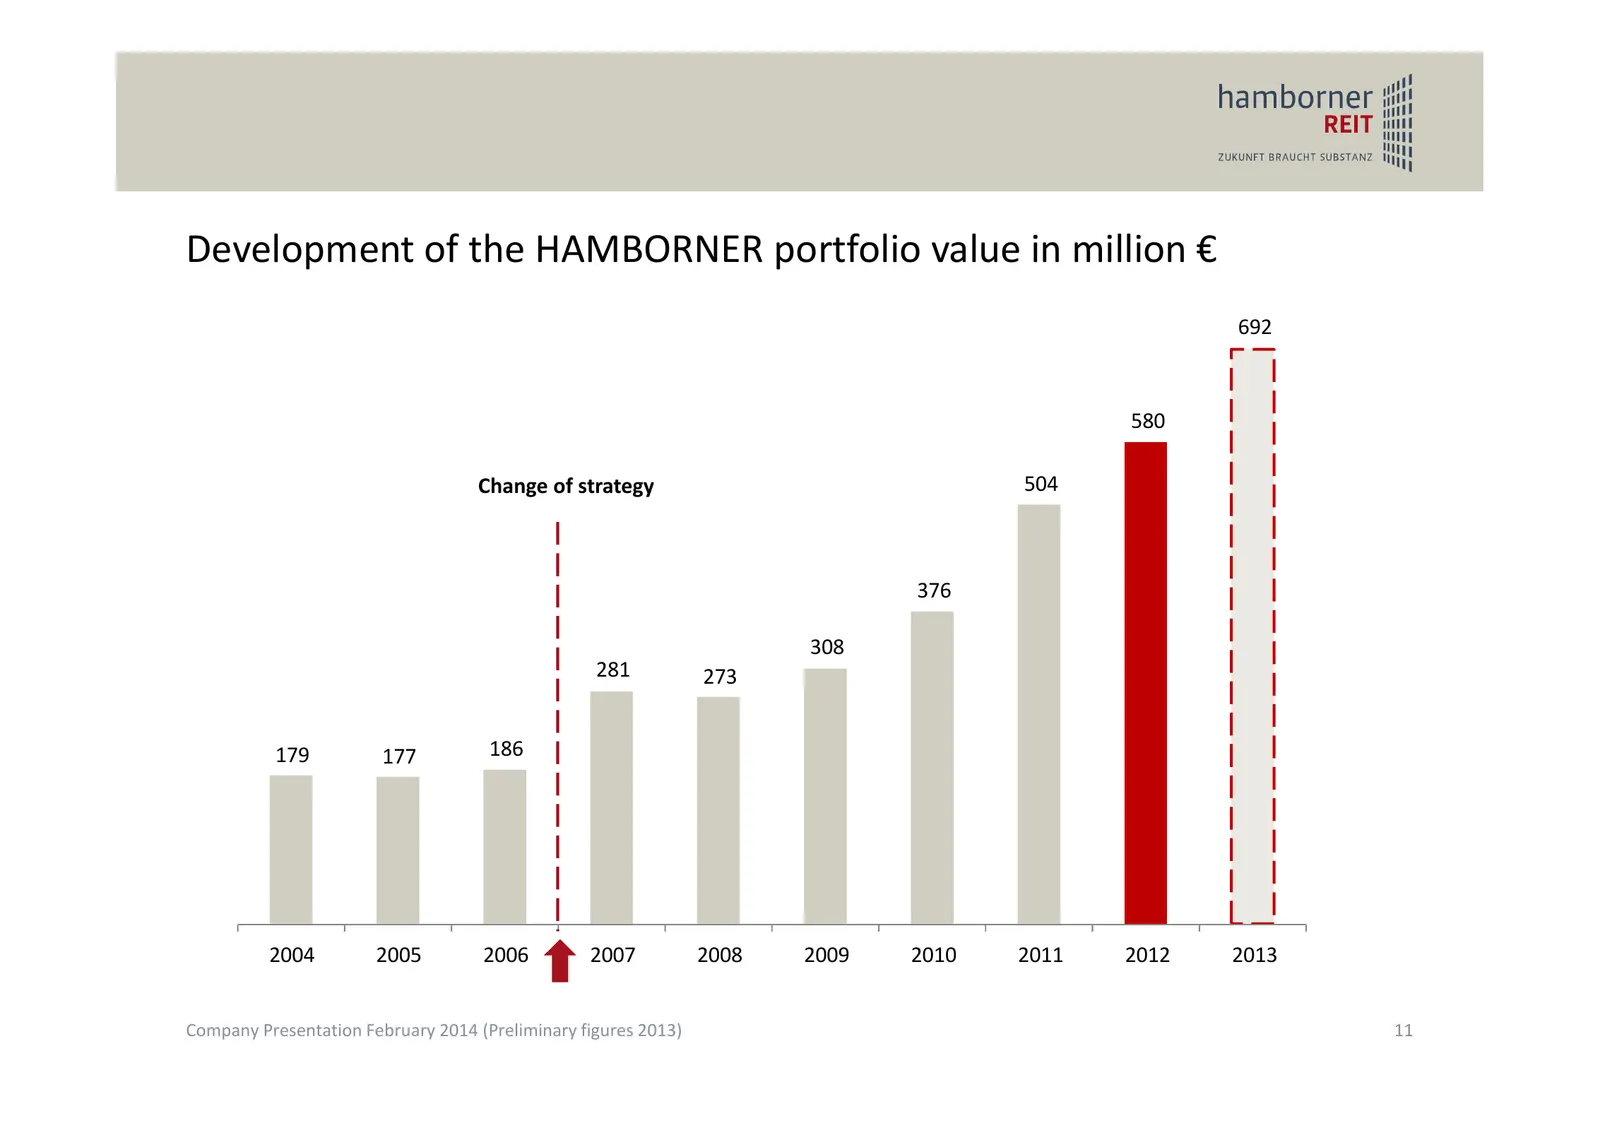
Development of the HAMBORNER portfolio value in million € 692 580 Change of strategy 504 376 308 281 273 179 177 186 2004 2005 2006 2007 2008 2009 2010 2011 2012 2013 Company Presentation February 2014 (Preliminary figures 2013) 11
Slide 12: Investments 2013
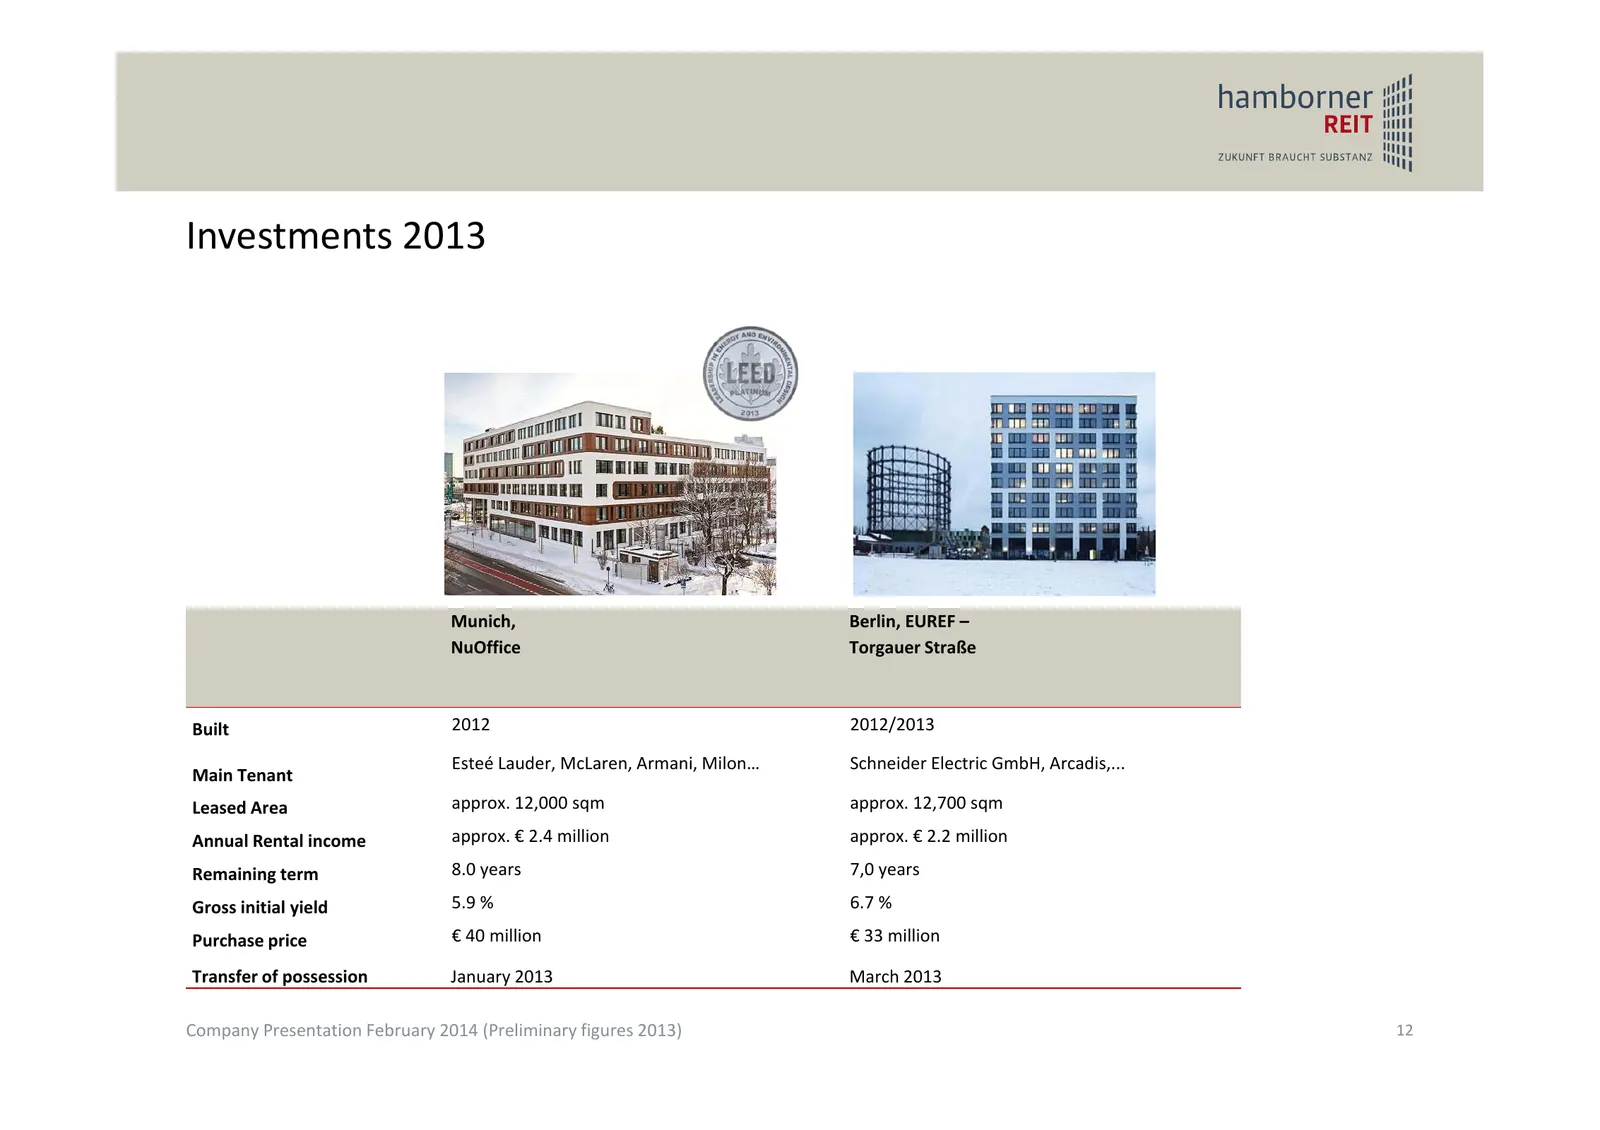
Investments 2013 Munich, Berlin, EUREF – NuOffice Torgauer Straße Built 2012 2012/2013 Esteé Lauder, McLaren, Armani, Milon… Schneider Electric GmbH, Arcadis,... Main Tenant Leased Area approx. 12,000 sqm approx. 12,700 sqm Annual Rental income approx. € 2.4 million approx. € 2.2 million Remaining t
Slide 13: Investments 2013
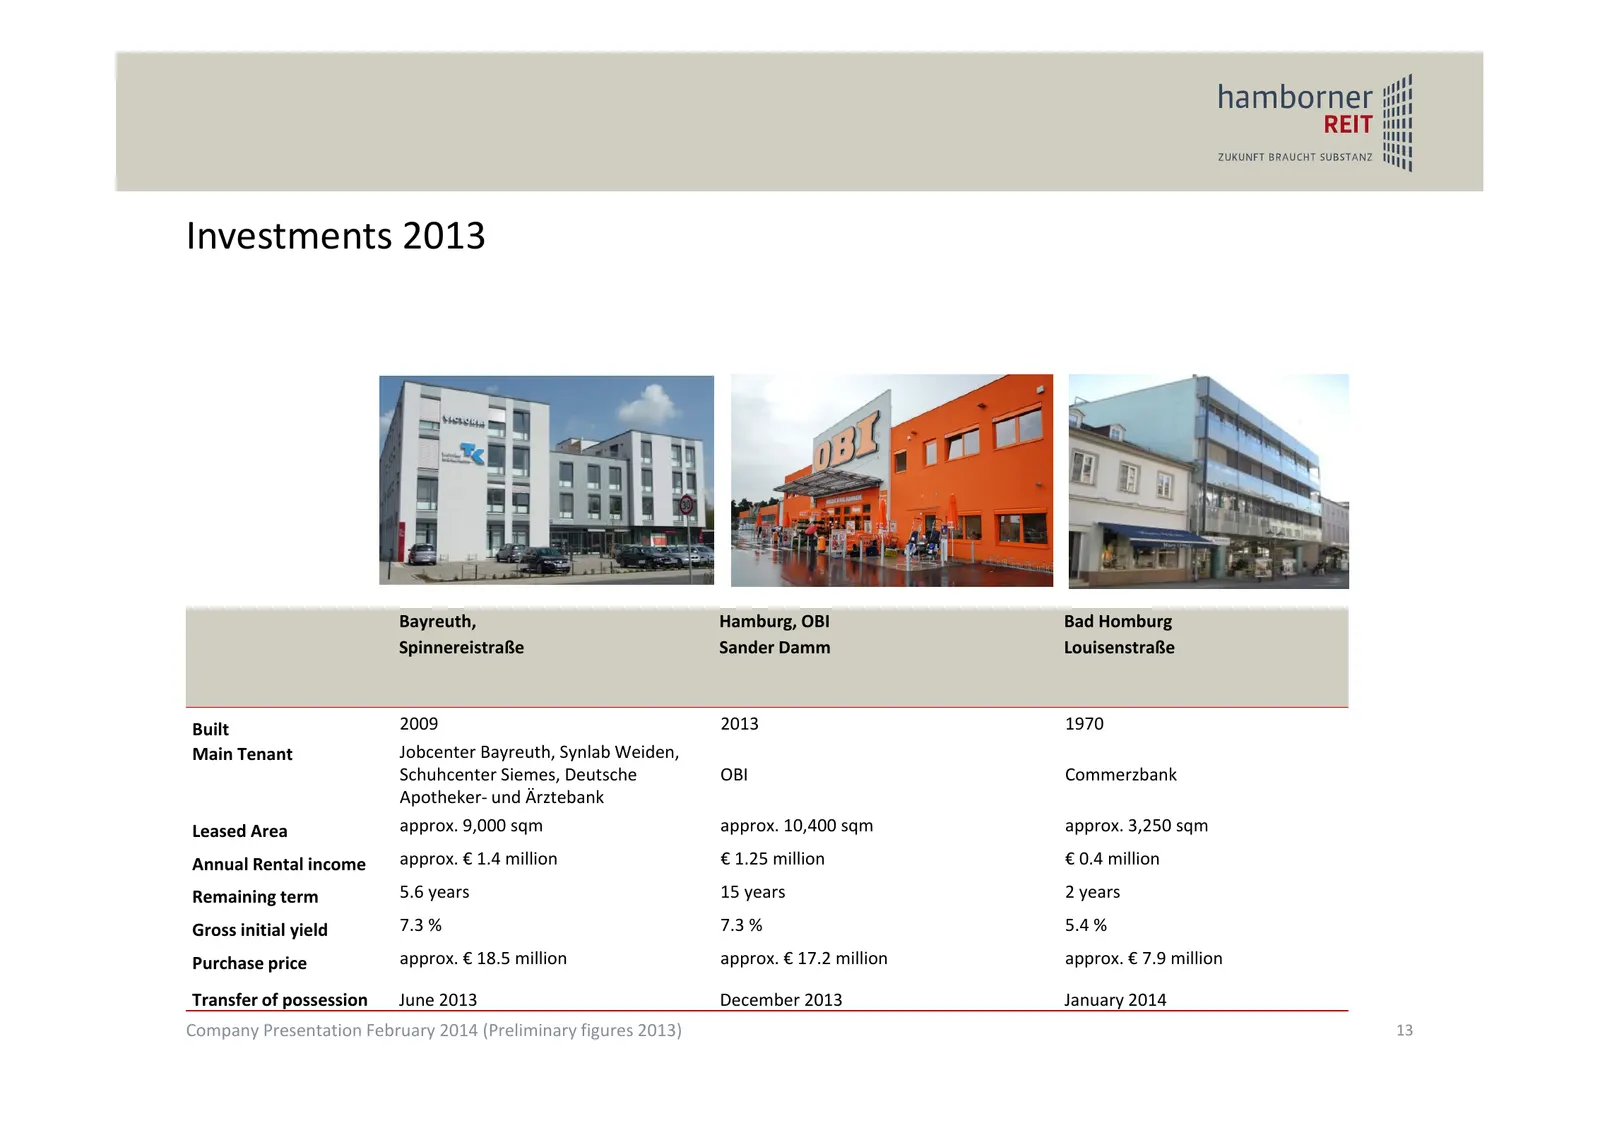
Investments 2013 Bayreuth, Hamburg, OBI Bad Homburg Spinnereistraße Sander Damm Louisenstraße Built 2009 2013 1970 Main Tenant Jobcenter Bayreuth, Synlab Weiden, Schuhcenter Siemes, Deutsche OBI Commerzbank Apotheker‐ und Ärztebank Leased Area approx. 9,000 sqm approx. 10,400 sqm approx. 3,250 sqm A
Slide 14: Sale of non strategic assets
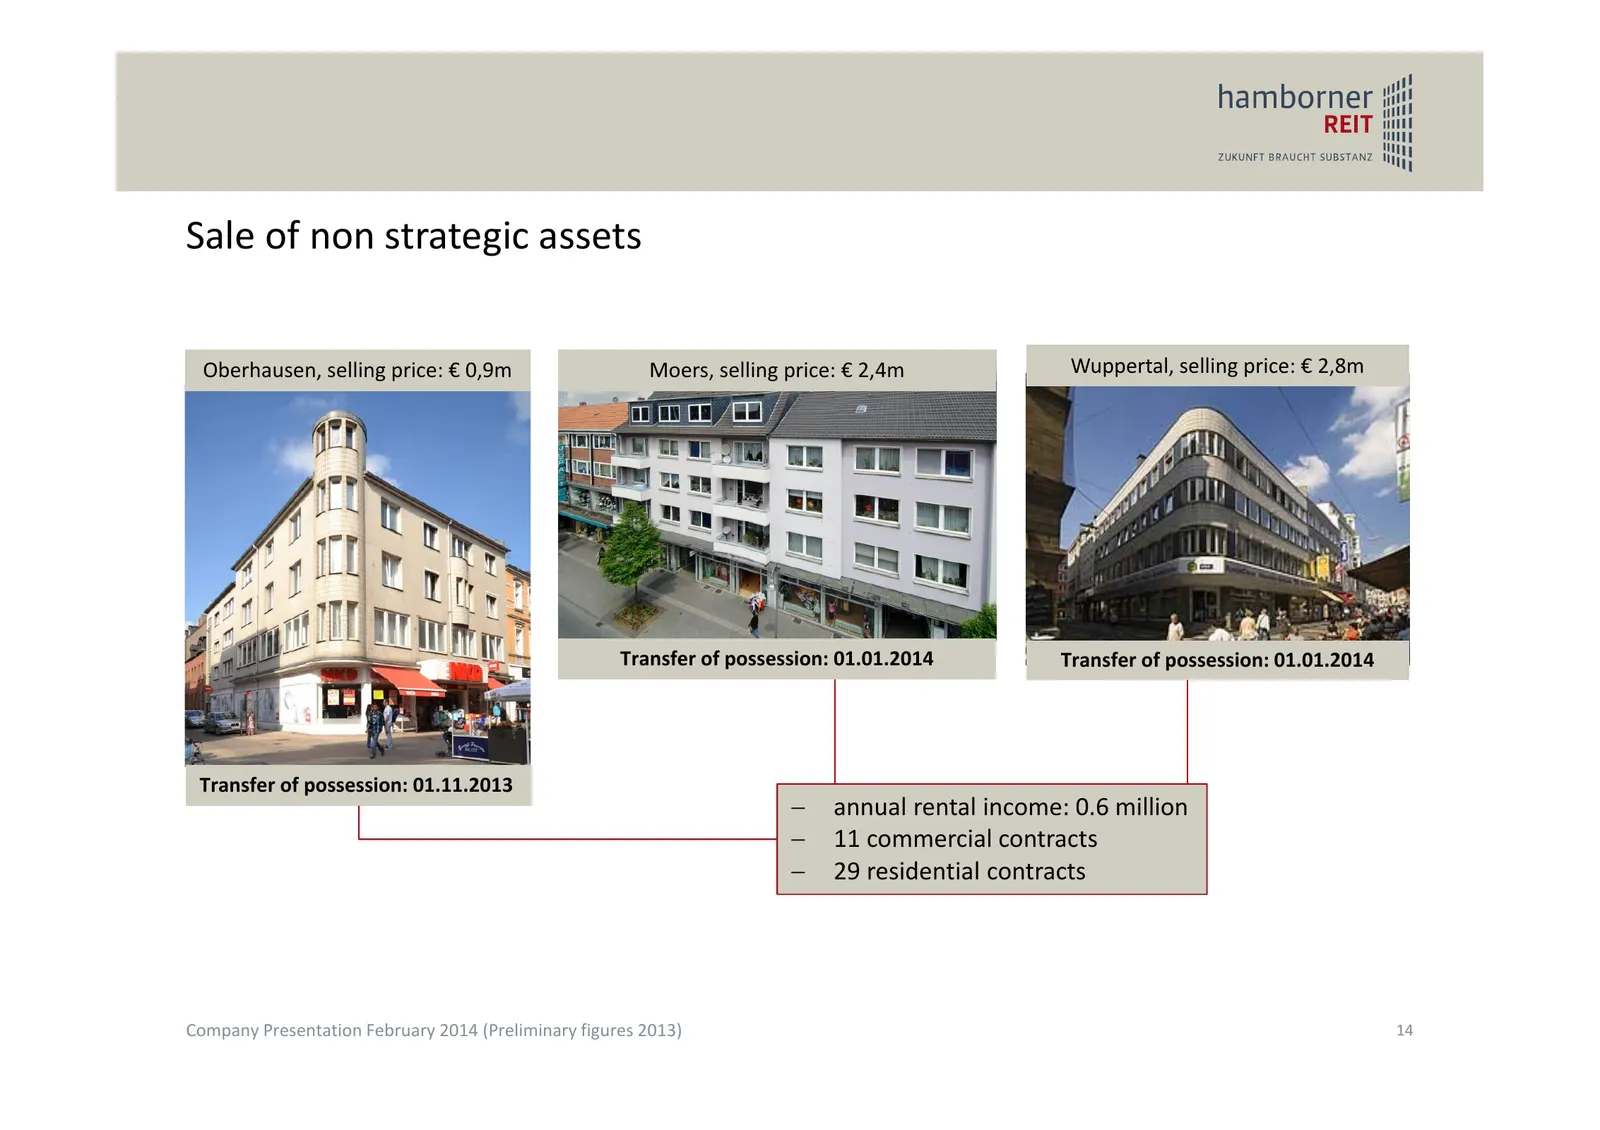
Sale of non strategic assets Oberhausen, selling price: € 0,9m Moers, selling price: € 2,4m Wuppertal, selling price: € 2,8m Transfer of possession: 01.01.2014 Transfer of possession: 01.01.2014 Transfer of possession: 01.11.2013 annual rental income: 0.6 million 11 commercial contracts 29 res
Slide 15: Further divestments
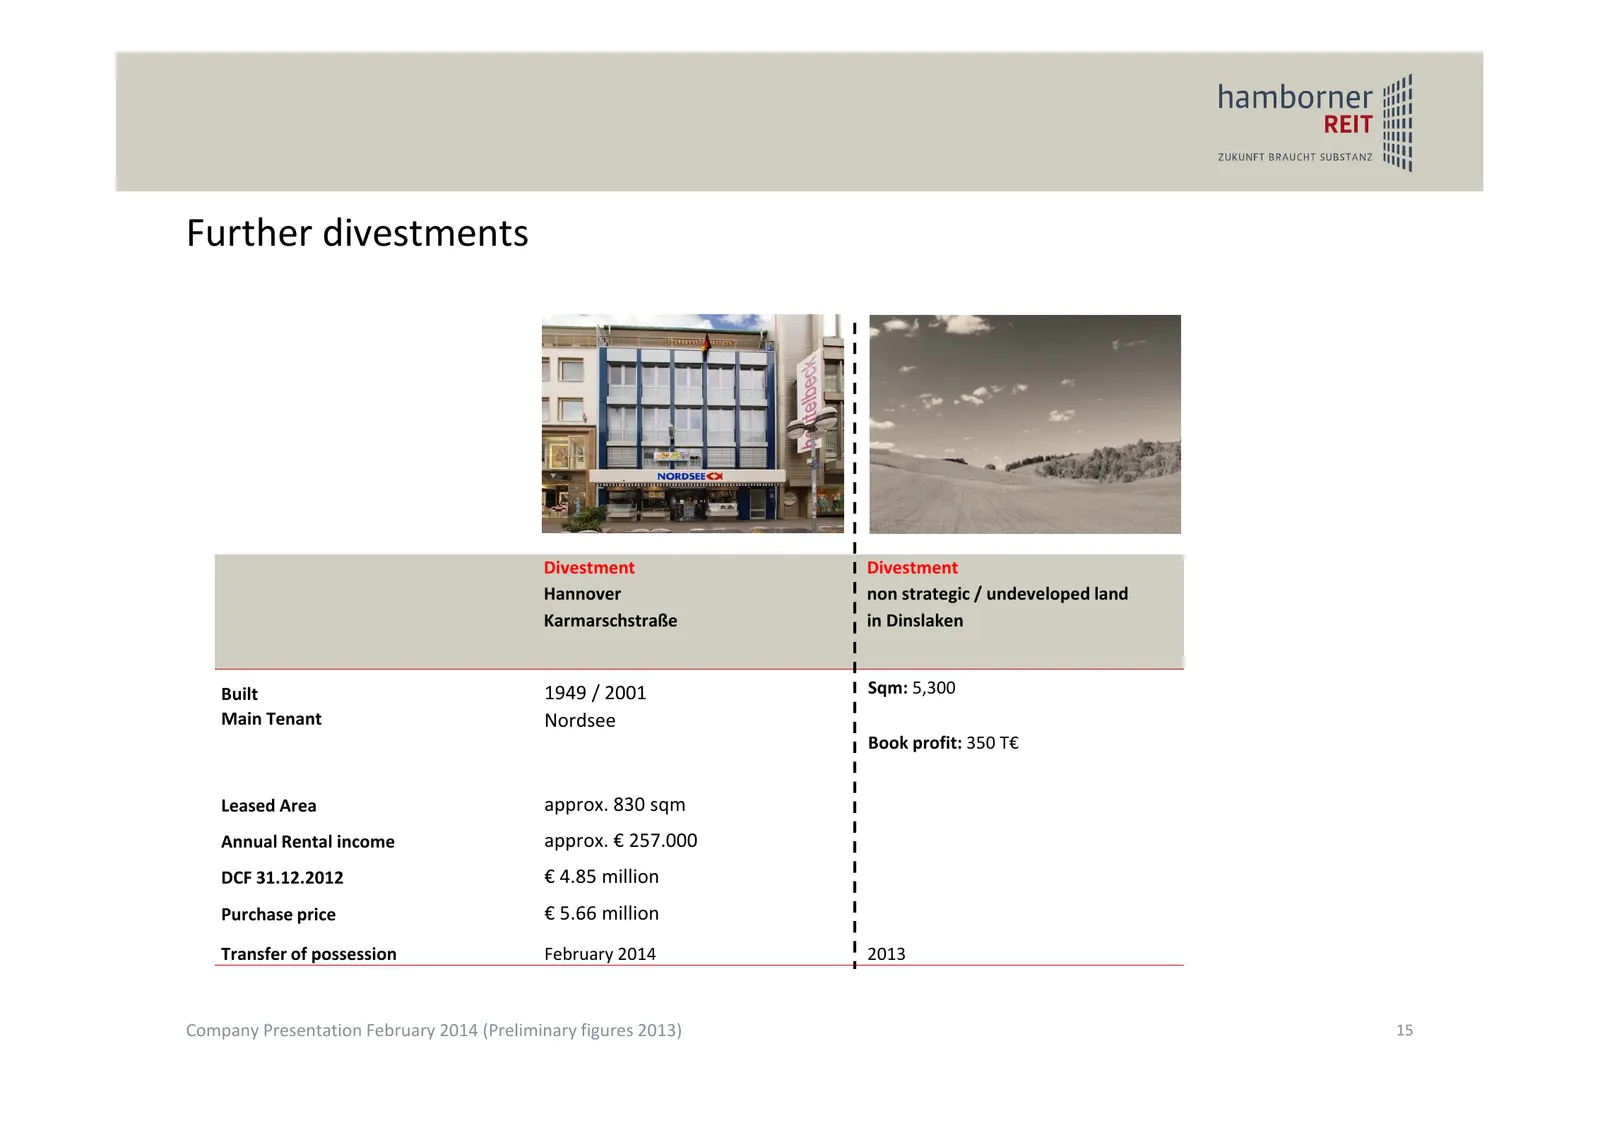
Further divestments Divestment Divestment Hannover non strategic / undeveloped land Karmarschstraße in Dinslaken Built 1949 / 2001 Sqm: 5,300 Main Tenant Nordsee Book profit: 350 T€ Leased Area approx. 830 sqm Annual Rental income approx. € 257.000 DCF 31.12.2012 € 4.85 million Purchase price € 5.66
Slide 16: Agenda
Agenda 1 History / Capital markets track record 2 Organisation / Portfolio / Investments 2013 3 Asset Management 4 Financial Position / Preliminary figures 2013 Company Presentation February 2014 (Preliminary figures 2013) 16
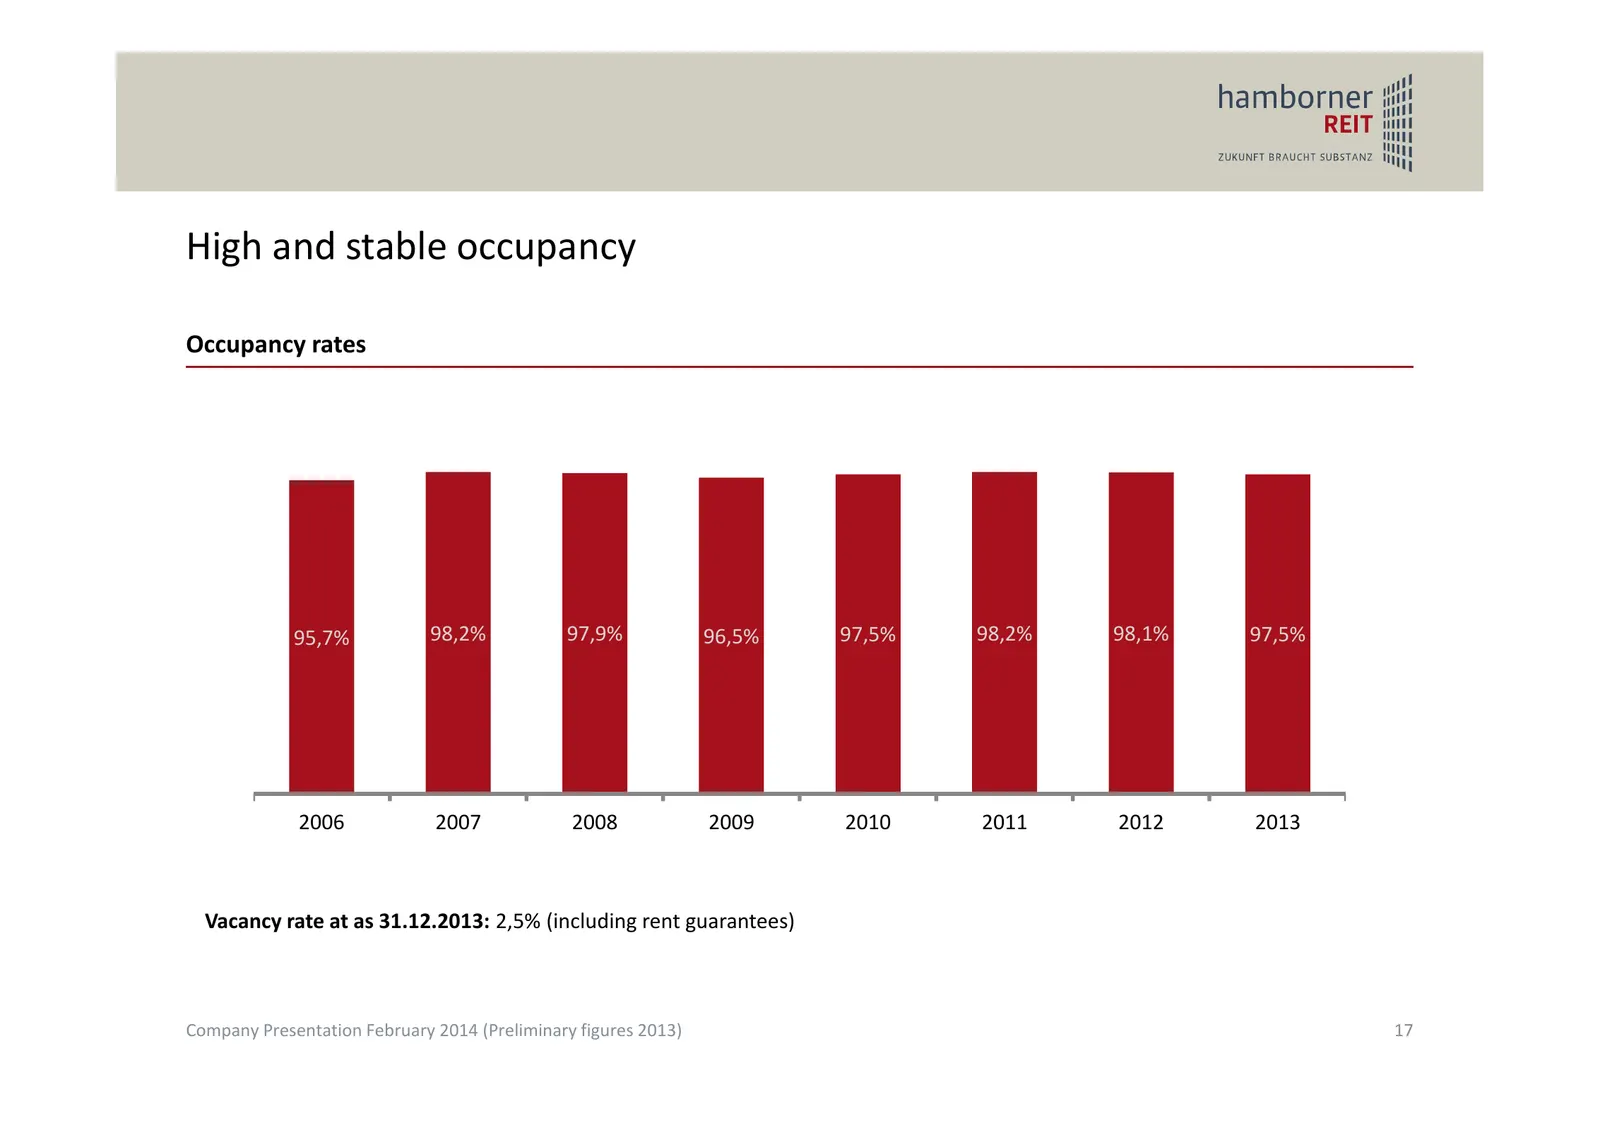
Slide 17: High and stable occupancy
High and stable occupancy Occupancy rates 95,7% 98,2% 97,9% 96,5% 97,5% 98,2% 98,1% 97,5% 2006 2007 2008 2009 2010 2011 2012 2013 Vacancy rate at as 31.12.2013: 2,5% (including rent guarantees) Company Presentation February 2014 (Preliminary figures 2013) 17
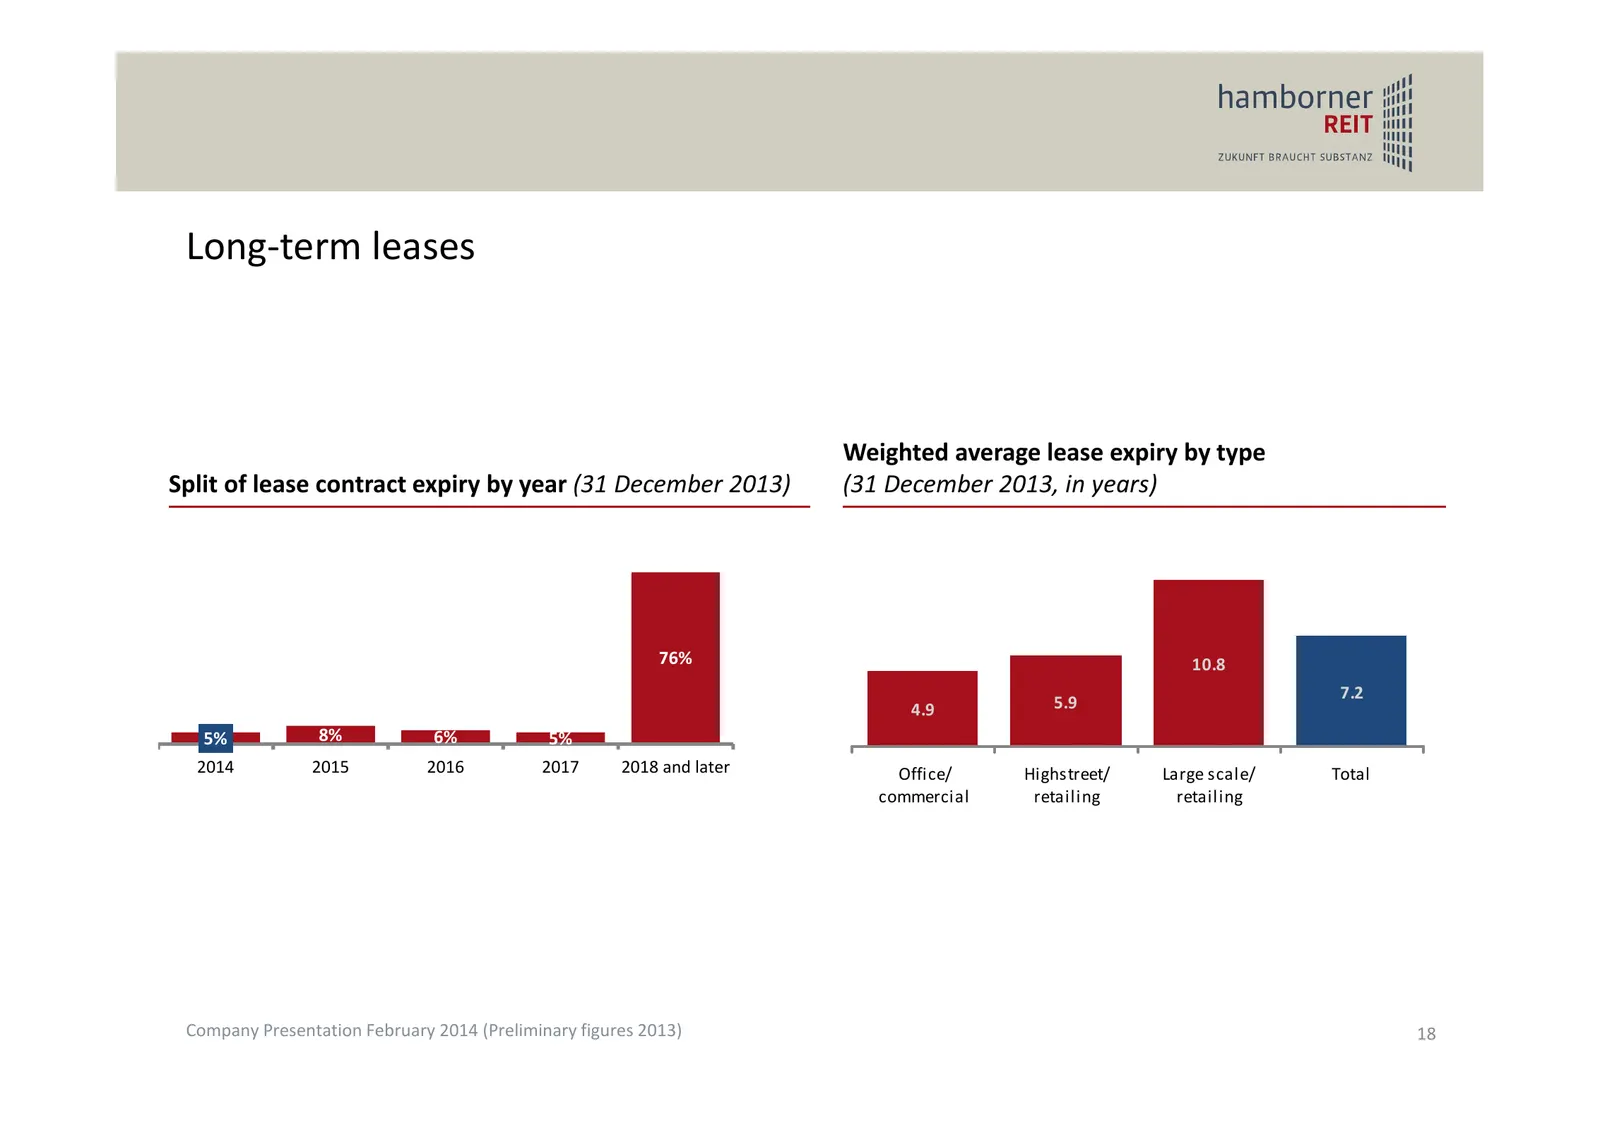
Slide 18: Long-term leases
Long‐term leases Weighted average lease expiry by type Split of lease contract expiry by year (31 December 2013) (31 December 2013, in years) 76% 10.8 7.2 4.9 5.9 5% 8% 6% 5% 2014 2015 2016 2017 2018 and later Office/ Highstreet/ Large scale/ Total commercial retailing retailing Company Presentation
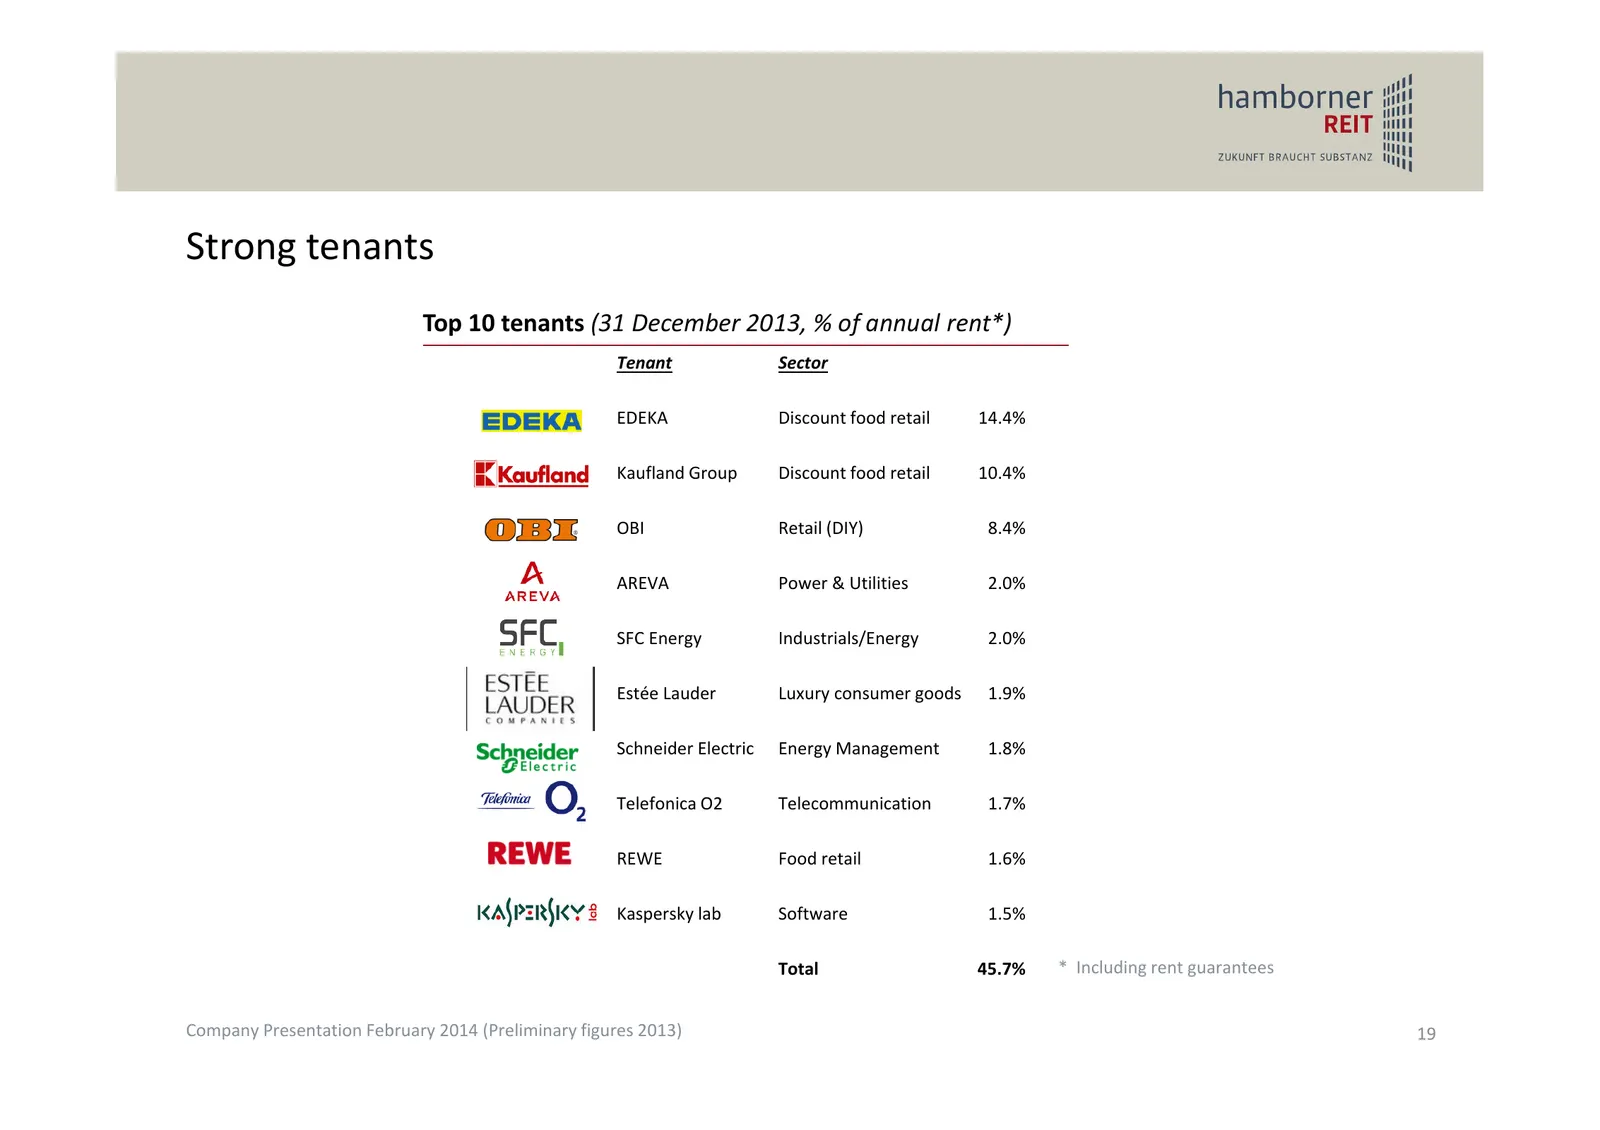
Slide 19: Strong tenants
Strong tenants Top 10 tenants (31 December 2013, % of annual rent*) Tenant Sector EDEKA Discount food retail 14.4% Kaufland Group Discount food retail 10.4% OBI Retail (DIY) 8.4% AREVA Power & Utilities 2.0% SFC Energy Industrials/Energy 2.0% Estée Lauder Luxury consumer goods 1.9% Schneider Electri
Slide 20: Agenda
Agenda 1 History / Capital markets track record 2 Organisation / Portfolio / Investments 2013 3 Asset Management 4 Financial Position / Preliminary figures 2013 Company Presentation February 2014 (Preliminary figures 2013) 20
Slide 21: Stable and predictable cost of debt
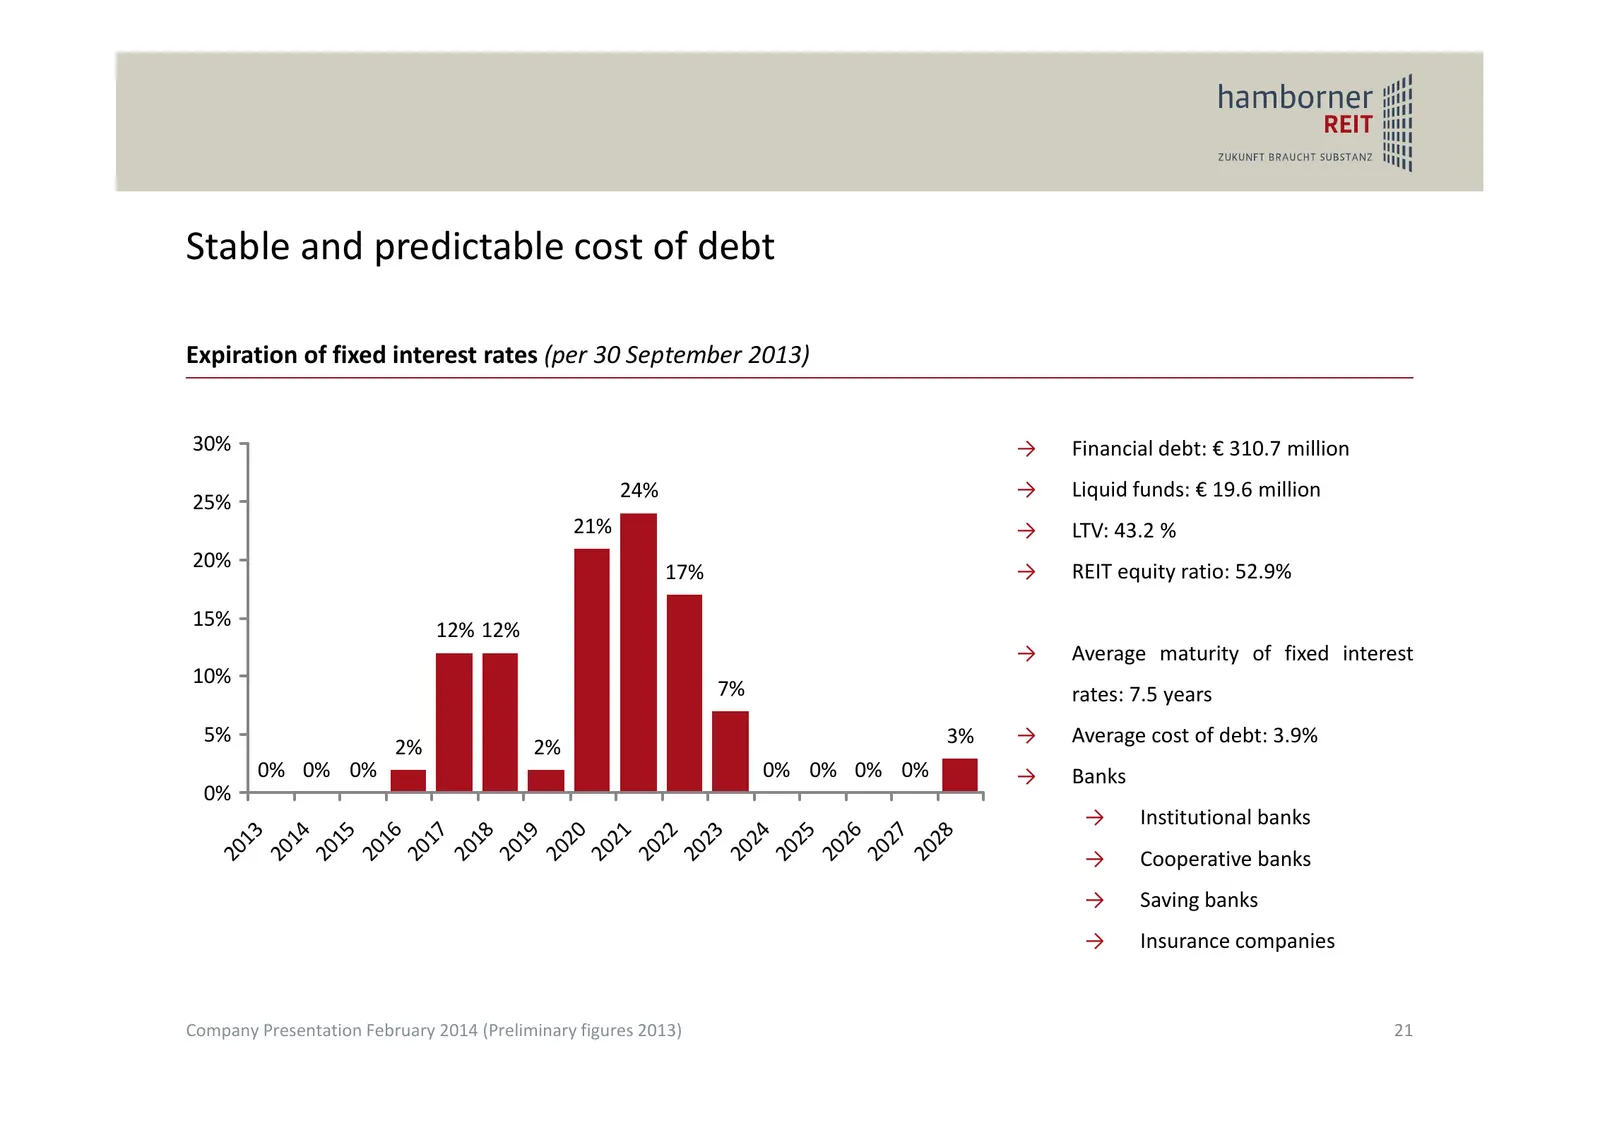
Stable and predictable cost of debt Expiration of fixed interest rates (per 30 September 2013) 30% → Financial debt: € 310.7 million 24% → Liquid funds: € 19.6 million 25% 21% → LTV: 43.2 % 20% 17% → REIT equity ratio: 52.9% 15% 12% 12% → Average maturity of fixed interest 10% 7% rates: 7.5 years 5%
Slide 22: Low LTV, equity ratio well within REIT criteria
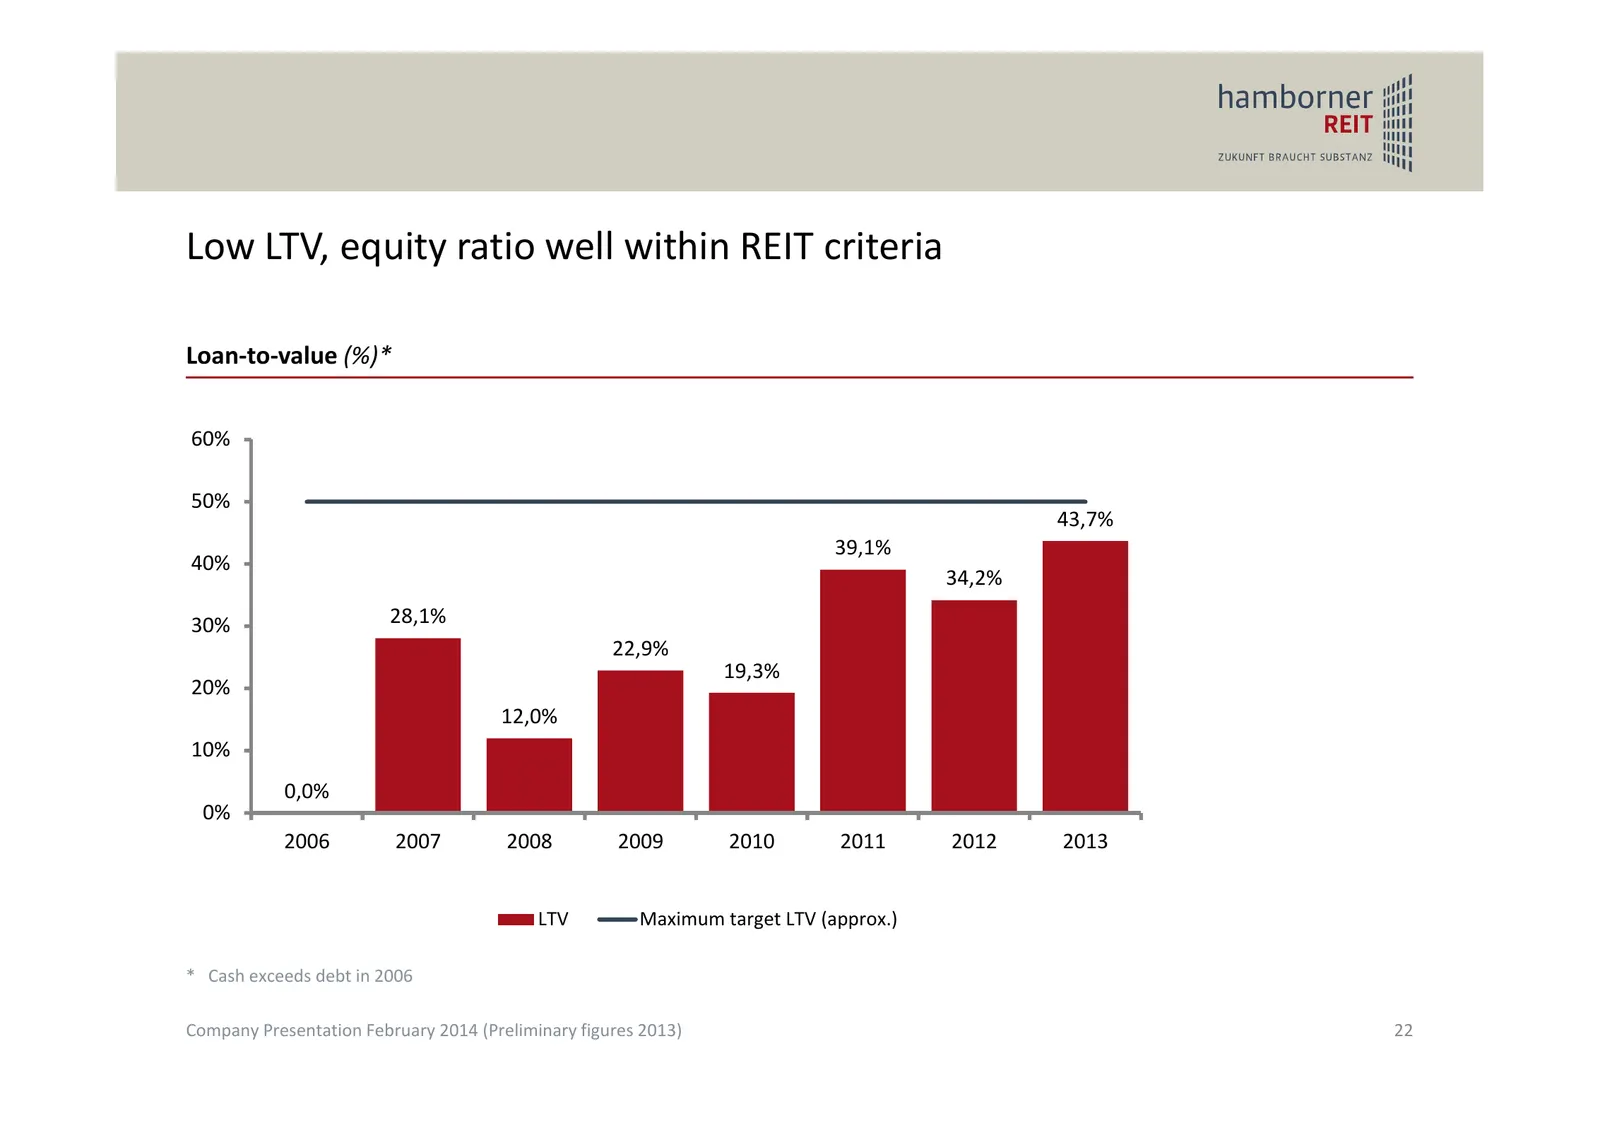
Low LTV, equity ratio well within REIT criteria Loan‐to‐value (%)* 60% 50% 43,7% 39,1% 40% 34,2% 30% 28,1% 22,9% 19,3% 20% 12,0% 10% 0,0% 0% 2006 2007 2008 2009 2010 2011 2012 2013 LTV Maximum target LTV (approx.) * Cash exceeds debt in 2006 Company Presentation February 2014 (Preliminary figures 20
Slide 23: Preliminary key figures for 2013
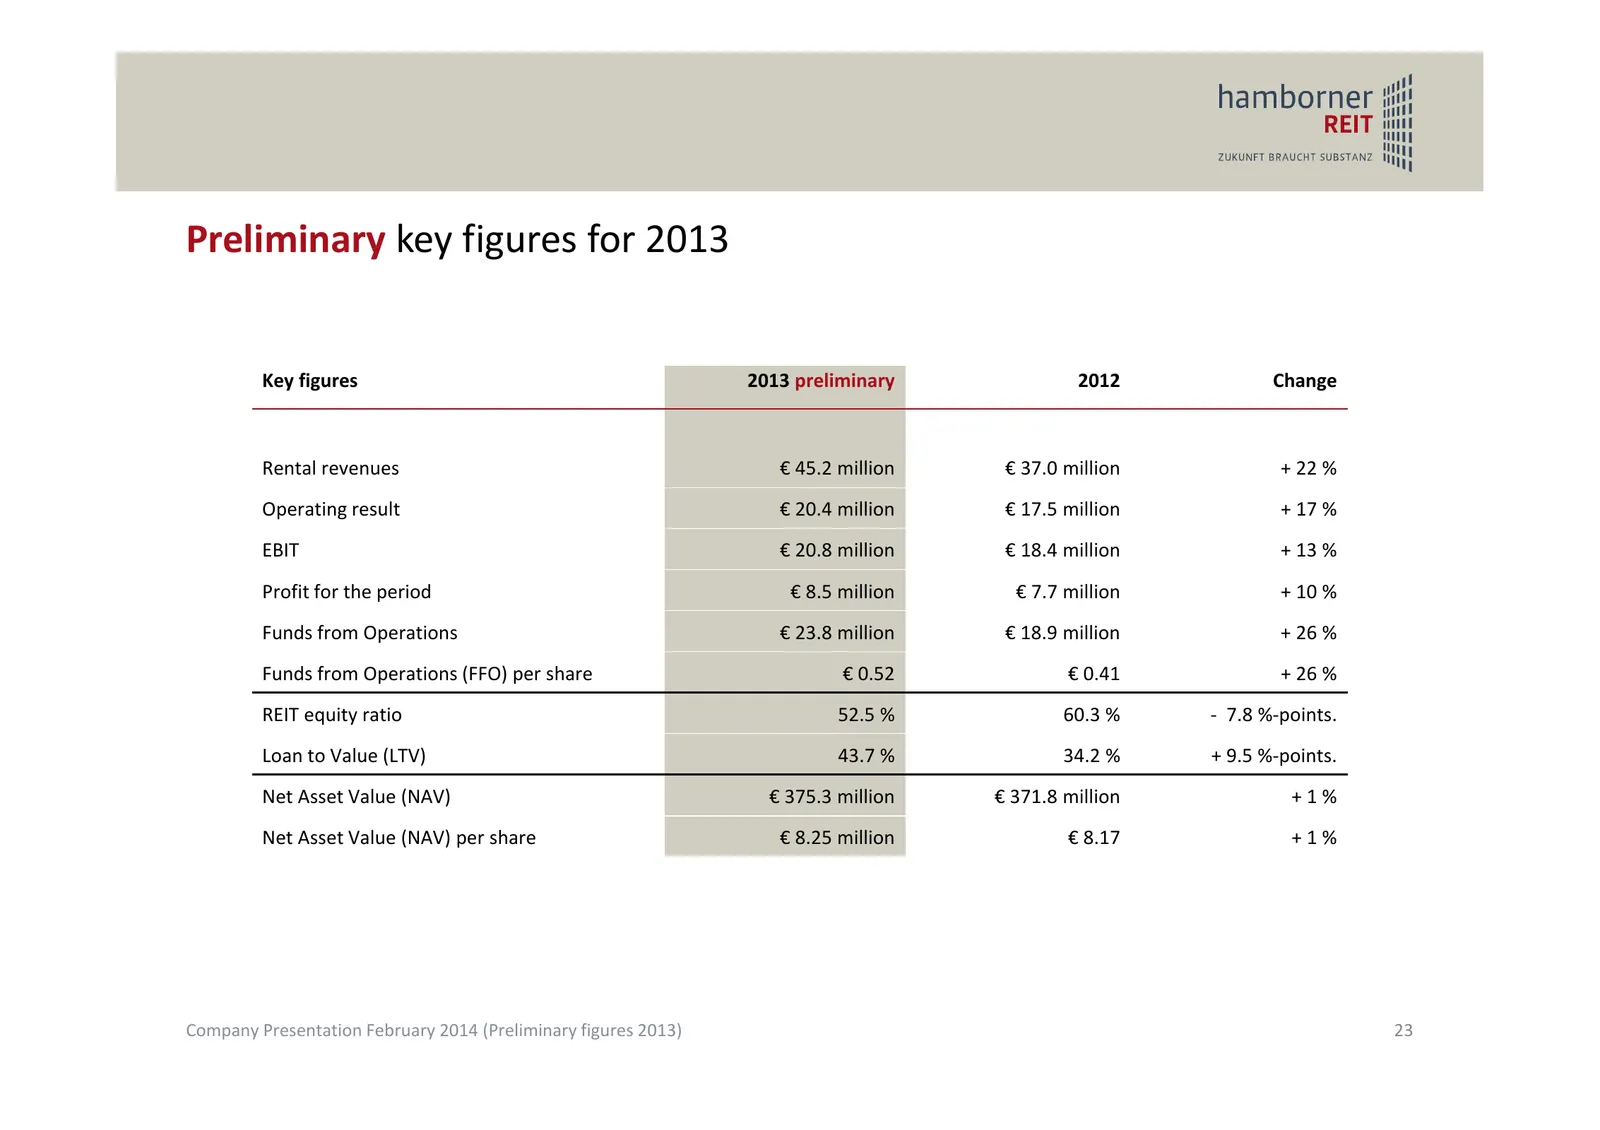
Preliminary key figures for 2013 Key figures 2013 preliminary 2012 Change Rental revenues € 45.2 million € 37.0 million + 22 % Operating result € 20.4 million € 17.5 million + 17 % EBIT € 20.8 million € 18.4 million + 13 % Profit for the period € 8.5 million € 7.7 million + 10 % Funds from Operation
Slide 24: Benefitting from economies of scale
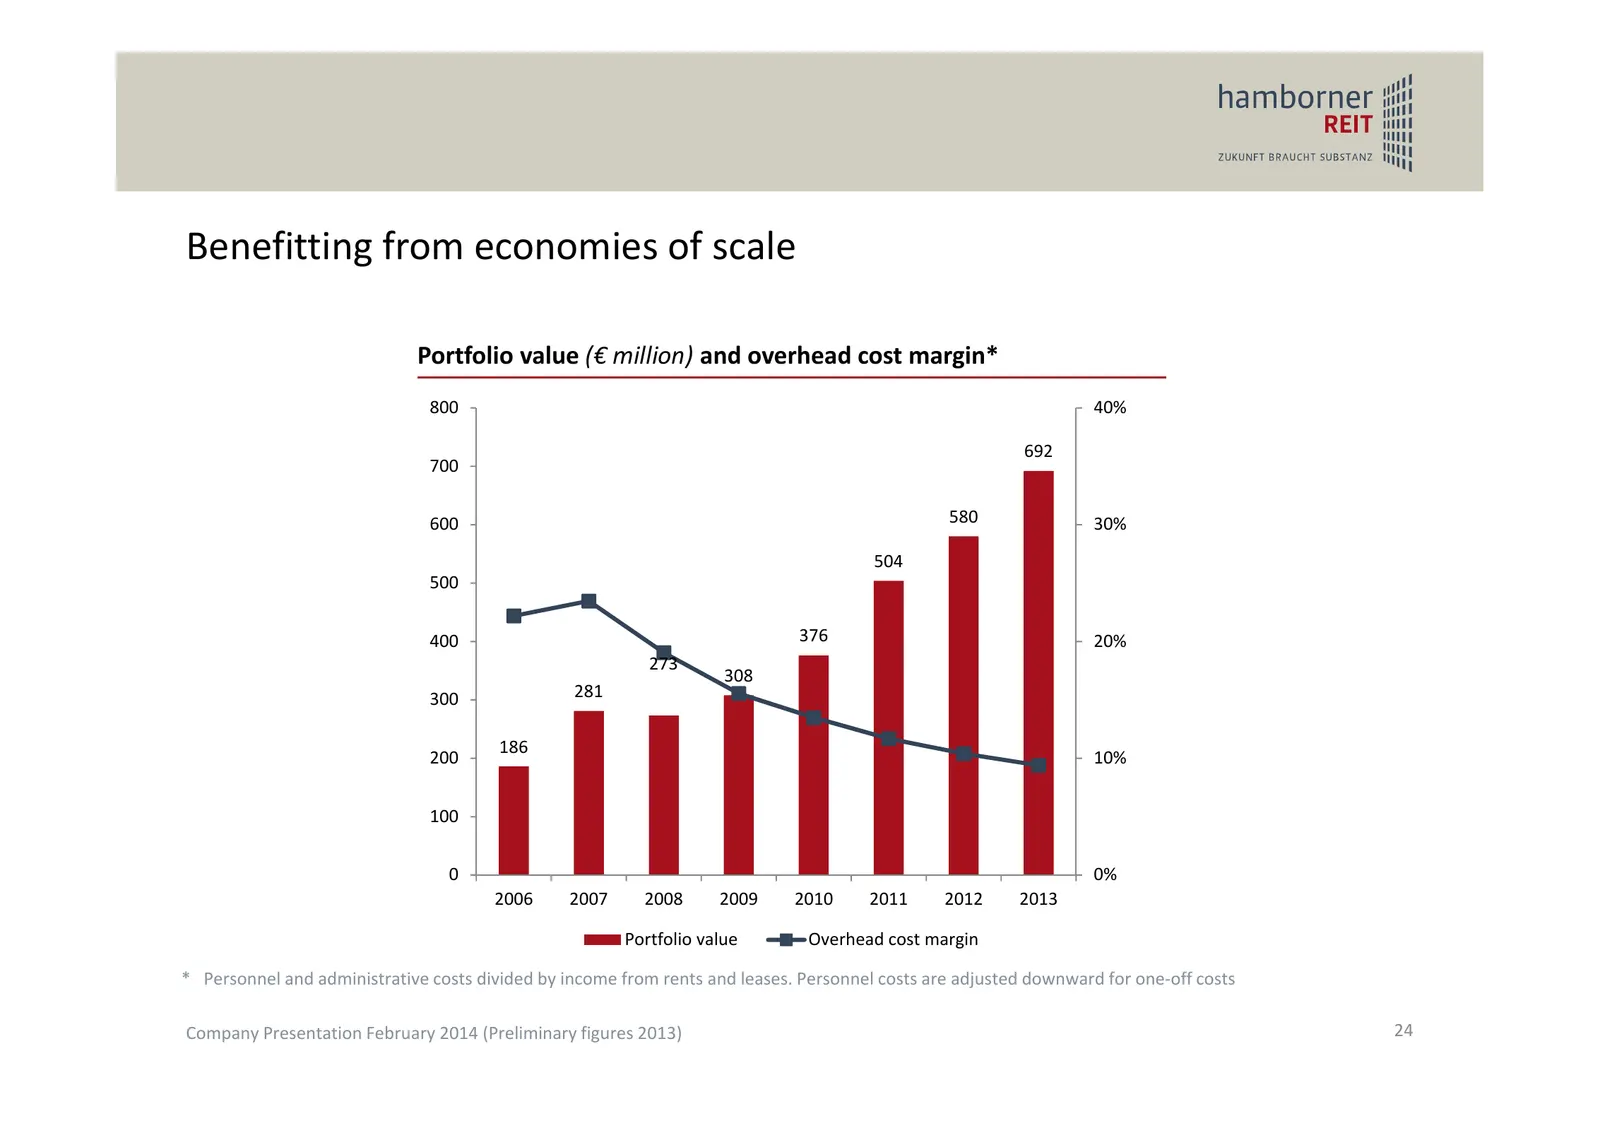
Benefitting from economies of scale Portfolio value (€ million) and overhead cost margin* 800 40% 692 700 600 580 30% 504 500 400 376 20% 273 308 300 281 186 200 10% 100 0 0% 2006 2007 2008 2009 2010 2011 2012 2013 Portfolio value Overhead cost margin * Personnel and administrative costs divided by
Slide 25: FFO per share as key component for controlling
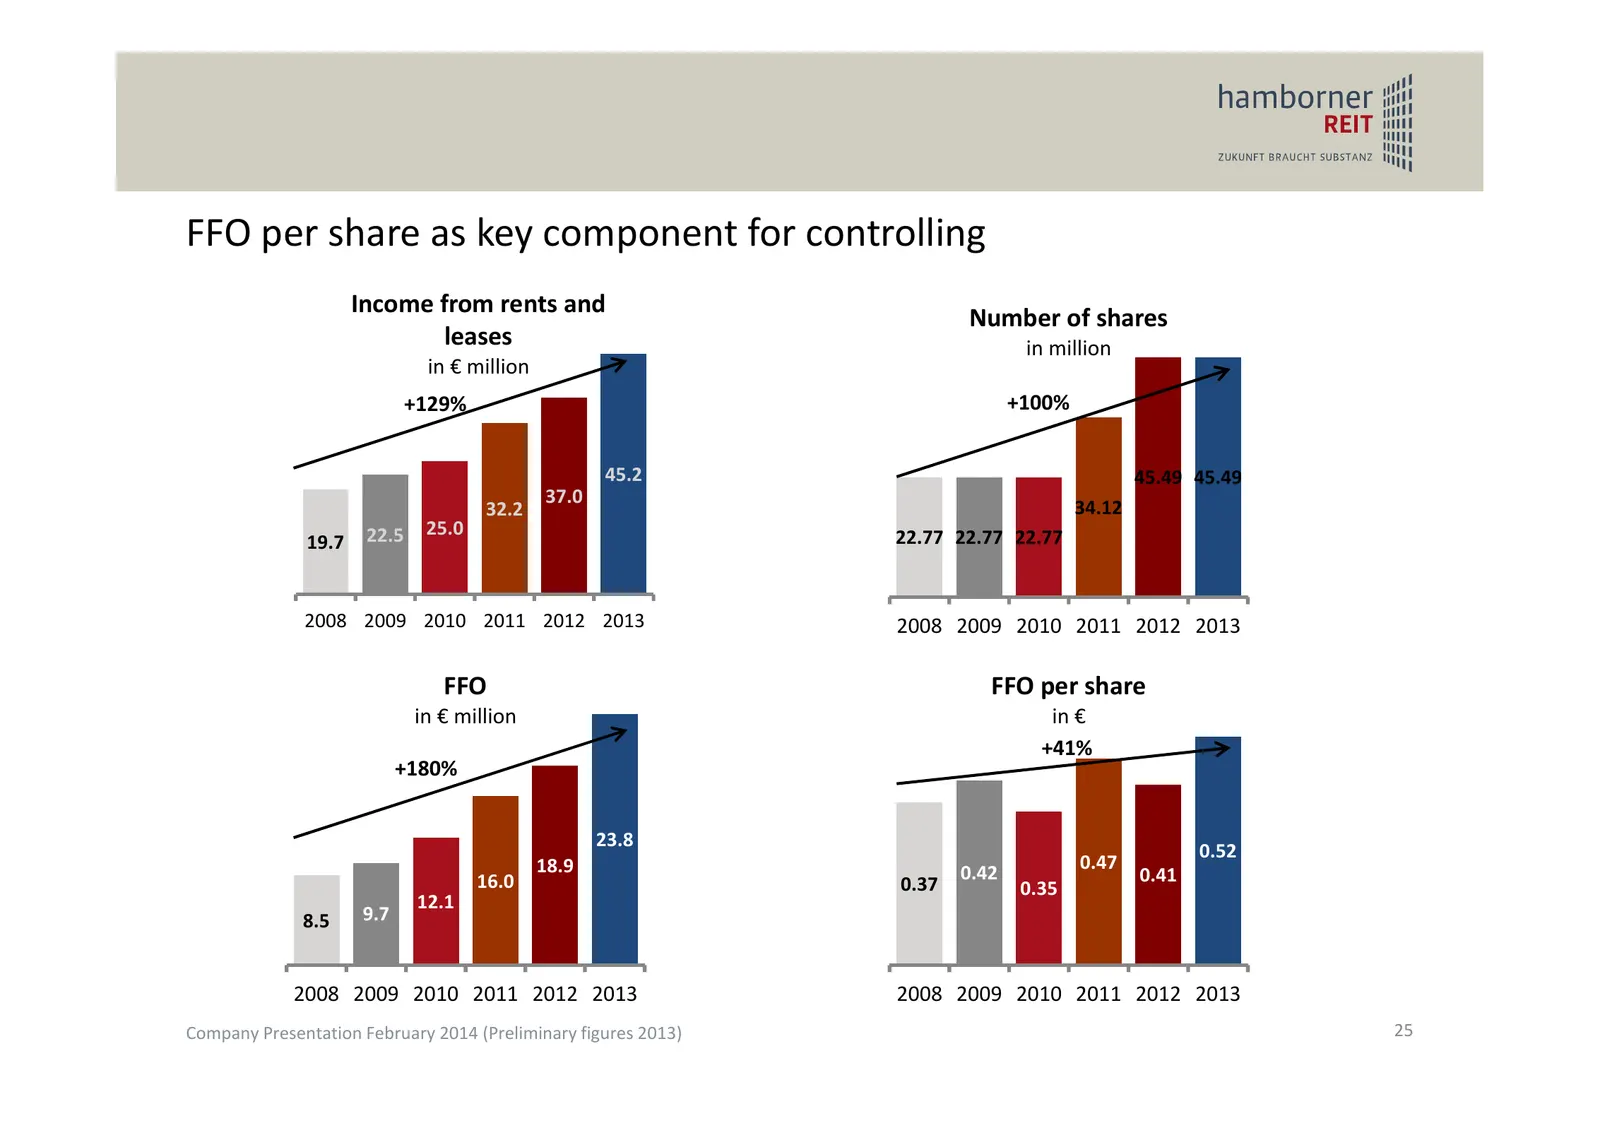
FFO per share as key component for controlling Income from rents and Number of shares leases in million in € million +129% +100% 45.2 45.49 45.49 37.0 32.2 34.12 22.5 25.0 22.77 22.77 22.77 19.7 2008 2009 2010 2011 2012 2013 2008 2009 2010 2011 2012 2013 FFO FFO per share in € million in € +41% +180
Slide 26: Increasing Funds From Operations and dividend per share
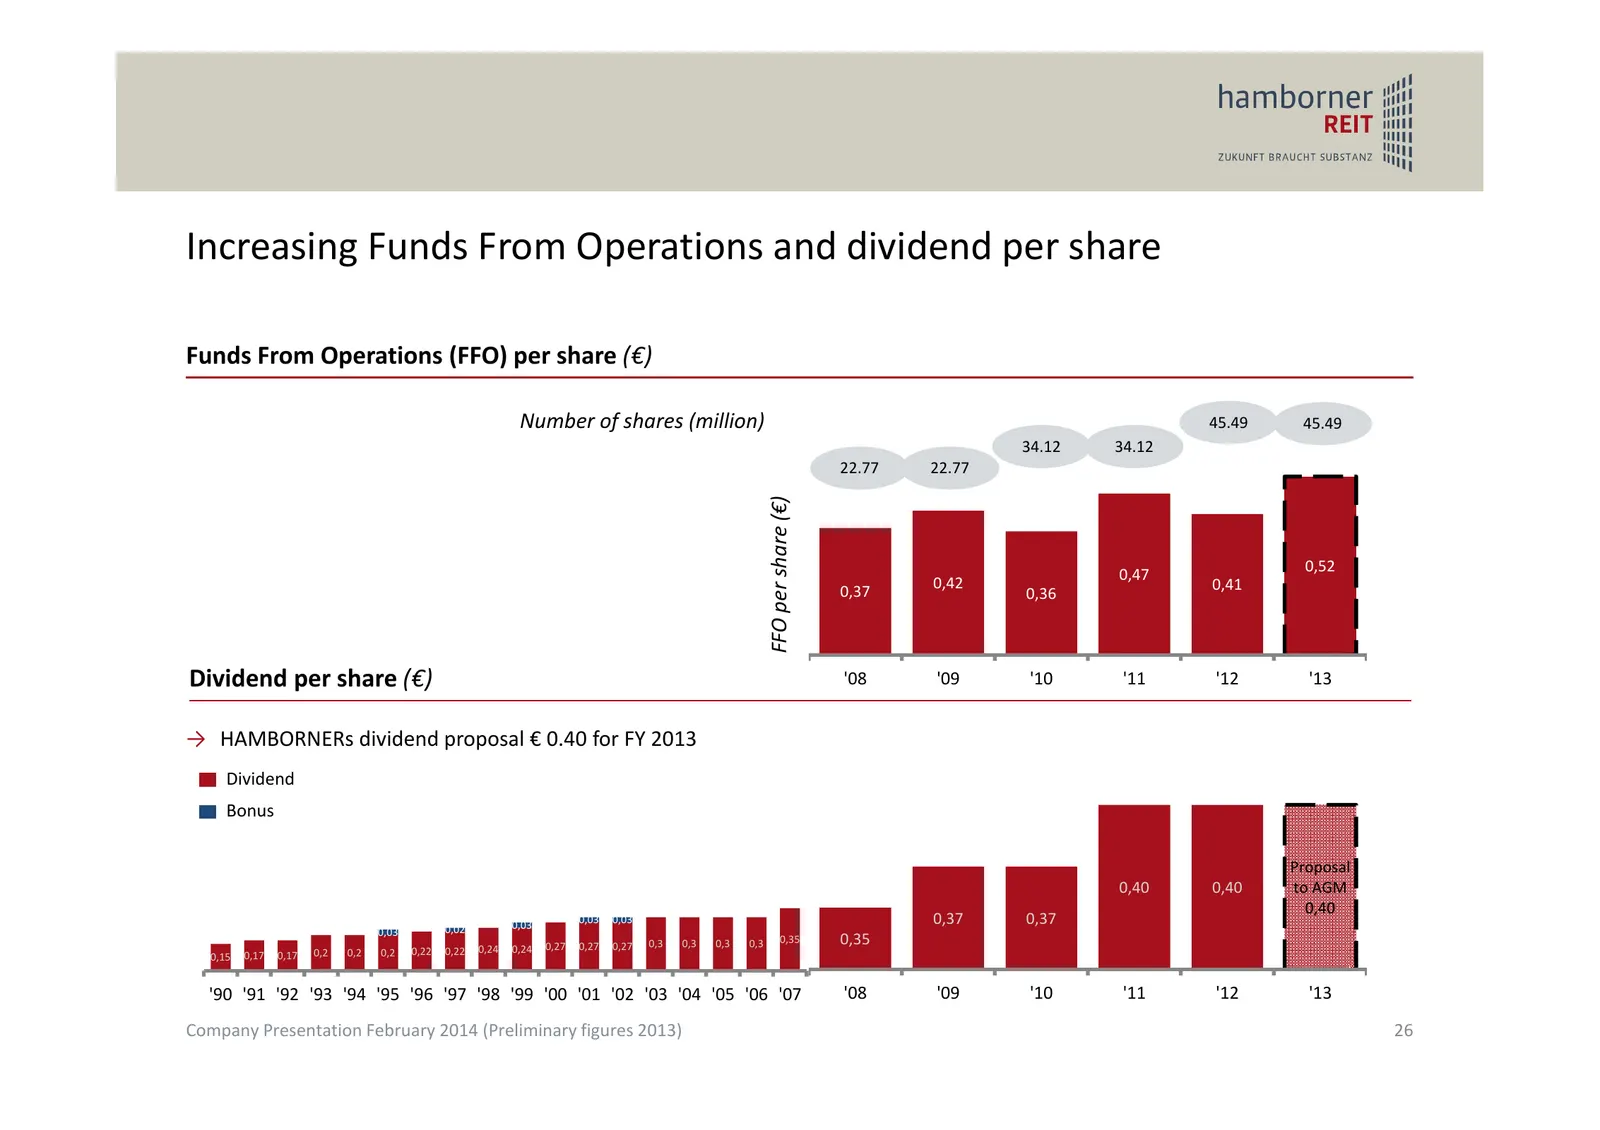
Increasing Funds From Operations and dividend per share Funds From Operations (FFO) per share (€) Number of shares (million) 45.49 45.49 34.12 34.12 22.77 22.77 FFO per share (€) 0,52 0,47 0,42 0,41 0,37 0,36 Dividend per share (€) '08 '09 '10 '11 '12 '13 → HAMBORNERs dividend proposal € 0.40 for FY
Slide 27: HAMBORNER REIT AG - key investment highlights
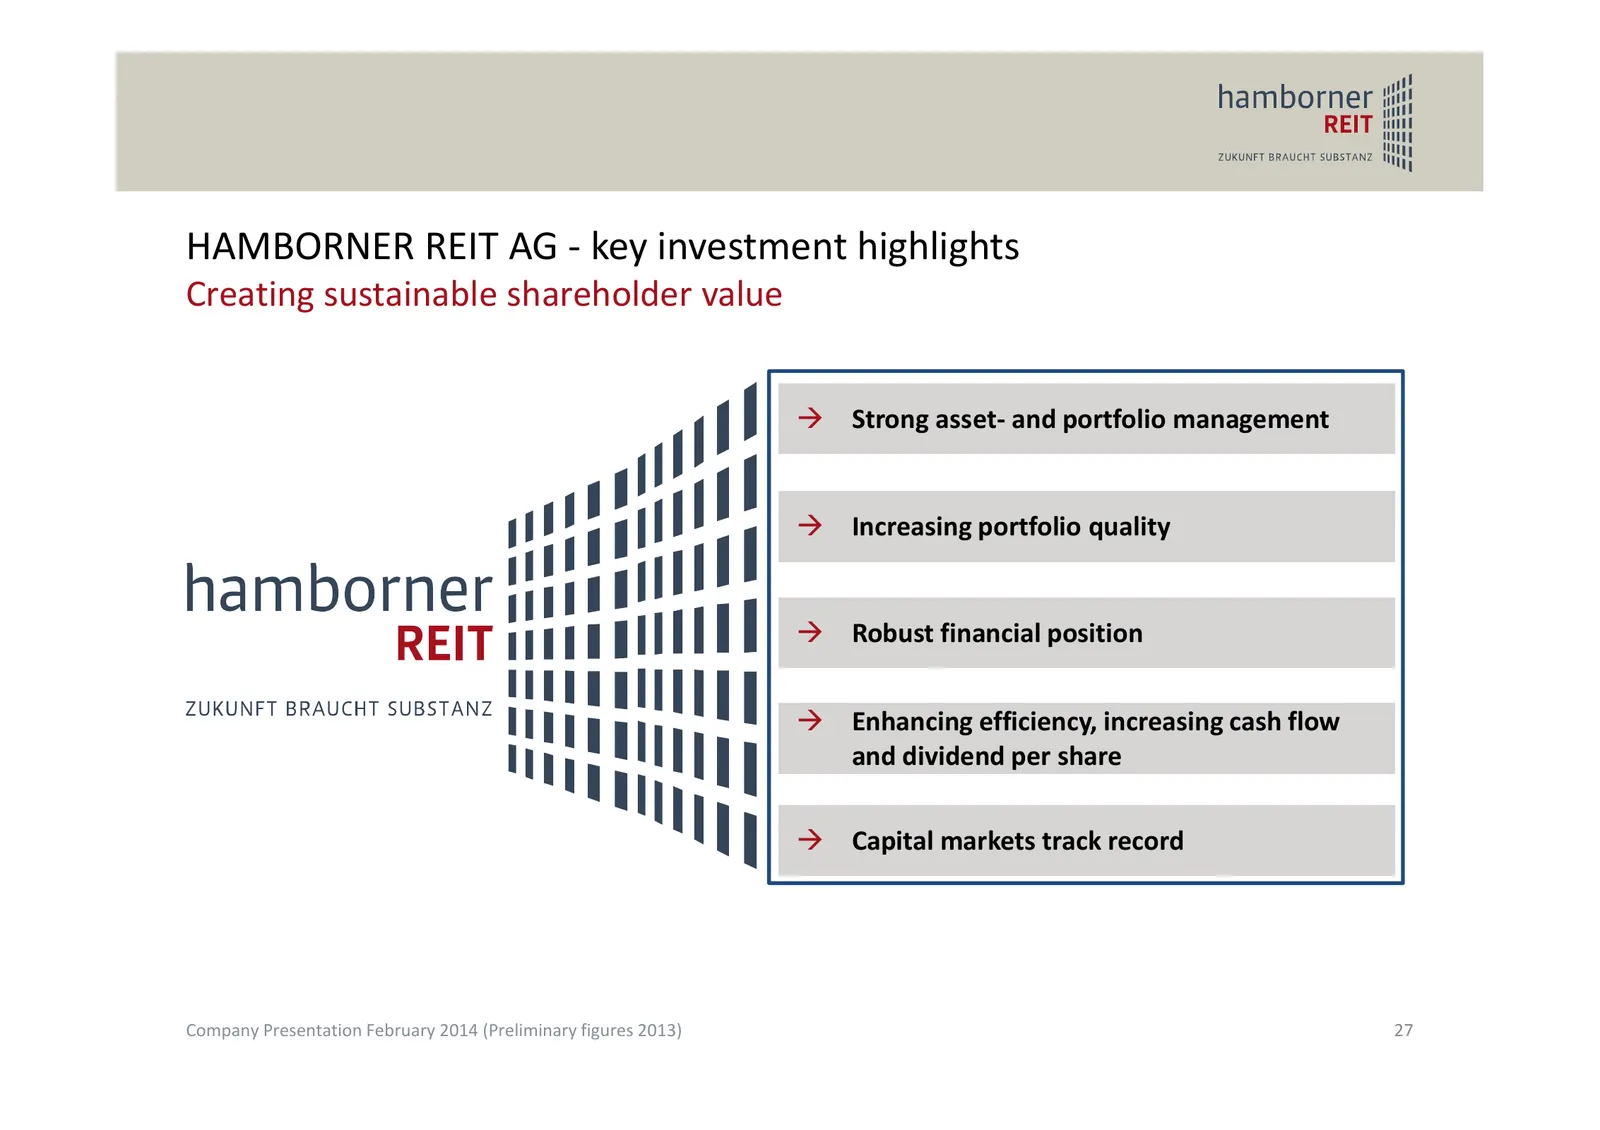
HAMBORNER REIT AG ‐ key investment highlights Creating sustainable shareholder value Strong asset‐ and portfolio management Increasing portfolio quality Robust financial position Enhancing efficiency, increasing cash flow and dividend per share Capital markets track record Company Presenta
Slide 28: Appendix (Q3 figures)
Appendix (Q3 figures) Annual report for fiscal 2013 will be published on 26 March 2014. Company Presentation February 2014 (Preliminary figures 2013) 28
Slide 29: First Sustainability Report
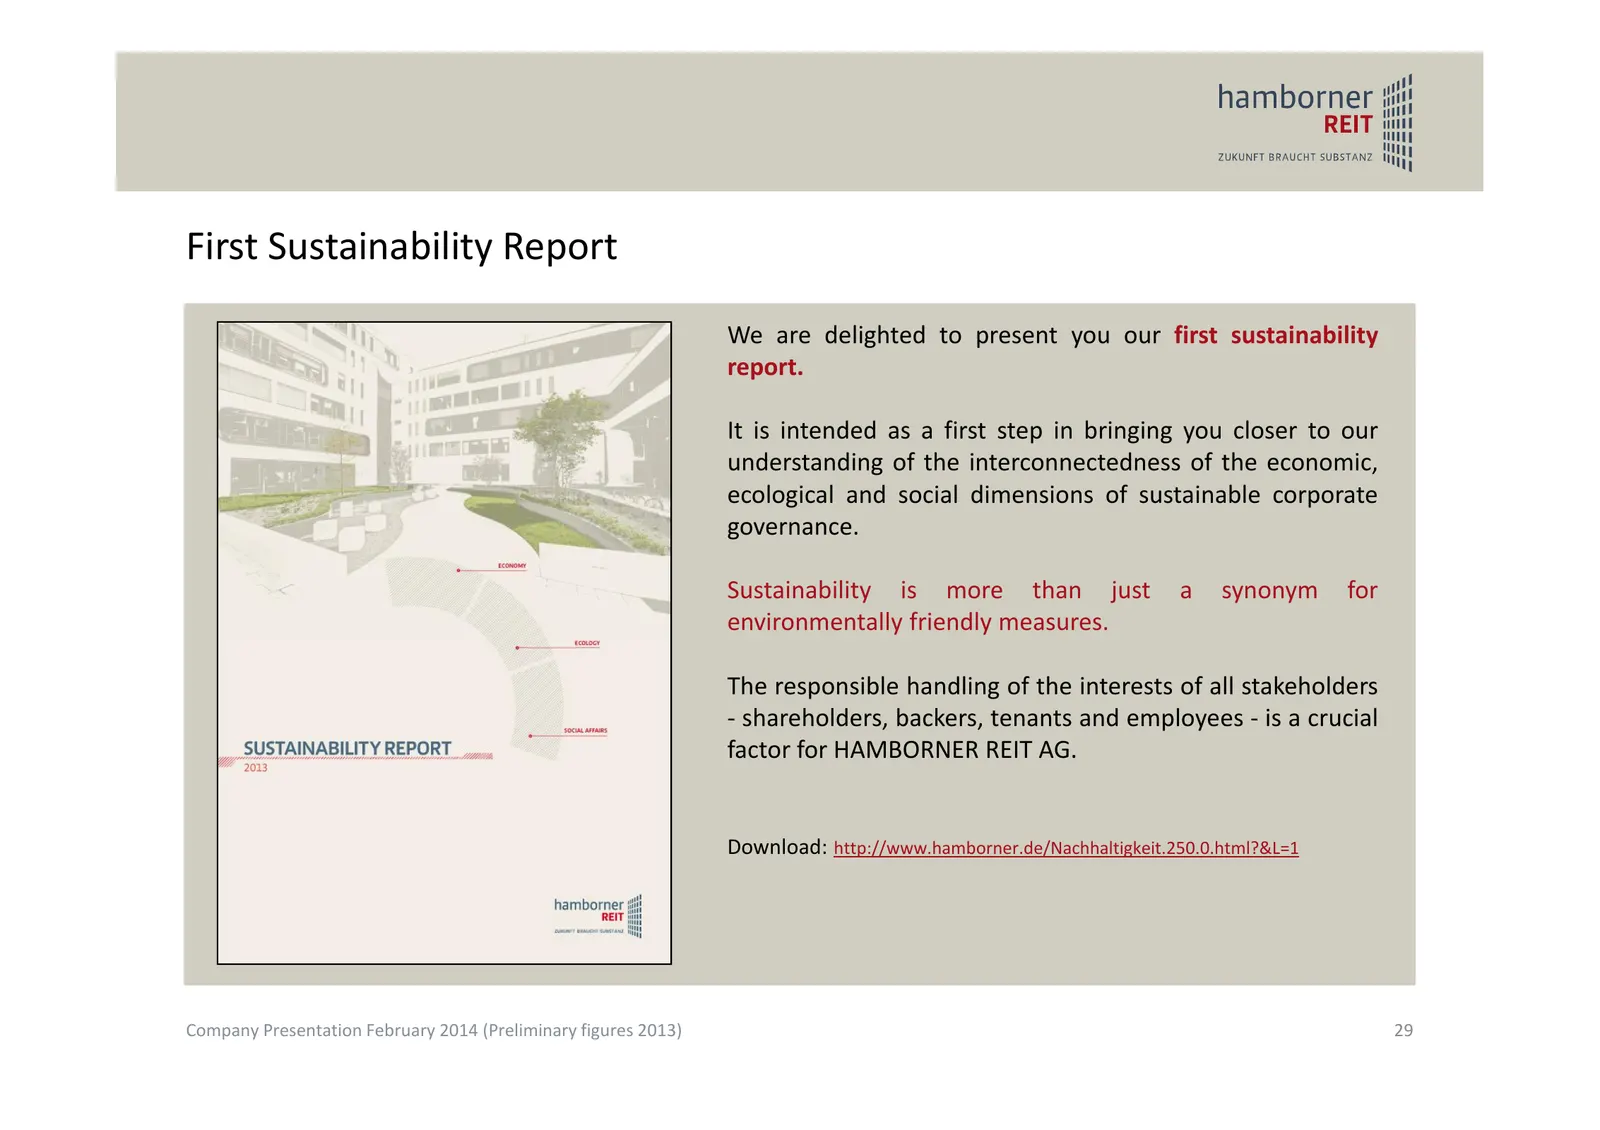
First Sustainability Report We are delighted to present you our first sustainability report. It is intended as a first step in bringing you closer to our understanding of the interconnectedness of the economic, ecological and social dimensions of sustainable corporate governance. Sustainability is m
Slide 30: Profit and loss account according to IFRS
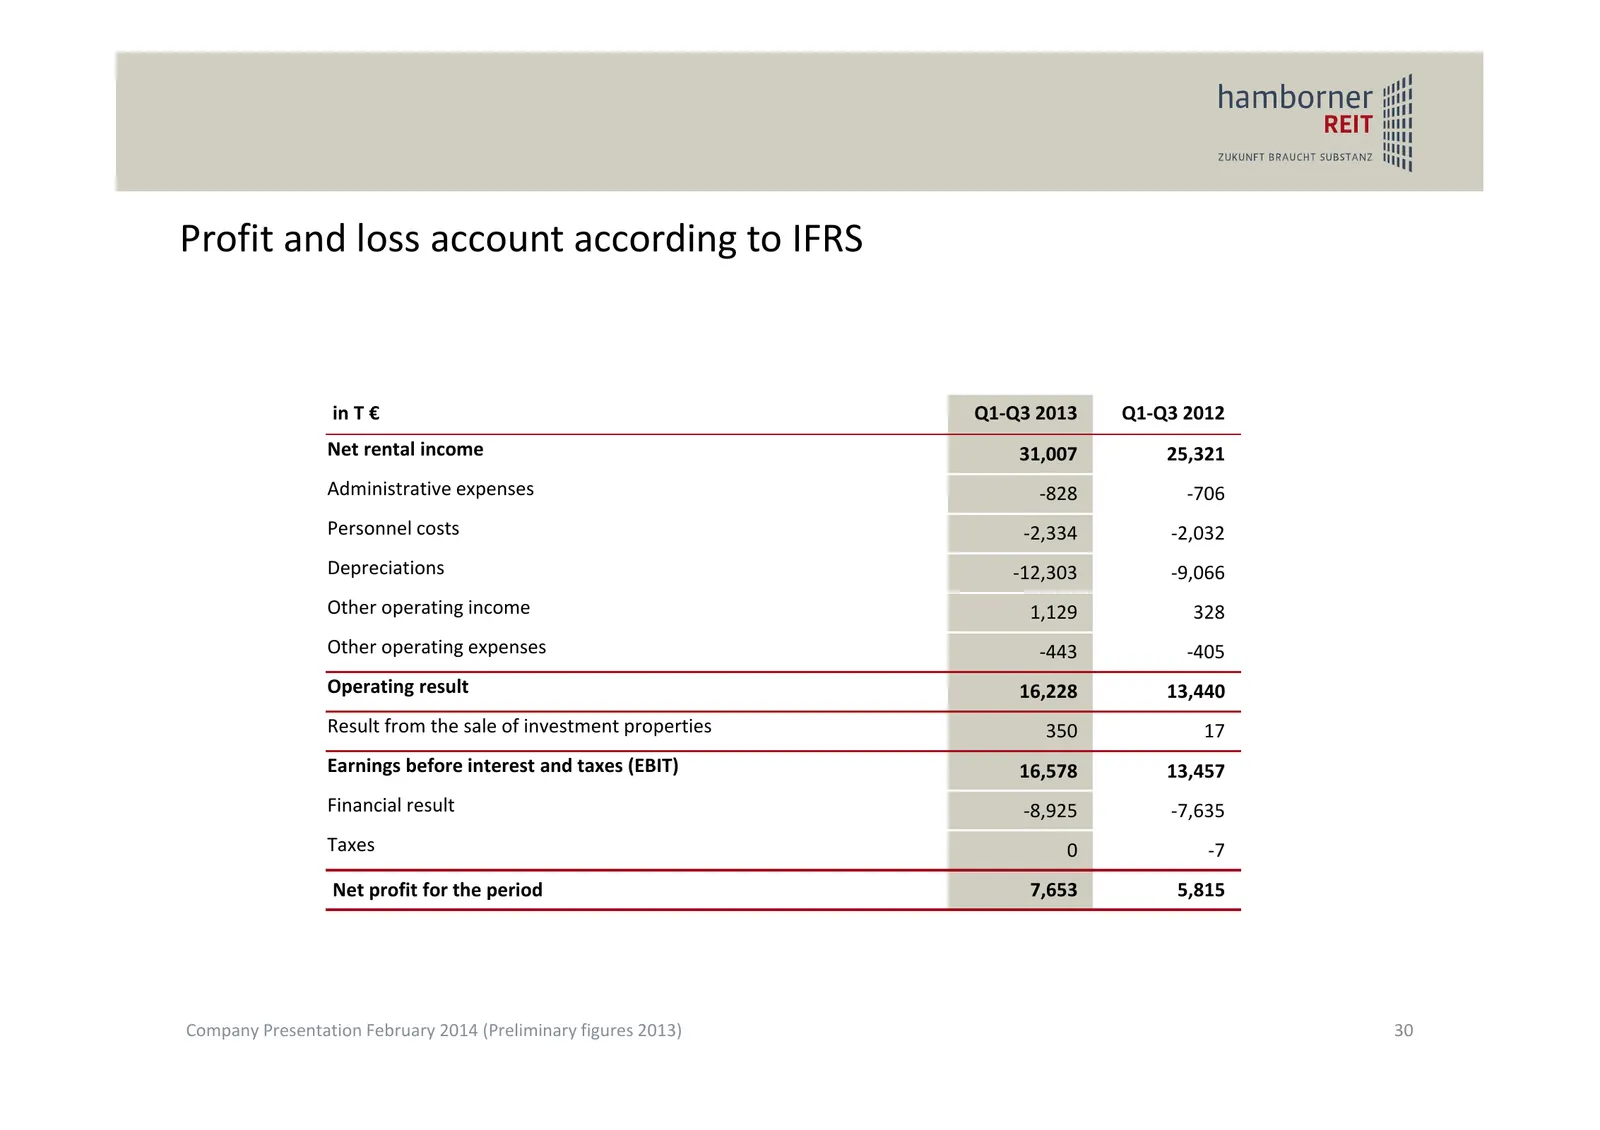
Profit and loss account according to IFRS in T € Q1‐Q3 2013 Q1‐Q3 2012 Net rental income 31,007 25,321 Administrative expenses ‐828 ‐706 Personnel costs ‐2,334 ‐2,032 Depreciations ‐12,303 ‐9,066 Other operating income 1,129 328 Other operating expenses ‐443 ‐405 Operating result 16,228 13,440 Resul
Slide 31: FFO
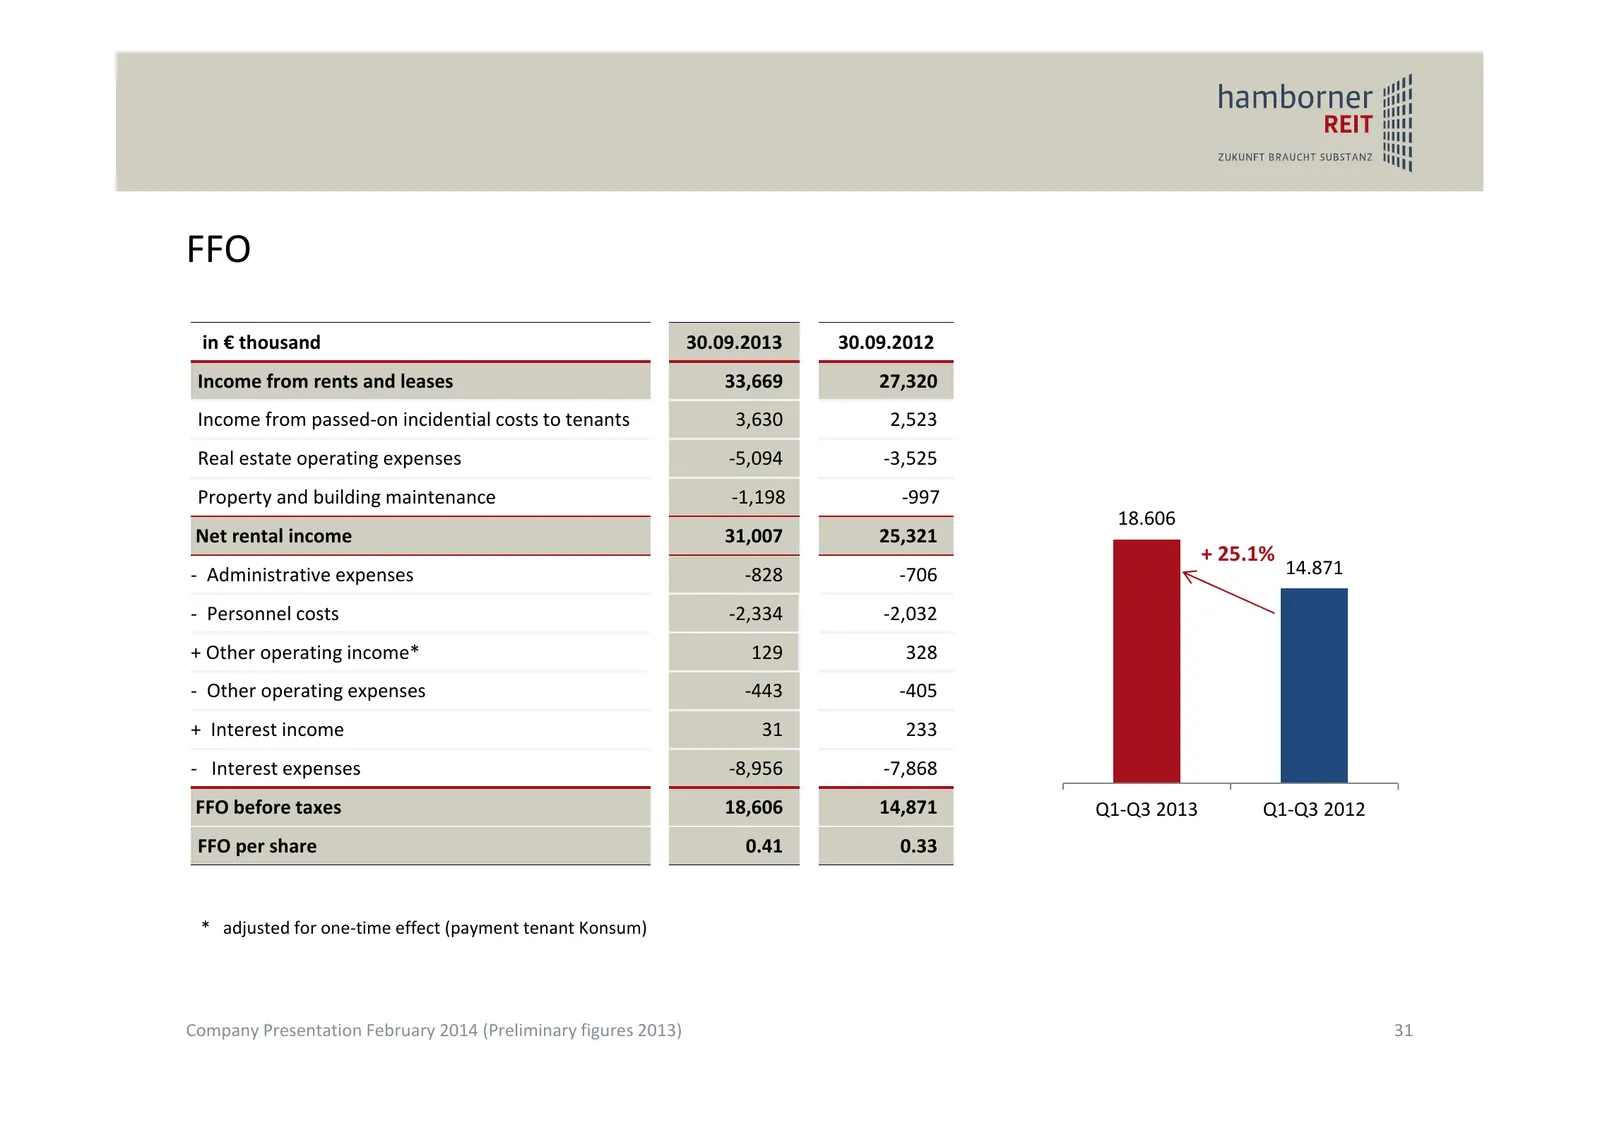
FFO in € thousand 30.09.2013 30.09.2012 Income from rents and leases 33,669 27,320 Income from passed‐on incidential costs to tenants 3,630 2,523 Real estate operating expenses ‐5,094 ‐3,525 Property and building maintenance ‐1,198 ‐997 18.606 Net rental income 31,007 25,321 + 25.1% ‐ Administrative
Slide 32: Net asset value (NAV) in accordance with EPRA
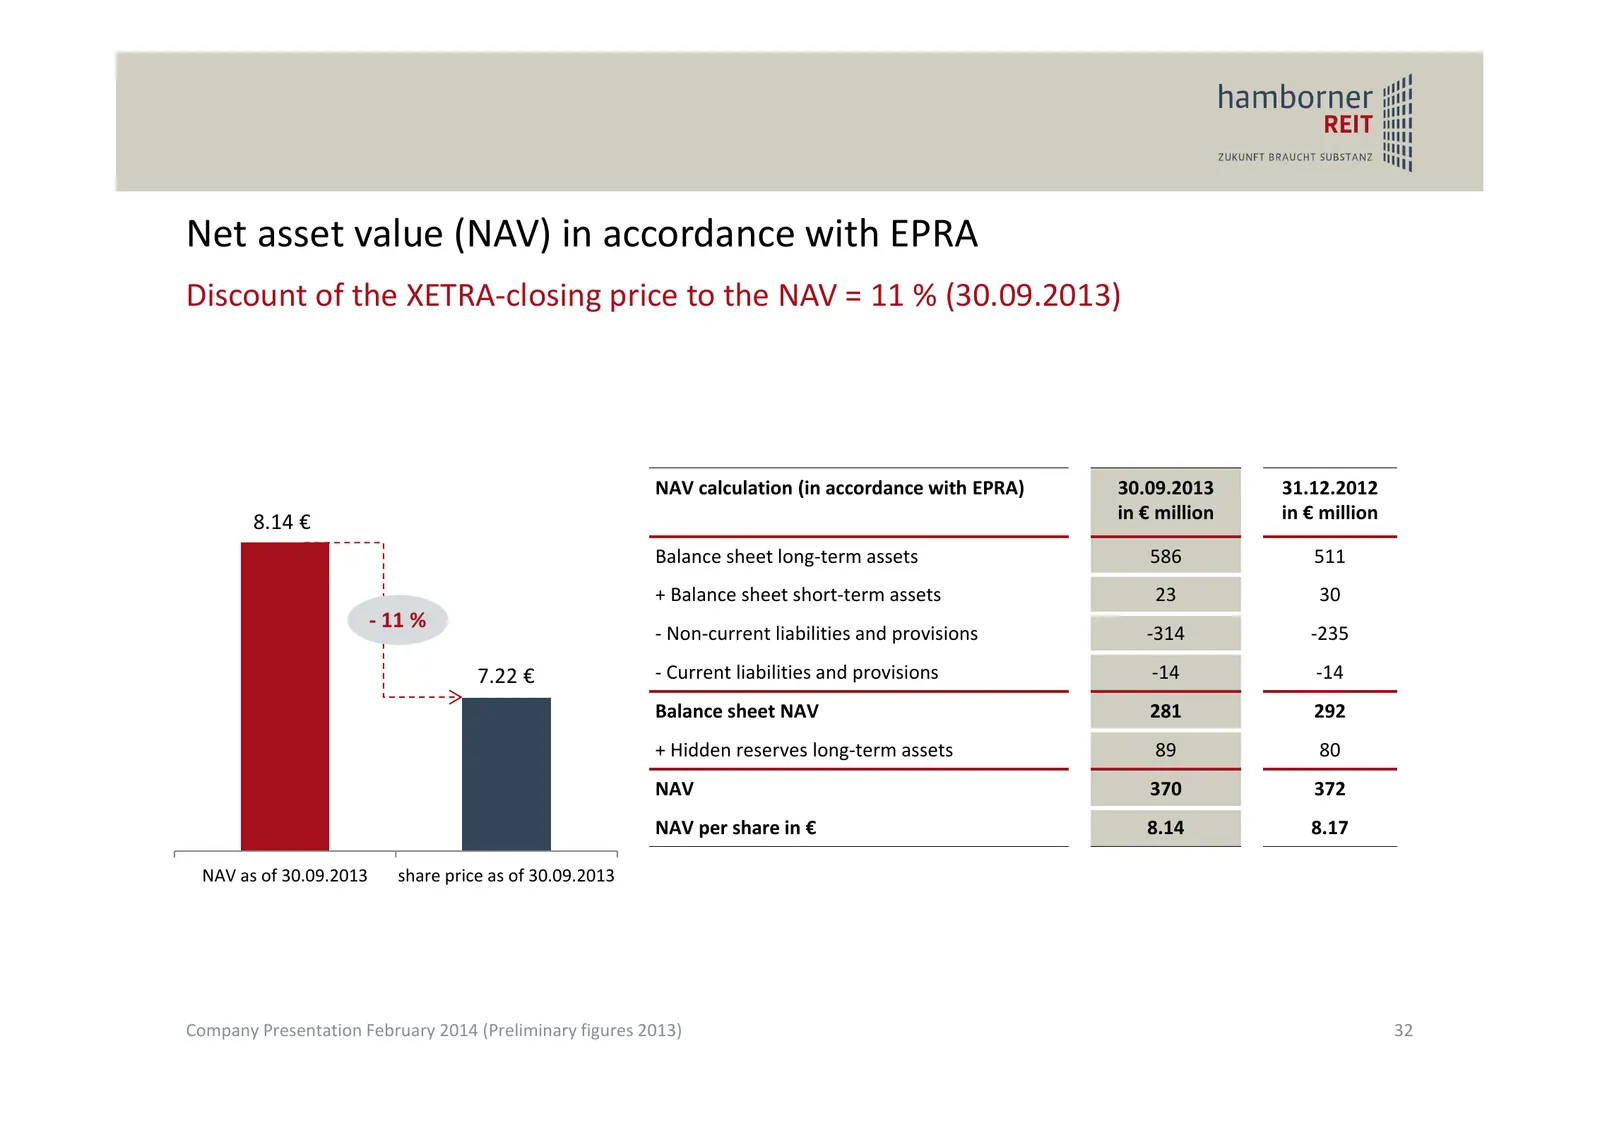
Net asset value (NAV) in accordance with EPRA Discount of the XETRA‐closing price to the NAV = 11 % (30.09.2013) NAV calculation (in accordance with EPRA) 30.09.2013 31.12.2012 8.14 € in € million in € million Balance sheet long‐term assets 586 511 + Balance sheet short‐term assets 23 30 ‐ 11 % ‐ No
Slide 33: Balance sheet in accordance with IFRS
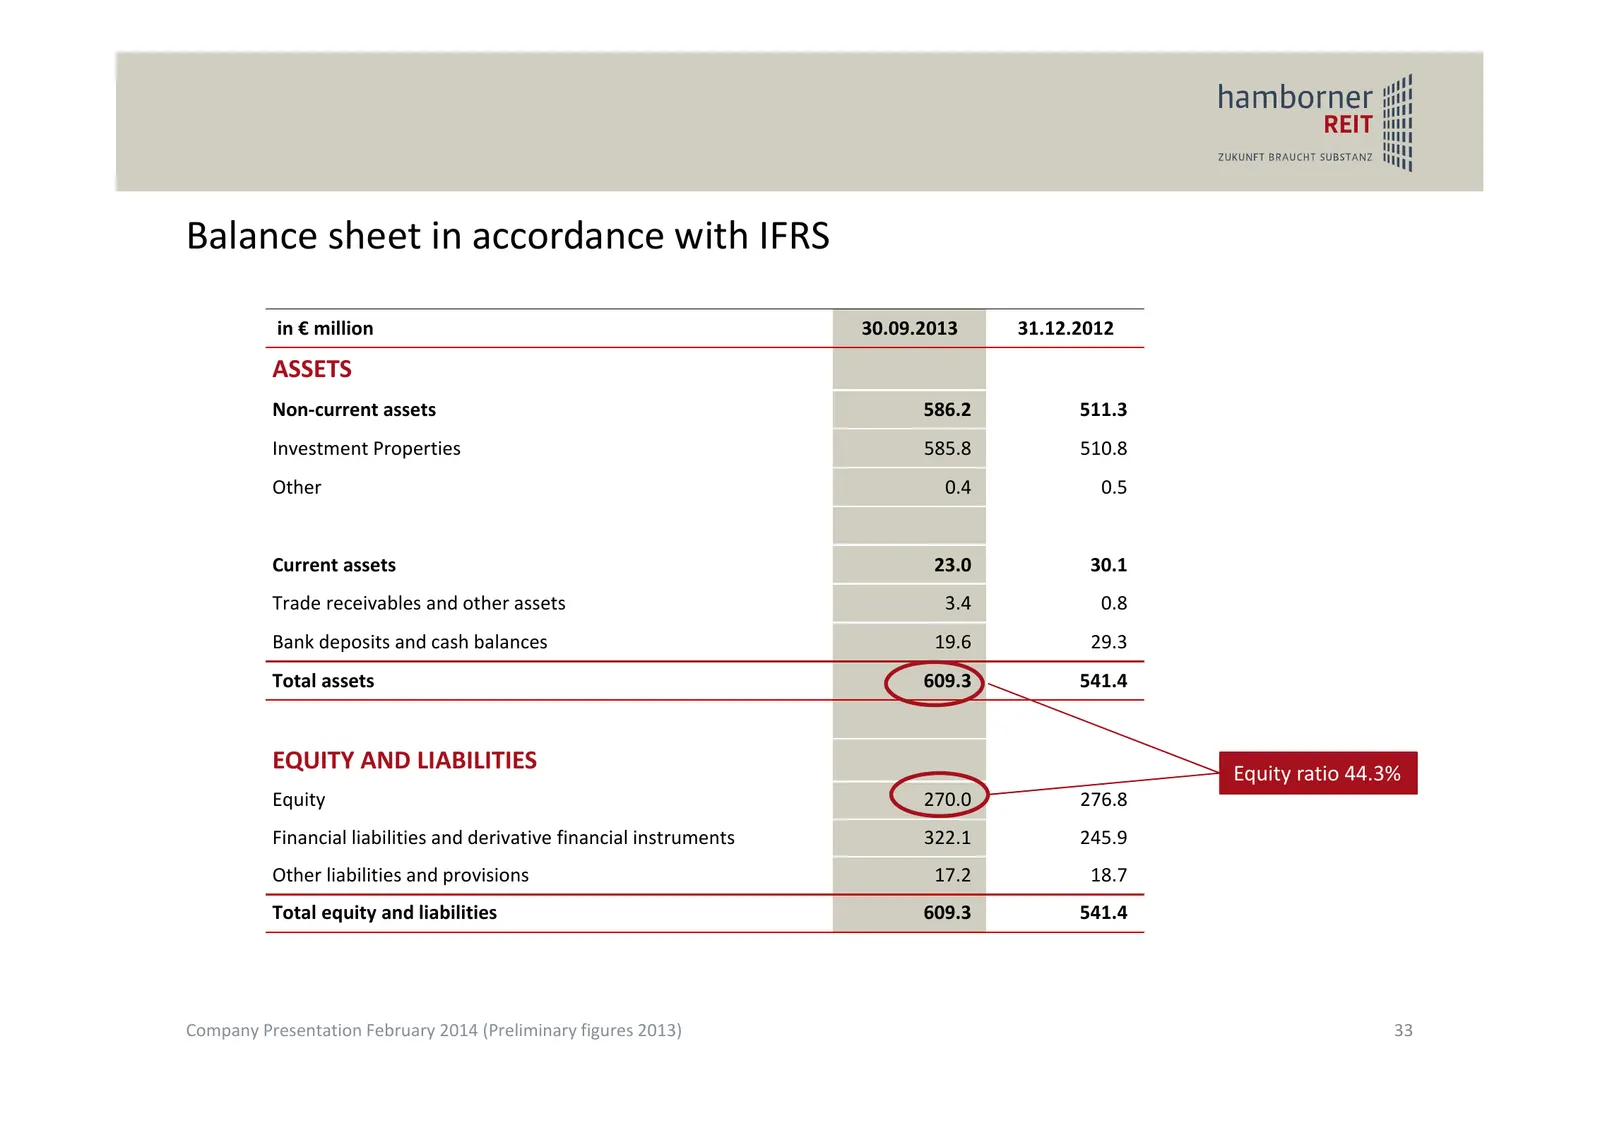
Balance sheet in accordance with IFRS in € million 30.09.2013 31.12.2012 ASSETS Non‐current assets 586.2 511.3 Investment Properties 585.8 510.8 Other 0.4 0.5 Current assets 23.0 30.1 Trade receivables and other assets 3.4 0.8 Bank deposits and cash balances 19.6 29.3 Total assets 609.3 541.4 EQUITY
Slide 34: Increasing efficiency resulting in higher margins
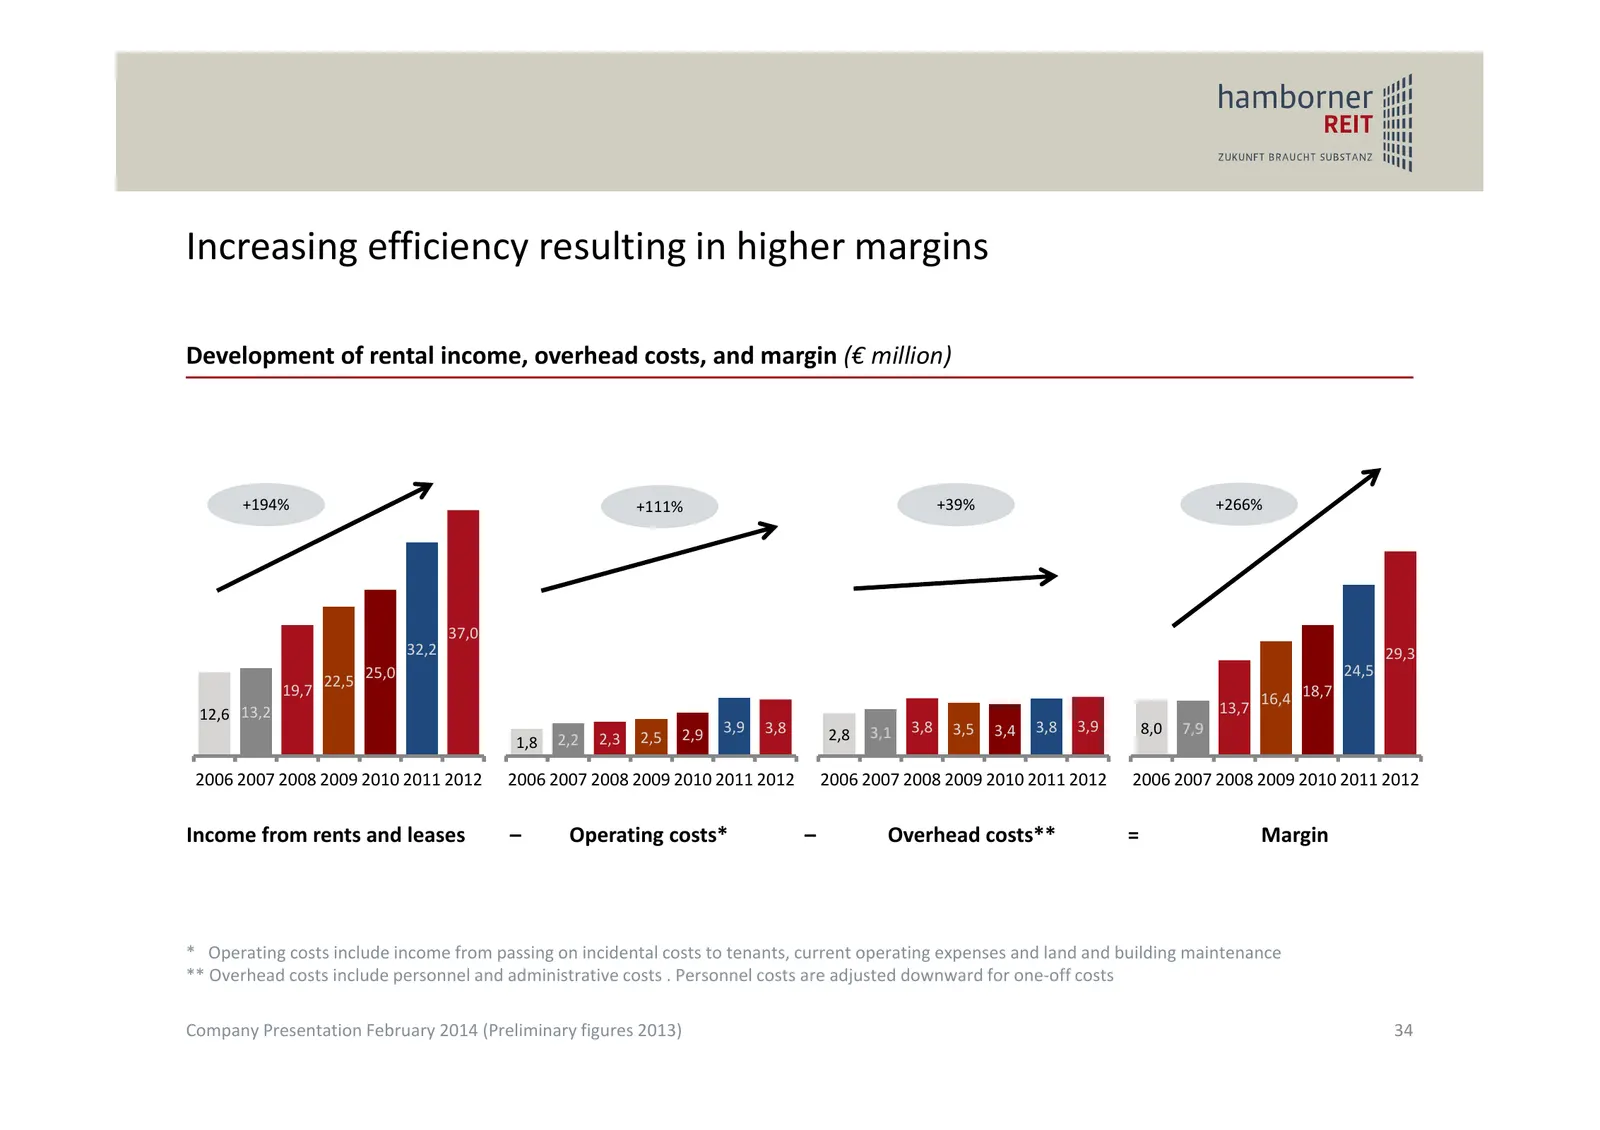
Increasing efficiency resulting in higher margins Development of rental income, overhead costs, and margin (€ million) +194% +111% +39% +266% 37,0 32,2 29,3 24,5 22,5 25,0 19,7 16,4 18,7 12,6 13,2 13,7 2,9 3,9 3,8 2,8 3,1 3,8 3,5 3,4 3,8 3,9 8,0 7,9 1,8 2,2 2,3 2,5 2006 2007 2008 2009 2010 2011 2012
Slide 35: Financial Calendar 2013/2014
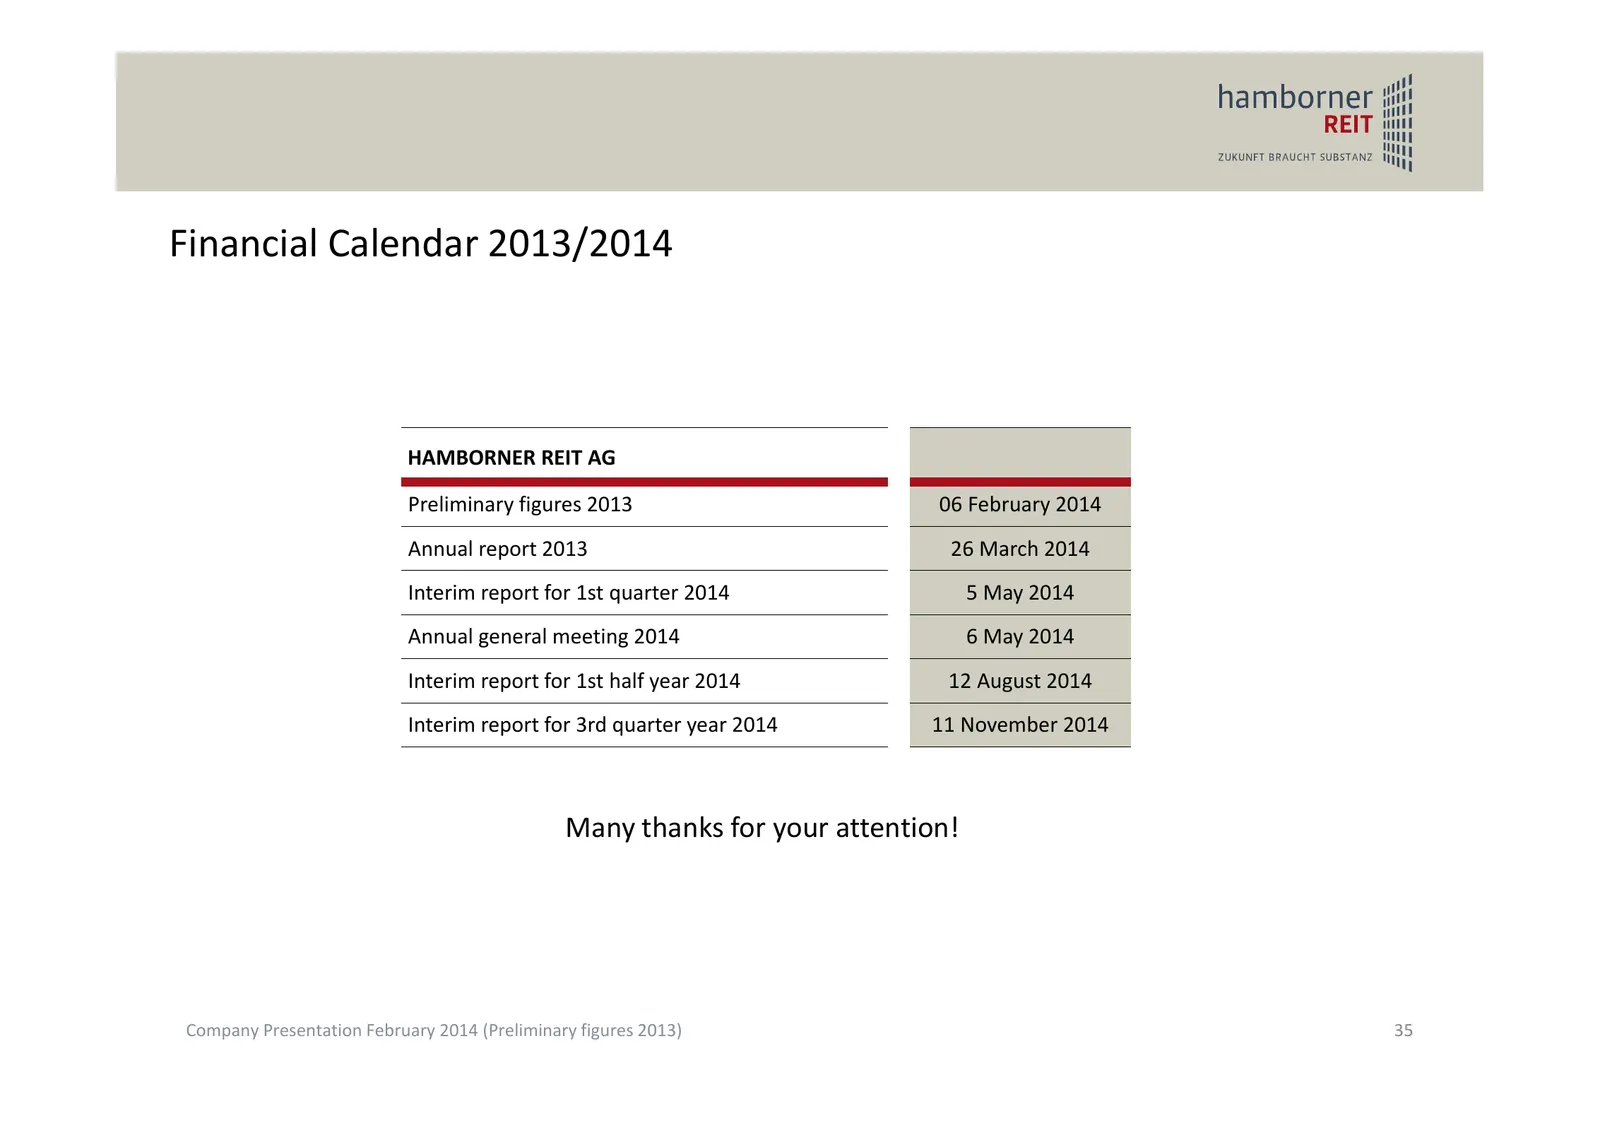
Financial Calendar 2013/2014 HAMBORNER REIT AG Preliminary figures 2013 06 February 2014 Annual report 2013 26 March 2014 Interim report for 1st quarter 2014 5 May 2014 Annual general meeting 2014 6 May 2014 Interim report for 1st half year 2014 12 August 2014 Interim report for 3rd quarter year 201
Slide 36: Contact
Contact Dr. Rüdiger Mrotzek – Member of the Board T +49 (0)203 / 54405‐55 M r.mrotzek@hamborner.de Hans Richard Schmitz – Member of the Board T +49 (0)203 / 54405‐21 M h.schmitz@hamborner.de Sybille Schlinge – Investor Relations T +49 (0)203 / 54405‐32 M s.schlinge@hamborner.de Company Presentation
Slide 37: Disclaimer
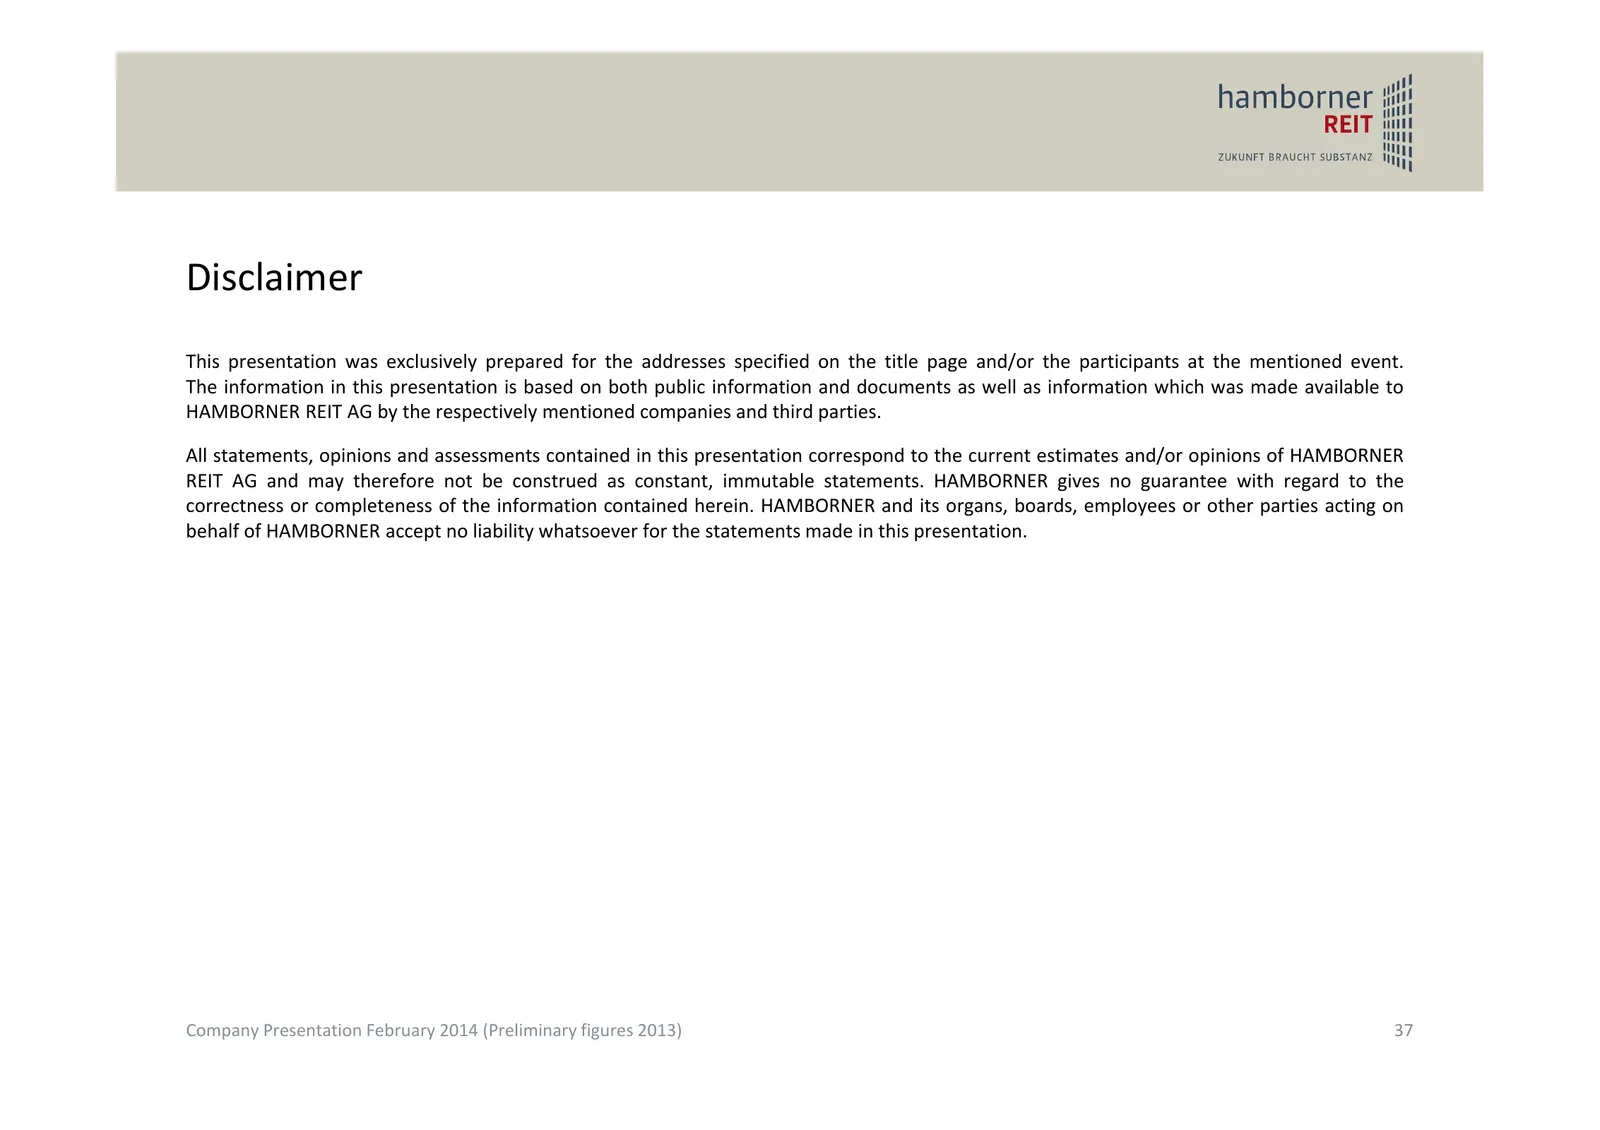
Disclaimer This presentation was exclusively prepared for the addresses specified on the title page and/or the participants at the mentioned event. The information in this presentation is based on both public information and documents as well as information which was made available to HAMBORNER REIT
Source: Internet Archive copy of hamborner.de
More decks from Hamborner REIT AG
 9M 2026 Earnings Presentation10 slides · Nov 10, 2026
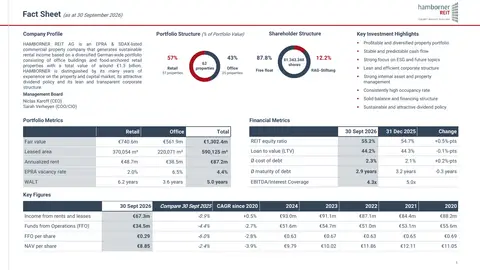 Fact Sheet (November 2026)2 slides · November 2026
 Investor Presentation (November 2026)35 slides · November 2026
 Investor Presentation (November 2026)35 slides · November 2026
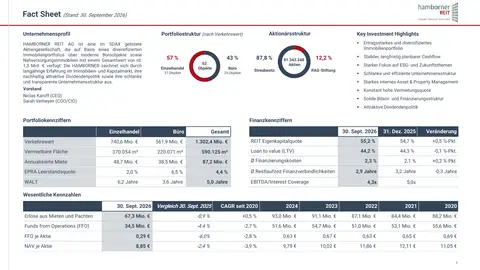 Fact Sheet (September 2026)2 slides · Sep 30, 2026
 Investor Presentation (September 2026)36 slides · September 2026