EPIQ Systems — Q2 2011 Earnings Presentation
13 slides from EPIQ Systems's earnings presentation, Jul 28, 2011

Slide 1: Managed technology for the global legal profession
PIQ Managed technology for the global legal profession
Slide 2: Forward Looking and Cautionary Statements
Forward Looking and Cautionary Statements EplQ SYSTEMS This presentation contains forward-looking statements within the meaning of Section 27A of the Securities Act of 1933, as amended, and Section 21E of the Securities Exchange Act of 1934, as amended, and include, but are not limited to, any proje
Slide 3: Use of Non-GAAP Measures
Use of non-GAAP-Measures EplQ SYSTEMS This presentation includes the following non-GAAP financial measures: (i) non-GAAP net income (net income adjusted for amortization of acquisition intangibles, share-based compensation, acquisition-related expense, capitalized loan fee amortization, litigation e
Slide 4: Epiq acquired Encore Discovery Solutions on April 4, 2011, for $100 million cash
> Epiq acquired Encore Discovery Solutions on April 4, 2011, for $100 million cash. Based in Phoenix, Arizona, Encore Discovery Solutions provides market-proven products and services for electronic evidence processing, document review platforms, and professional services for project management, data
Slide 5: Financial Highlights
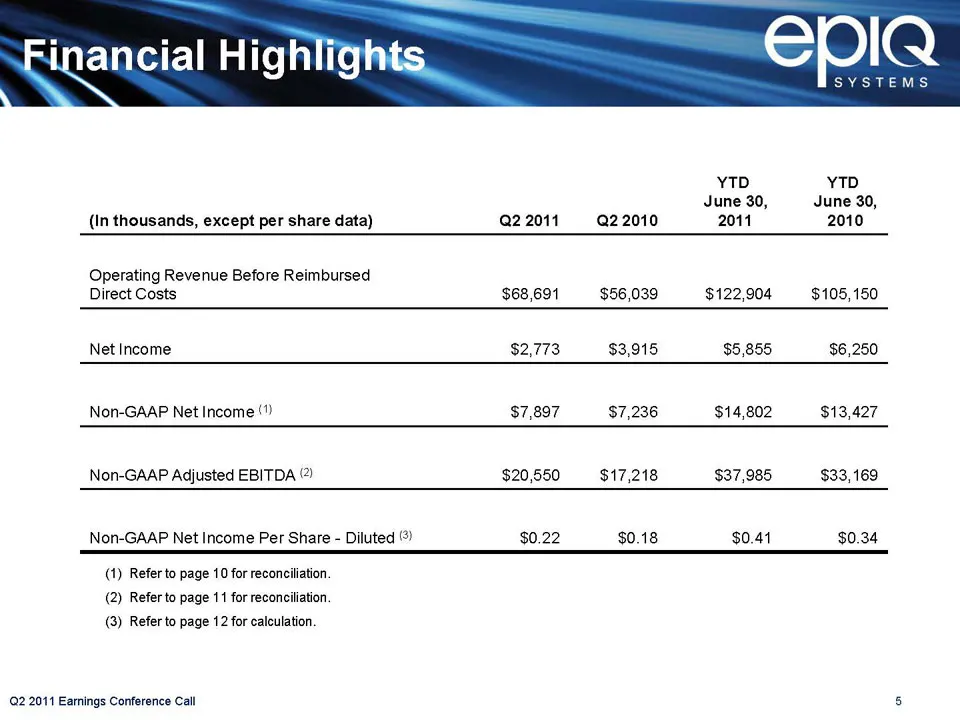
ancial Highlig EplQ SYSTEMS YTD YTD June 30, June 30, (In thousands, except per share data) Q22011 22010 2014 2010 Operating Revenue Before Reimbursed Direct Costs $68,691 $56,039 $122,904 $105,150 Net Income $2,773 $3,915 $5,855 $6,260 Non-GAAP Net Income (?) $7,897 $7,236 $14,802 $13,427 Non-GAAP
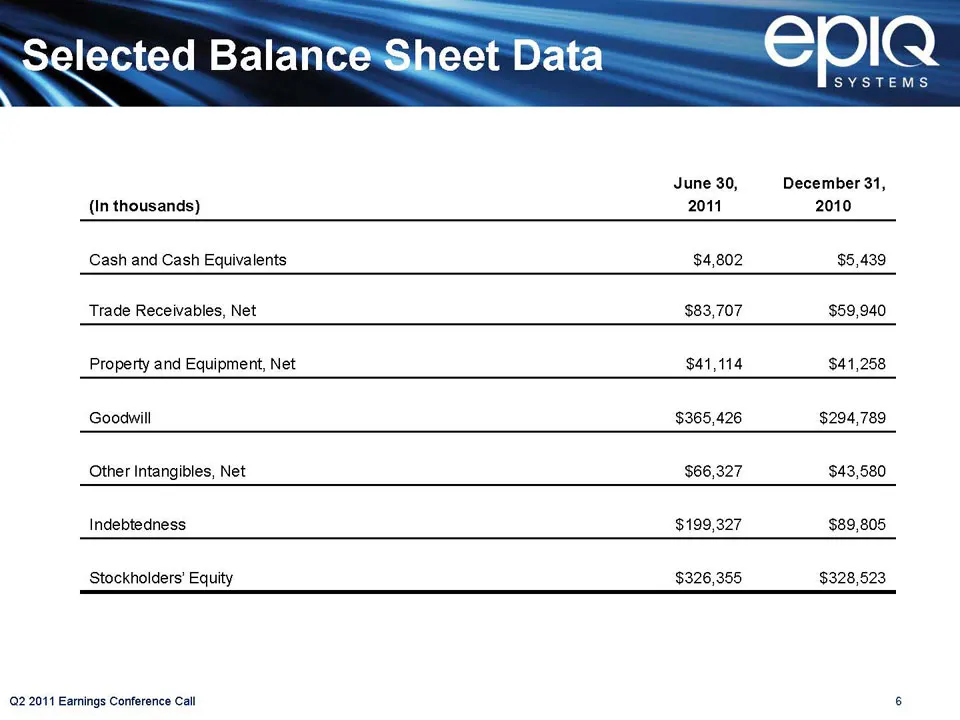
Slide 6: Selected Balance-Sheet Data
Selected Balance-Sheet Data EplQ SYSTEMS June 30, December 31, (In thousands) 2011 2010 Cash and Cash Equivalents $4,802 $5,439 Trade Receivables, Net $83,707 $59,940 Property and Equipment, Net $41,114 $44,258 Goodwill $365,426 $294,789 Other Intangibles, Net $66,327 $43,580 Indebtedness $199,327 $
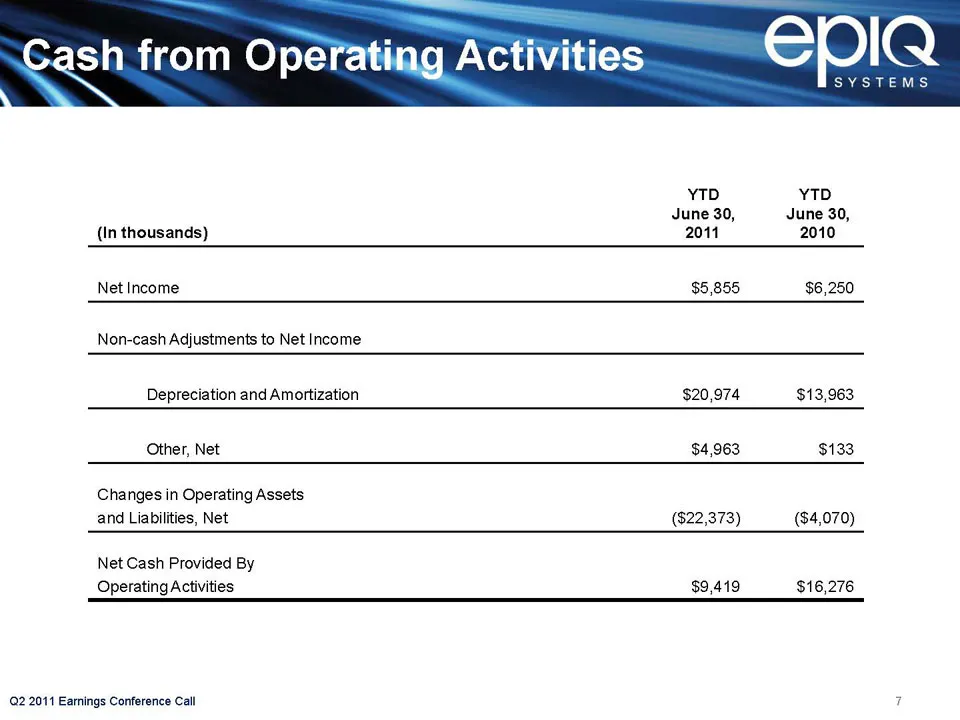
Slide 7: Cash from Operating Activities
Gash from Operating Activities EplQ SYSTEMS YTD YTD June 30, June 30, (In thousands) 2011 2010 Net Income $5,855 $6,250 Non-cash Adjustments to Net Income Depreciation and Amortization $20,974 $13,963 Other, Net $4,963 $133 Changes in Operating Assets and Liabilities, Net ($22,373) ($4,070) Net Cash
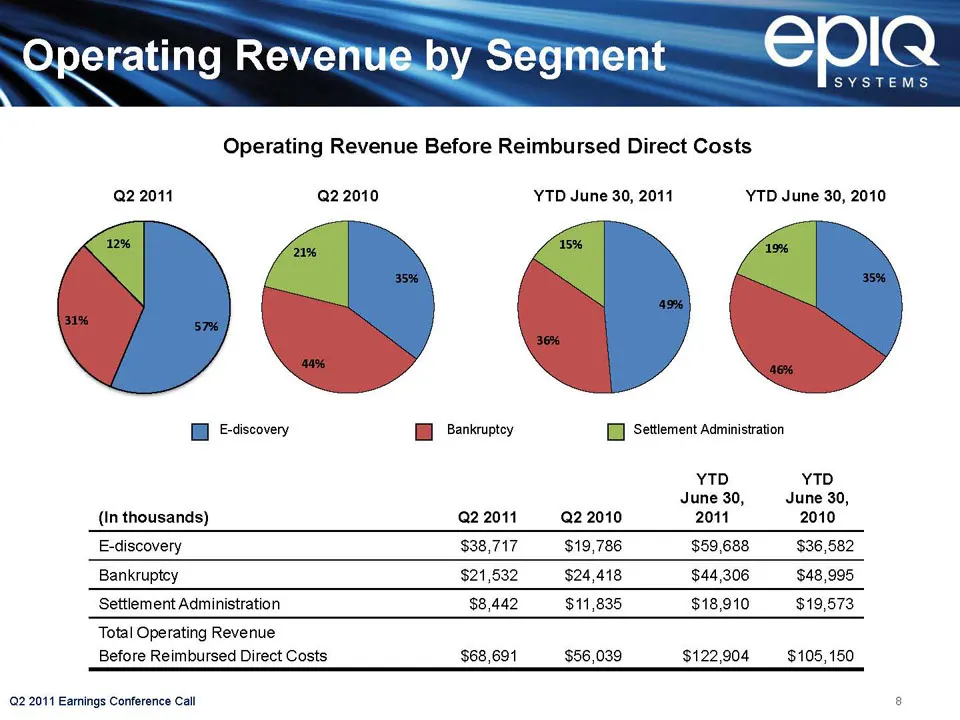
Slide 8: Operating Revenue by Segment
Operating Revenue.by Segment EplQ SYSTEMS Operating Revenue Before Reimbursed Direct Costs 22011 22010 YTD June 30, 2011 YTD June 30, 2010 [ Exiscovery Bankruptcy LD Settlement Administration YTD YTD June 30, June 30, (In thousands) Q2 2011 2 2010 2011 2010 E-discovery $38,717 $19,786 $59,688 $36,58
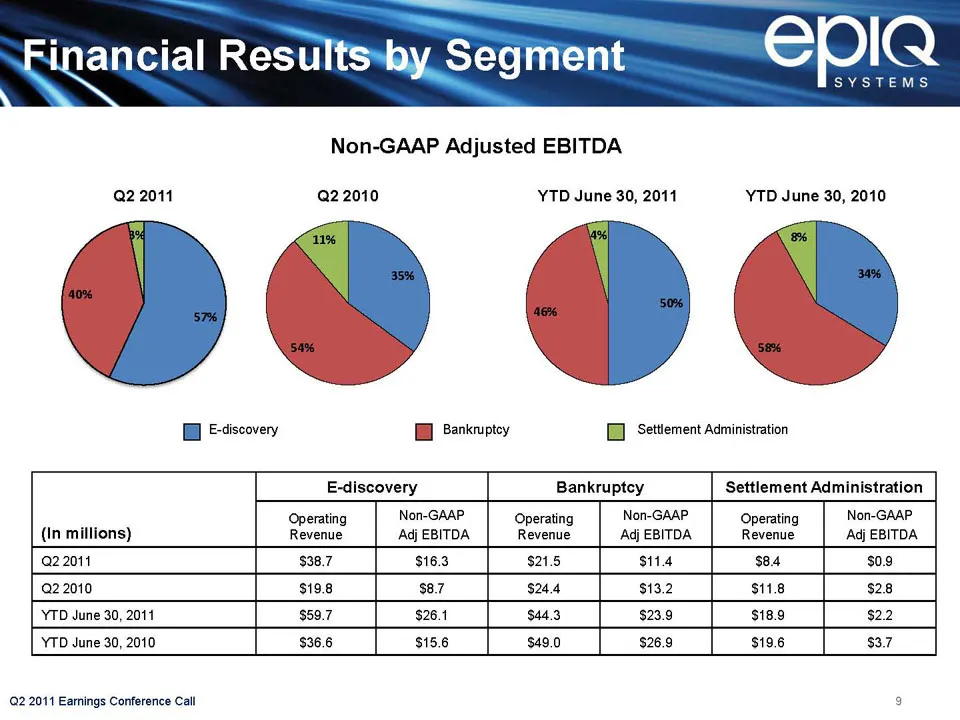
Slide 9: Financial Results by Segment
Fi ancial Results*hy Segment EplQ Non-GAAP Adjusted EBITDA Q2 2011 Q22010 YTD June 30, 2011 YTD June 30, 2010 EB Ecdiscovery [By Bankruptey [Bl Settlement Administration E-discovery Bankruptcy Settlement Administration Operating Non-GAAP Operating Non-GAAP Operating Non-GAAP (In millions) Revenue Ad
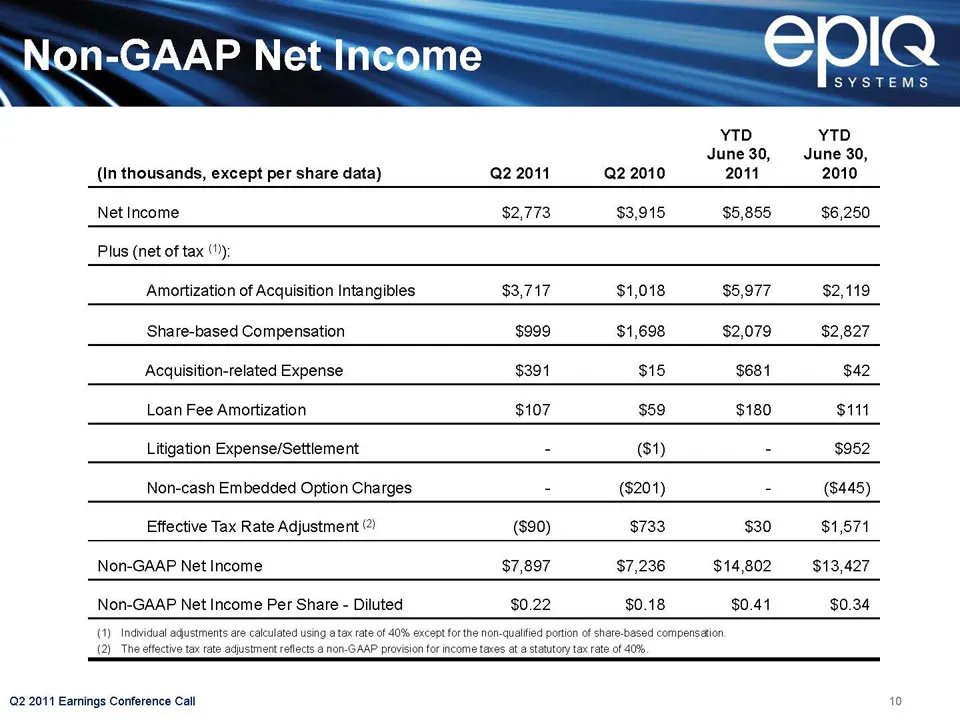
Slide 10: Non-GAAP Net Income
Non-GAAP Net Ineqme EplQ SYSTEMS YTD YTD June 30, June 30, (In thousands, except per share data) Q2 2011 Q2 2010 2011 2010 Net Income $2,773 $3,915 $5,855 $6,250 Plus (net of tax (") Amortization of Acquisition Intangibles $3,717 $1,018 $5,977 $2,119 Share-based Compensation $999 $1,698 $2,079 $2,82
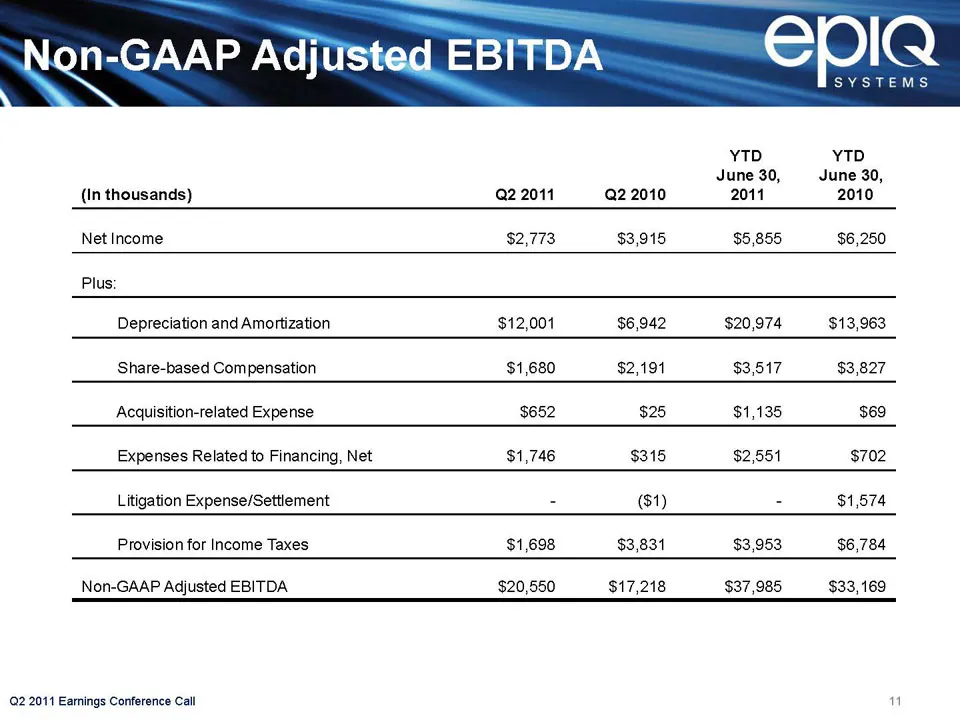
Slide 11: Non-GAAP Adjusted EBITDA
Non-GAAP Adjllsted EBITDA EplQ SYSTEMS YTD YTD June 30, June 30, (In thousands) Q2 2011 Q2 2010 2011 2010 Net Income $2,773 $3,915 $5,855 $6,250 Plus: Depreciation and Amortization $12,001 $6,942 $20,974 $13,963 Share-based Compensation $1,680 $2,191 $3,517 $3,827 Acquisition-related Expense $652 $2
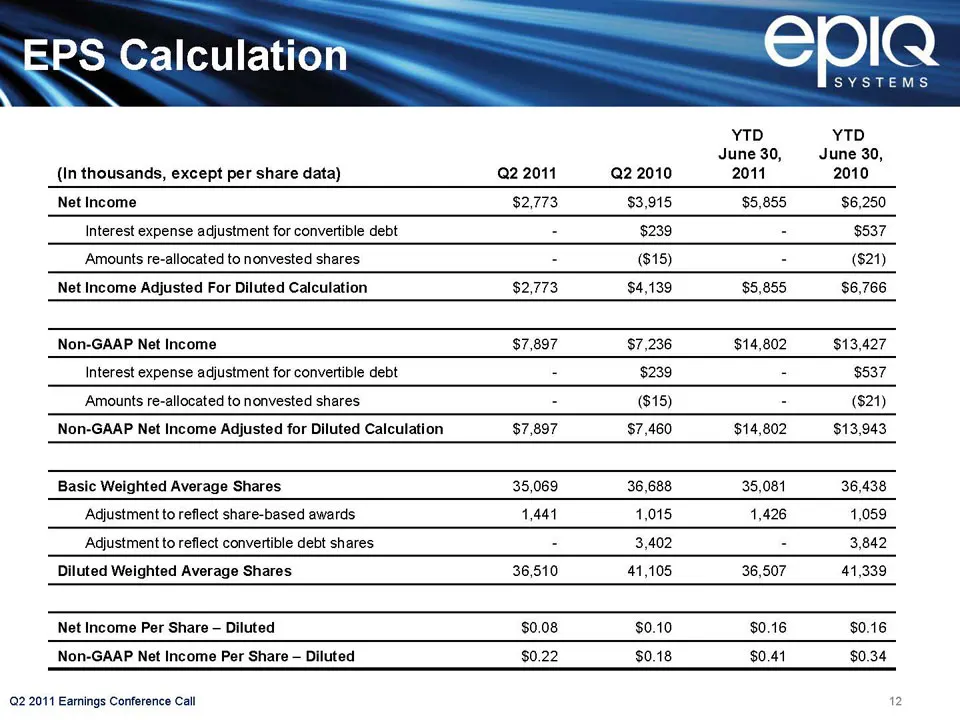
Slide 12: EPS Calculation
EPS Calculation EplQ SYSTEMS YTD YTD June 30, June 30, (In thousands, except per share data) Q2 2011 2.2010 2011 2010 Net Income $2,773 $3,915 $5,855 $6,250 Interest expense adjustment for convertible debt : $239 : $537 Amounts re-allocated to nonvested shares - ($15) - ($21) Net Income Adjusted For

Slide 13: epia
epia VST EMS) the global legal profession
Source: SEC EDGAR · 8-K filed Jul 28, 2011
More decks from EPIQ Systems Inc
 Q2 2016 Earnings Presentation12 slides · Aug 9, 2016
 Q1 2016 Earnings Presentation12 slides · May 3, 2016
 FY2015 Earnings Presentation13 slides · Mar 1, 2016
 Q3 2015 Earnings Presentation11 slides · Nov 3, 2015
 Q2 2015 Earnings Presentation11 slides · Aug 3, 2015
 Q1 2015 Earnings Presentation11 slides · Apr 28, 2015