Home Loan Servicing Solutions Ltd
Home Loan Servicing Solutions — J.P. Morgan SMid Cap Conference 2012
11 slides from Home Loan Servicing Solutions's conference presentation, Nov 28, 2012
Slide 1: J.P. Morgan SMid Cap Conference, November 28, 2012
Exhibit 99.1 HLSS J.P. SOLUTIONS SERVICING SMid November Morgan Cap HOMEConference 28, LOAN 2012 TM
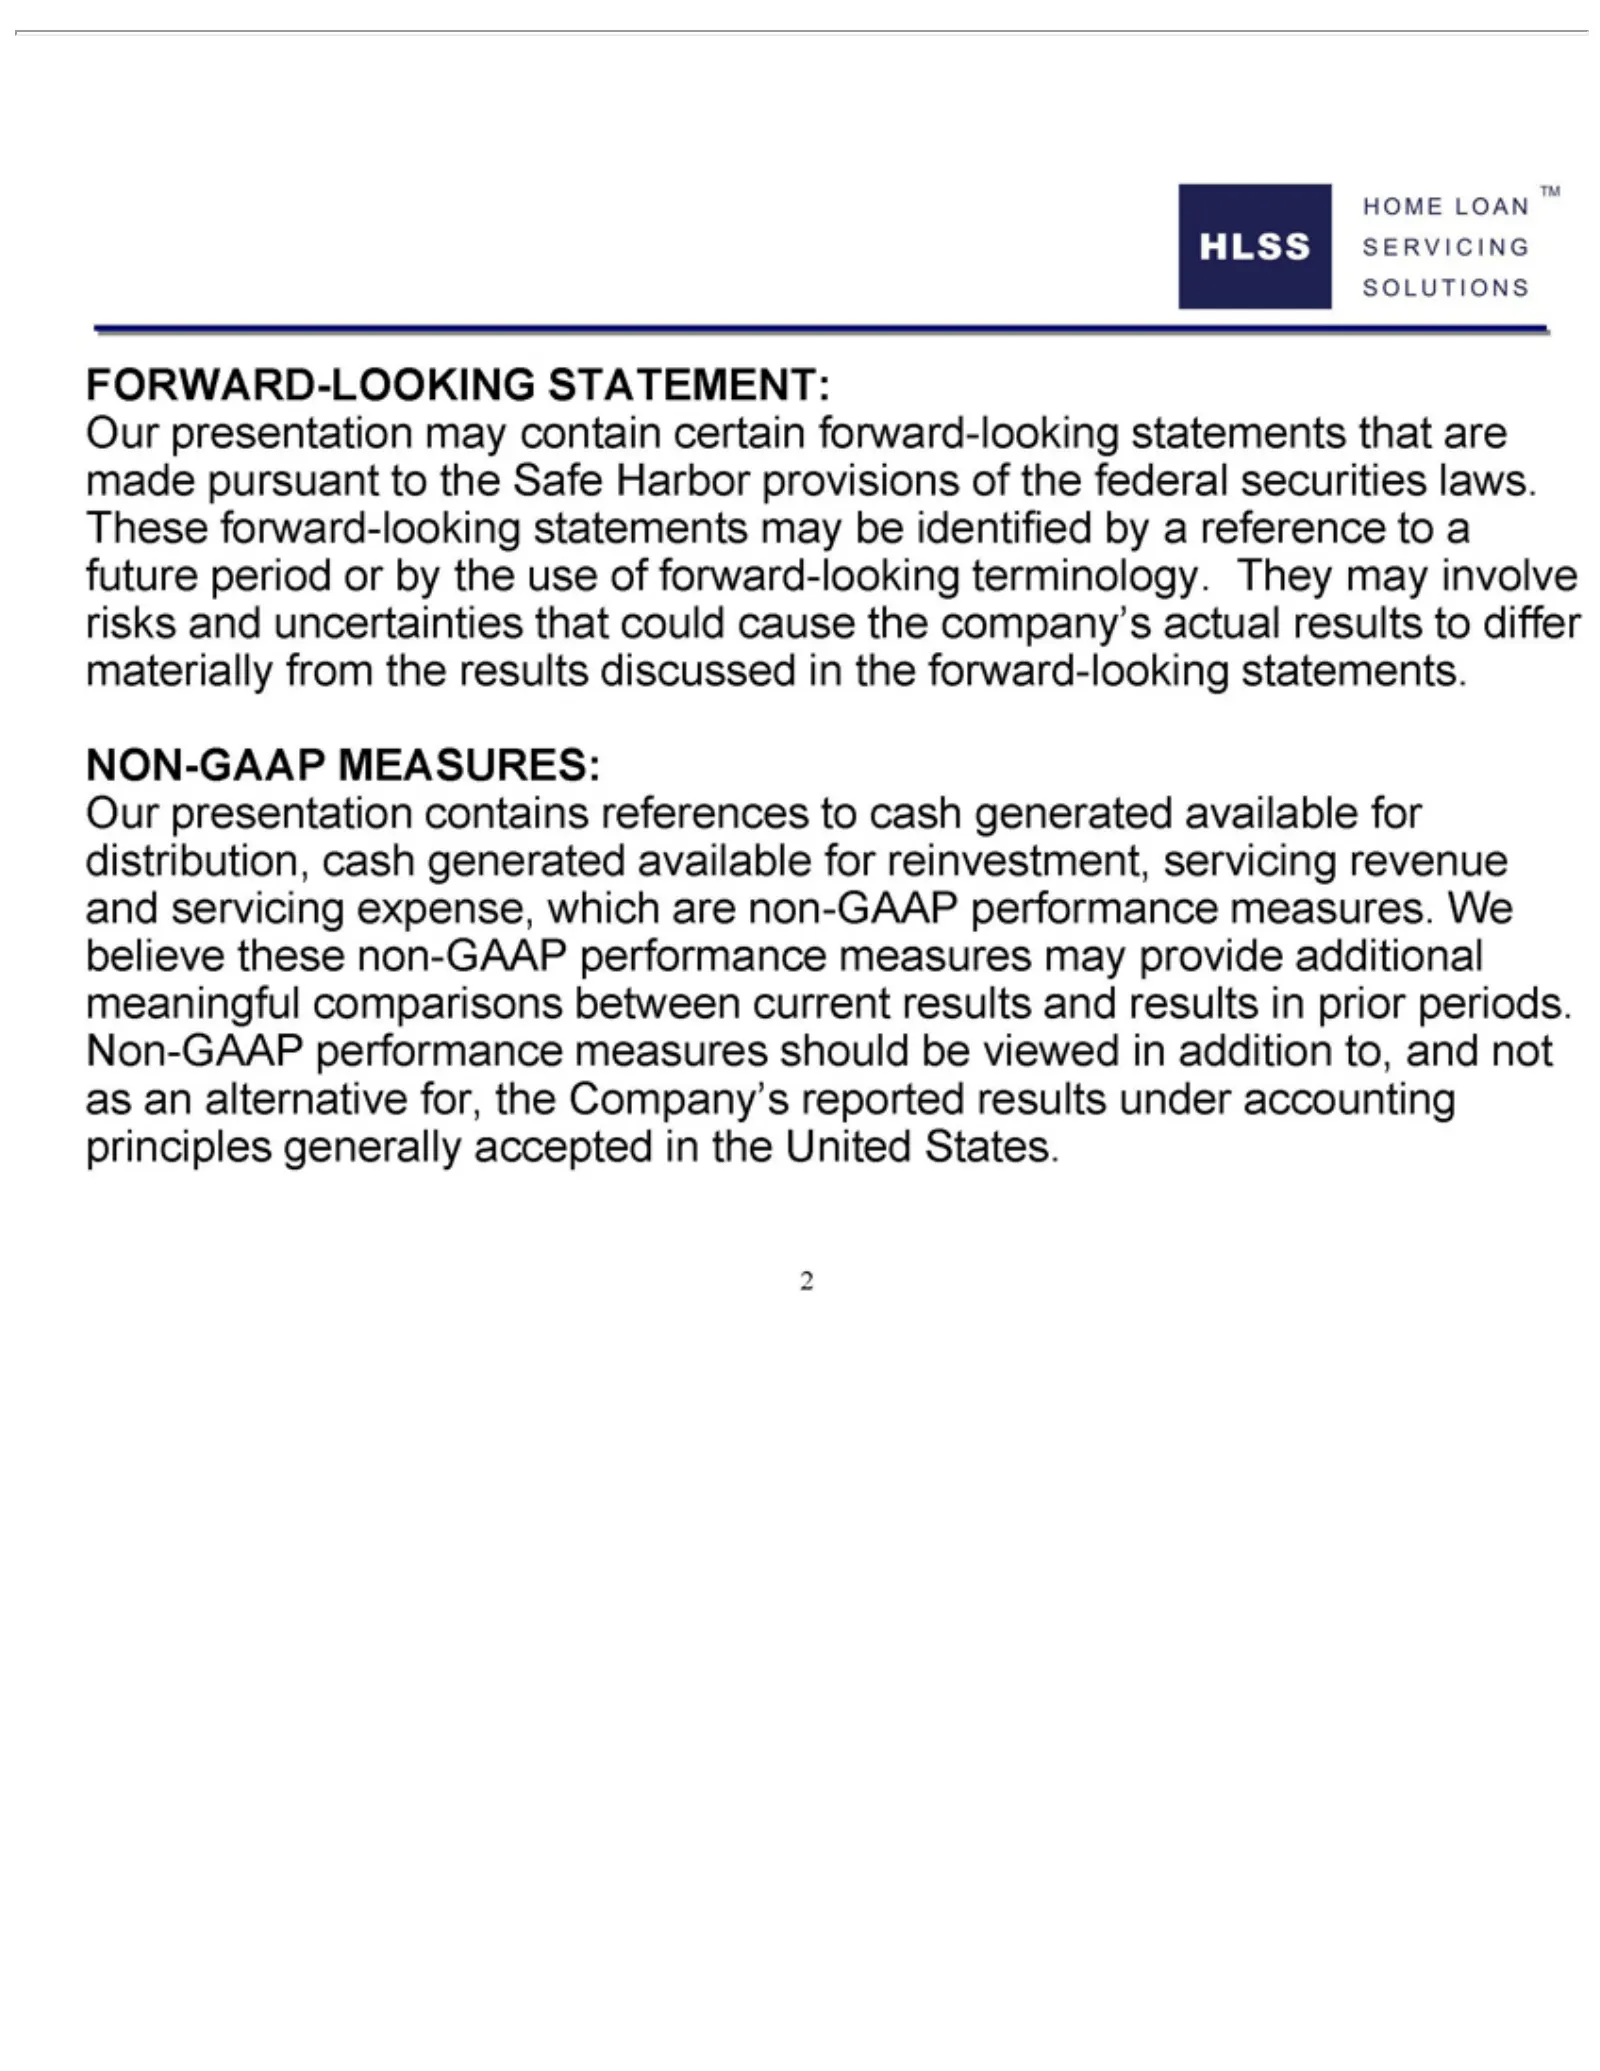
Slide 2: Forward-Looking Statements and Non-GAAP Measures
HLSS FORWARD-LOOKING SOLUTIONS SERVICING reference in NON-GAAP Our measures. 2be the viewed presentation forward-looking HOME to We inaaddition MEASURES: future believe LOAN mayperiod contains to, these TM contain statements. STATEMENT: and references or non-GAAP not certain by as theanto use forwar
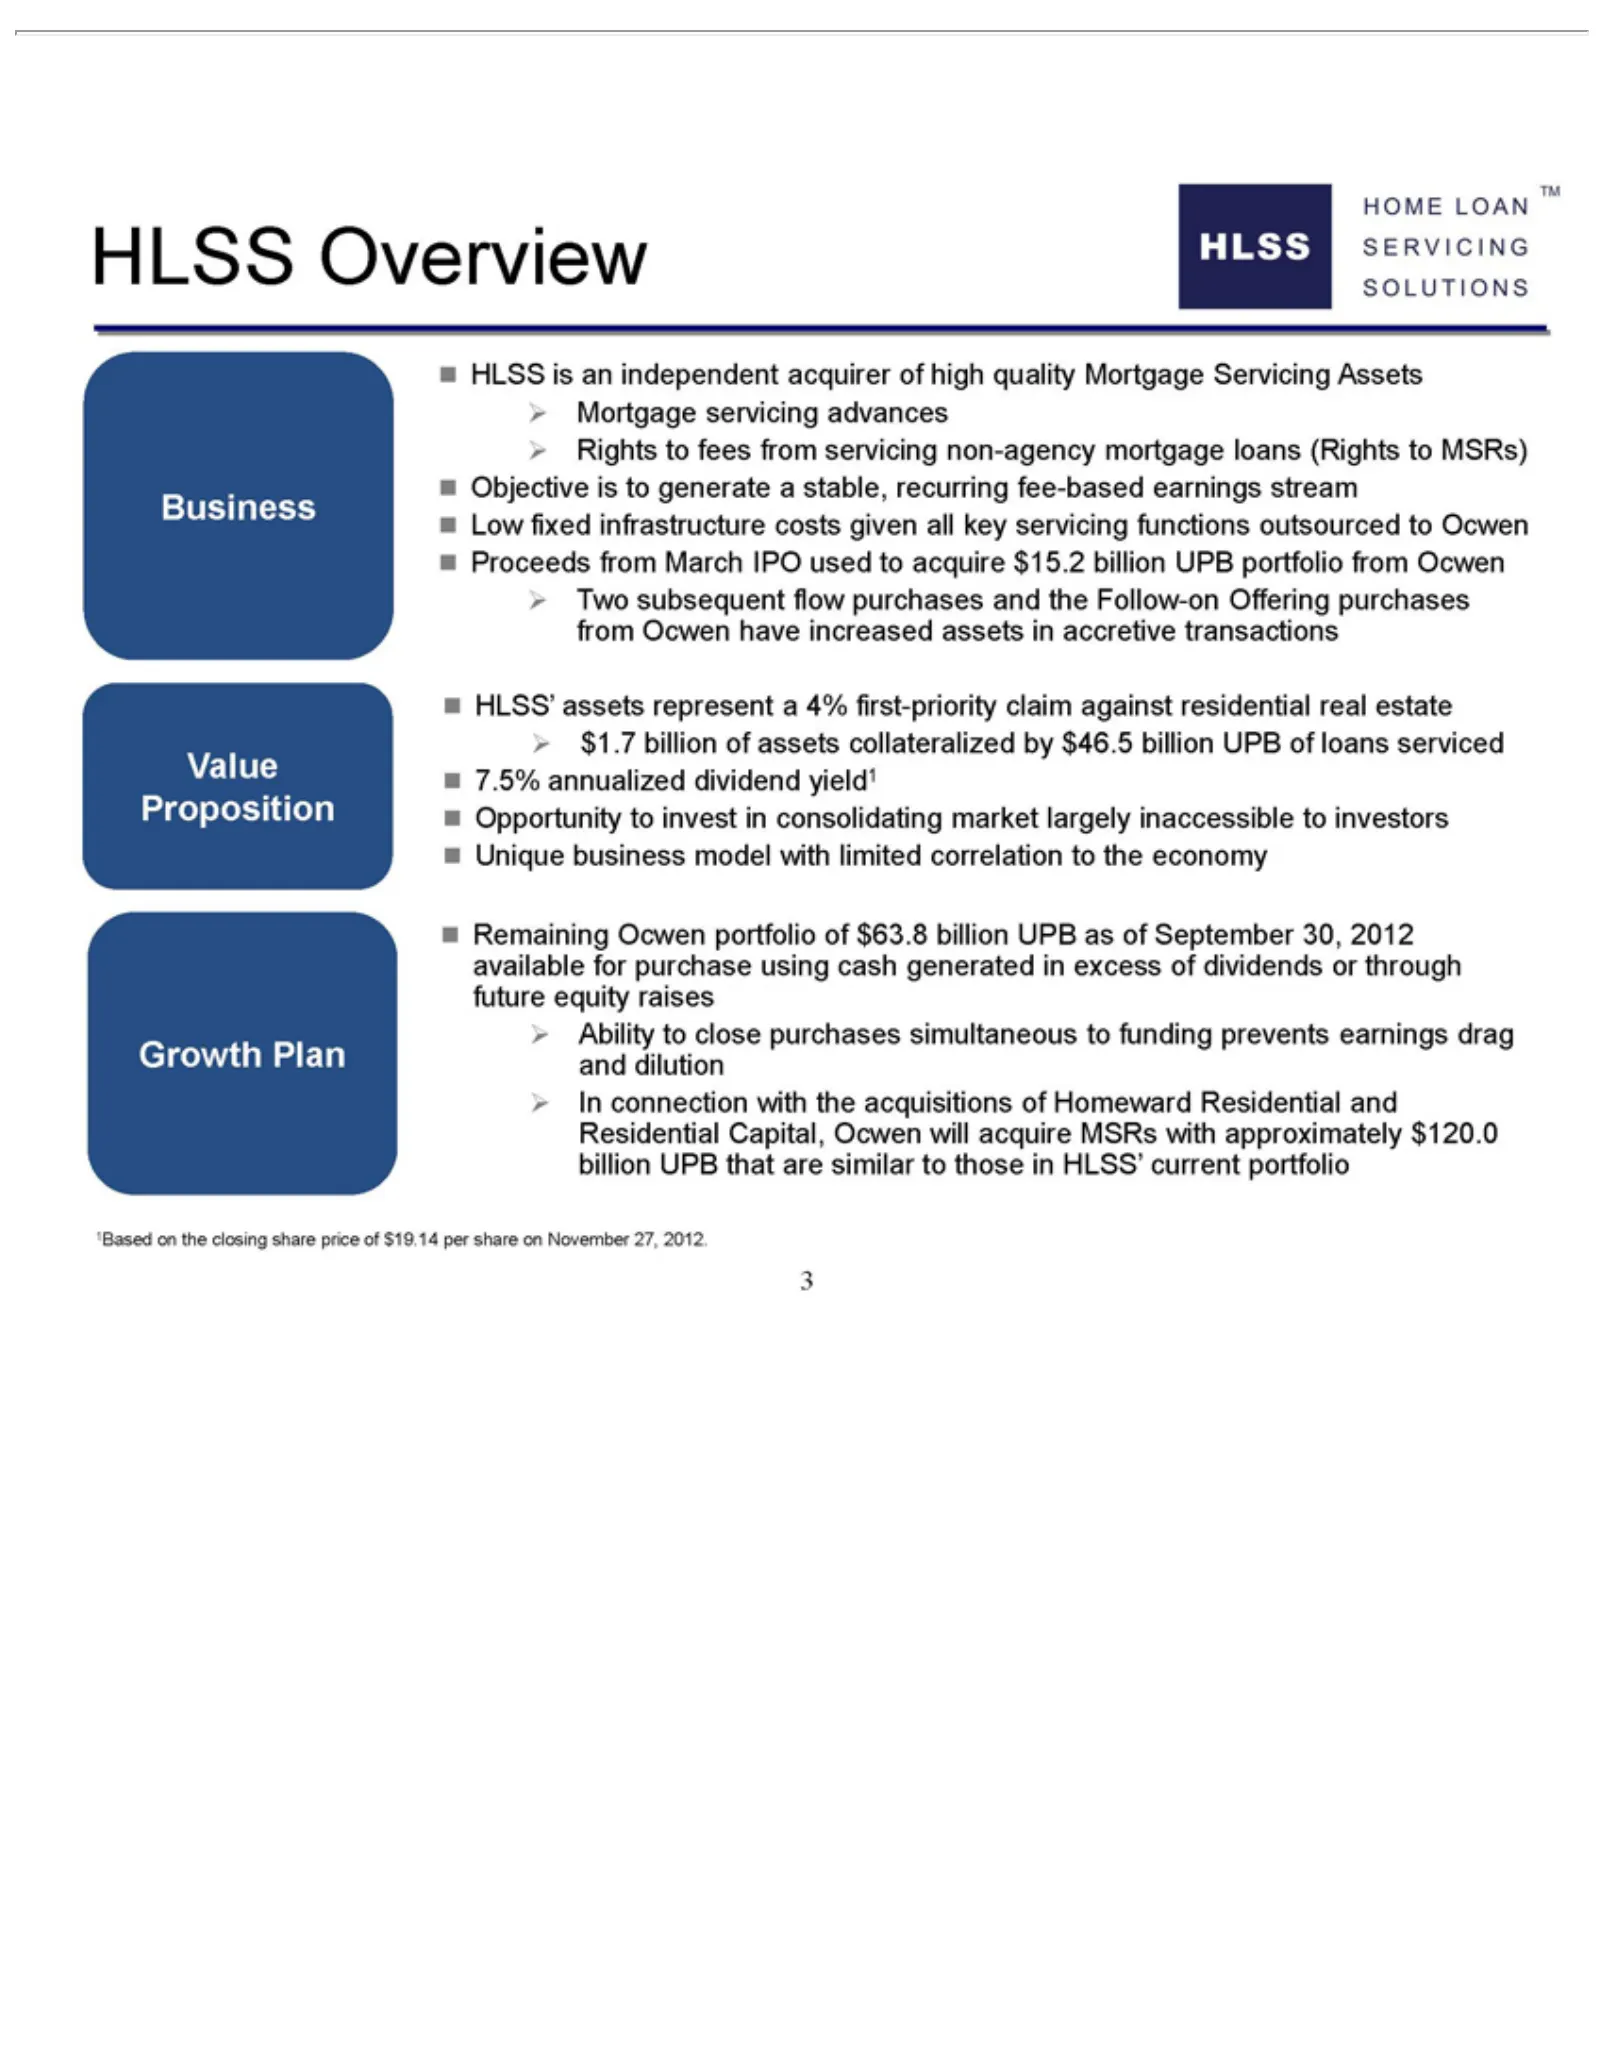
Slide 3: HLSS Business Overview and Value Proposition
Value Business SOLUTIONS SERVICING Growth HLSS Mortgage Rights Objective Low Proceeds Two HLSS’ $1.7 7.5% Opportunity Unique Remaining Ability In 31Based connection billion subsequent fixed annualized Proposition Overview HOME is to assets to business on Plan an from fees close is servicing infrastr
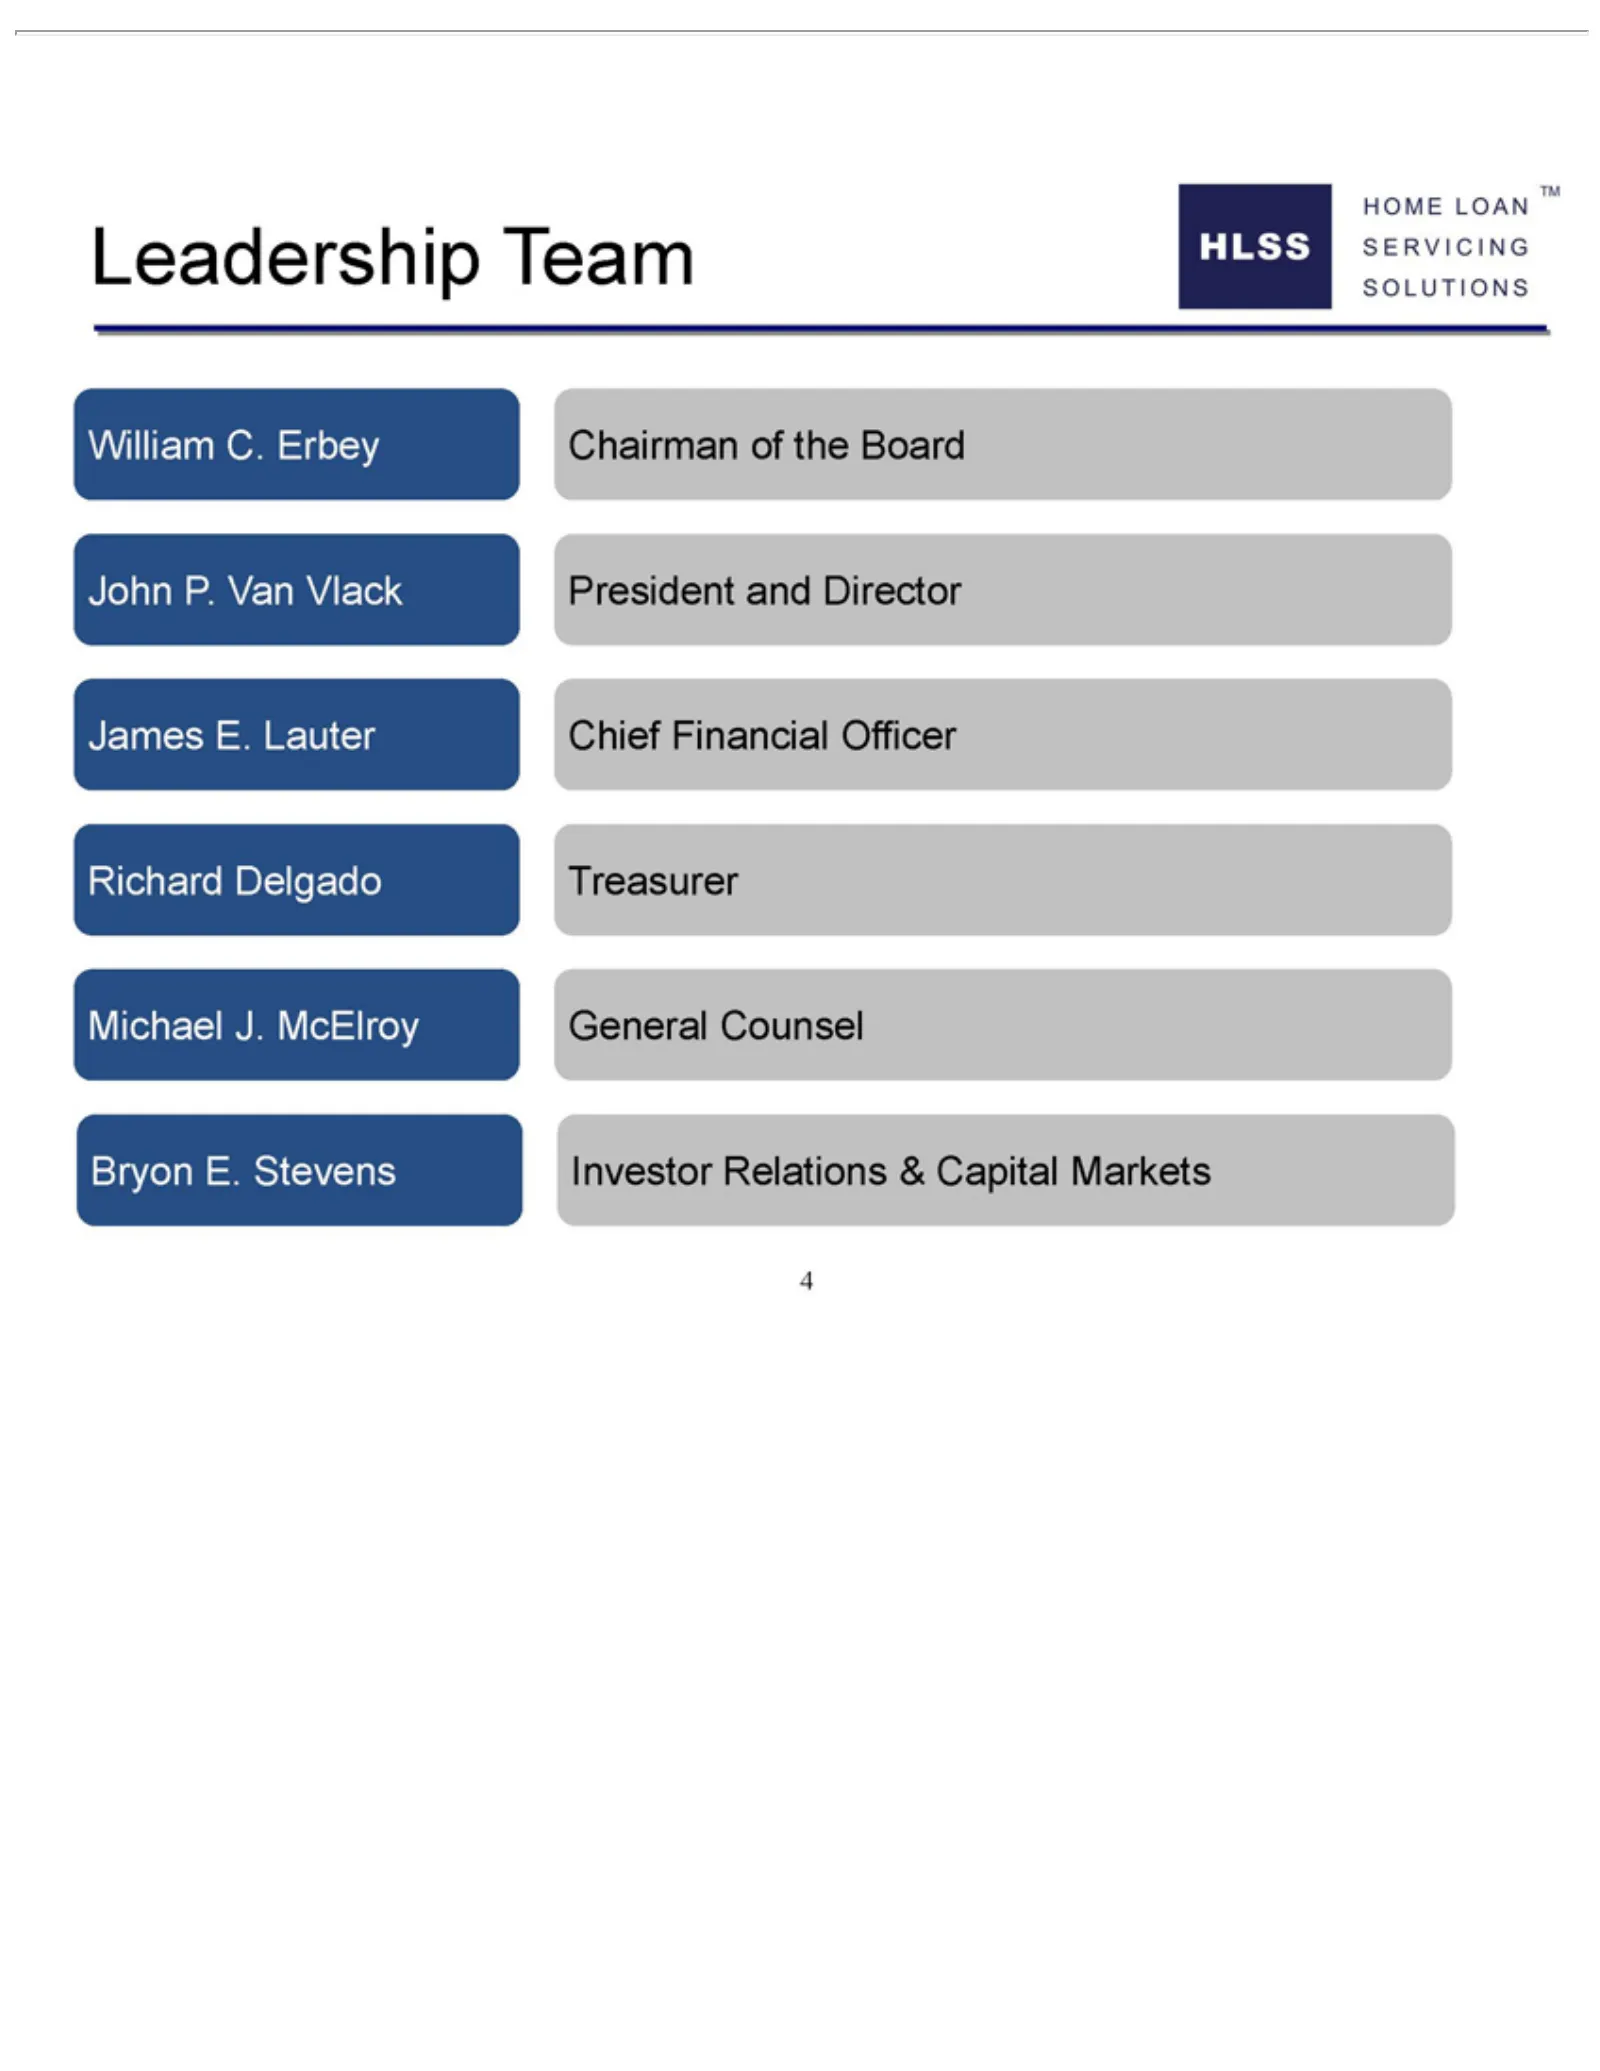
Slide 4: HLSS Leadership Team
Leadership HLSS William SOLUTIONS SERVICING John James Richard Michael 4Bryon P.E. HOME Van Delgado C. J.Lauter Stevens McElroy Erbey Team Vlack LOAN Chief Treasurer Investor Chairman President General TM Financial Relations and of Counsel the Officer Director Board & Capital Markets
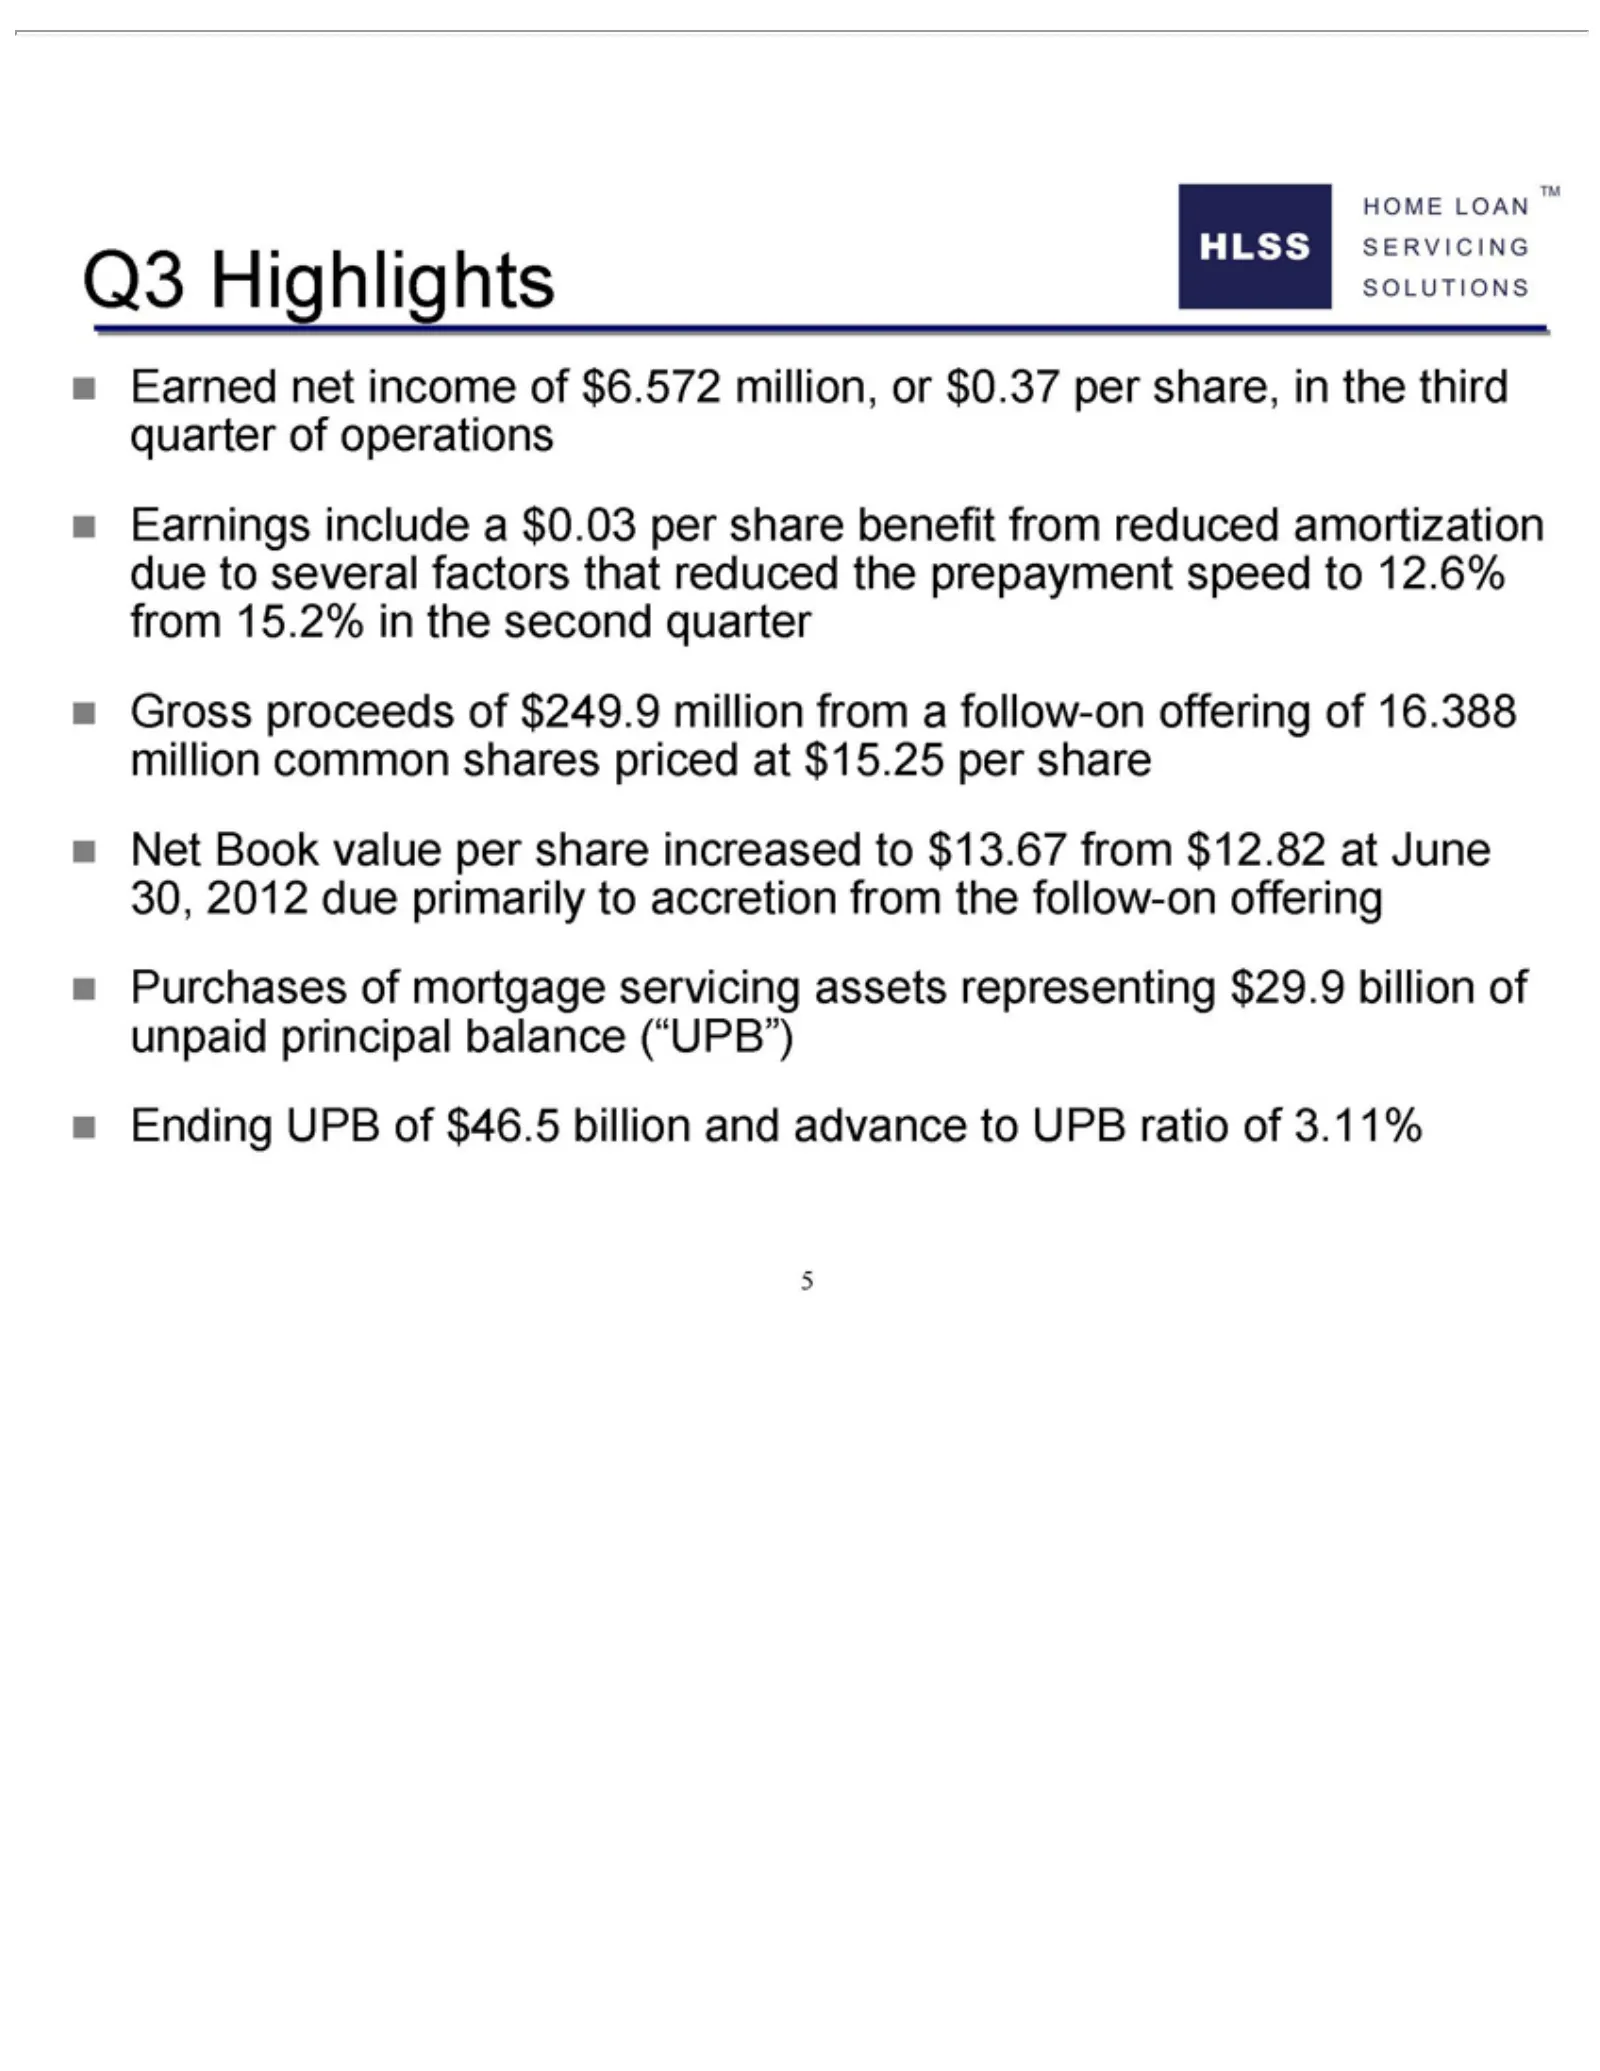
Slide 5: Q3 Highlights
Q3 Highlights HLSS Earned SOLUTIONS SERVICING Earnings Gross Net Purchases 5Ending Book proceeds HOME net UPB include value of income mortgage ofLOAN of $46.5 per a$249.9 $0.03 of share $6.572 TM billion servicing per increased million share and million, assets advance from benefit toor $13.67 arepr
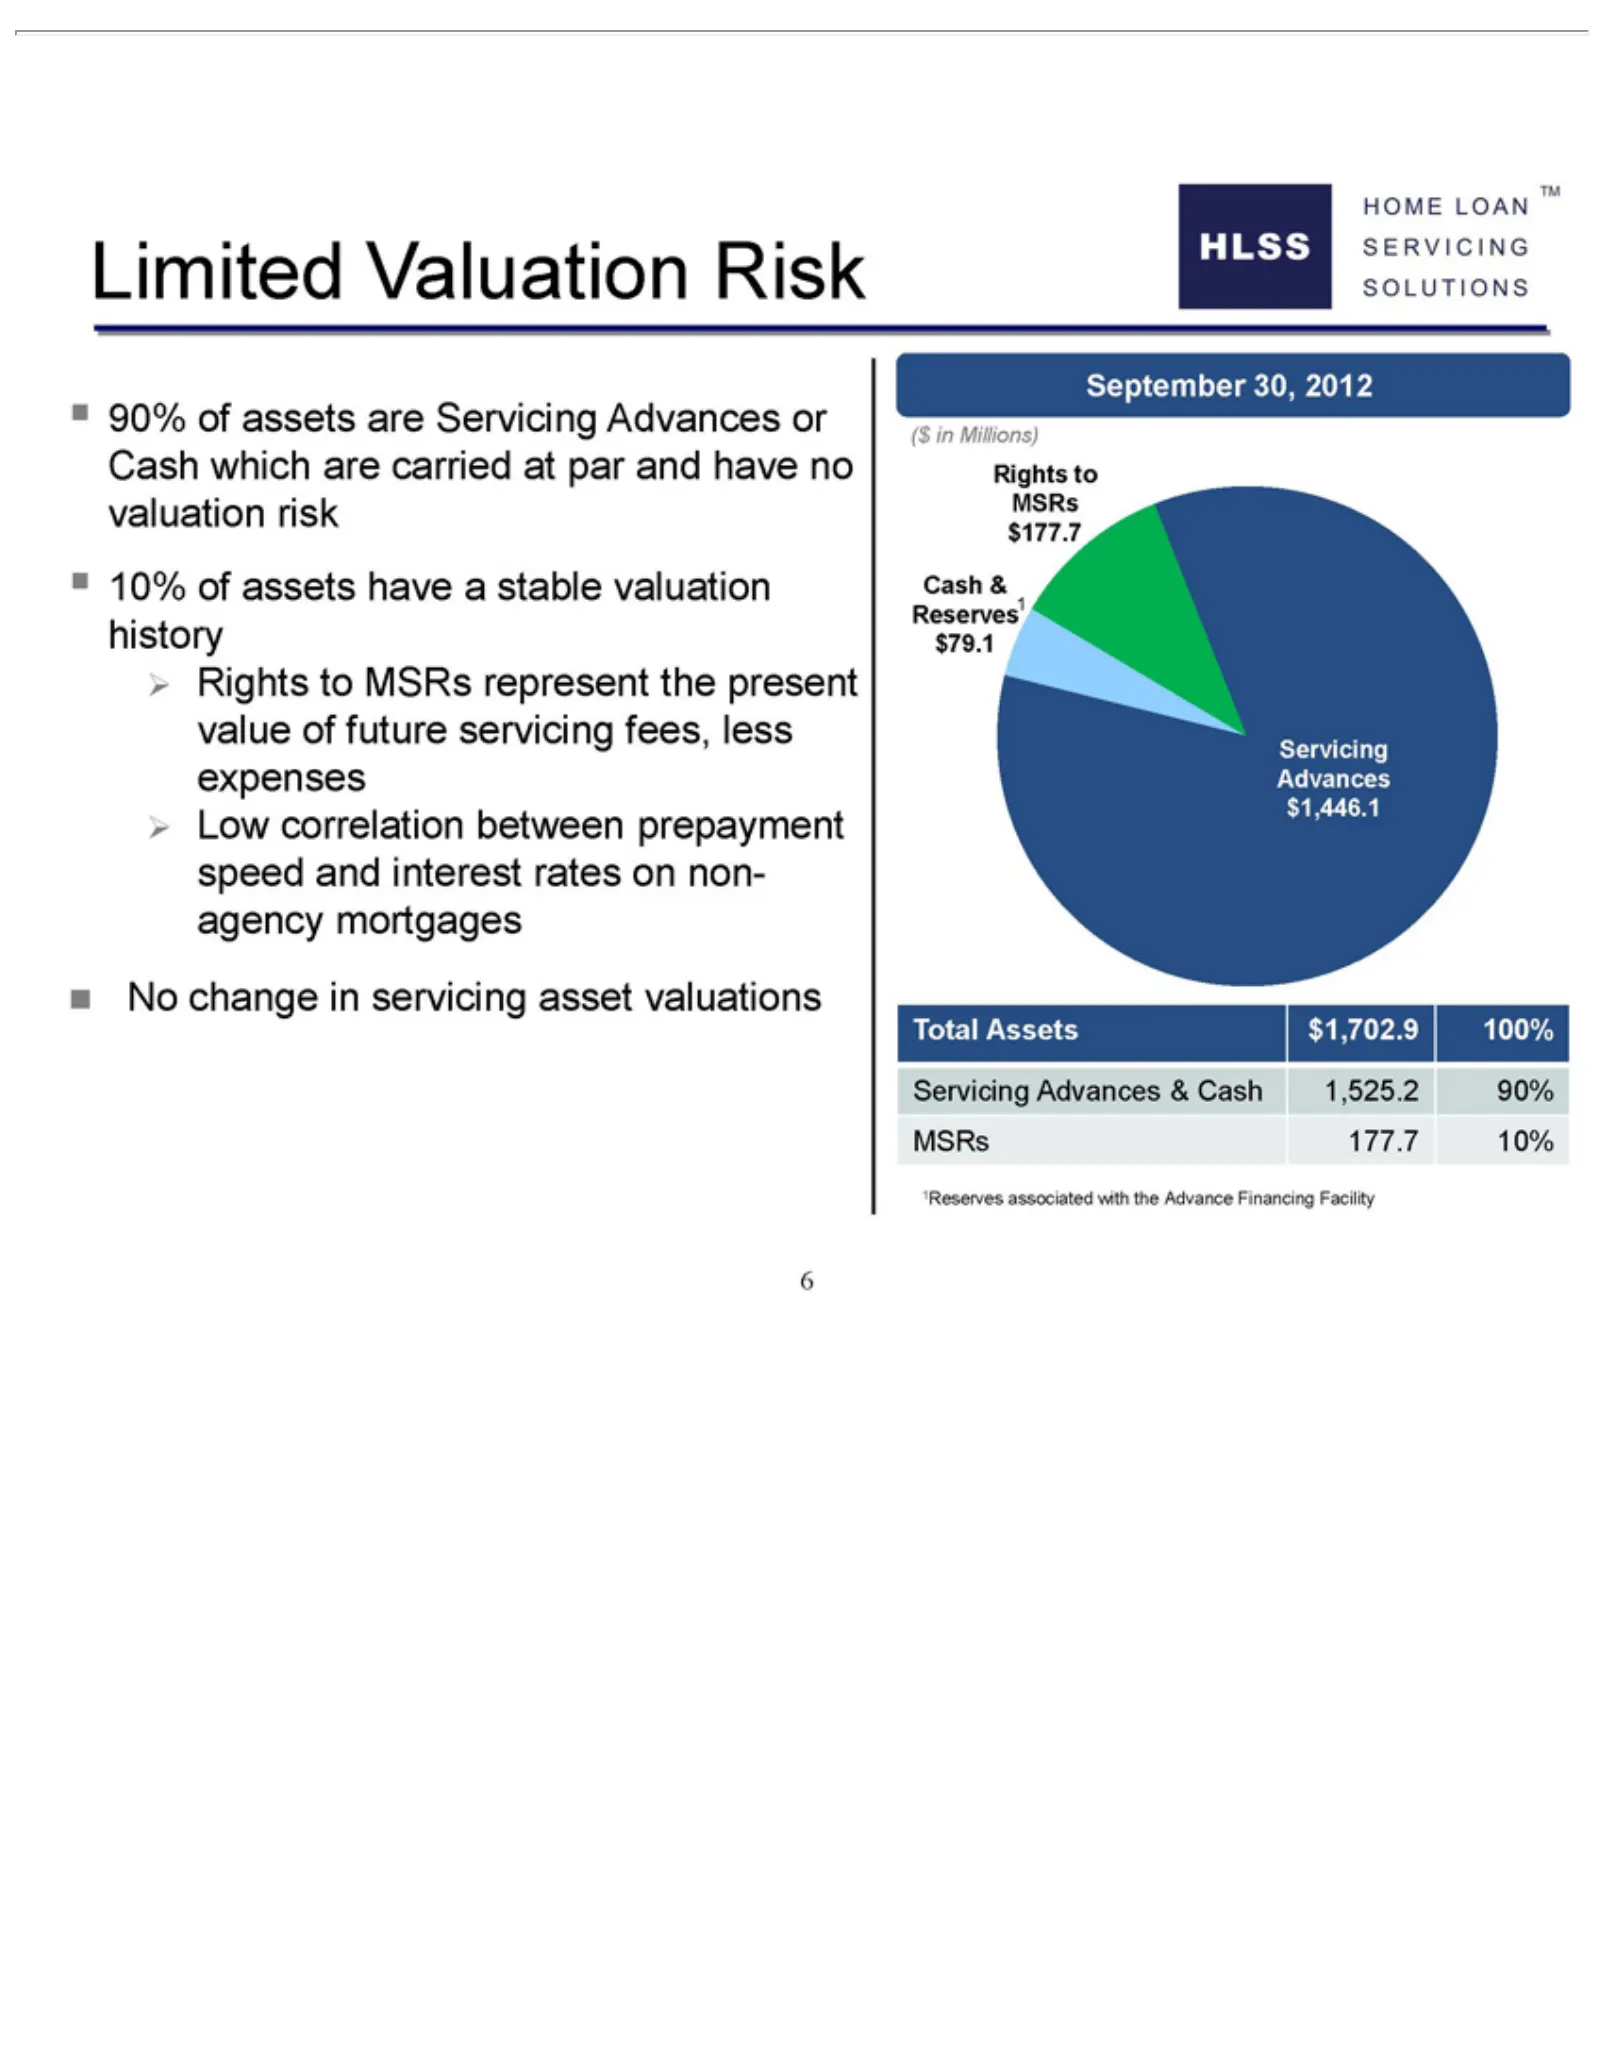
Slide 6: Limited Valuation Risk in HLSS Assets
Limited ?HLSS SOLUTIONS SERVICING servicing September ($ Rights Cash Total Servicing MSRs 61Reserves 90% in Millions) Assets &HOME 177.7 of toReserves1 Valuation assets MSRs fees, Advances associated 30, $1,702.9 10%LOAN less 2012 are $177.7 Risk $79.1 expenses? Servicing $1,446.1 &with 100% TM Cash
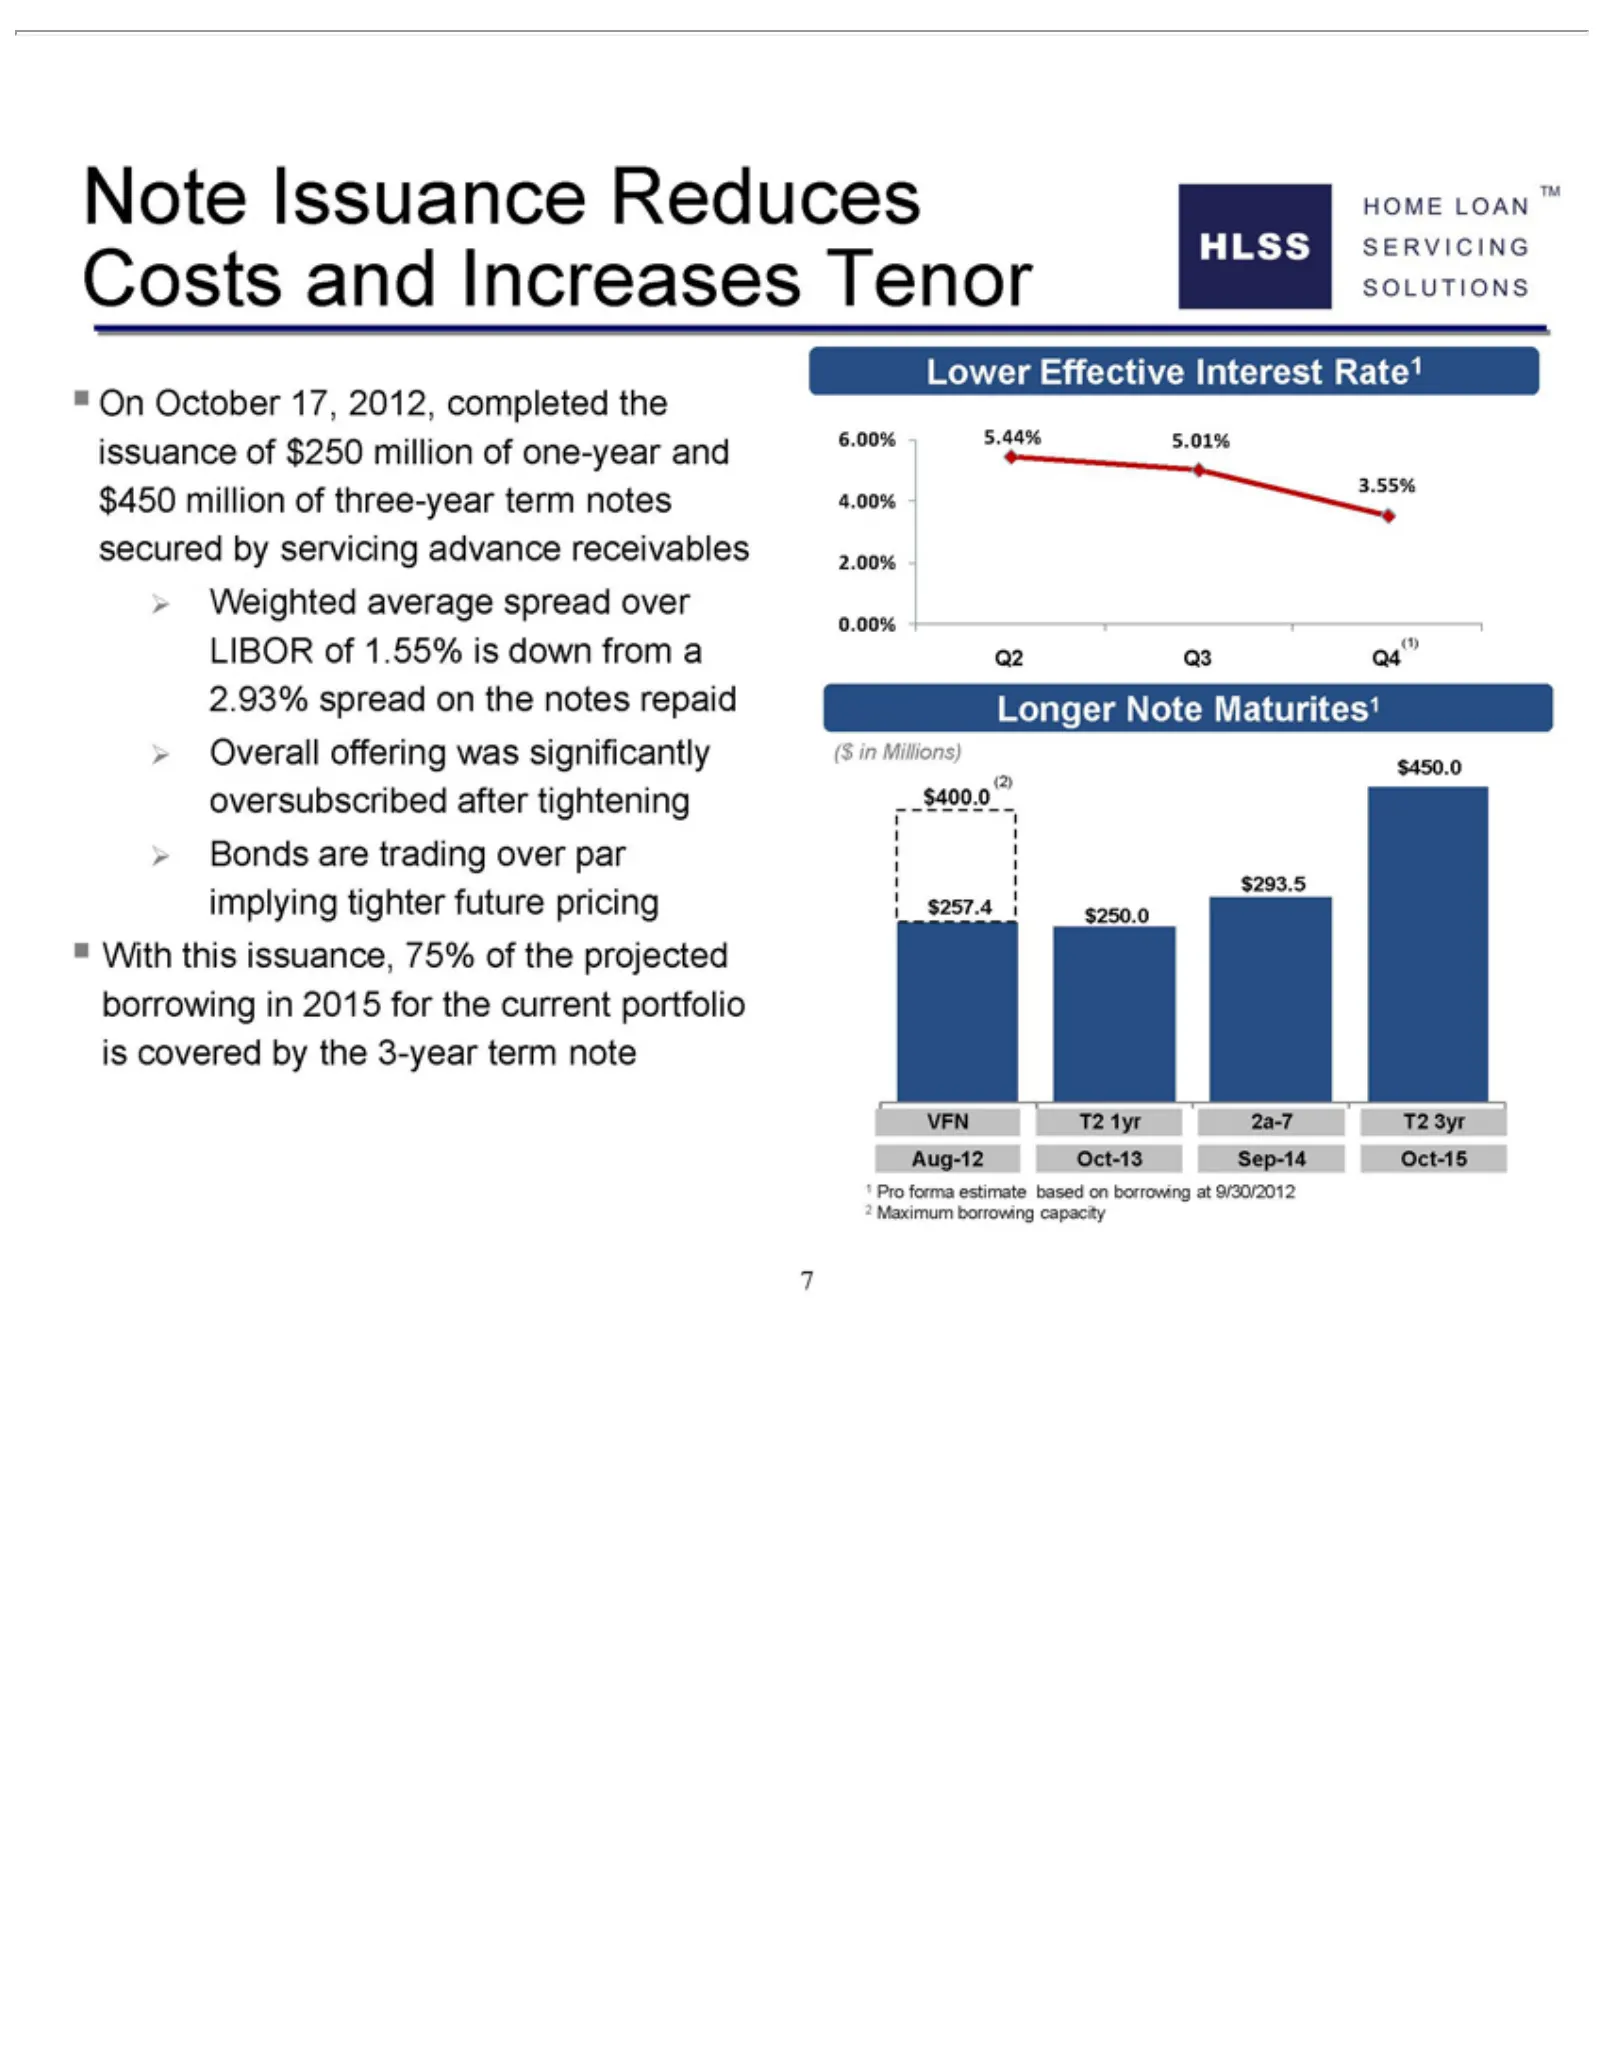
Slide 7: Note Issuance Lowers HLSS Borrowing Costs
Note HLSS On SOLUTIONS SERVICING Weighted Overall Bonds With Lower Q2 (1) 3.55% 5.01% 5.44% 0.00% 2.00% 4.00% 6.00% Longer ($ VFN $450.0 $293.5 $250.0 $257.4 $400.0(2) 721Aug-12 Pro Maximum inQ3 October Millions) Issuance this T2 forma HOME are Effective Q4 Note offering Oct-13 1yr issuance, average
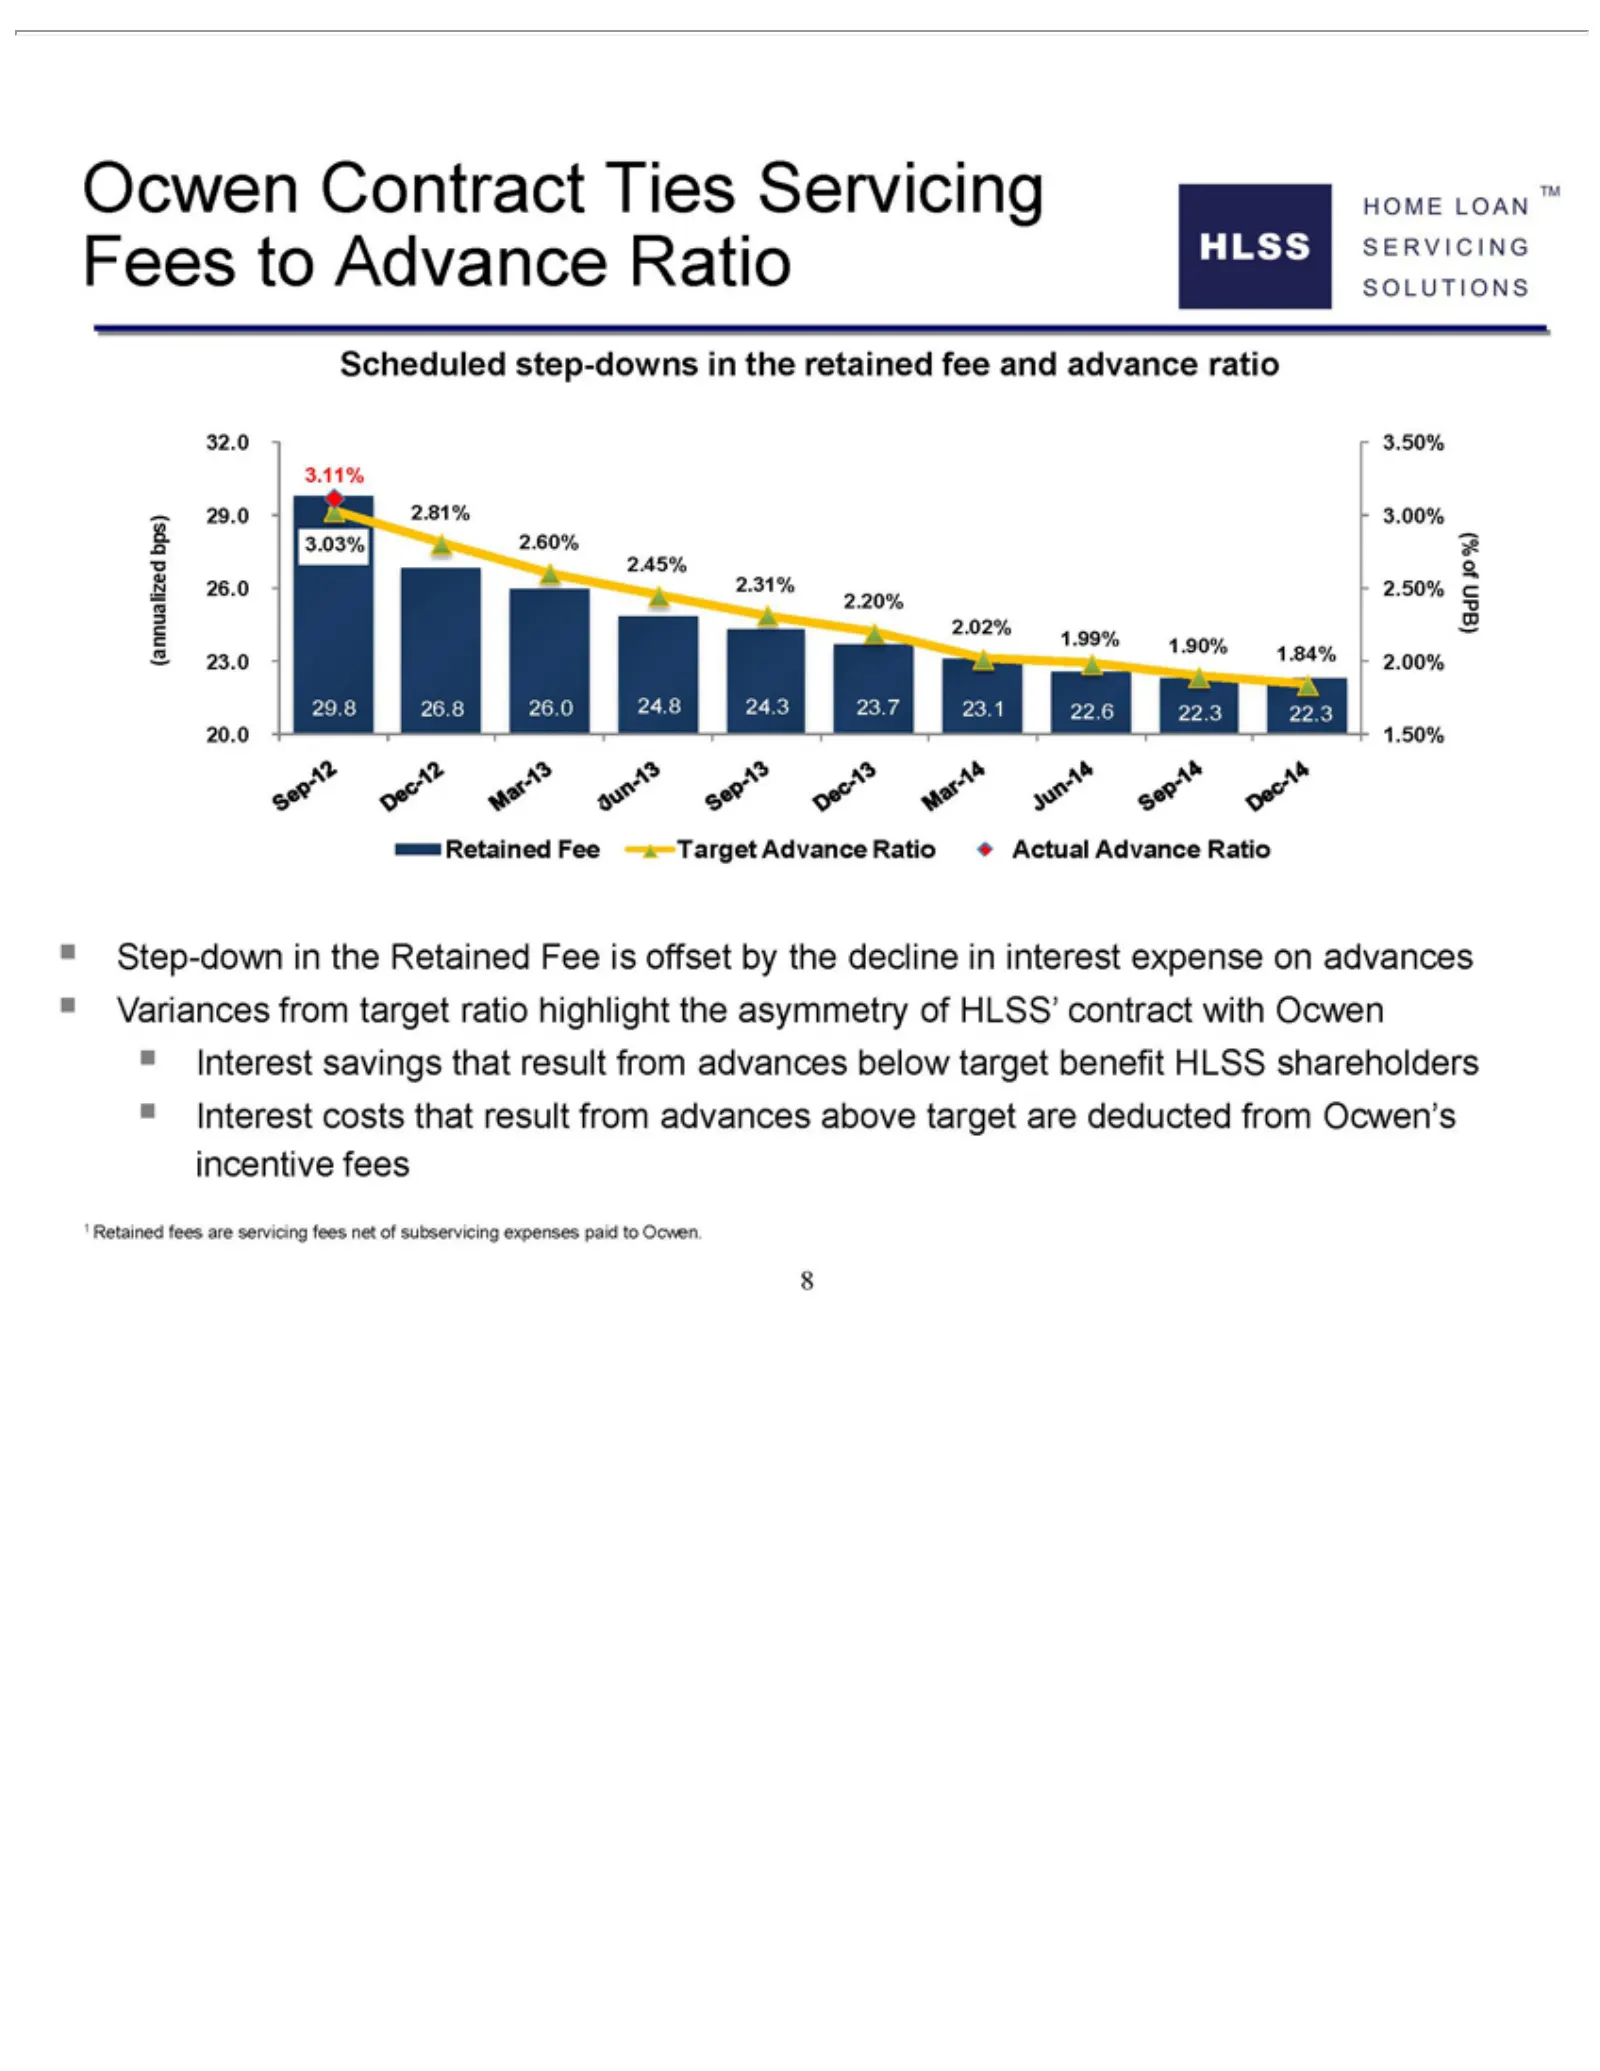
Slide 8: Ocwen Contract and HLSS Scheduled Advance Ratio
Ocwen HLSS Scheduled SOLUTIONS SERVICING (annualized (% 1.50% 2.00% 2.50% 3.00% 3.50% Dec-14 1.84% Sep-14 22.3 1.90% Jun-14 22.6 1.99% Mar-14 23.1 2.02% Dec-13 23.7 2.20% Sep-13 24.3 2.31% Jun-13 24.8 2.45% Mar-13 2.60% Dec-12 26.8 2.81% Sep-12 29.8 3.03% 3.11% 20.0 23.0 26.0 29.0 32.0 ?Retained 81a
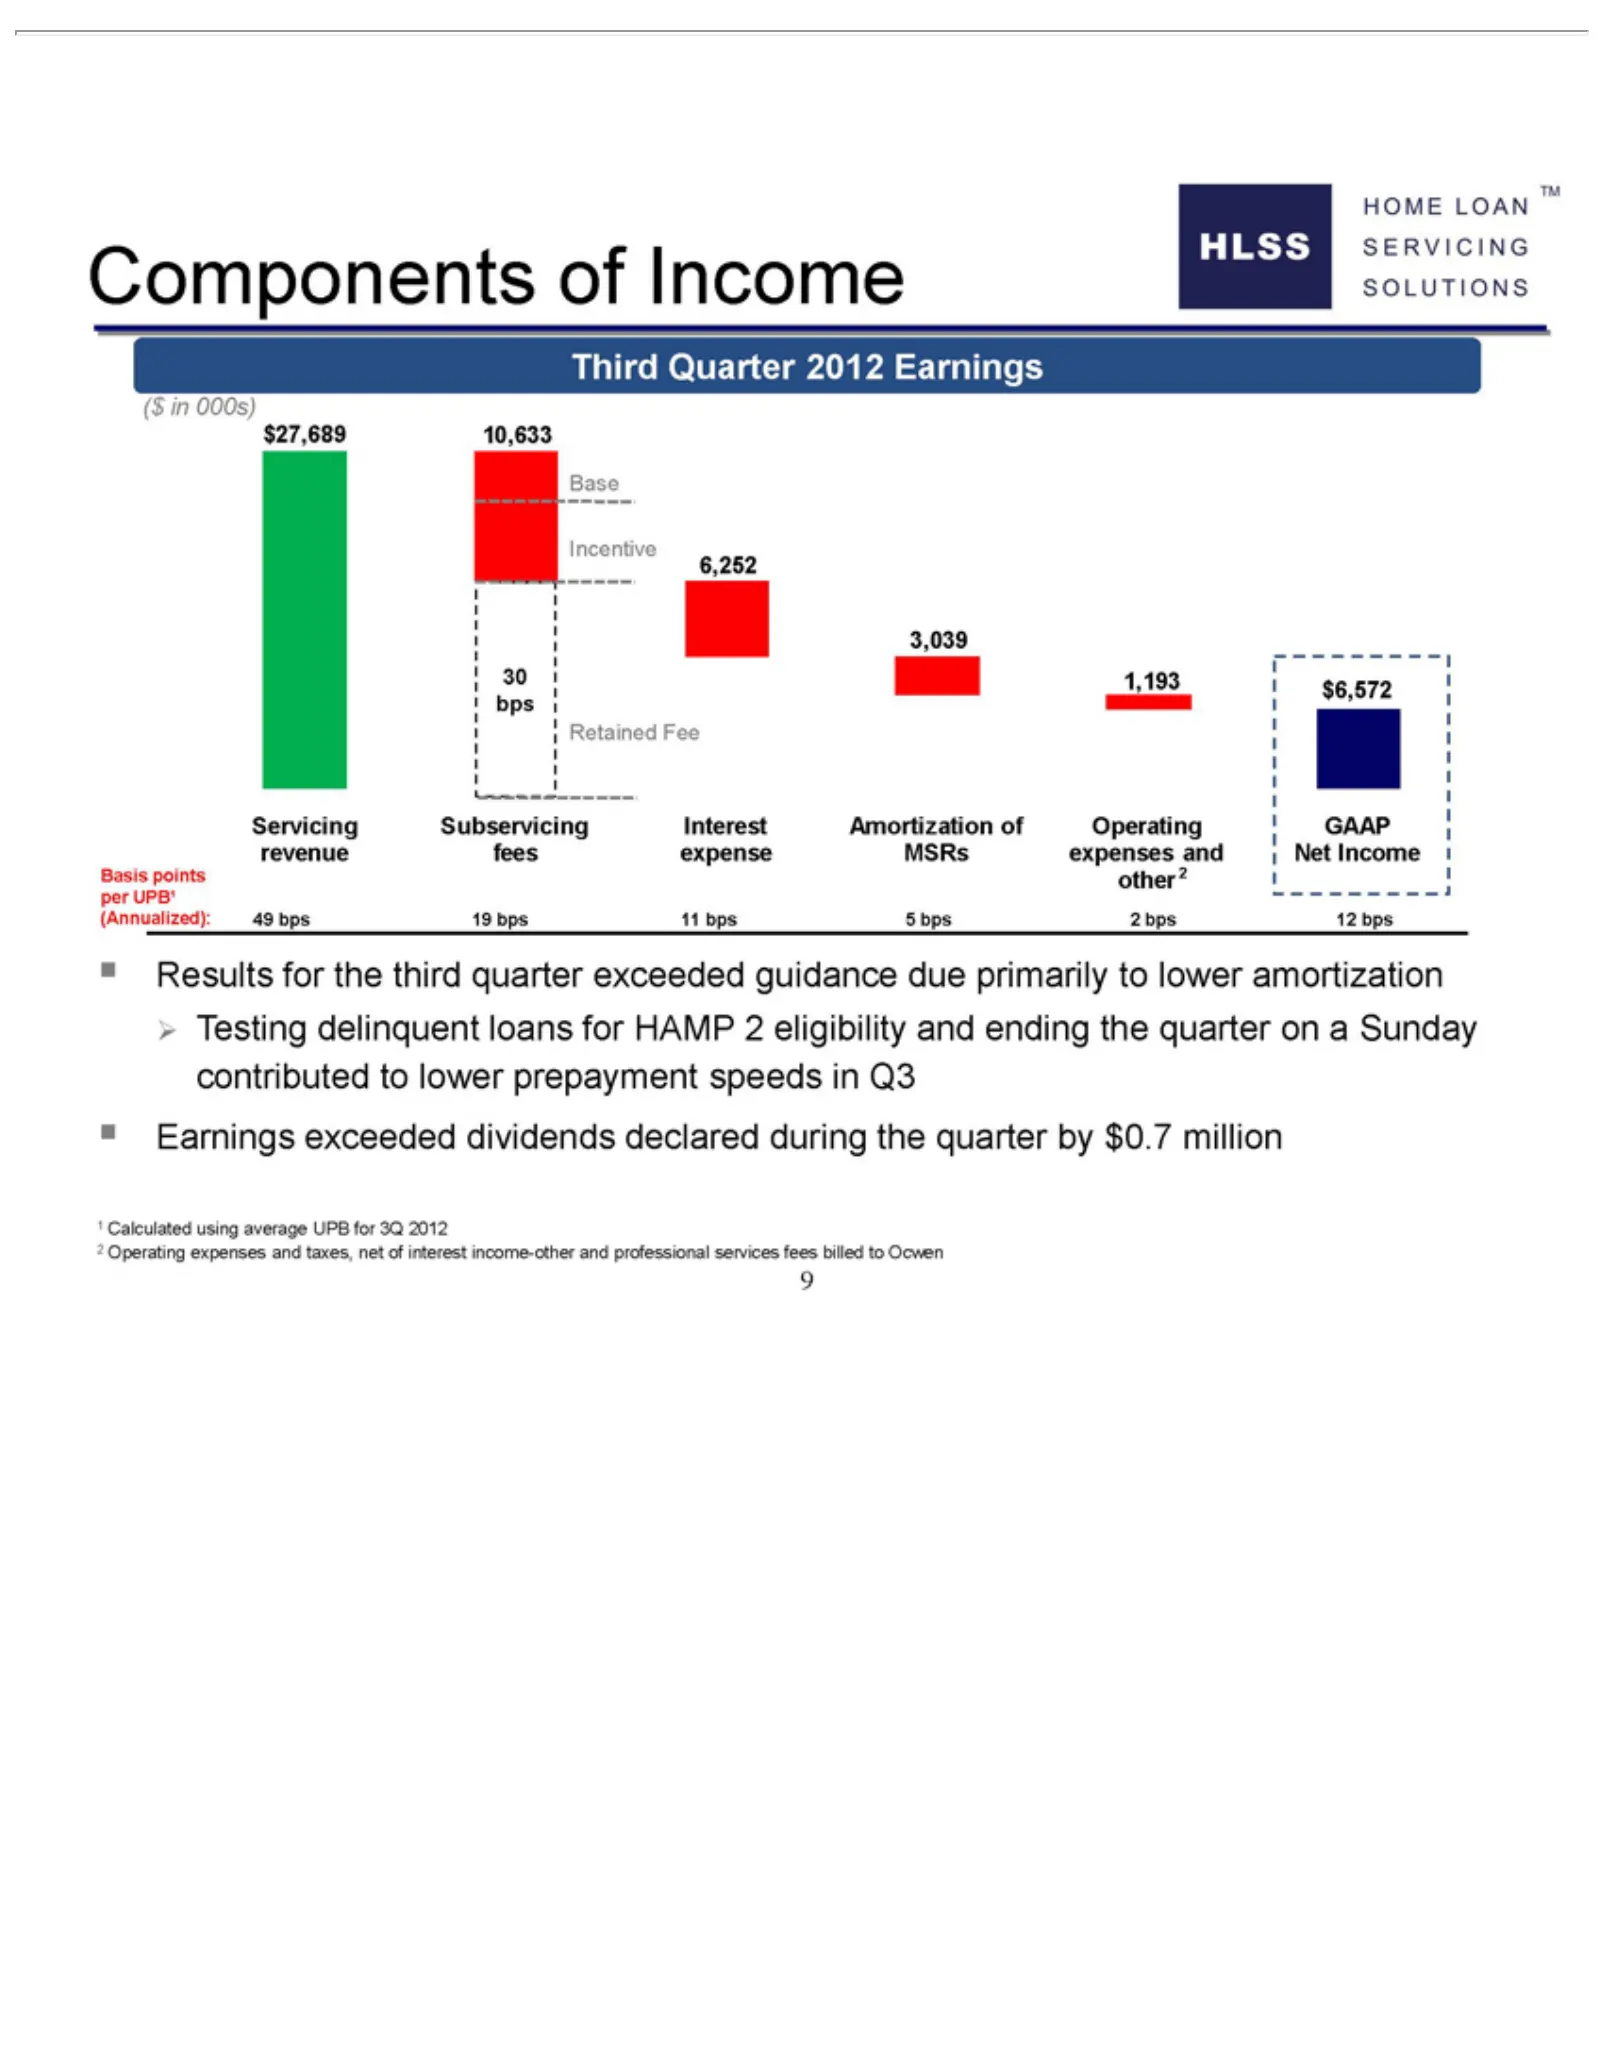
Slide 9: Components of HLSS Third Quarter Earnings
Components HLSS Third SOLUTIONS SERVICING ($ 30 10,633 $27,689 Retained Incentive Base Net GAAP $6,572 1,193 3,039 6,252 Servicing revenue Basis per (Annualized): ?12 921speeds Results Calculated Operating in bps UPB¹ Income 000s) points Quarter HOME infees Fee for Q3? Subservicing expenses other ex
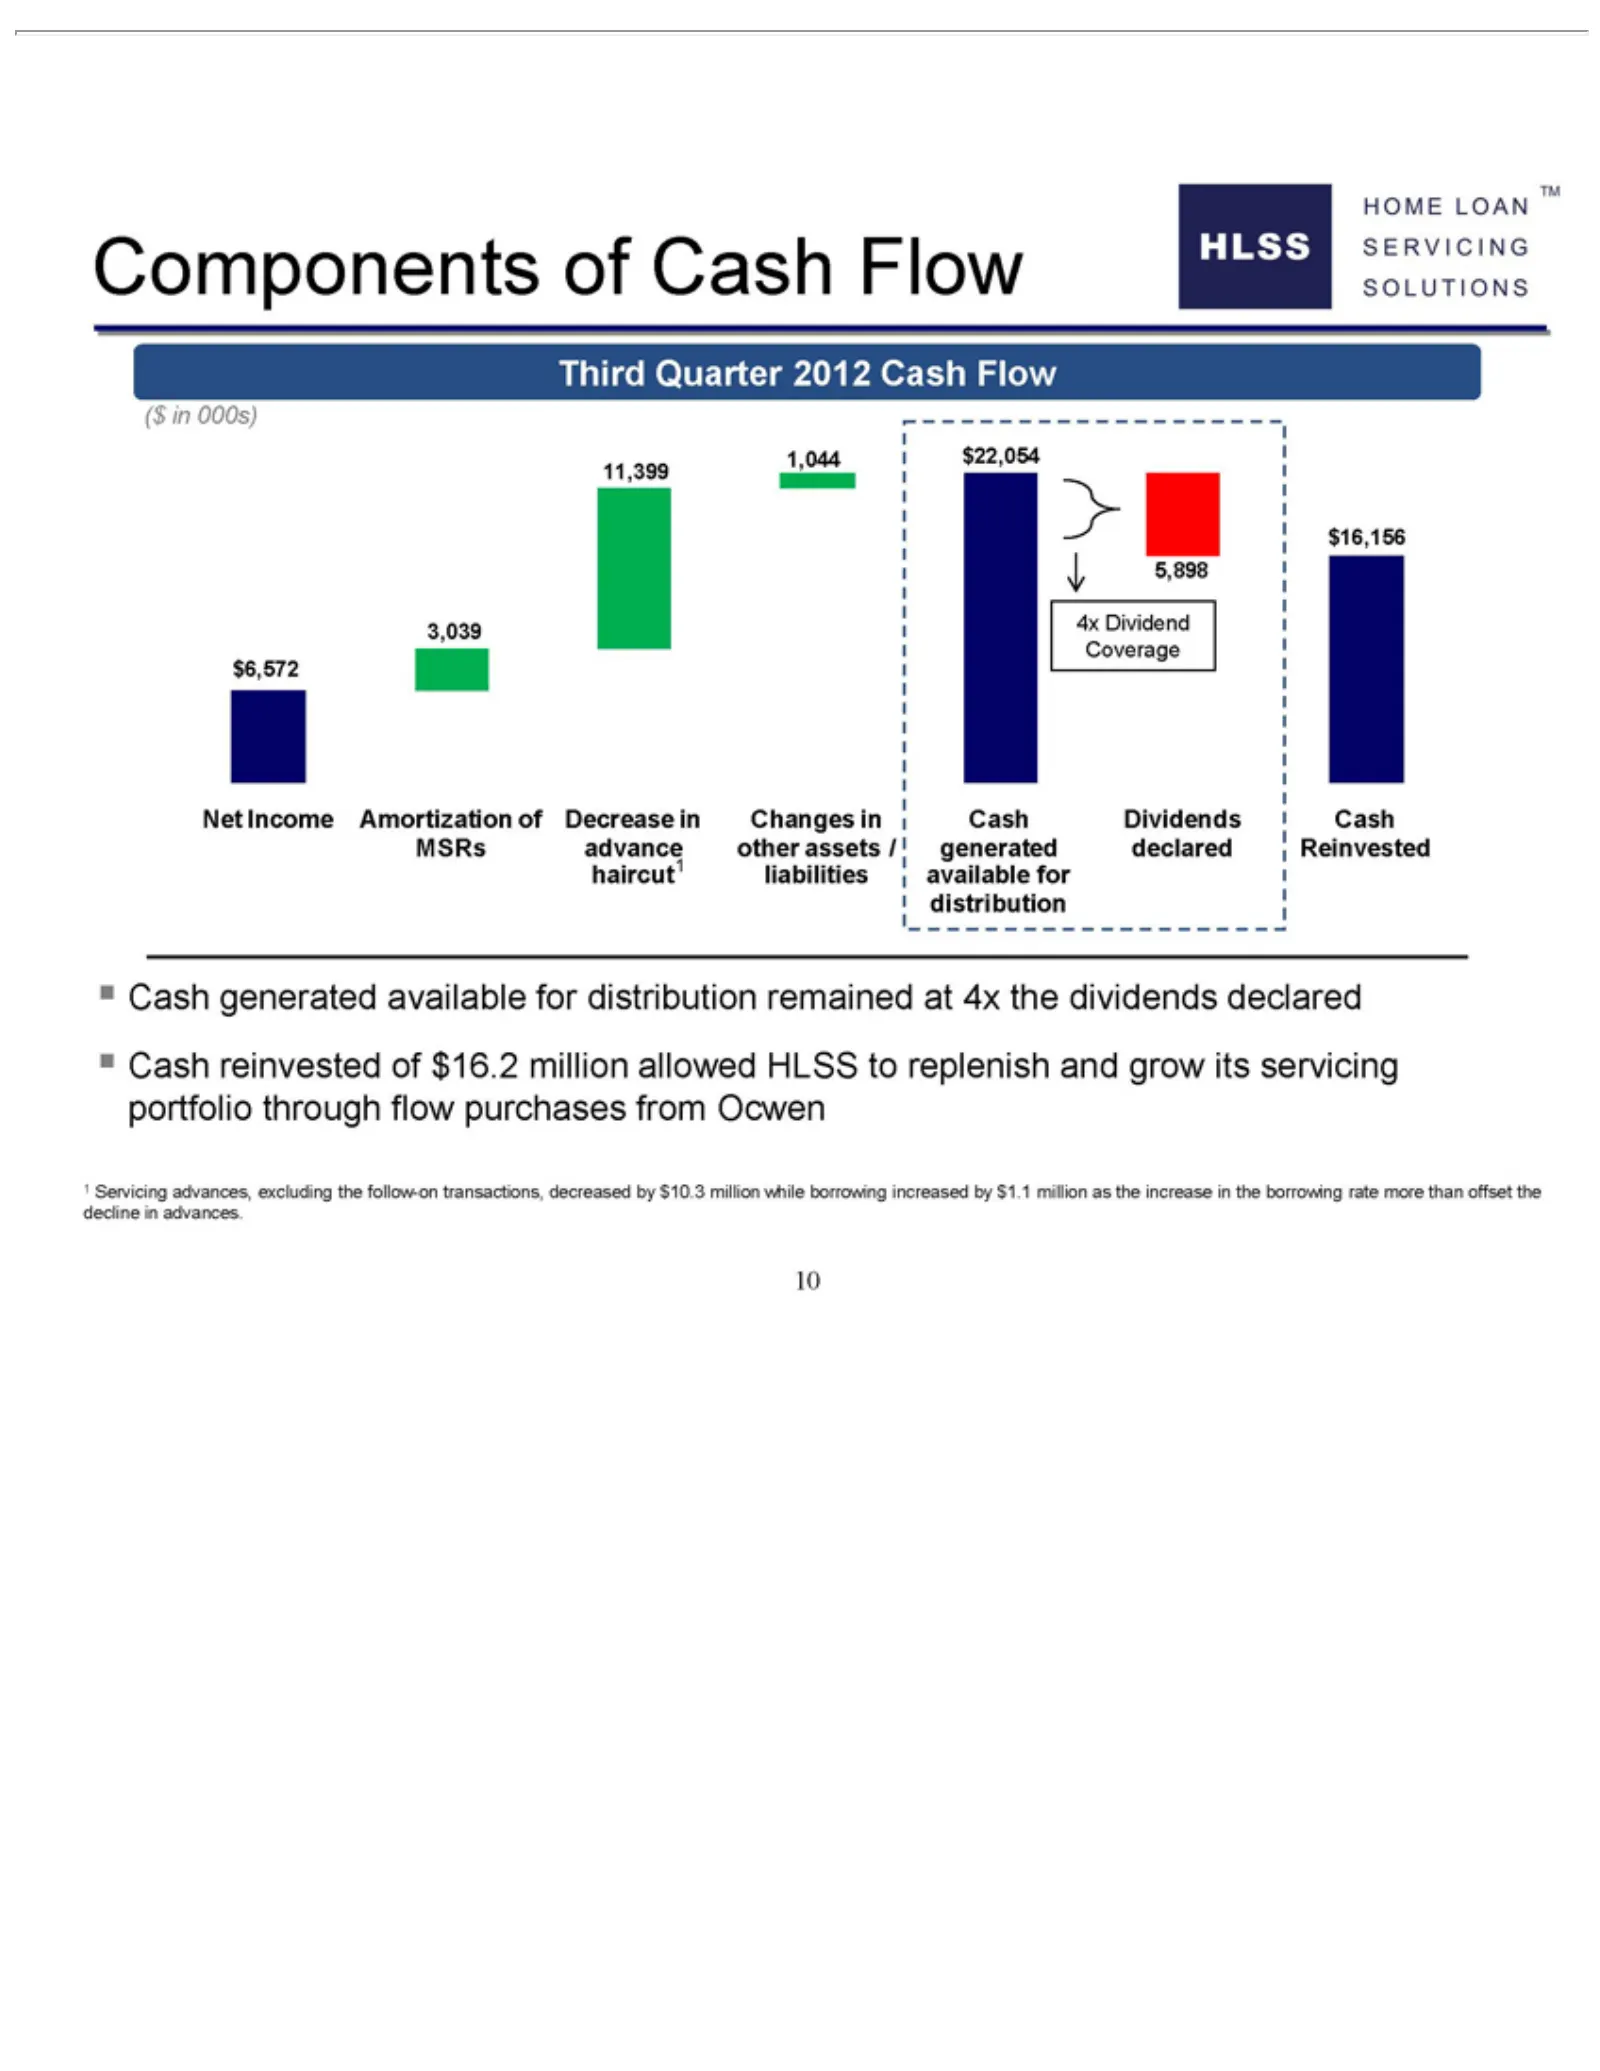
Slide 10: Components of HLSS Third Quarter Cash Flow
Components HLSS Third SOLUTIONS SERVICING ($ 4x 5,898 $22,054 1,044 11,399 3,039 $6,572 Net $16,156 MSRs haircut1 ?Cash 1distribution Ocwen 10 advances. Servicing in Dividend Income 000s) Quarter generated HOME advance liabilities advances, Amortization Coverage of2012 LOAN other Cash available avai
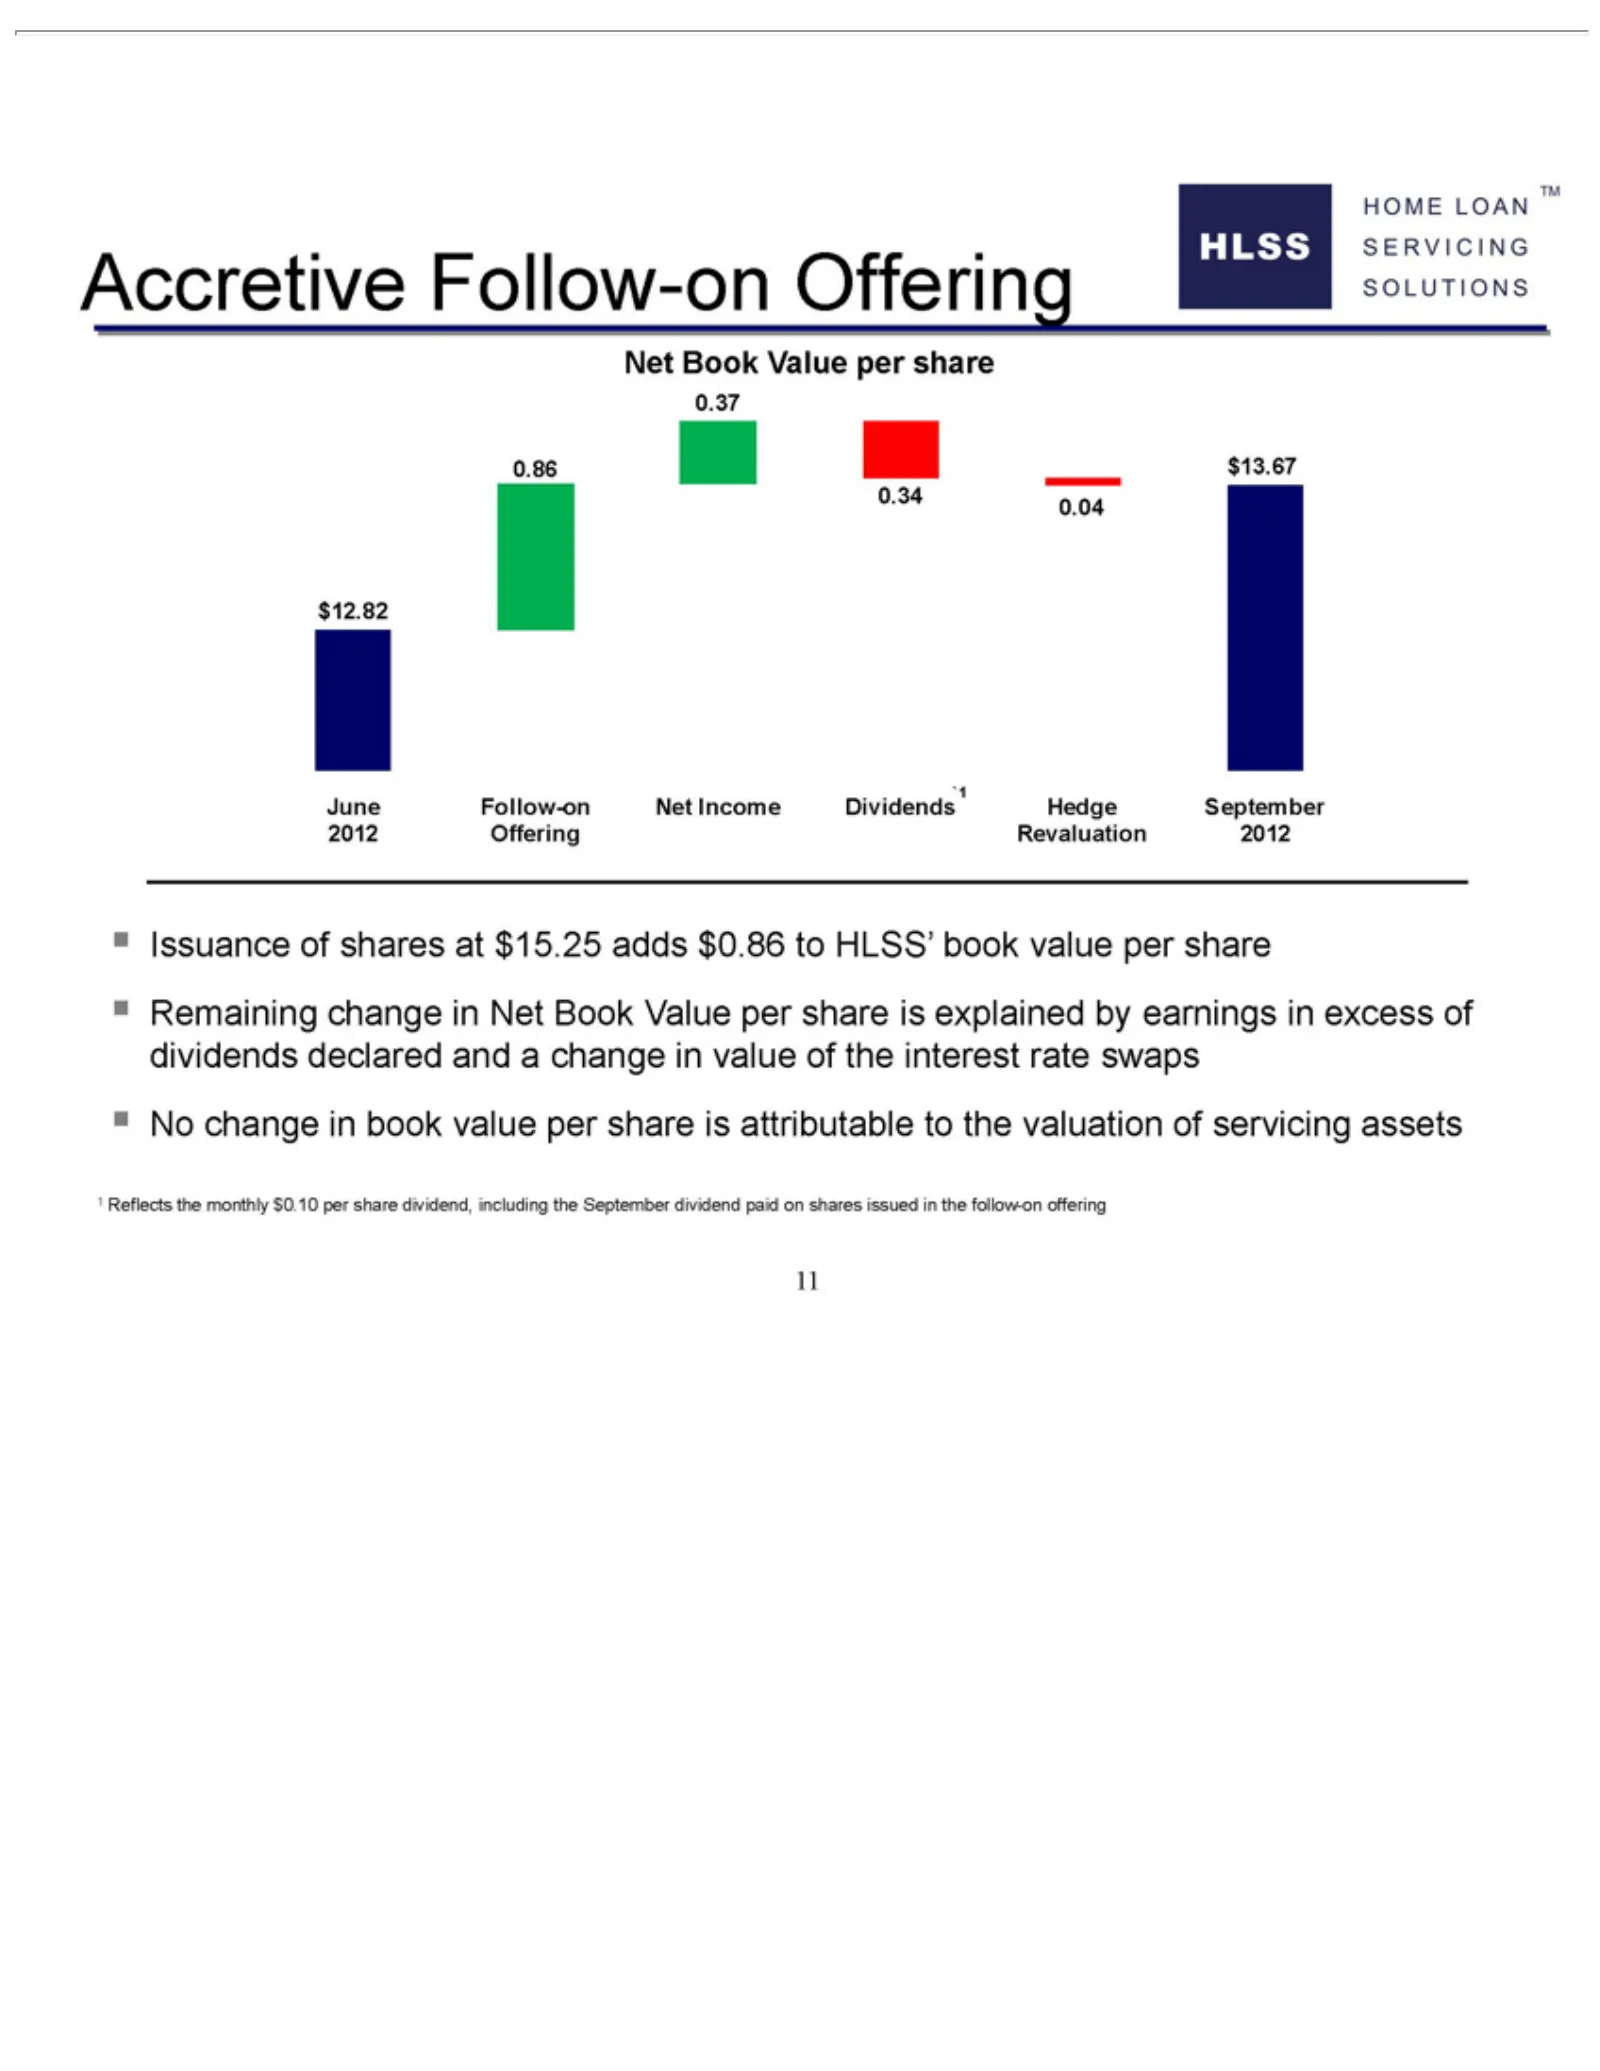
Slide 11: Accretive Follow-on Offering and Book Value per Share
Accretive HLSS SOLUTIONS SERVICING June $12.82 Follow-on 0.86 Net 0.37 D 0.34 Hedge 0.04 September ?$13.67 1the 11Issuance Remaining ividends Reflects valuation Book Income 2012 HOME Revaluation Value Follow-on the of Offering 2012 change of shares monthly LOAN servicing per share at in Offering TM
Source: SEC EDGAR · 8-K filed Nov 28, 2012
More decks from Home Loan Servicing Solutions Ltd
 Merger or Acquisition (February 2015)6 slides · Feb 23, 2015
 Q3 2014 Earnings Presentation15 slides · Oct 21, 2014
 Debt Investor Presentation (September 2014)40 slides · Sep 22, 2014
 Investor Presentation (September 2014)14 slides · Sep 8, 2014
 Investor Presentation (May 2014)17 slides · May 20, 2014
 Debt Investor Presentation (January 2014)45 slides · Jan 23, 2014