Home Loan Servicing Solutions Ltd
Home Loan Servicing Solutions — Q3 2014 Earnings Presentation
15 slides from Home Loan Servicing Solutions's earnings presentation, Oct 21, 2014
Slide 1: Investor Presentation 3rd Quarter 2014
Investor Presentation 3rd Quarter 2014
Slide 2: Forward-Looking Statement and Non-GAAP Measures
2 FORWARD-LOOKING STATEMENT: This presentation contains forward-looking statements within the meaning of Section 27A of the Securities Act of 1933, as amended, and Section 21E of the Securities Exchange Act of 1934, as amended. All statements, other than statements of historical facts, included in t
Slide 3: HLSS Overview
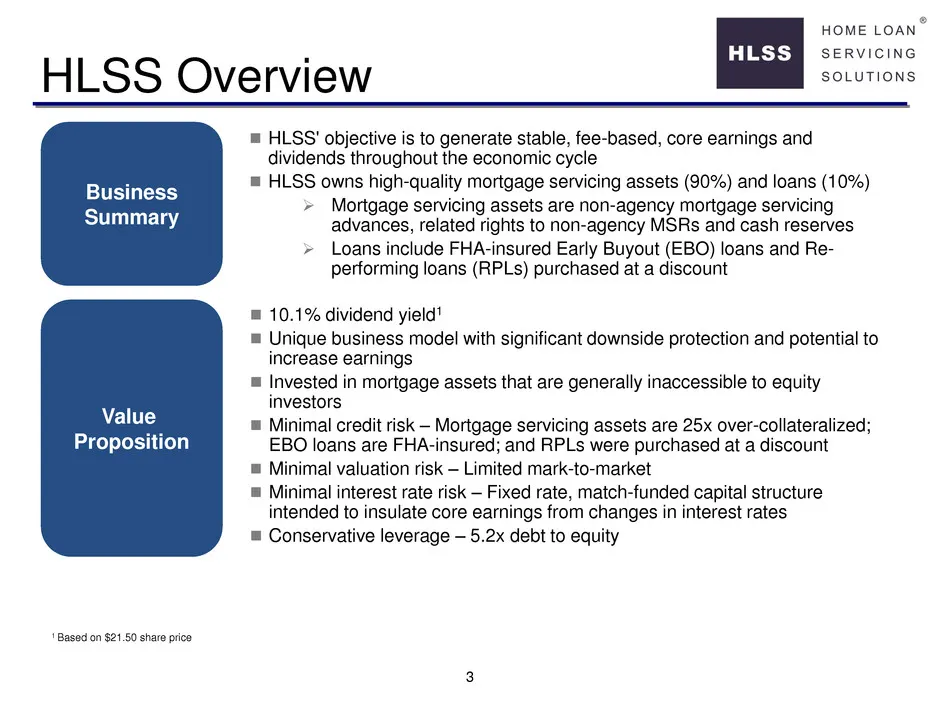
3 HLSS' objective is to generate stable, fee-based, core earnings and dividends throughout the economic cycle HLSS owns high-quality mortgage servicing assets (90%) and loans (10%) Mortgage servicing assets are non-agency mortgage servicing advances, related rights to non-agency MSRs and cash
Slide 4: What Wall Street Says
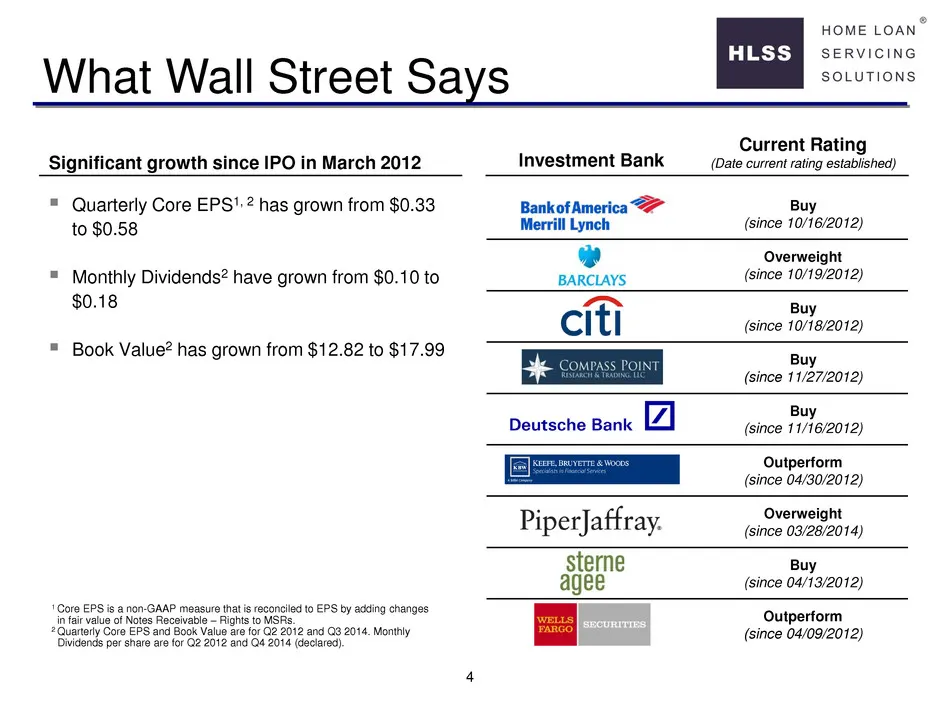
4 Investment Bank Current Rating (Date current rating established) Buy (since 10/16/2012) Overweight (since 10/19/2012) Buy (since 10/18/2012) Buy (since 11/27/2012) Buy (since 11/16/2012) Outperform (since 04/30/2012) Overweight (since 03/28/2014) Buy (since 04/13/2012) Outperform (since 04/09/2012
Slide 5: Mortgage Servicing
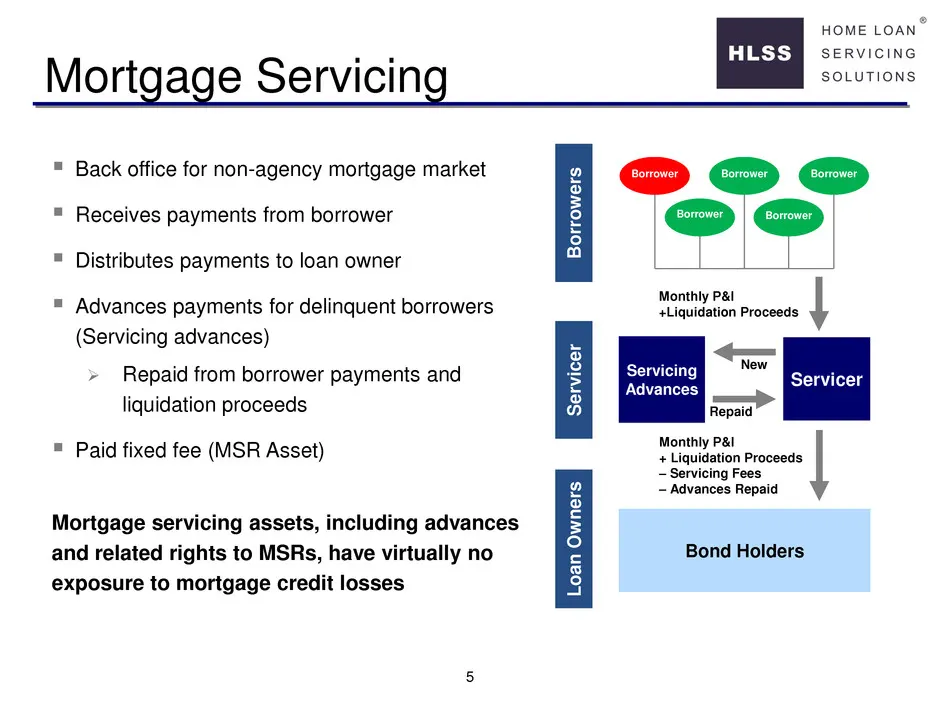
5 Mortgage Servicing Back office for non-agency mortgage market Receives payments from borrower Distributes payments to loan owner Advances payments for delinquent borrowers (Servicing advances) Repaid from borrower payments and liquidation proceeds Paid fixed fee (MSR Asset) Mortgage se
Slide 6: Assets Have Limited Credit and Valuation Risk
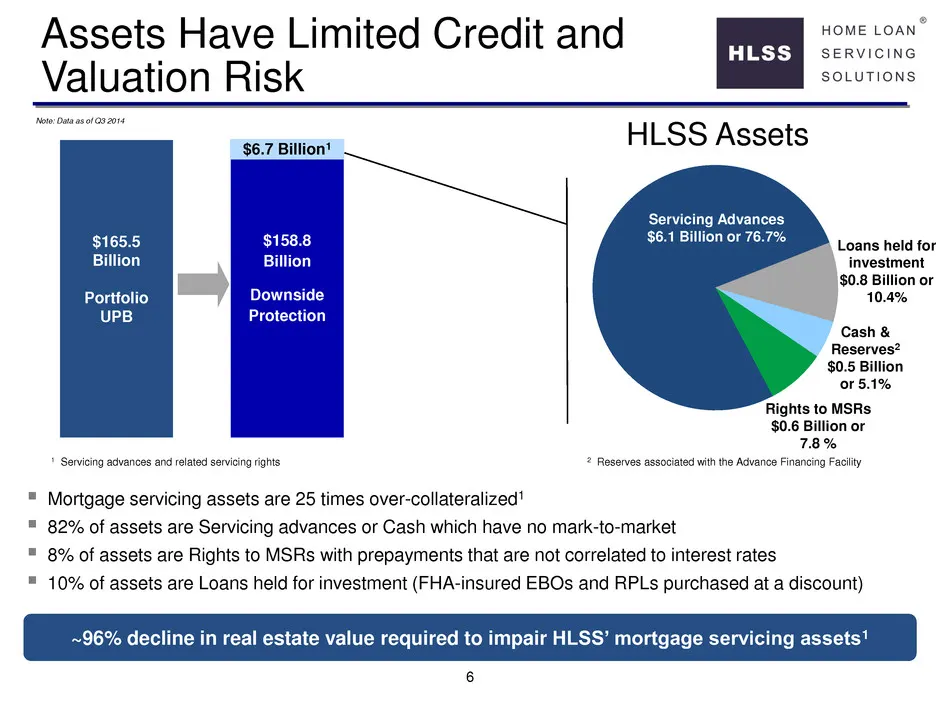
6 ~96% decline in real estate value required to impair HLSS’ mortgage servicing assets1 Mortgage servicing assets are 25 times over-collateralized1 82% of assets are Servicing advances or Cash which have no mark-to-market 8% of assets are Rights to MSRs with prepayments that are not correlated
Slide 7: Liabilities are Primarily Fixed-Rate, Term Financing Secured by Advances
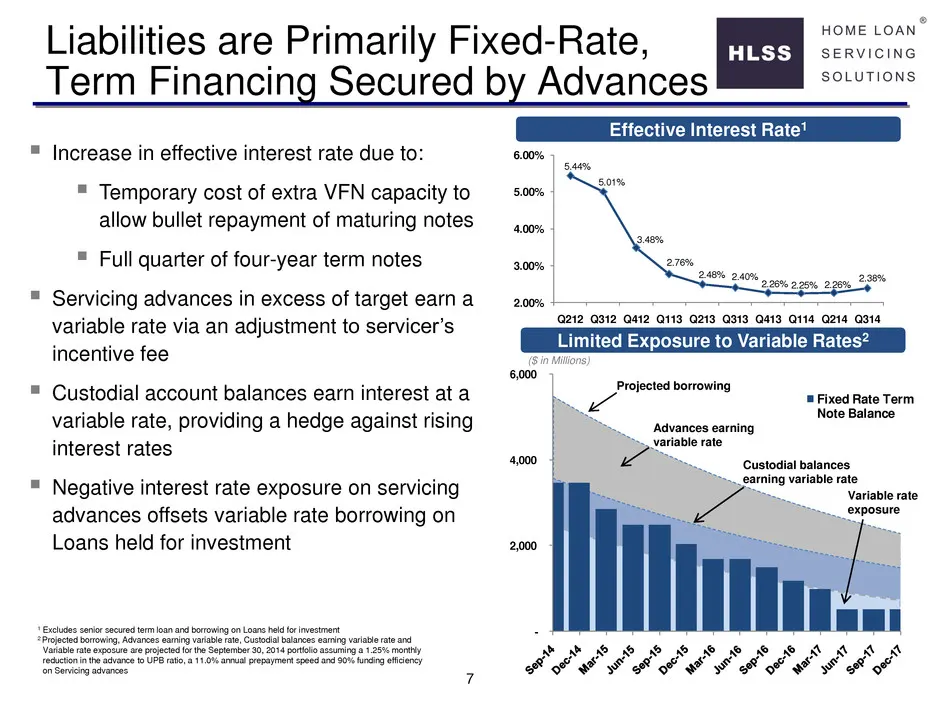
7 - 2,000 4,000 6,000 Fixed Rate Term Note Balance 5.44% 5.01% 3.48% 2.76% 2.48% 2.40% 2.26% 2.25% 2.26% 2.38% 2.00% 3.00% 4.00% 5.00% 6.00% Q212 Q312 Q412 Q113 Q213 Q313 Q413 Q114 Q214 Q314 Advances earning variable rate Liabilities are Primarily Fixed-Rate, Term Financing Secured by Advances ($ in
Slide 8: Stable Revenue and Expenses
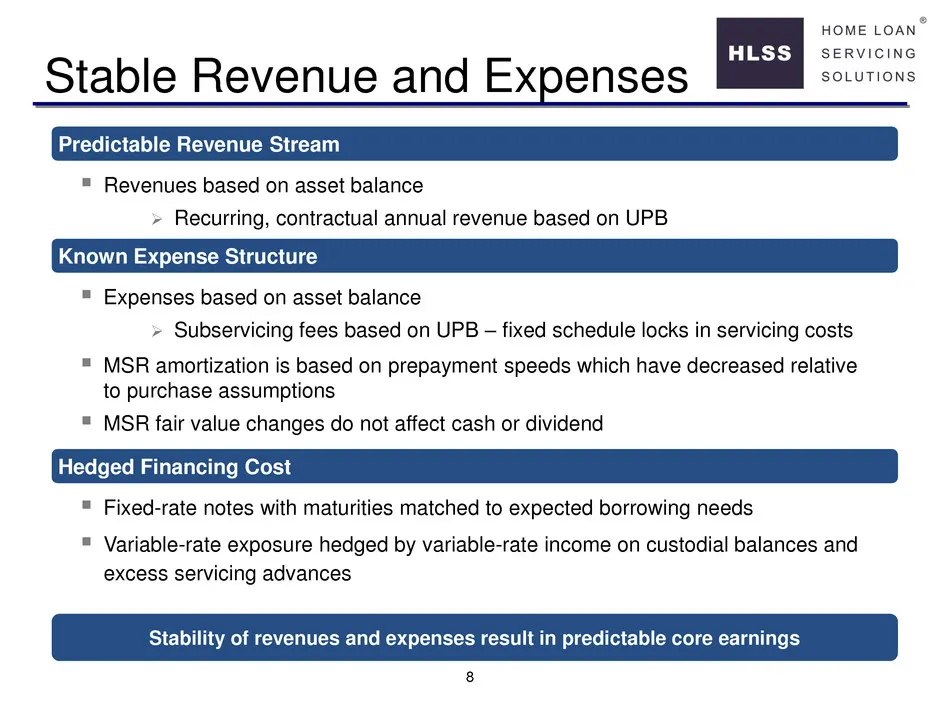
8 Stability of revenues and expenses result in predictable core earnings Stable Revenue and Expenses Predictable Revenue Stream Known Expense Structure Hedged Financing Cost Revenues based on asset balance Recurring, contractual annual revenue based on UPB Expenses based on asset balance Sub
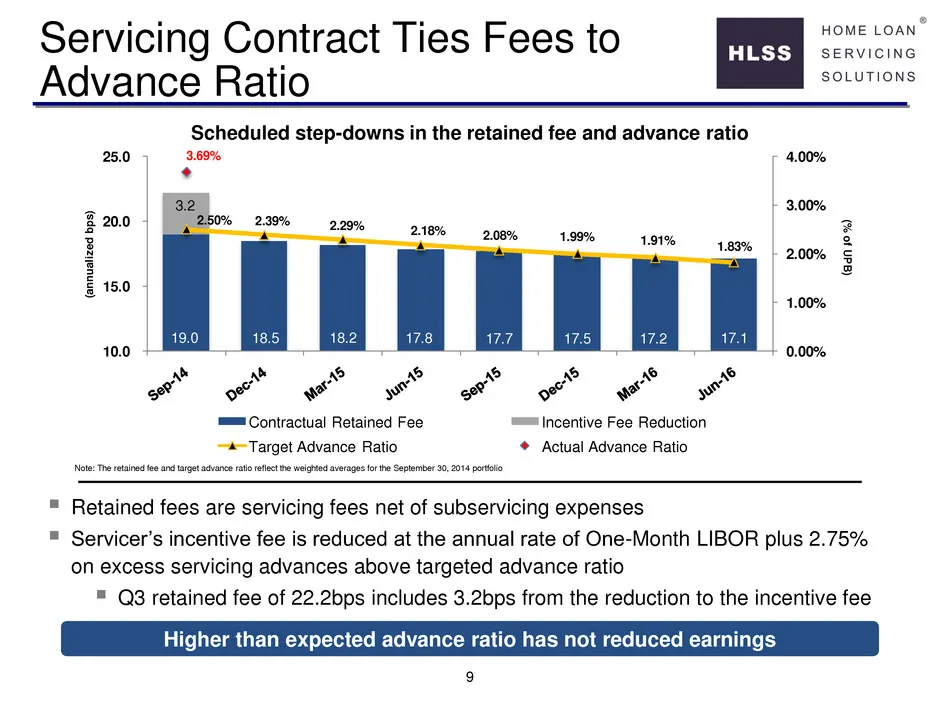
Slide 9: Servicing Contract Ties Fees to Advance Ratio
9 19.0 18.5 18.2 17.8 17.7 17.5 17.2 17.1 3.2 2.50% 2.39% 2.29% 2.18% 2.08% 1.99% 1.91% 1.83% 3.69% 0.00% 1.00% 2.00% 3.00% 4.00% 10.0 15.0 20.0 25.0 (% of UPB) (an nu ali zed bp s) Contractual Retained Fee Incentive Fee Reduction Target Advance Ratio Actual Advance Ratio Servicing Contract Ties Fee
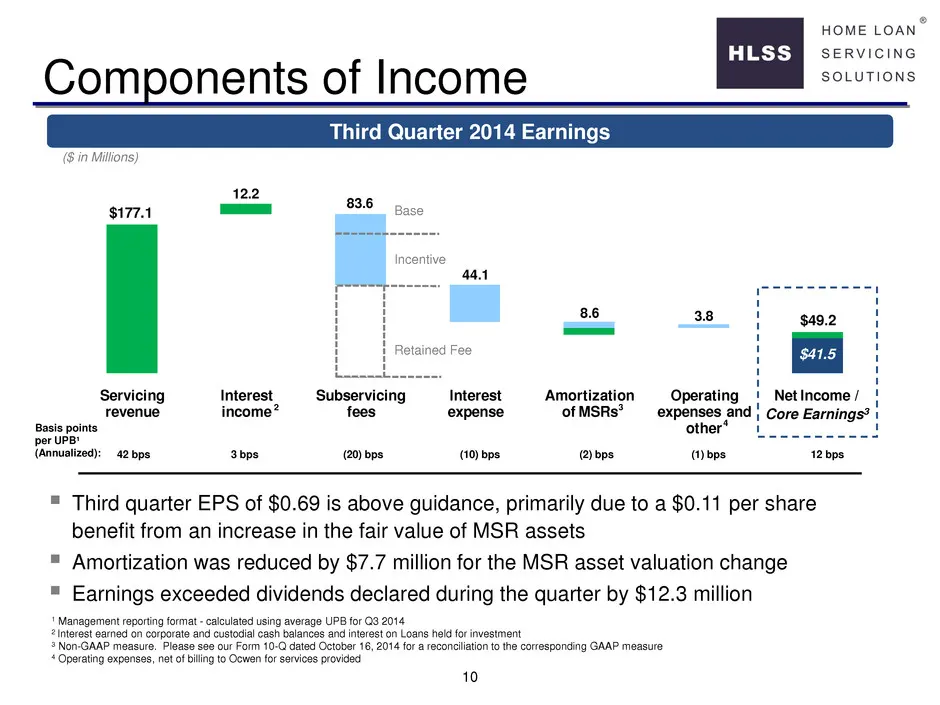
Slide 10: Third Quarter 2014 Earnings
10 $177.1 $41.5 Servicing revenue Interest income Subservicing fees Interest expense Amortization of MSRs Operating expenses and other Net Income / Components of Income Third quarter EPS of $0.69 is above guidance, primarily due to a $0.11 per share benefit from an increase in the fair value of MS
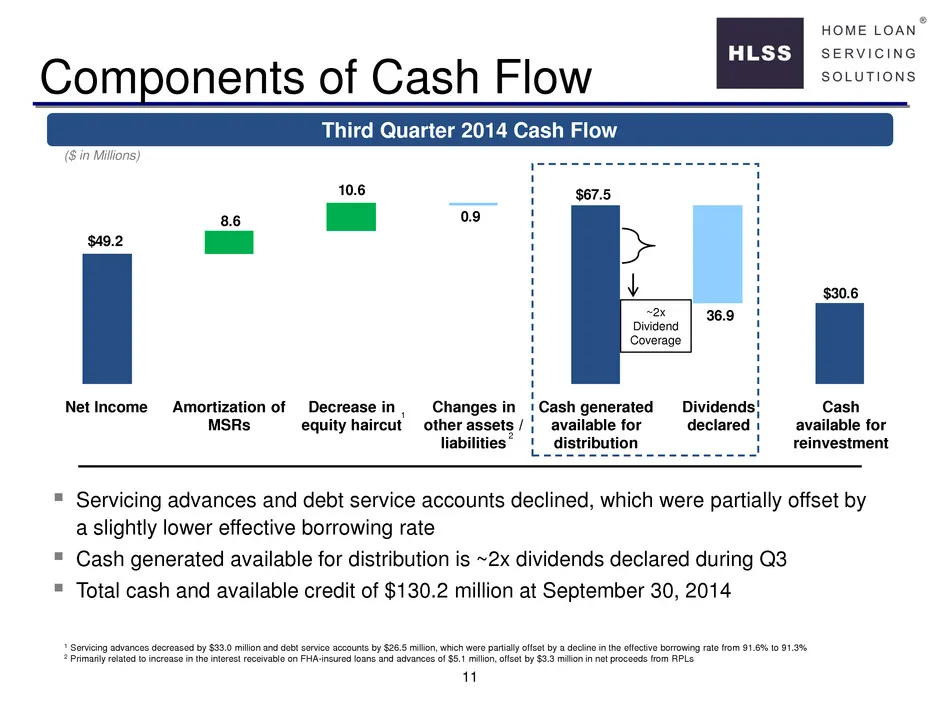
Slide 11: Third Quarter 2014 Components of Cash Flow
11 $49.2 $67.5 $30.6 8.6 10.6 0.9 36.9 Net Income Amortization of MSRs Decrease in equity haircut Changes in other assets / liabilities Cash generated available for distribution Dividends declared Cash available for reinvestment Components of Cash Flow Servicing advances and debt service accounts
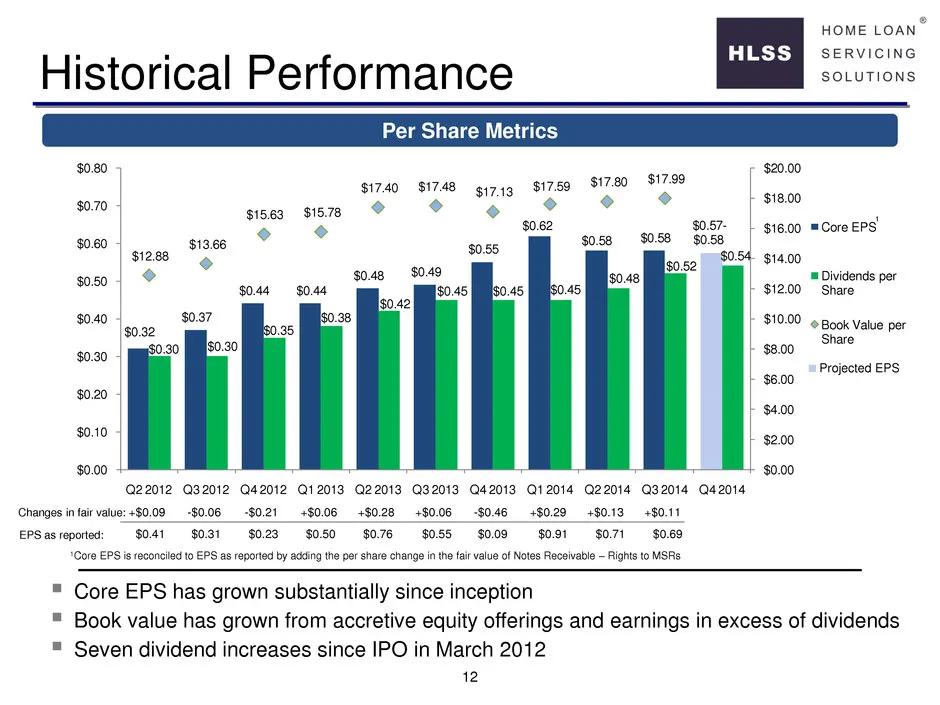
Slide 12: Historical Performance Per Share Metrics
12 $0.32 $0.37 $0.44 $0.44 $0.48 $0.49 $0.55 $0.62 $0.58 $0.58 $0.57- $0.58 $0.30 $0.30 $0.35 $0.38 $0.42 $0.45 $0.45 $0.45 $0.48 $0.52 $0.54 $12.88 $13.66 $15.63 $15.78 $17.40 $17.48 $17.13 $17.59 $17.80 $17.99 $0.00 $2.00 $4.00 $6.00 $8.00 $10.00 $12.00 $14.00 $16.00 $18.00 $20.00 $0.00 $0.10 $0.2
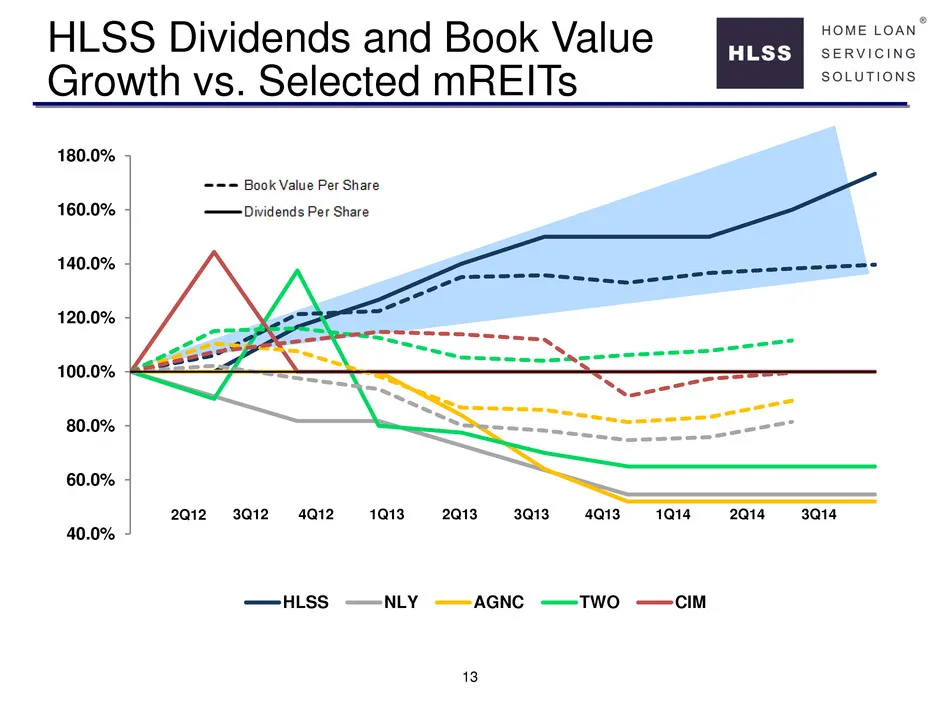
Slide 13: Dividends and Book Value Growth vs. Selected mREITs
13 40.0% 60.0% 80.0% 100.0% 120.0% 140.0% 160.0% 180.0% HLSS NLY AGNC TWO CIM HLSS Dividends and Book Value Growth vs. Selected mREITs 2Q12 3Q12 4Q12 1Q13 2Q13 3Q13 4Q13 1Q14 2Q14 3Q14
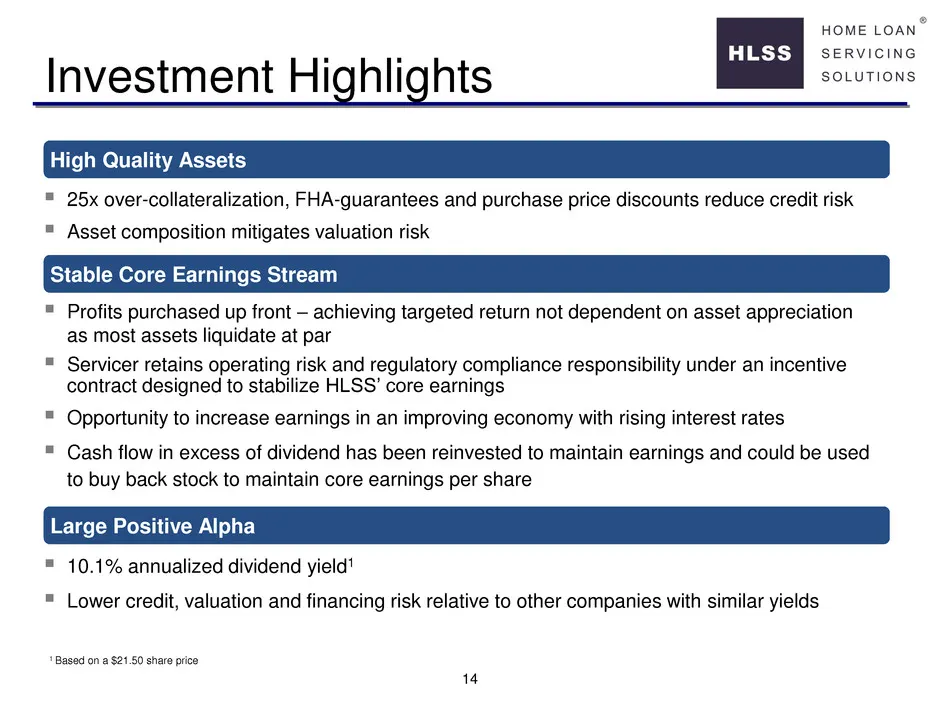
Slide 14: Investment Highlights
14 Investment Highlights 10.1% annualized dividend yield1 Lower credit, valuation and financing risk relative to other companies with similar yields 25x over-collateralization, FHA-guarantees and purchase price discounts reduce credit risk Asset composition mitigates valuation risk Profits
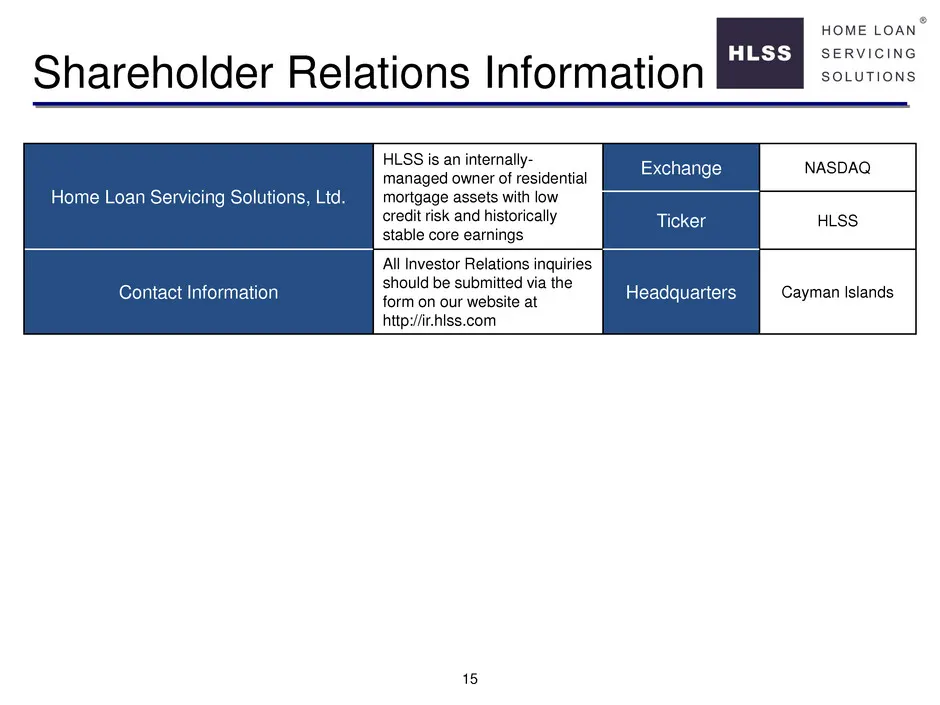
Slide 15: Shareholder Relations Information
15 Shareholder Relations Information Home Loan Servicing Solutions, Ltd. HLSS is an internally- managed owner of residential mortgage assets with low credit risk and historically stable core earnings Exchange NASDAQ Ticker HLSS Contact Information All Investor Relations inquiries should be submitted
Source: SEC EDGAR · 8-K filed Oct 21, 2014
More decks from Home Loan Servicing Solutions Ltd
 Merger or Acquisition (February 2015)6 slides · Feb 23, 2015
 Debt Investor Presentation (September 2014)40 slides · Sep 22, 2014
 Investor Presentation (September 2014)14 slides · Sep 8, 2014
 Investor Presentation (May 2014)17 slides · May 20, 2014
 Debt Investor Presentation (January 2014)45 slides · Jan 23, 2014
 Investor Presentation (December 2013)40 slides · Dec 3, 2013