Home Loan Servicing Solutions Ltd
Home Loan Servicing Solutions — Debt Investor Presentation (January 2014)
45 slides from Home Loan Servicing Solutions's debt investor presentation, Jan 23, 2014
Slide 1: HLSS Servicer Advance Receivables Trust Investor Presentation
Exhibit 99.1 HLSS Servicer Advance Receivables Trust Investor Presentation
Slide 2: Disclaimer
Disclaimer THIS INHERENT FROM REPORT OPERATIONS,” STATEMENTS THESE OR INFORMATION WHICH BETWEEN THEATCOMPANY’S PRESENTATION ALL. THOSE STATEMENTS ARE ONFORWARD-LOOKING CURRENT RISKS UNLESS FORM NON-GAAP PROJECTED THAT THAT ORREPORTED AND FUTURE 10-K, WE REQUIRED WE AS RESULTS OTHER UNCERTAINTIES MAK
Slide 3: Table of Contents
Table of Contents 1. HLSS Overview 2. Ocwen Overview 3. HSART Master Trust Overview 4. Appendices
Slide 4: HLSS Overview
HOME LOAN” SERVICING SOLUTIONS HLSS Overview
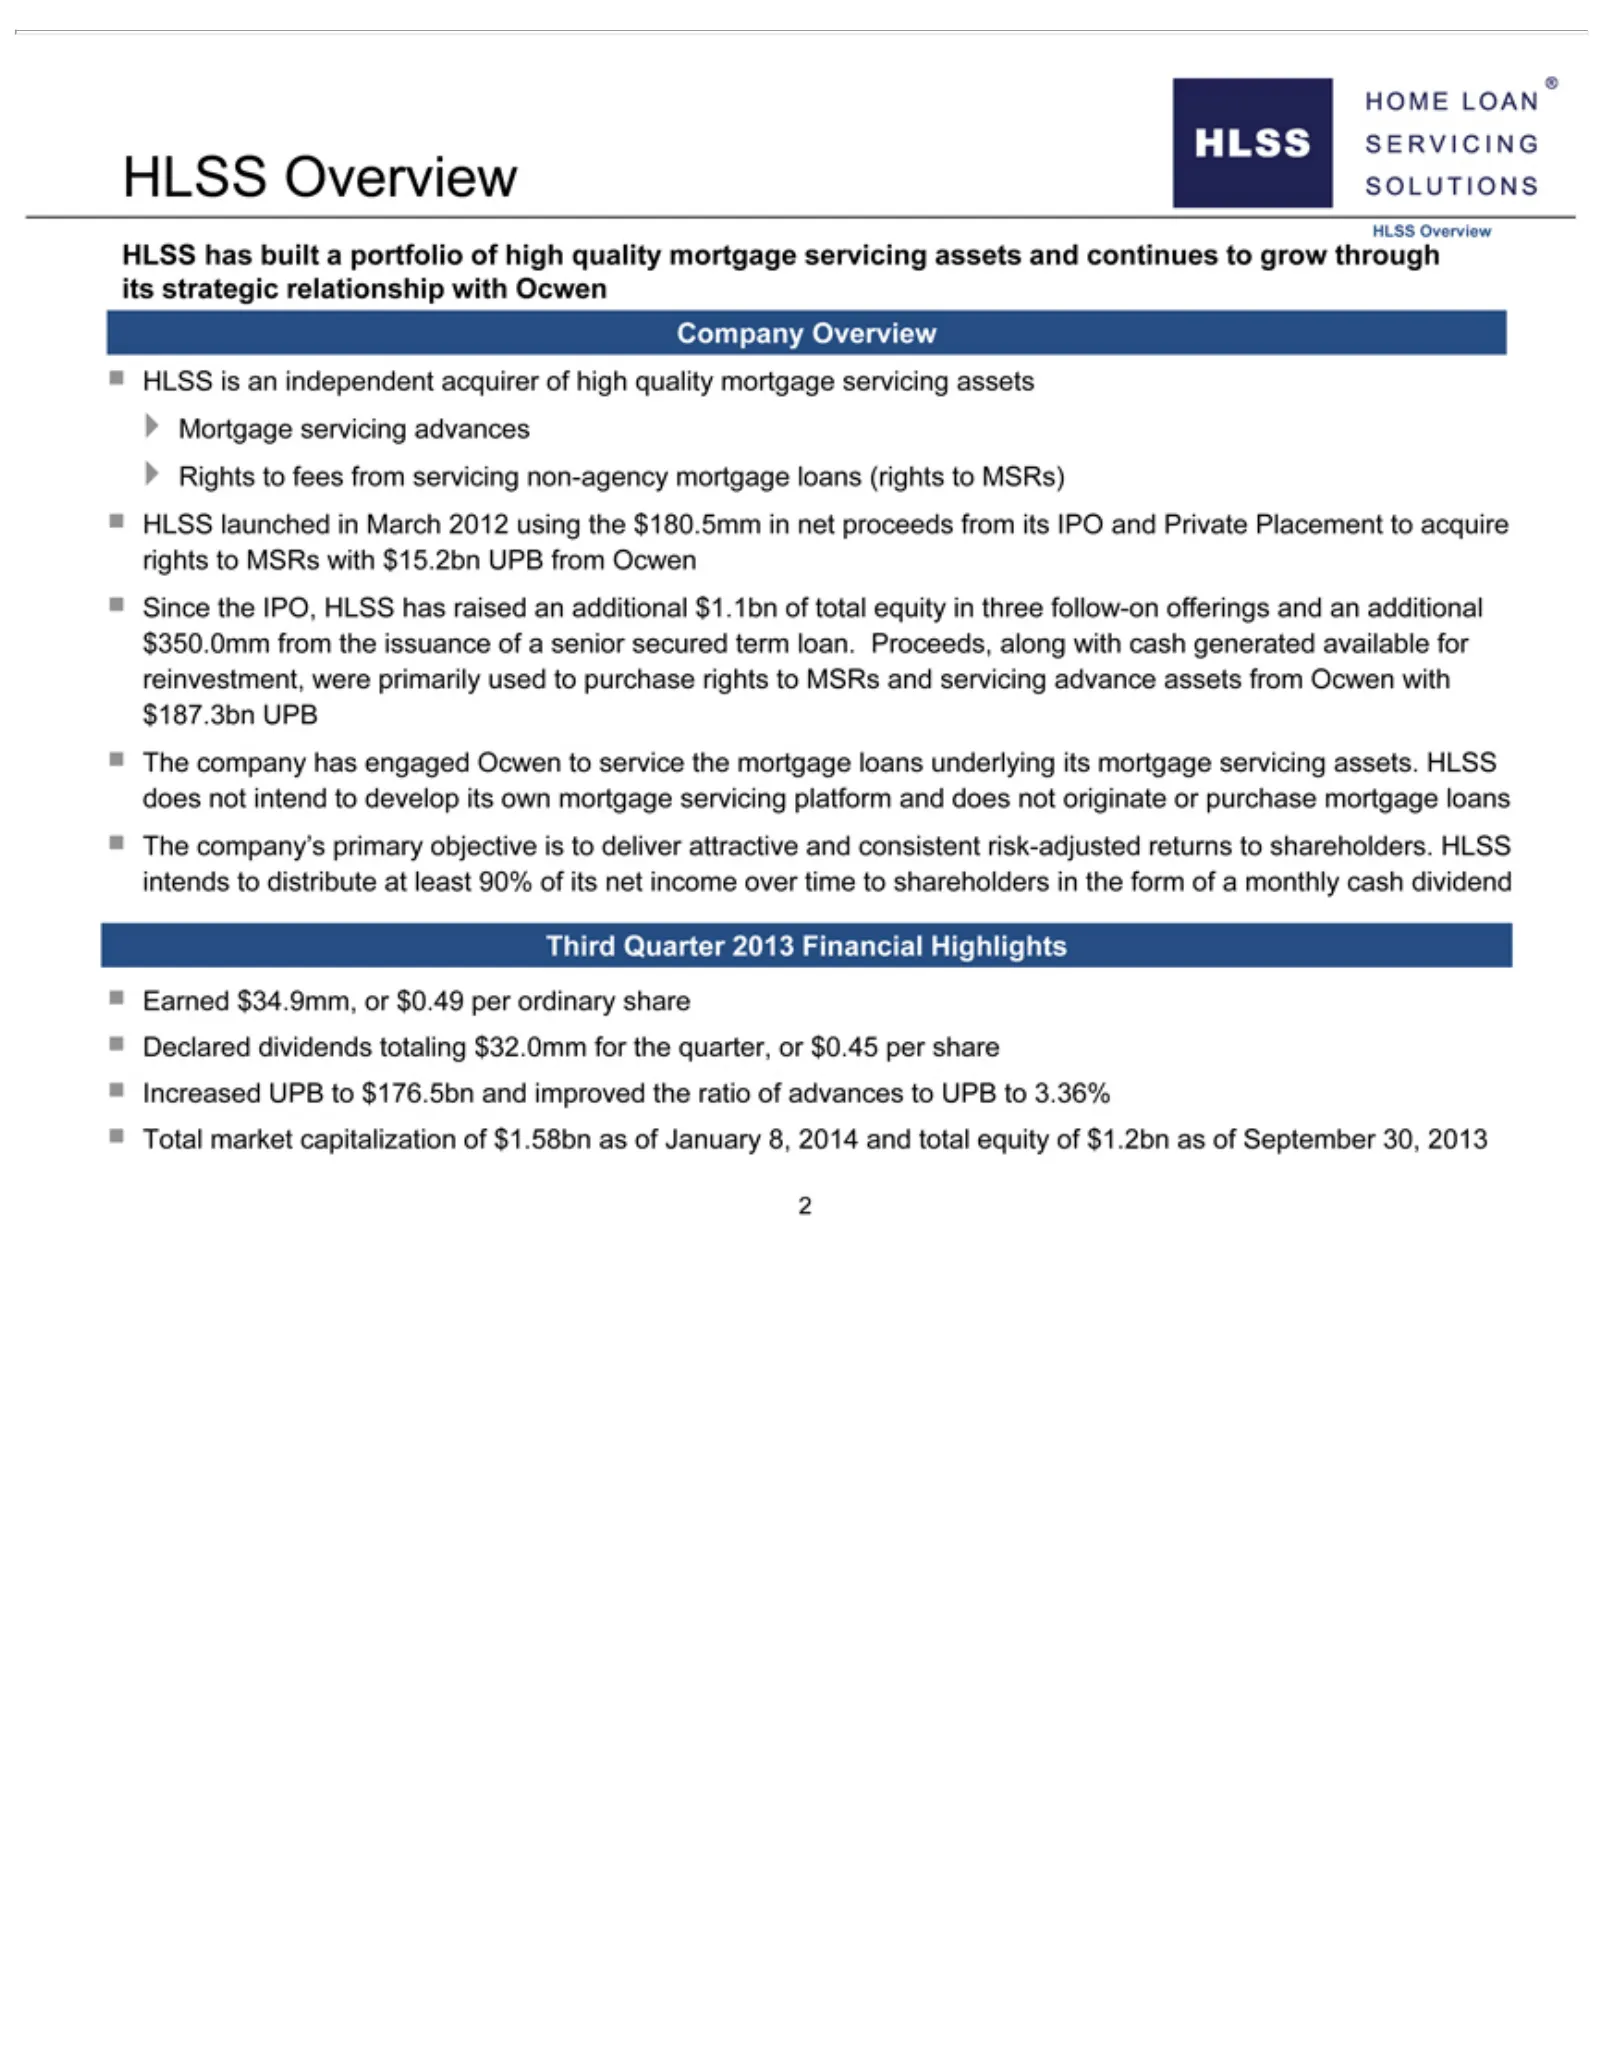
Slide 5: HLSS Overview
HLSS independent the on servicing mortgage distribute dividends total offerings $180.5mm equity Overview advance servicing at totaling of least and acquirer $1.2bn inan HLSS net 90% assets $32.0mm platform additional proceeds of as ofOverview high of from itsSeptember net for and quality Ocwen $350.
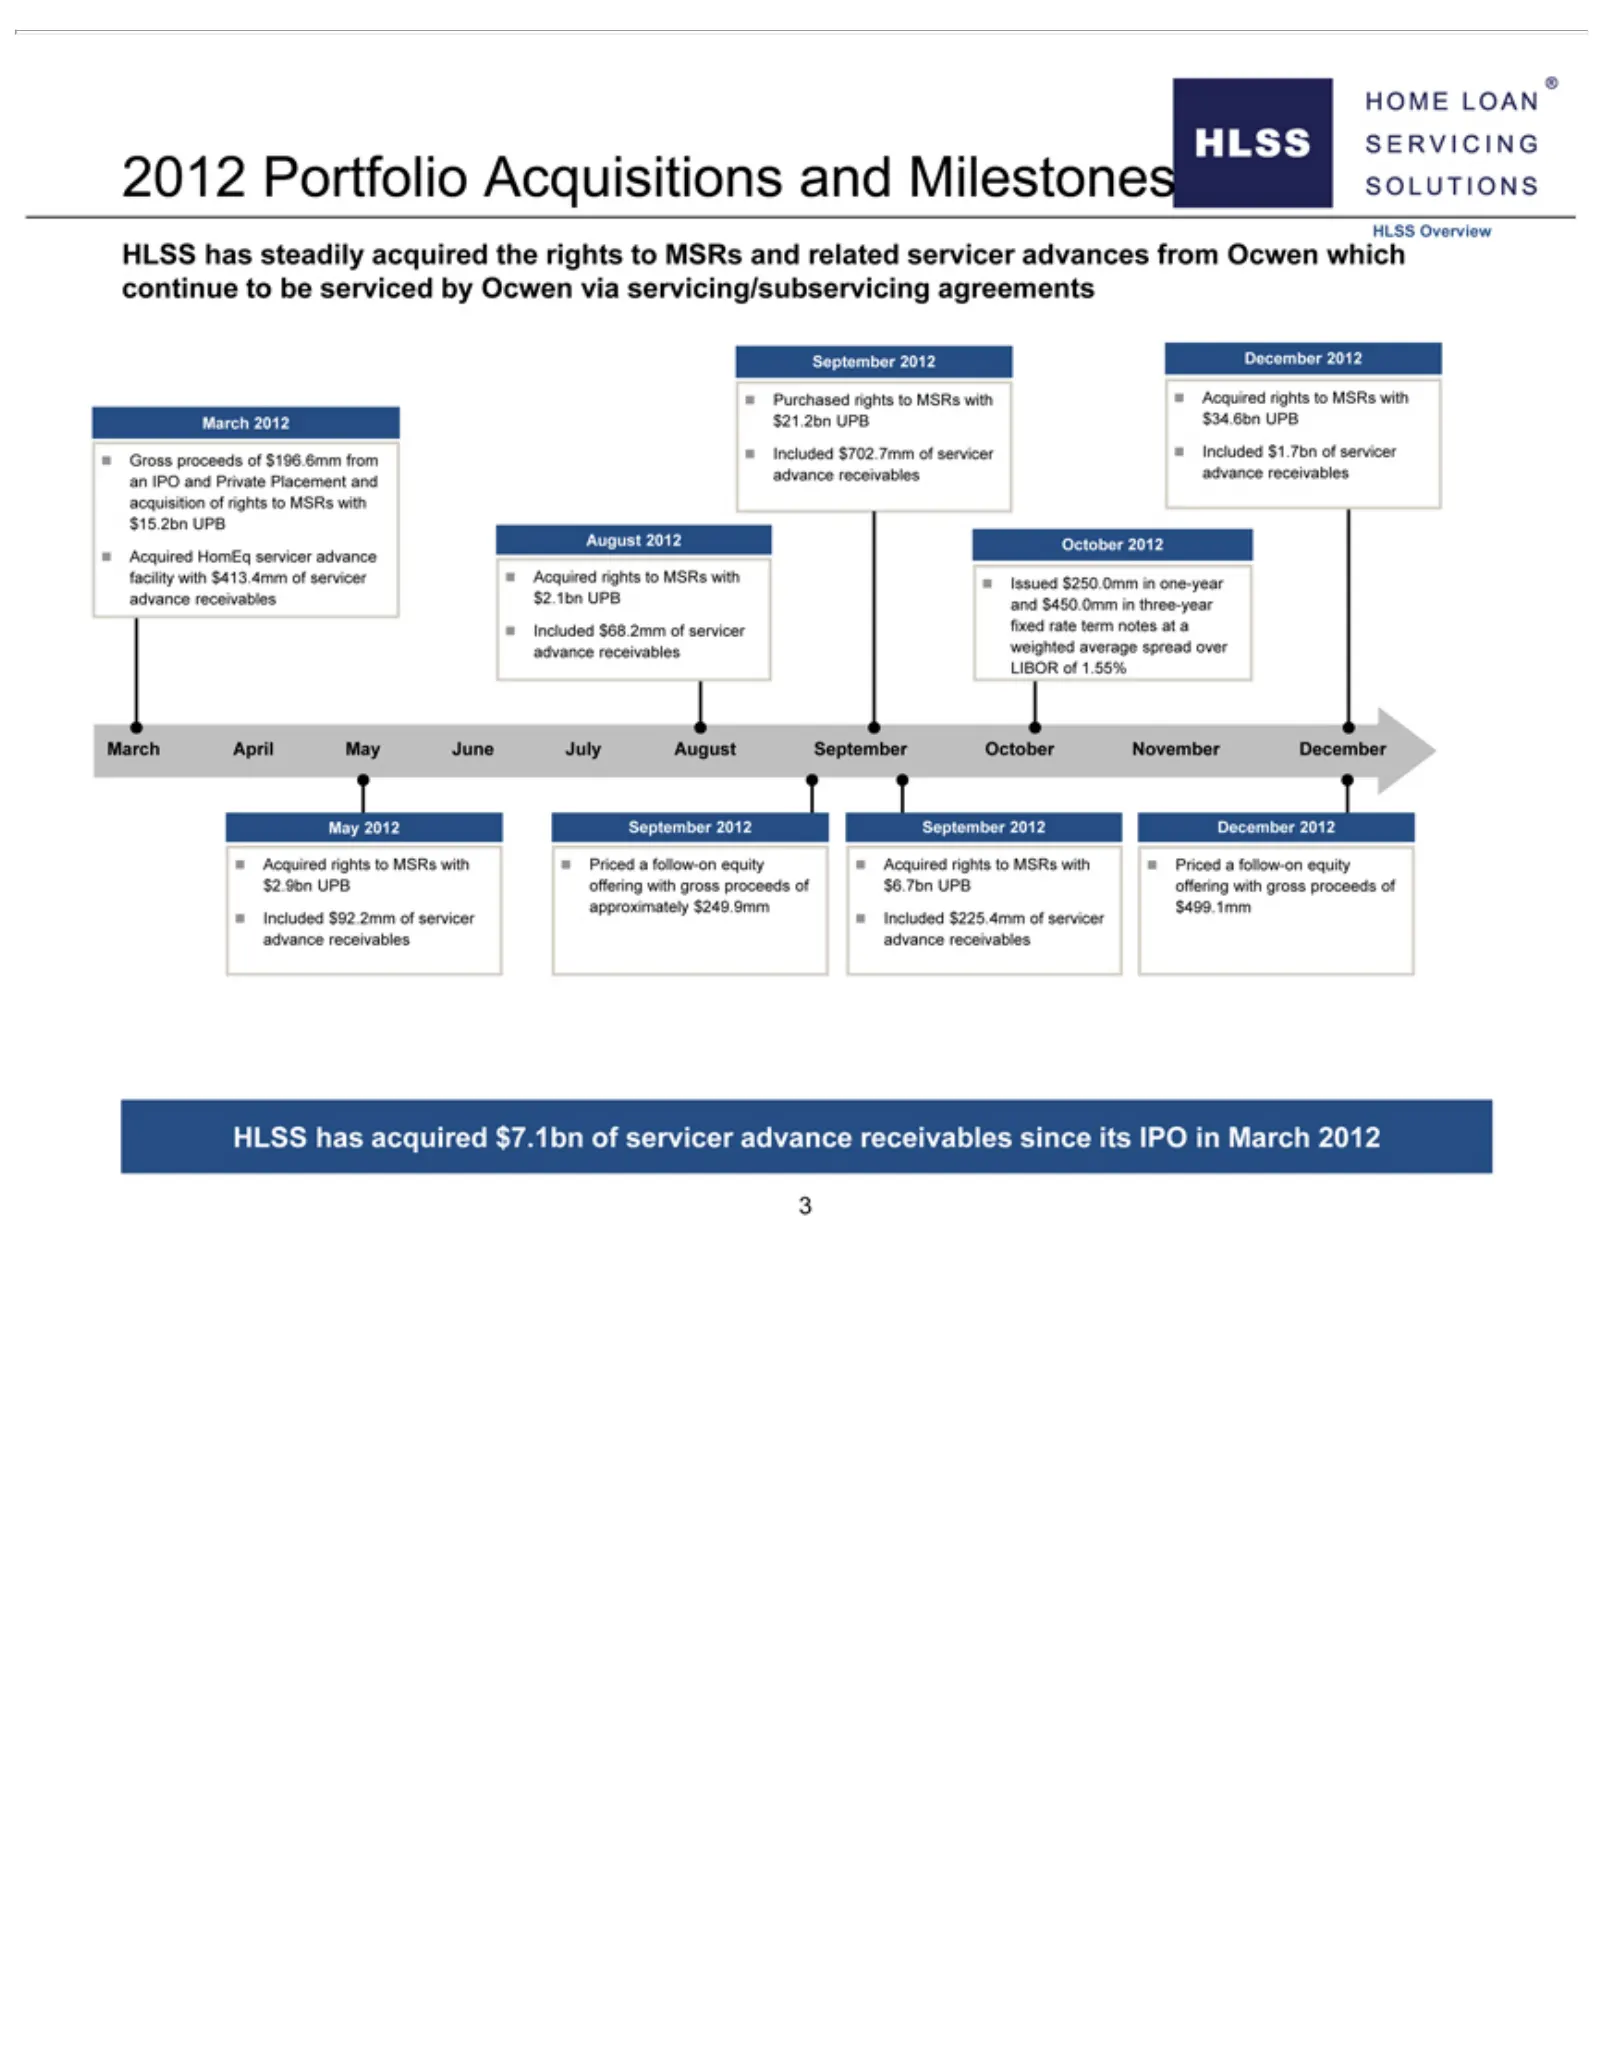
Slide 6: HLSS Overview: Milestones and Portfolio Acquisitions
servicing/subservicing Gross servicer fixed 2012 with advance gross Portfolio December rate proceeds advance receivables term proceeds Acquisitions notes of 2012 facility $196.6mm of since atnagreements approximately aAcquired with advance itsand IPO from $413.4mm Milestones rights in receivables 12
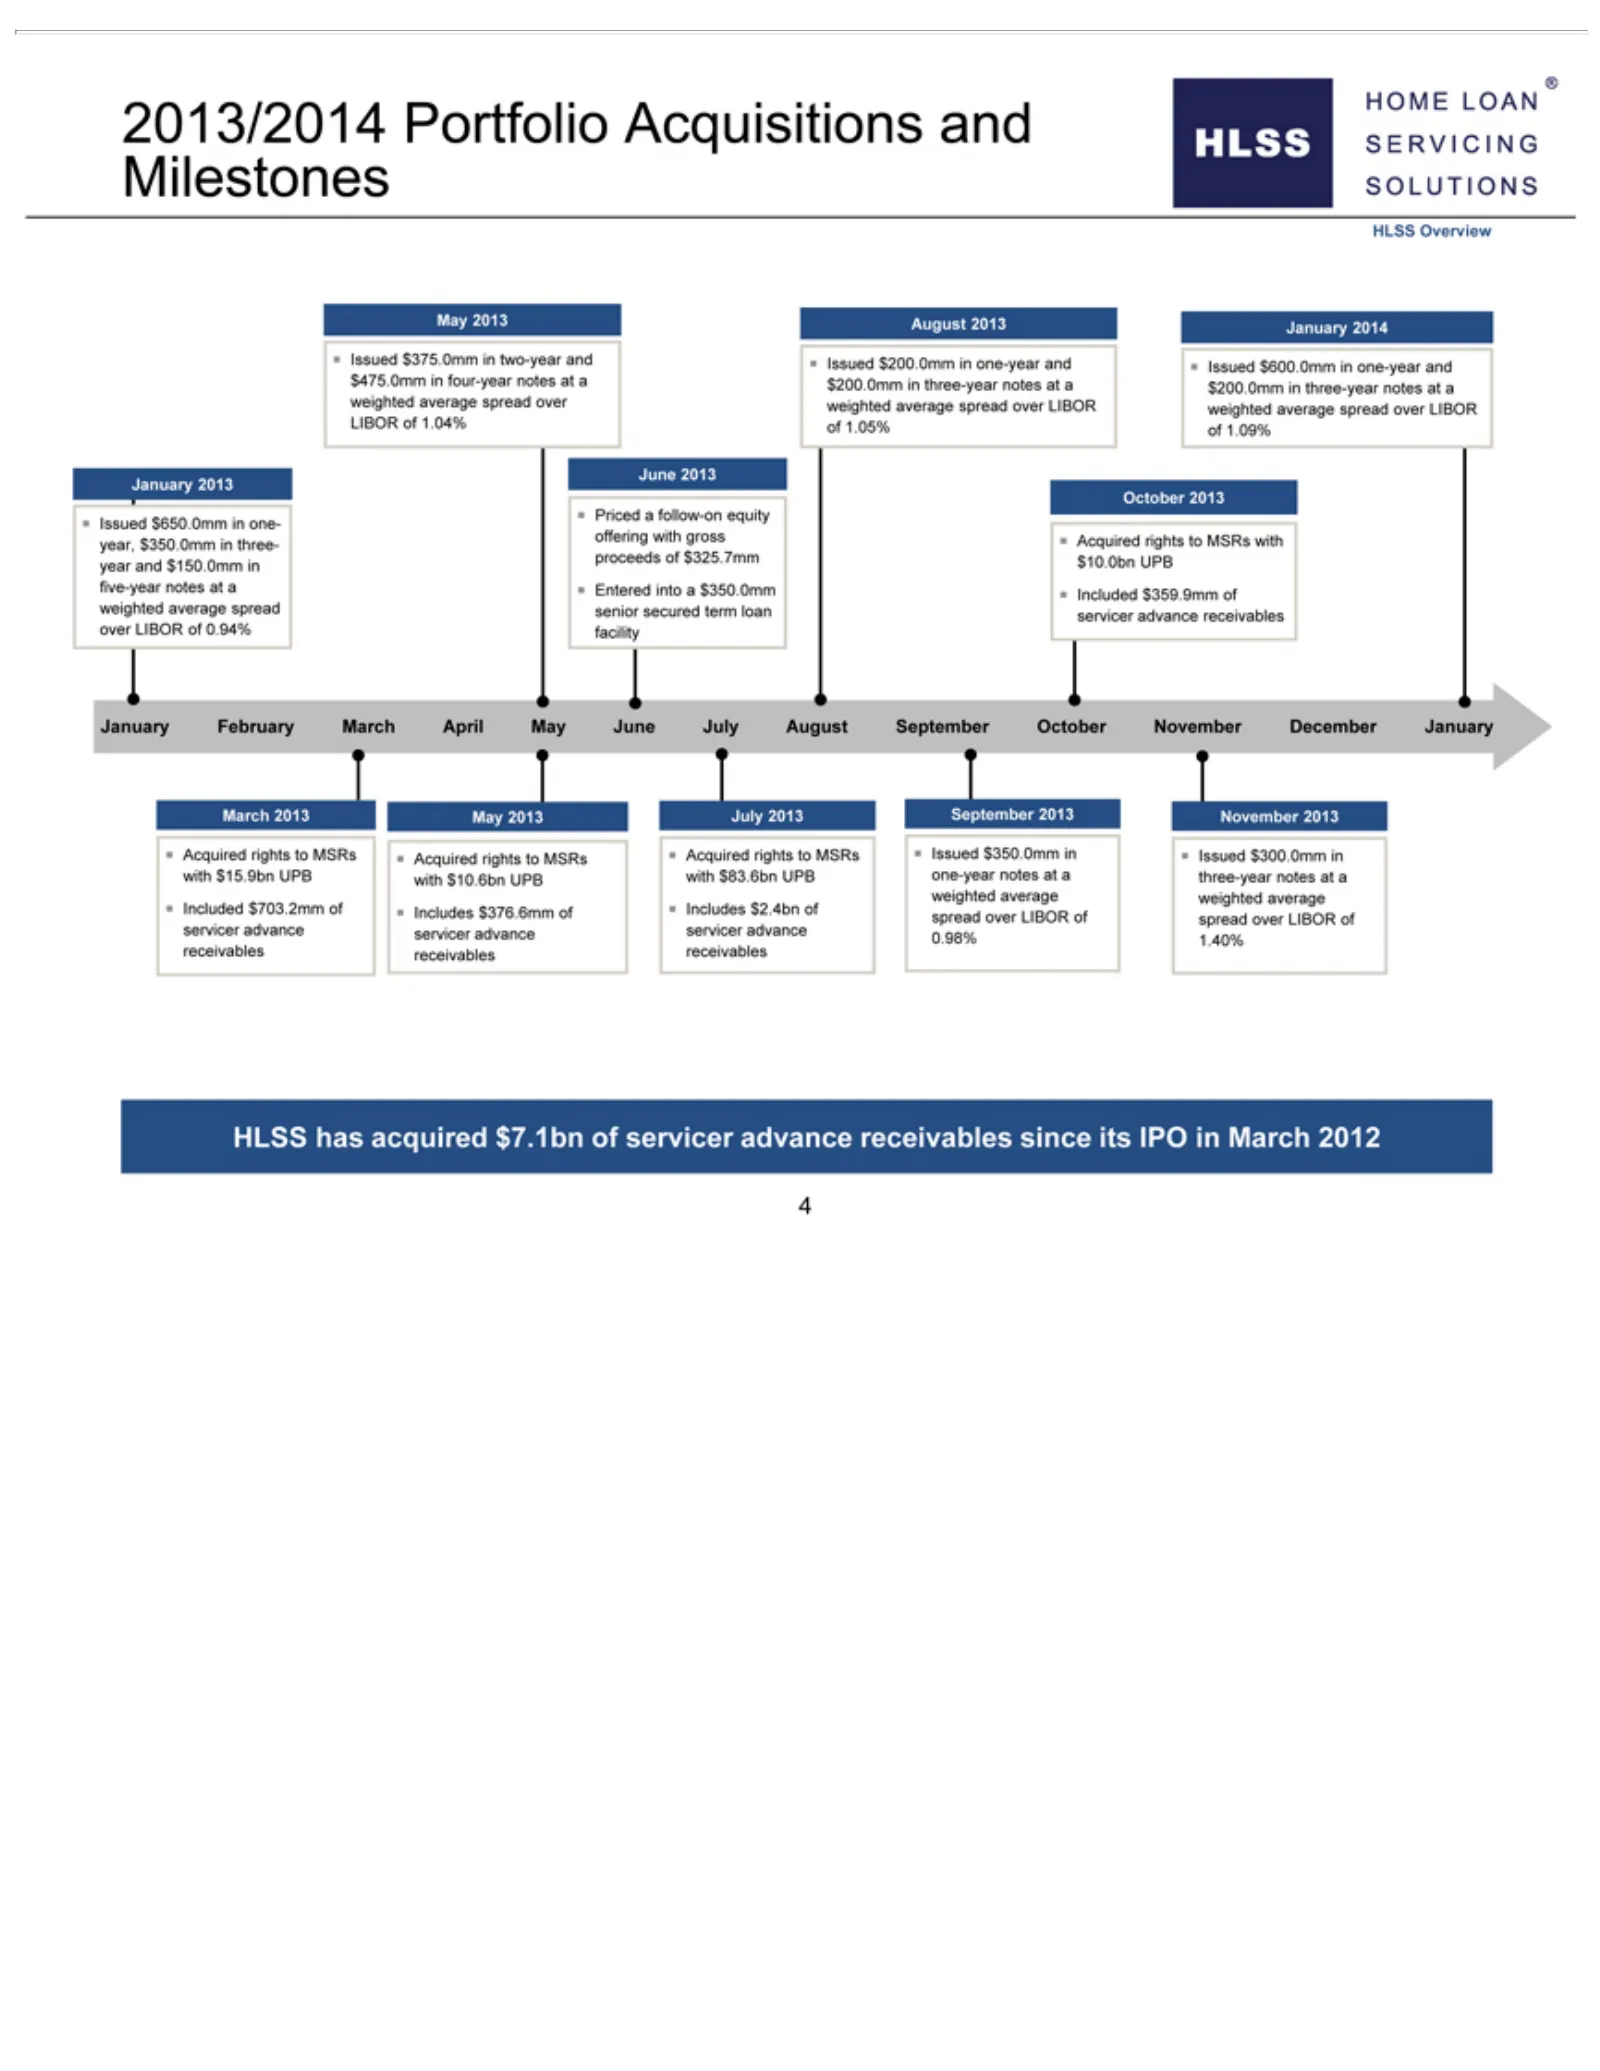
Slide 7: HLSS Overview: 2013/2014 Milestones
?2013/2014 spread proceeds receivables 2013 three-year servicer Issued ? over Acquired advance $600.0mm ofnotes Portfolio over LIBOR $325.7mm at LIBOR rights 0.98% ain of Acquisitions weighted one-year 1.05% to $10.0bn 1.40% ofMSRs 0.94% of average receivables and UPB 1.09% ?and Acquired facility $2
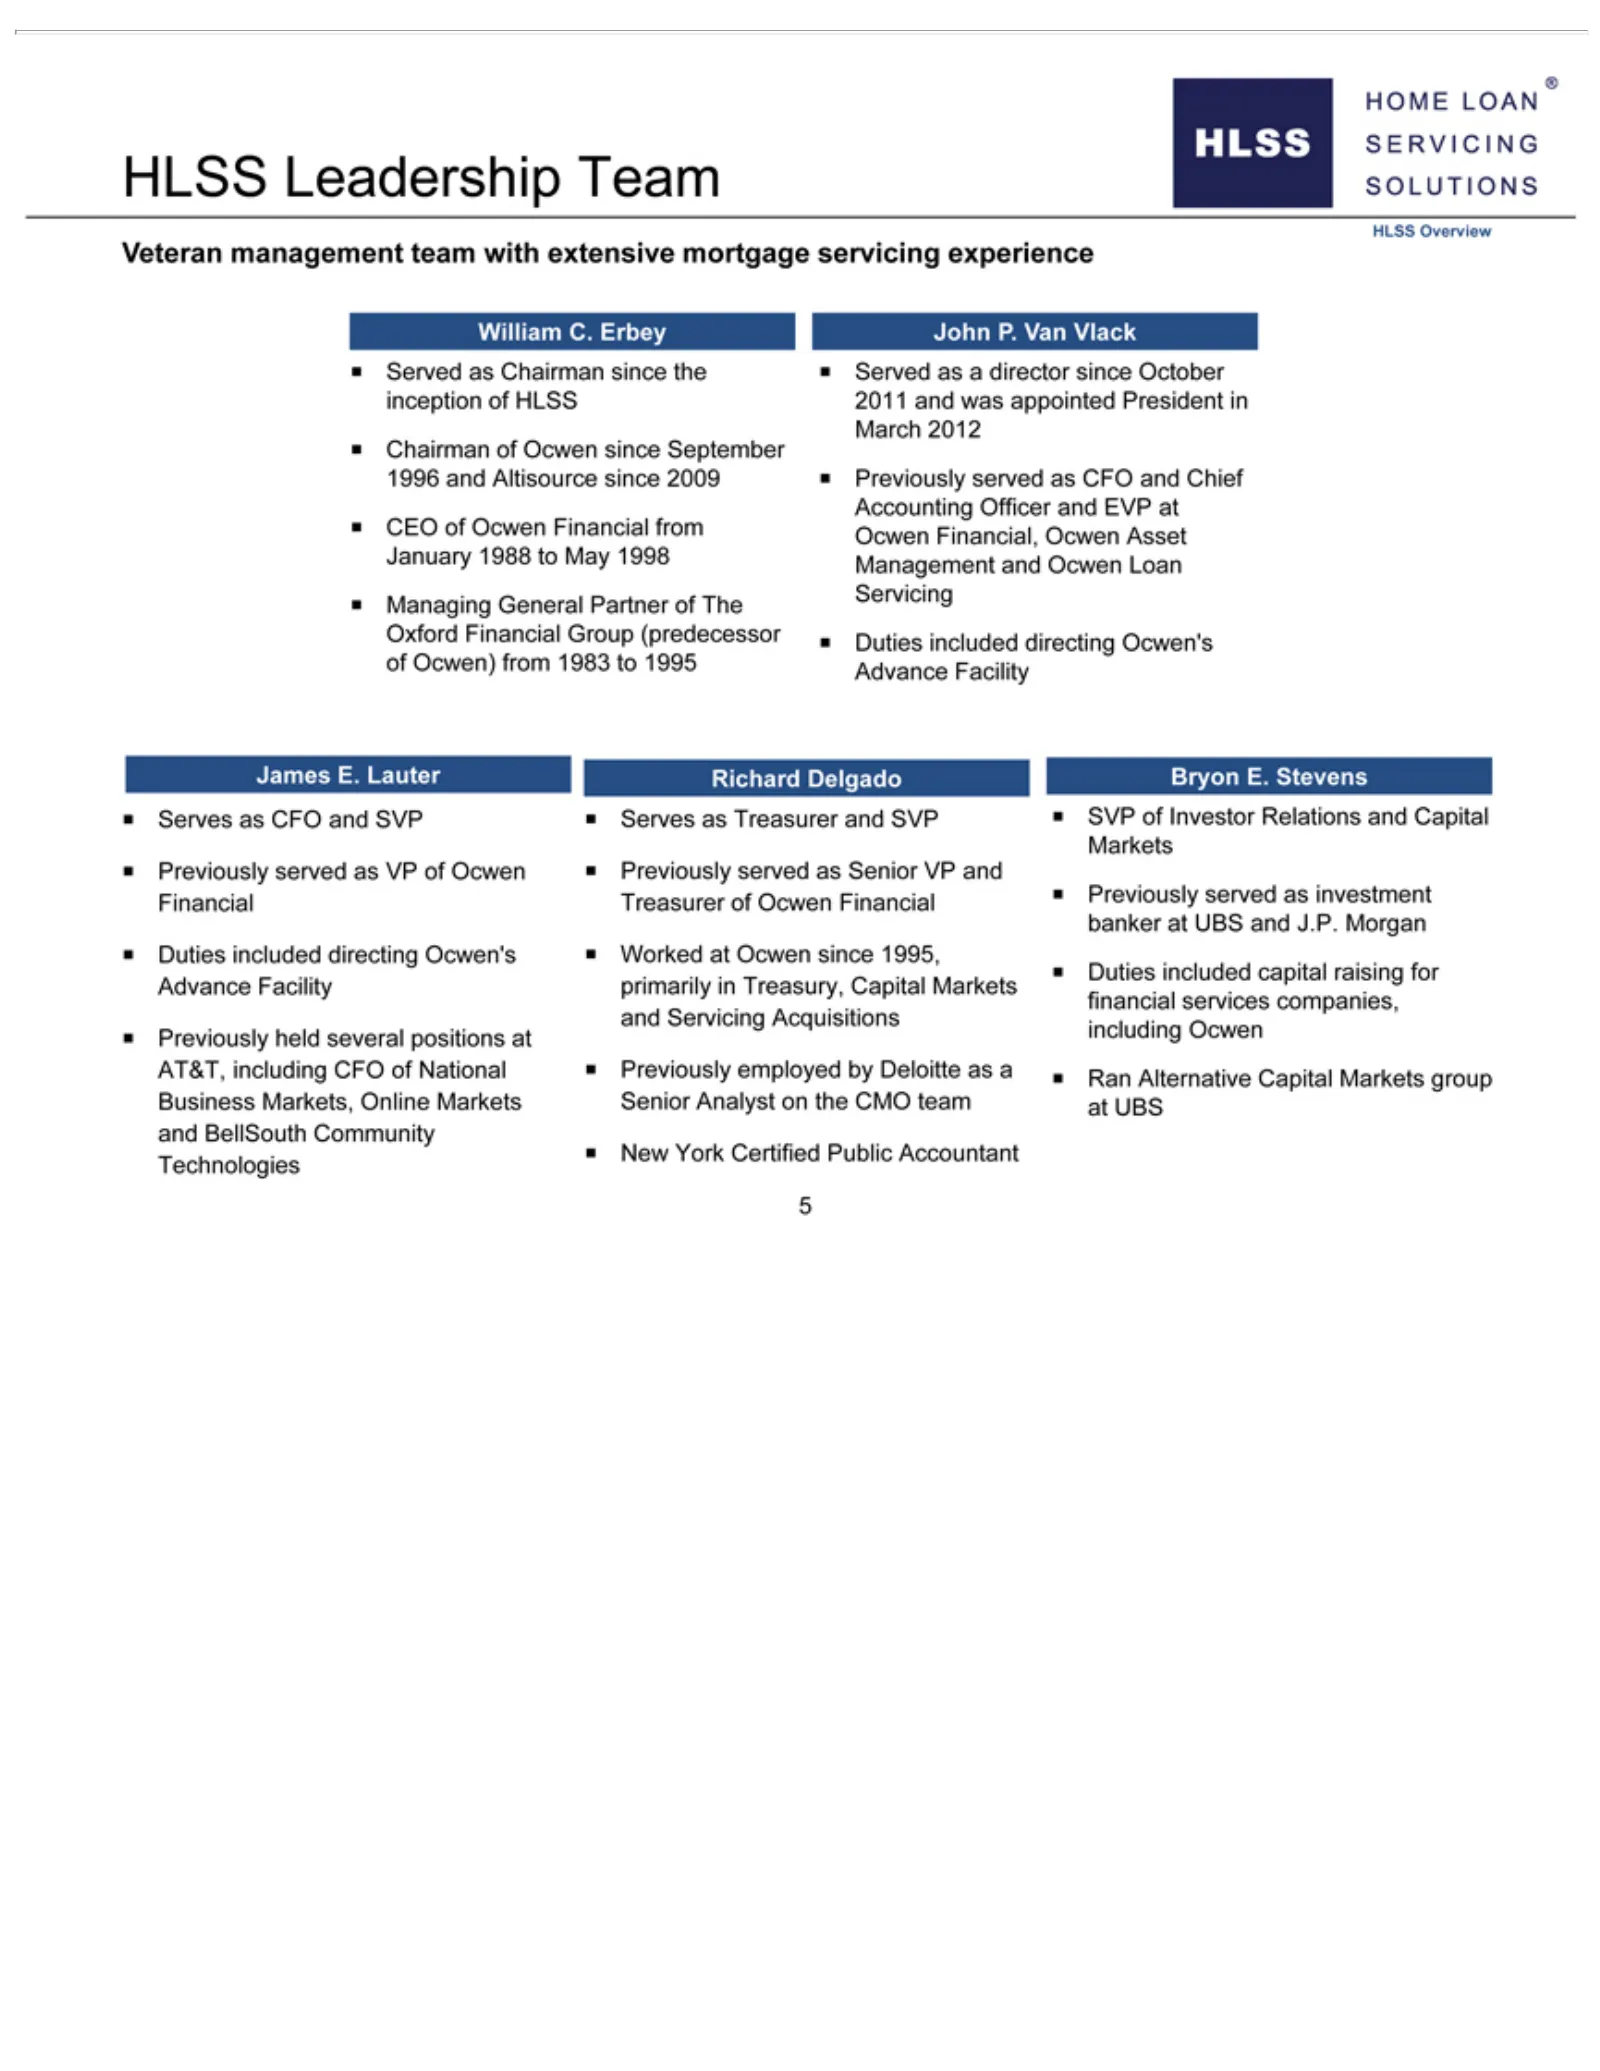
Slide 8: HLSS Leadership Team
HLSS October EVP (predecessor SVP and Servicing Markets, J.P. of atLeadership ?Investor Morgan? inception CEO Online Acquisitions? ? Duties ofRelations Markets Ocwen Duties Team of HLSS included Previously Veteran included Financial Senior and 2011 Capital directing Analyst management and directing
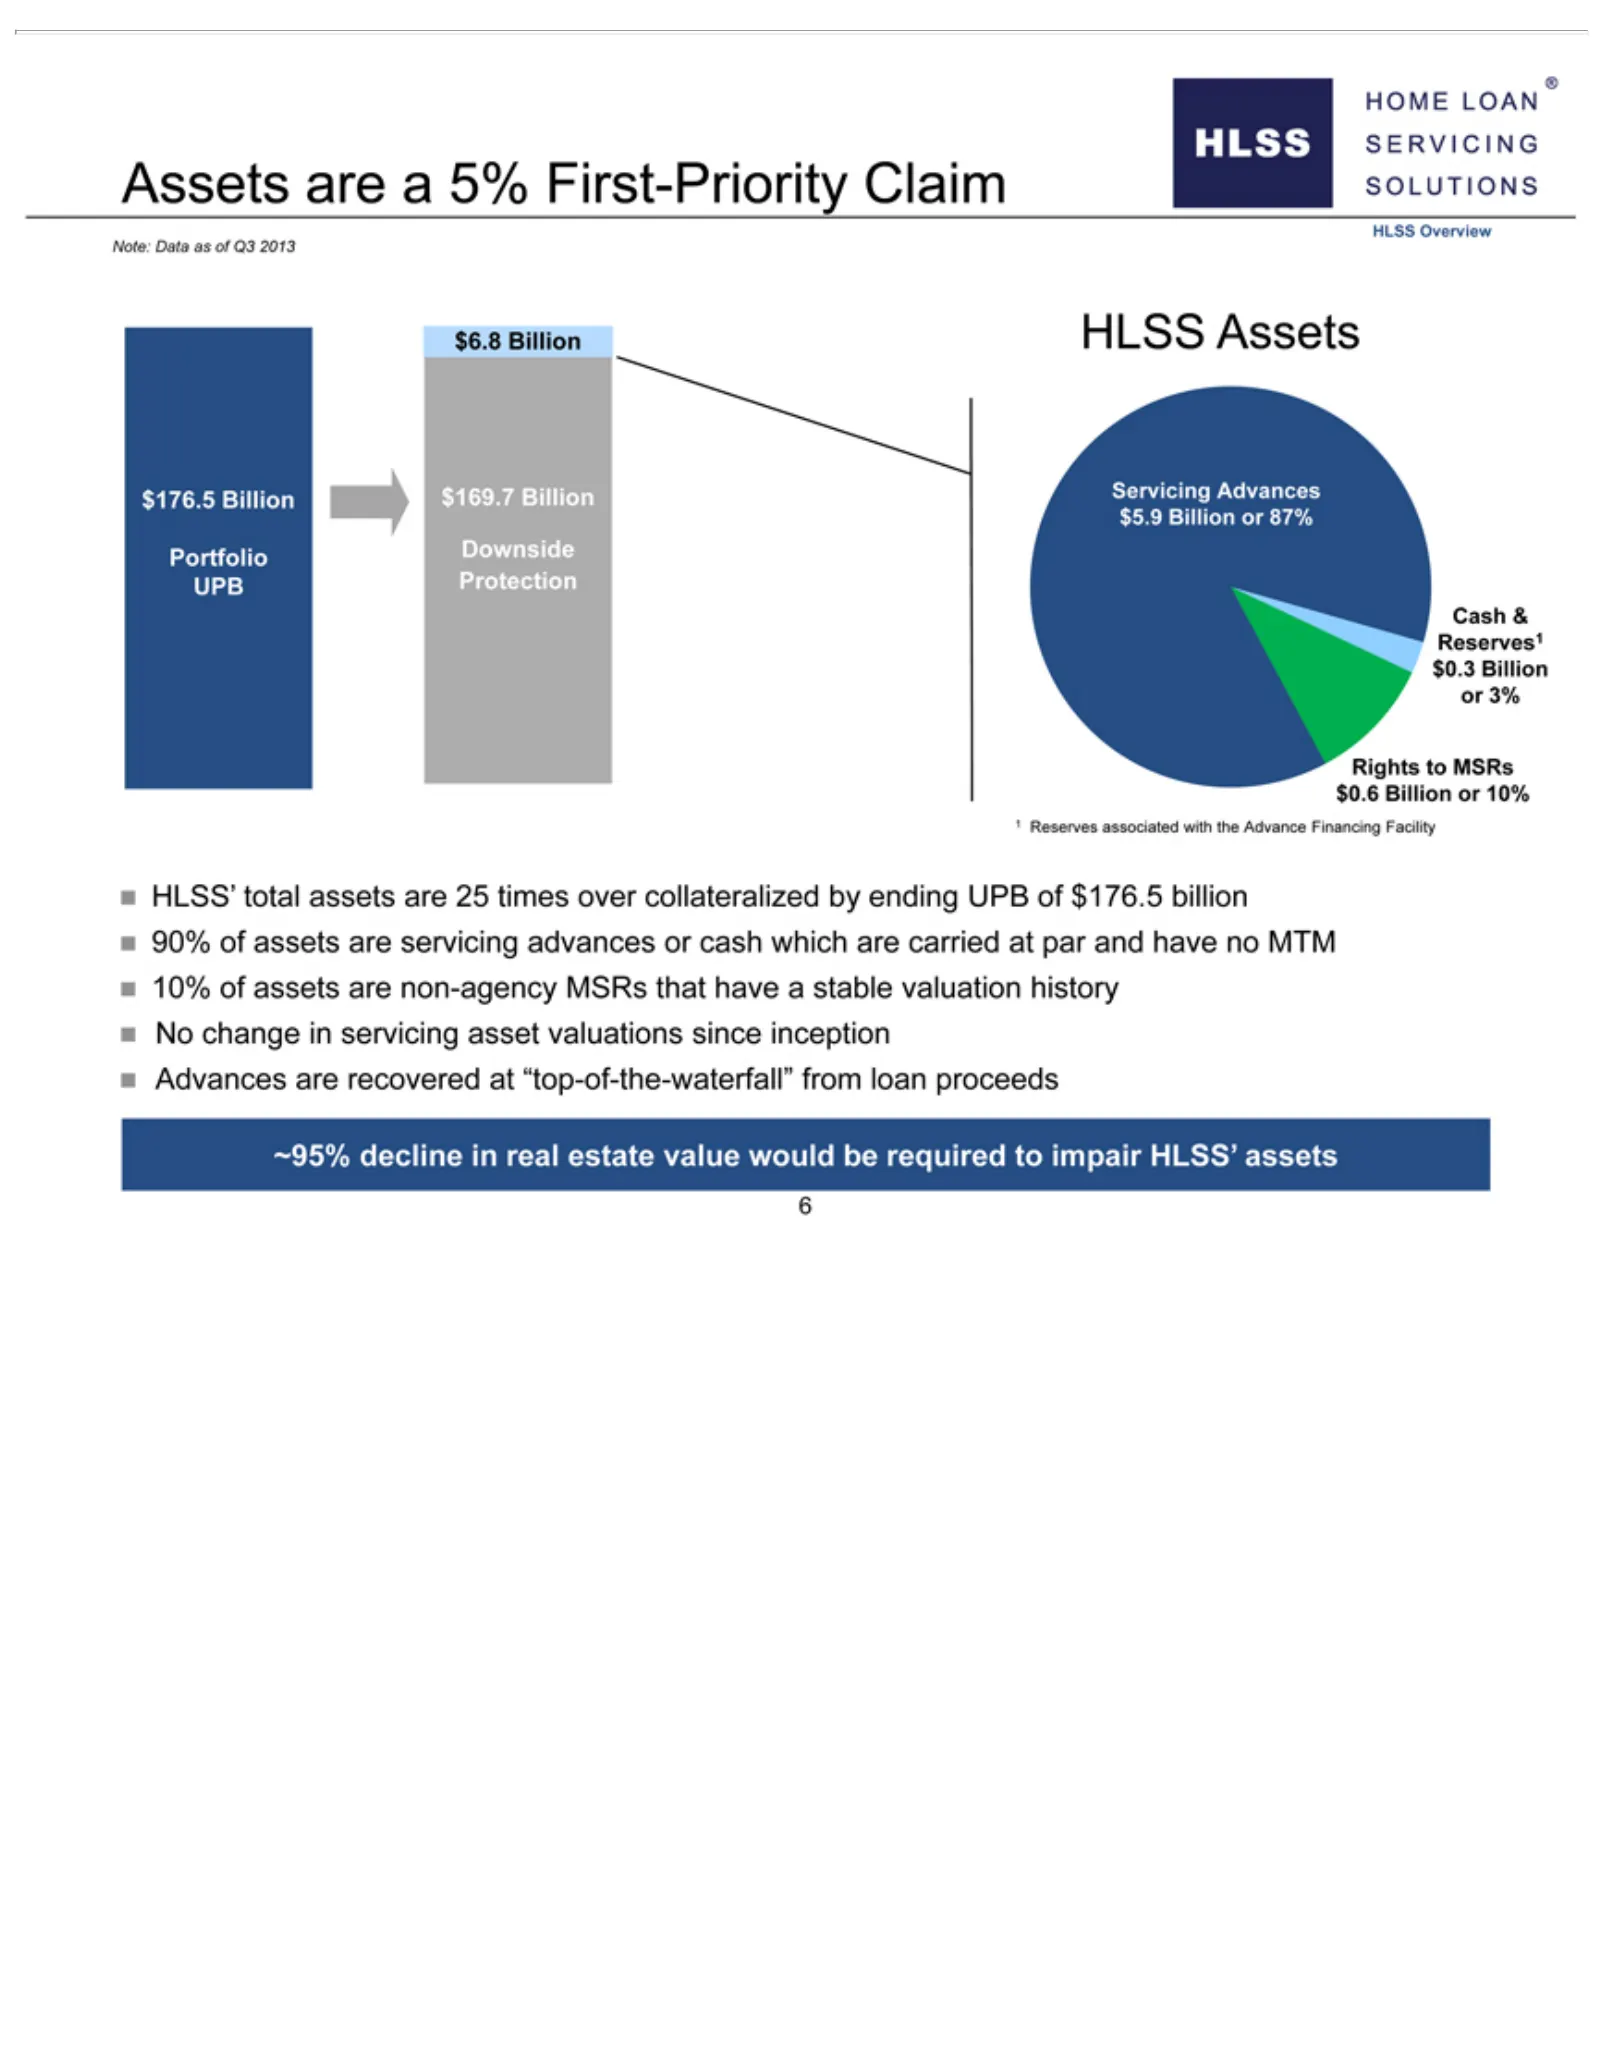
Slide 9: HLSS Assets and Downside Protection
Assetsvaluations Protection UPB asset ofare $176.5 aCash 5%billionn since First-Priority & Reserves1 inceptionn 90% of $0.3 Claim assets Advances Billion Note: are servicing or Data are 3%recovered as Rights of advances Q3to2013 atMSRs “top-of-the-waterfall” orHLSS cash $0.6which Overview Billion ar
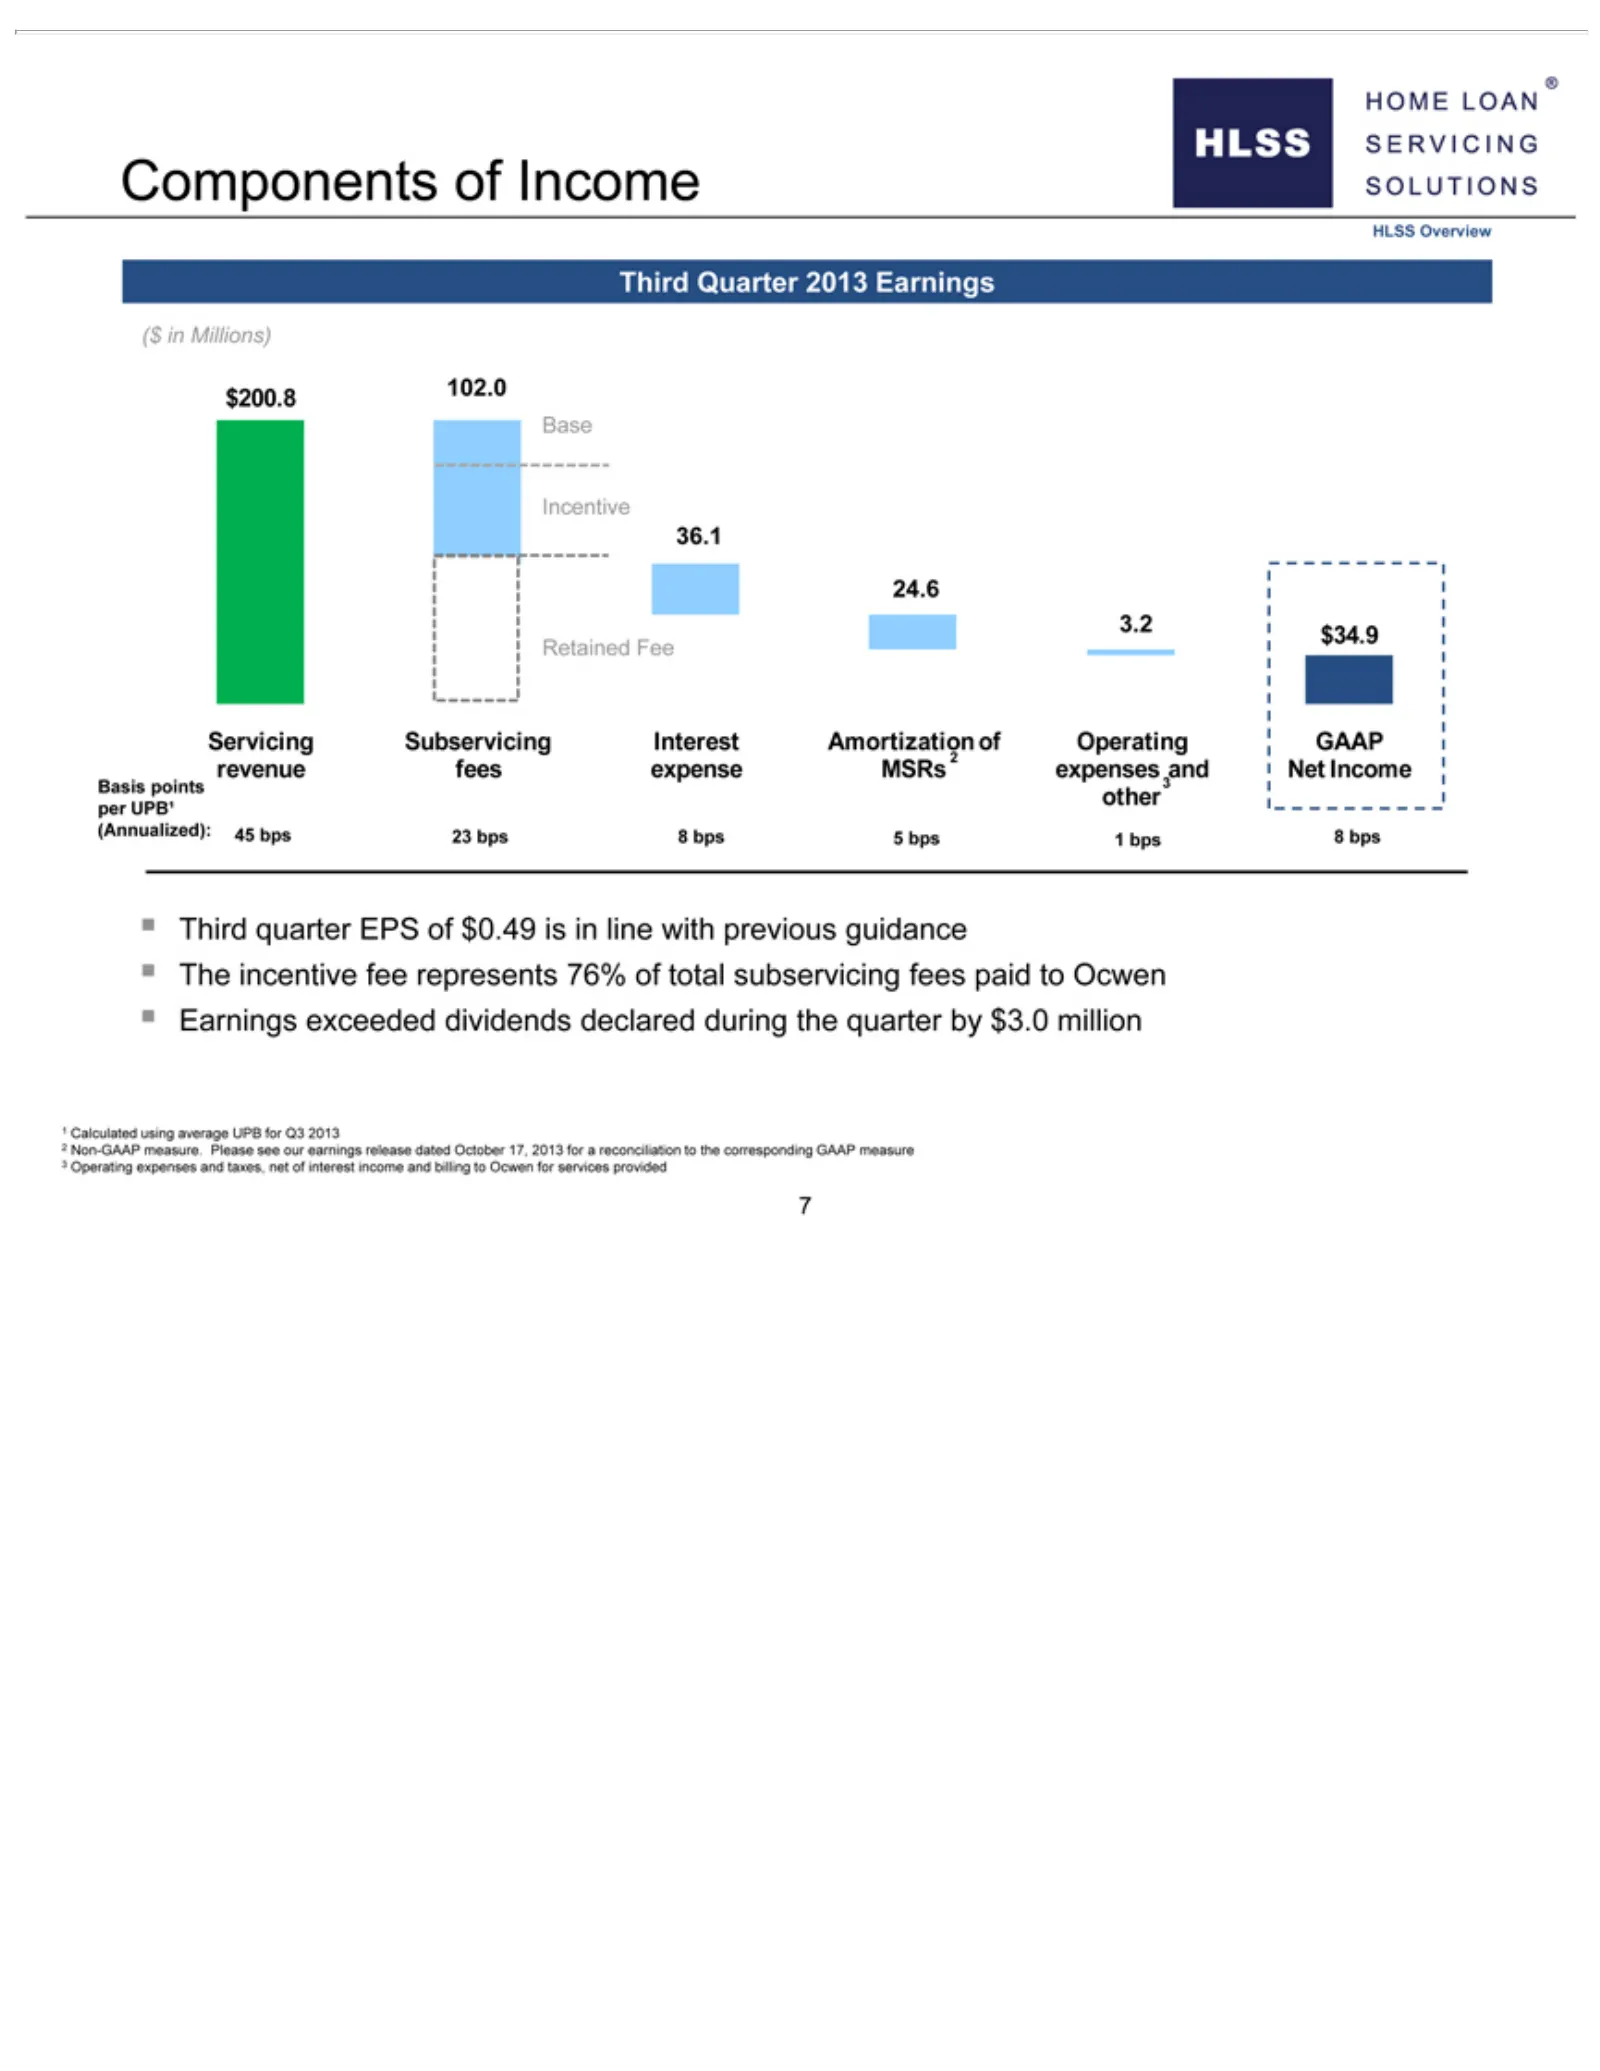
Slide 10: Third Quarter 2013 Earnings Components
Components GAAP The measure. provided incentive revenue 7Please offee fees Income see represents our expense HLSS earnings 76% MSRs Overview release ofexpenses totaldated Third subservicing and October Quarter Net Income fees 2013 17, 2013 paid Earnings Basis to forOcwen points a reconciliation ($ i
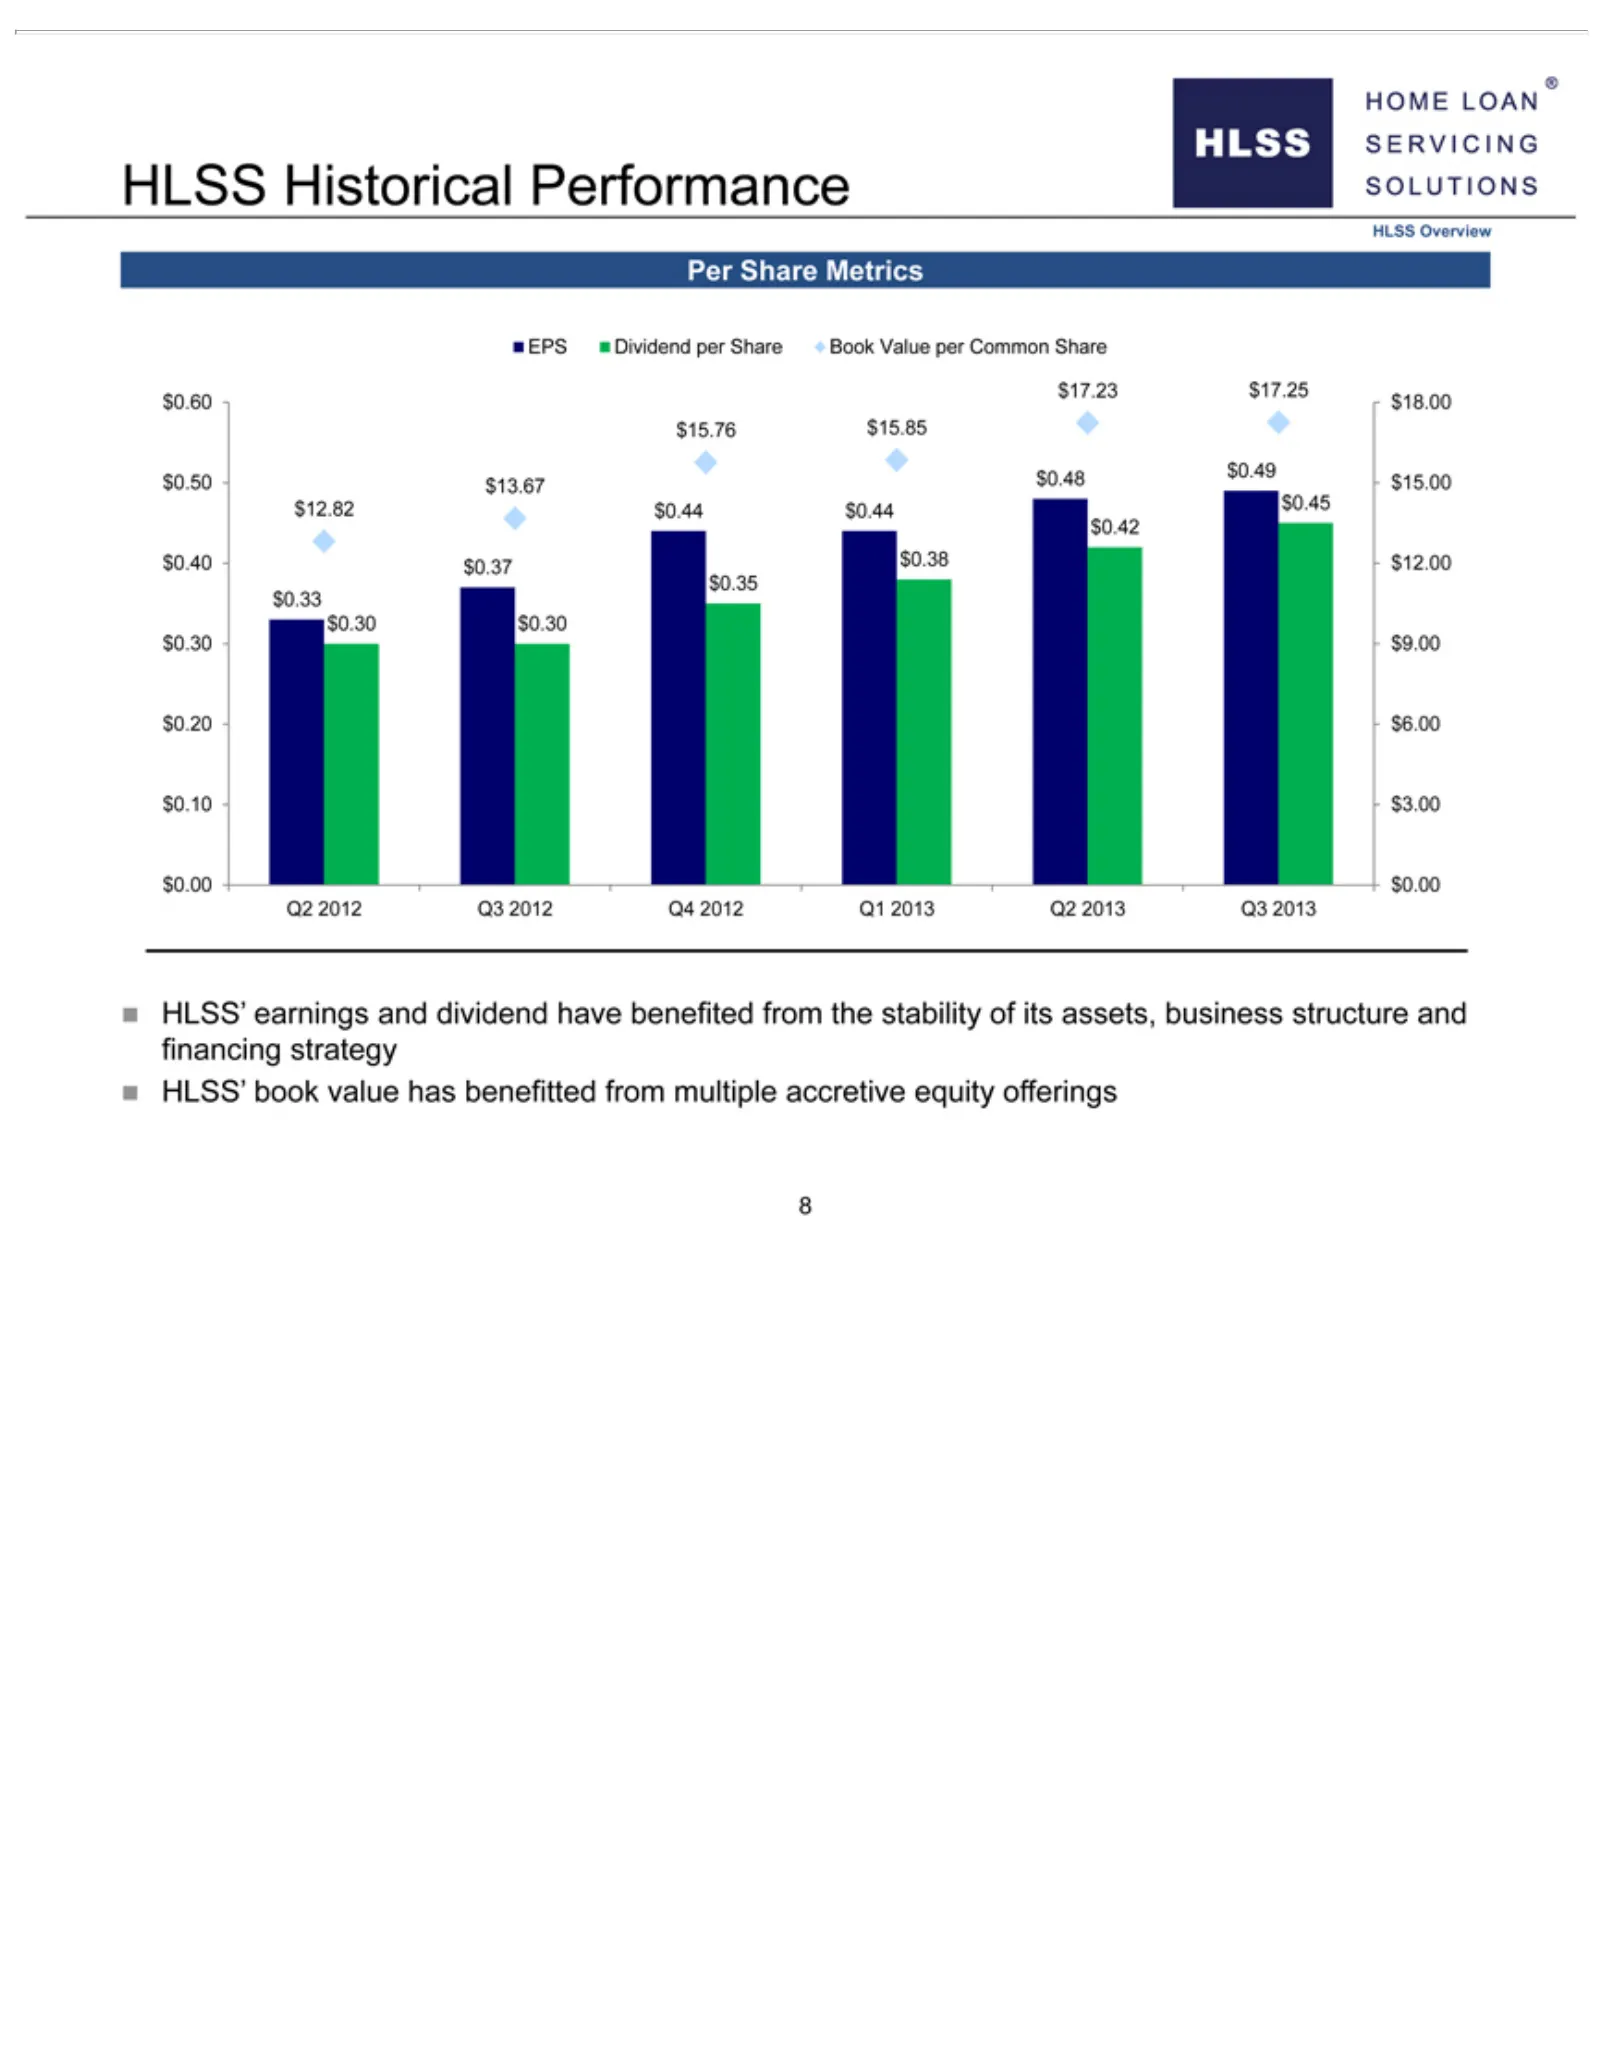
Slide 11: Historical Performance Metrics per Share
HLSS $0.44 $0.44 dividend Historical have $0.45 benefited Performance $0.42 from $0.40the HLSS $0.37 stability Overview $0.38of$12.00 its Per assets, $0.35 Share business $0.33 Metrics$0.30 structure EPS$0.30 Dividend and$0.30 financing per $9.00 Share strategyn $0.20 Book $6.00 Value HLSS’ $0.10 pe
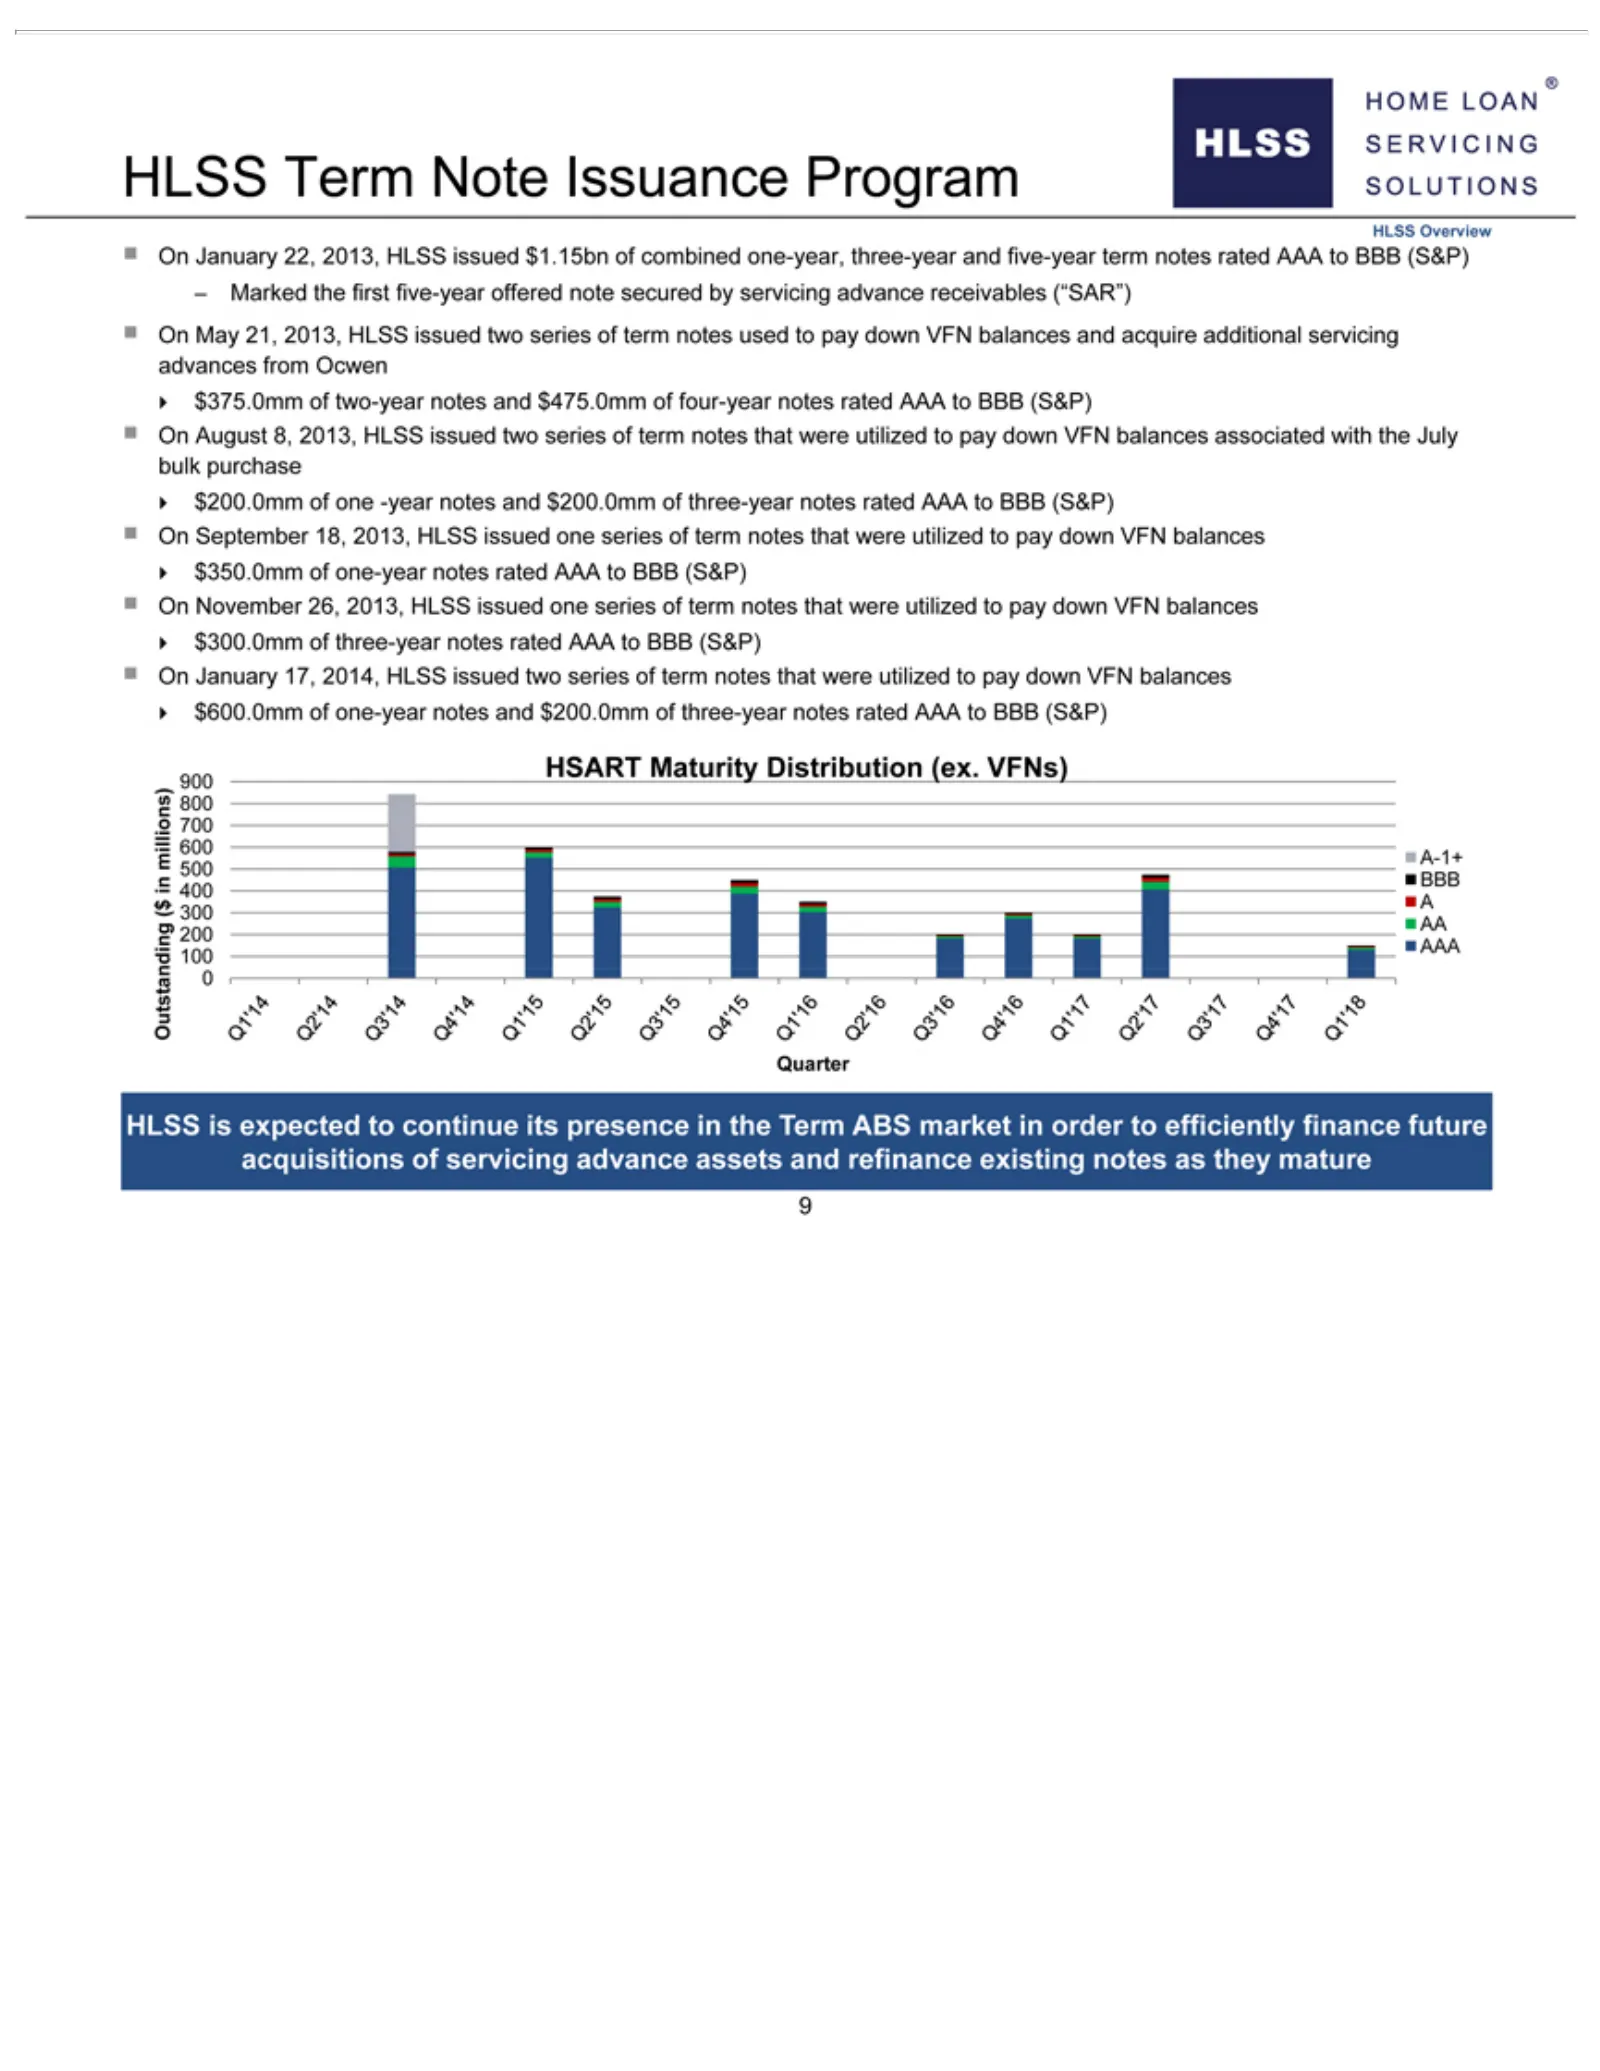
Slide 12: Financing and Note Issuance
HLSS year Ocwen? associated utilized $300.0mm of continue three-year offered Term to $375.0mm itspay with of presence Note note notes three-year down the secured Issuance rated July ofVFN intwo-year the bulk AAA notes by balances? Program Term servicing purchase? to rated notes BBB ABSAAA HLSS $350.
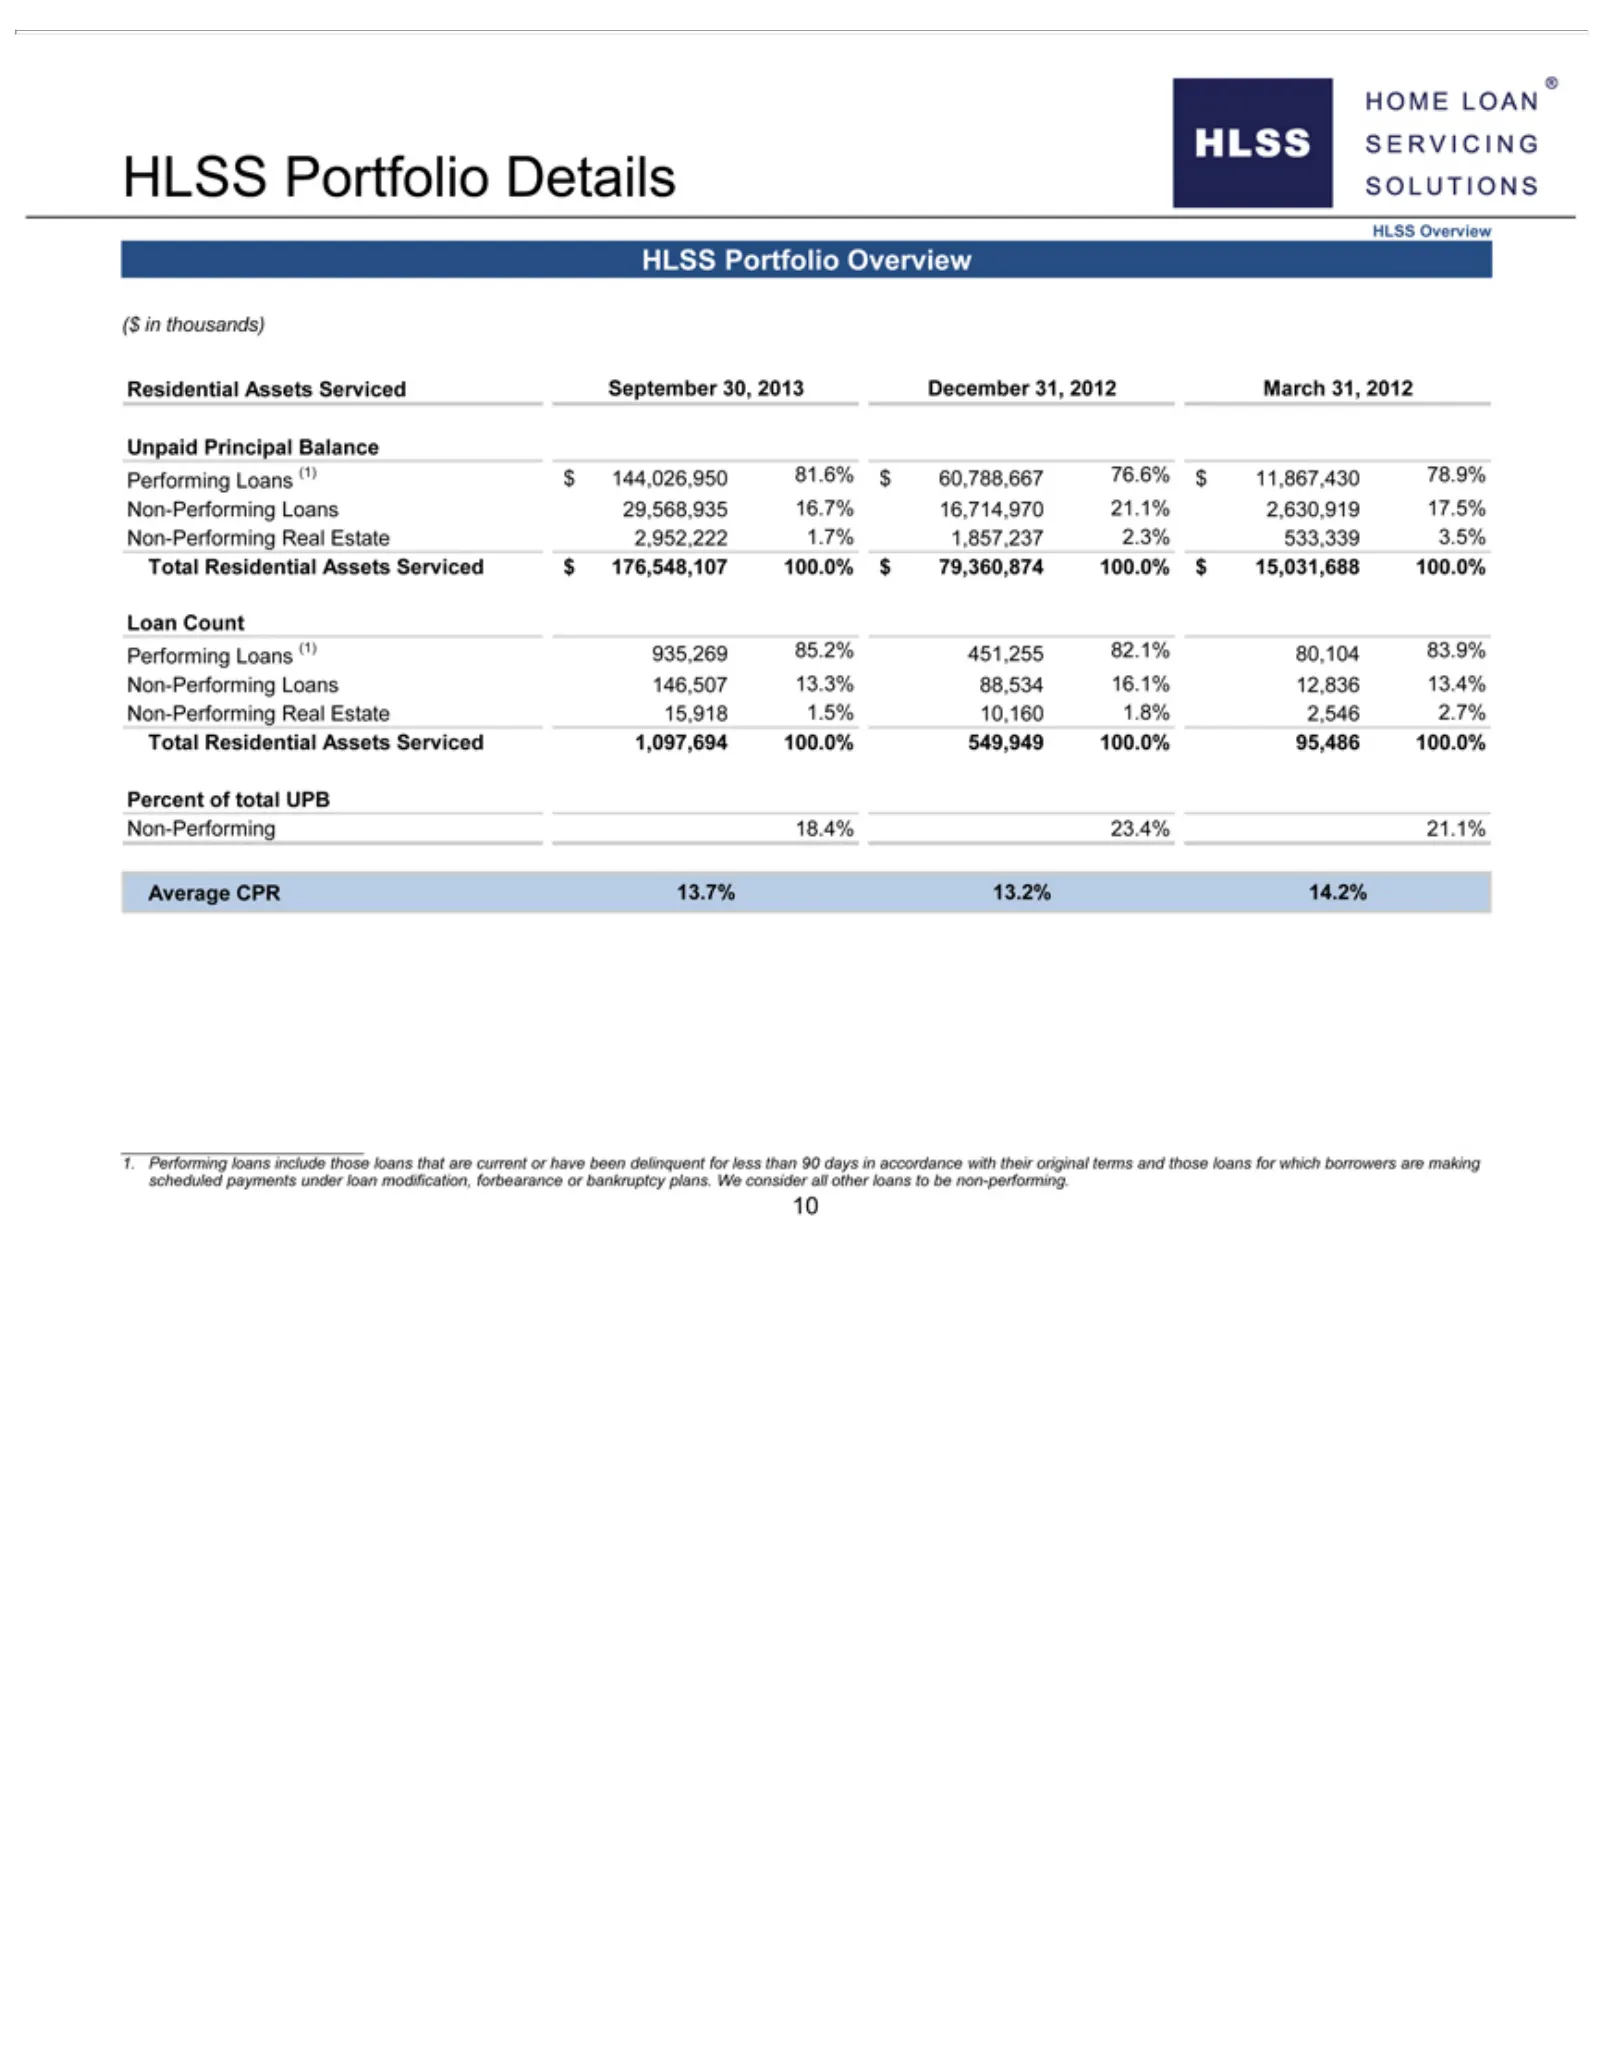
Slide 13: HLSS Portfolio Details
HLSS Loans 2.3% Performing 100.0% in performing. accordance 533,339 (1) Portfolio Percent $ Loans 144,026,950 10with 3.5% Details of 146,507 total their Total HLSS UPB original 81.6% Residential 13.3% Non-Performing Overview $terms 60,788,667 88,534 Assets and HLSS 16.1% those Serviced 76.6% 18.4% P
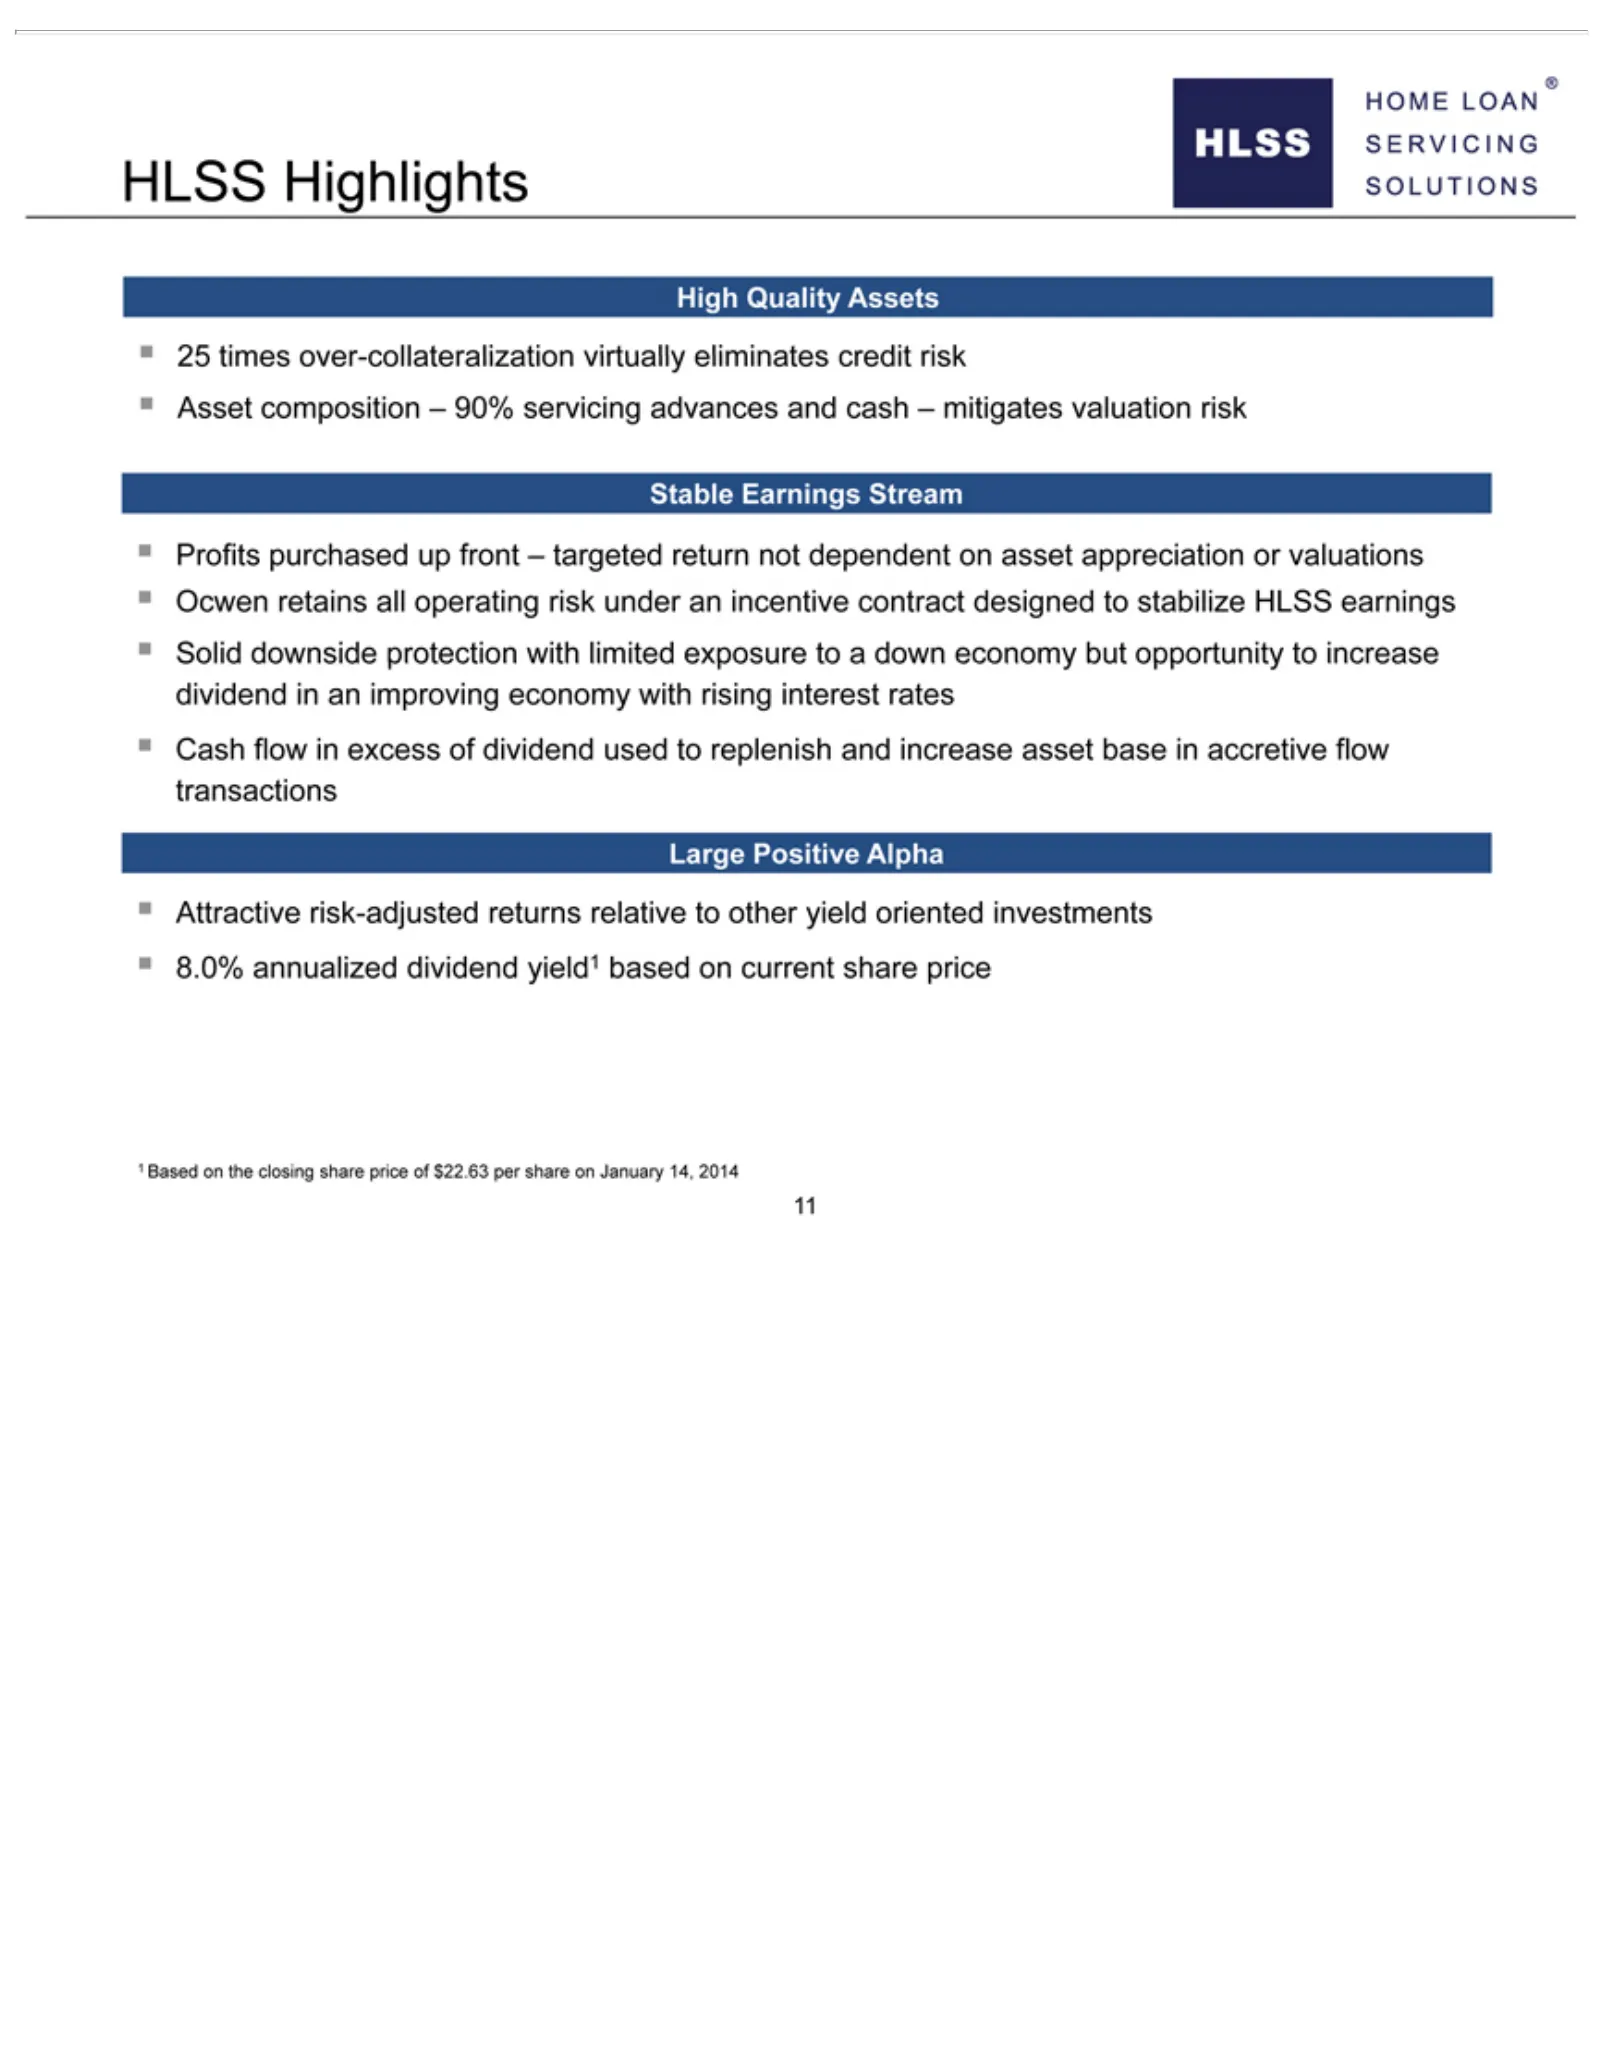
Slide 14: HLSS Highlights
HLSSinHighlights Profits protection base closing purchased accretive share with price limited flow High upoffront $22.63 transactions exposure Quality – targeted perAssets to share Large a return down non25 Positive January economy times not dependent over-collateralization Alpha 14,but 2014 nopport
Slide 15: Ocwen Overview
HOME LOAN” SERVICING SOLUTIONS Ocwen Overview
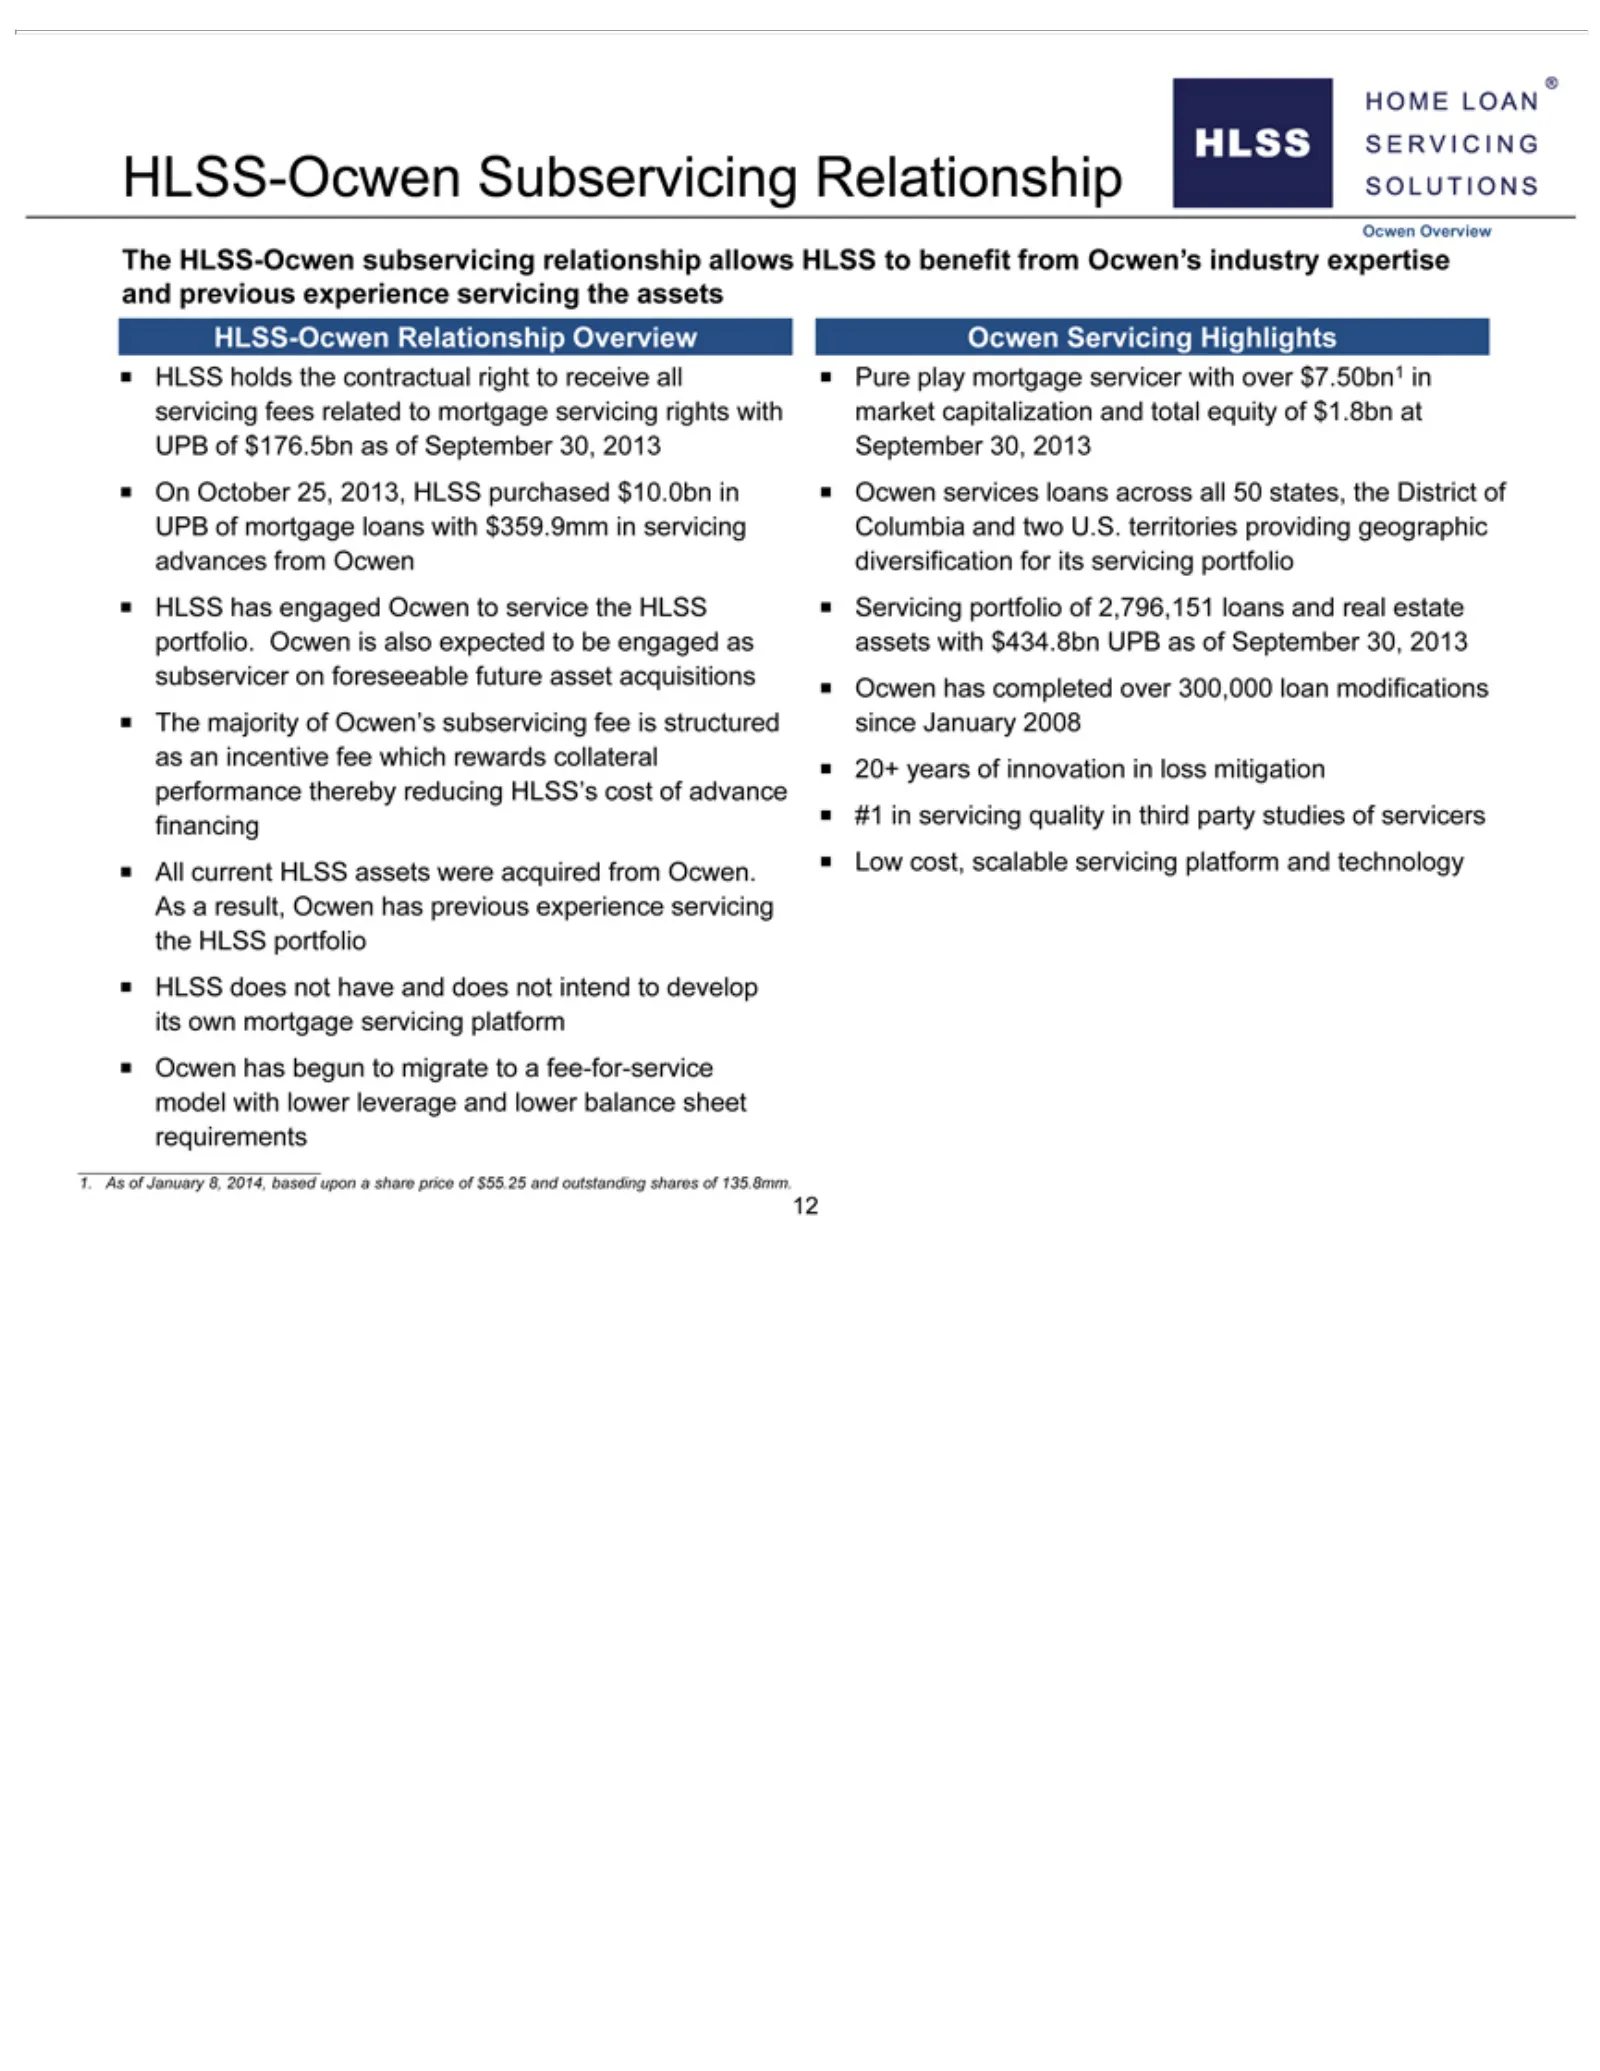
Slide 16: HLSS-Ocwen Relationship Highlights
HLSS-Ocwen servicing across HLSS subservicer rewards were its of $55.25 own acquired has all mortgage collateral rights 50 and engaged on states, outstanding Subservicing Relationship from foreseeable with servicing ? Ocwen the 20+ Ocwen. market District years shares future to platform? Overview Rel
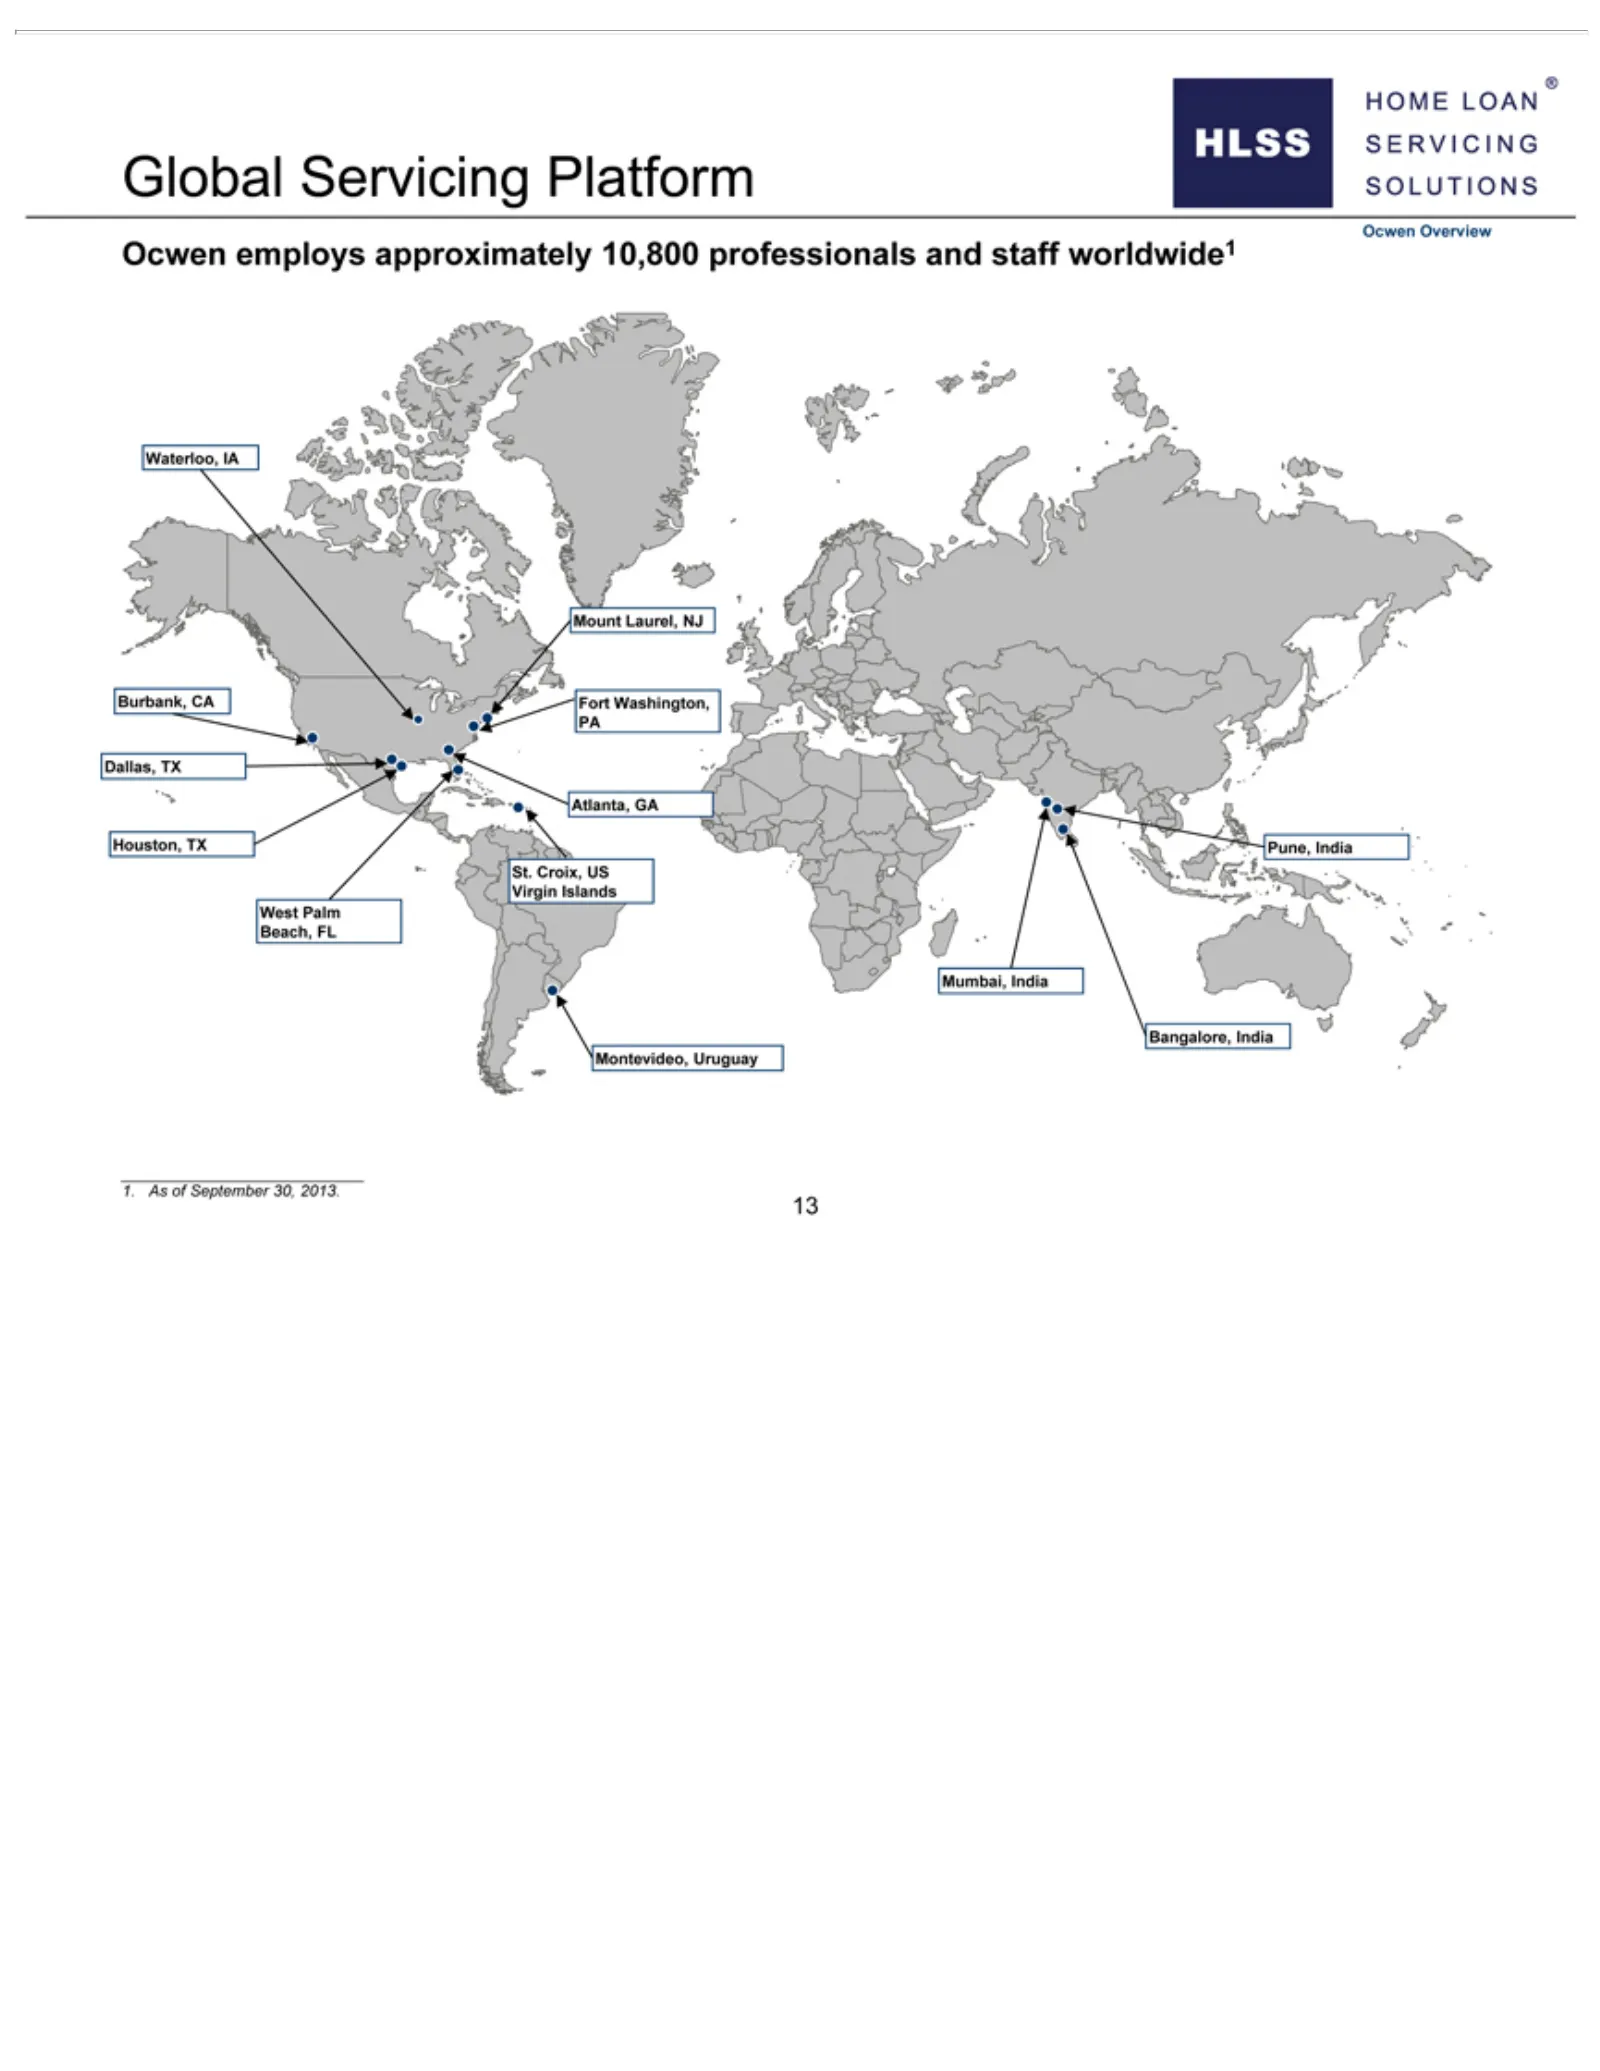
Slide 17: Ocwen Global Servicing Platform
Global Servicing Houston, TX Pune,Platform India St. Ocwen Croix,employs US Virgin approximately Islands West10,800 Palm Beach, professionals FL Mumbai, and staff India worldwide1 Bangalore,Ocwen India Montevideo, Overview Waterloo, UruguayIA Mount1.Laurel, As of September NJ Burbank, 30,CA 2013. Fo
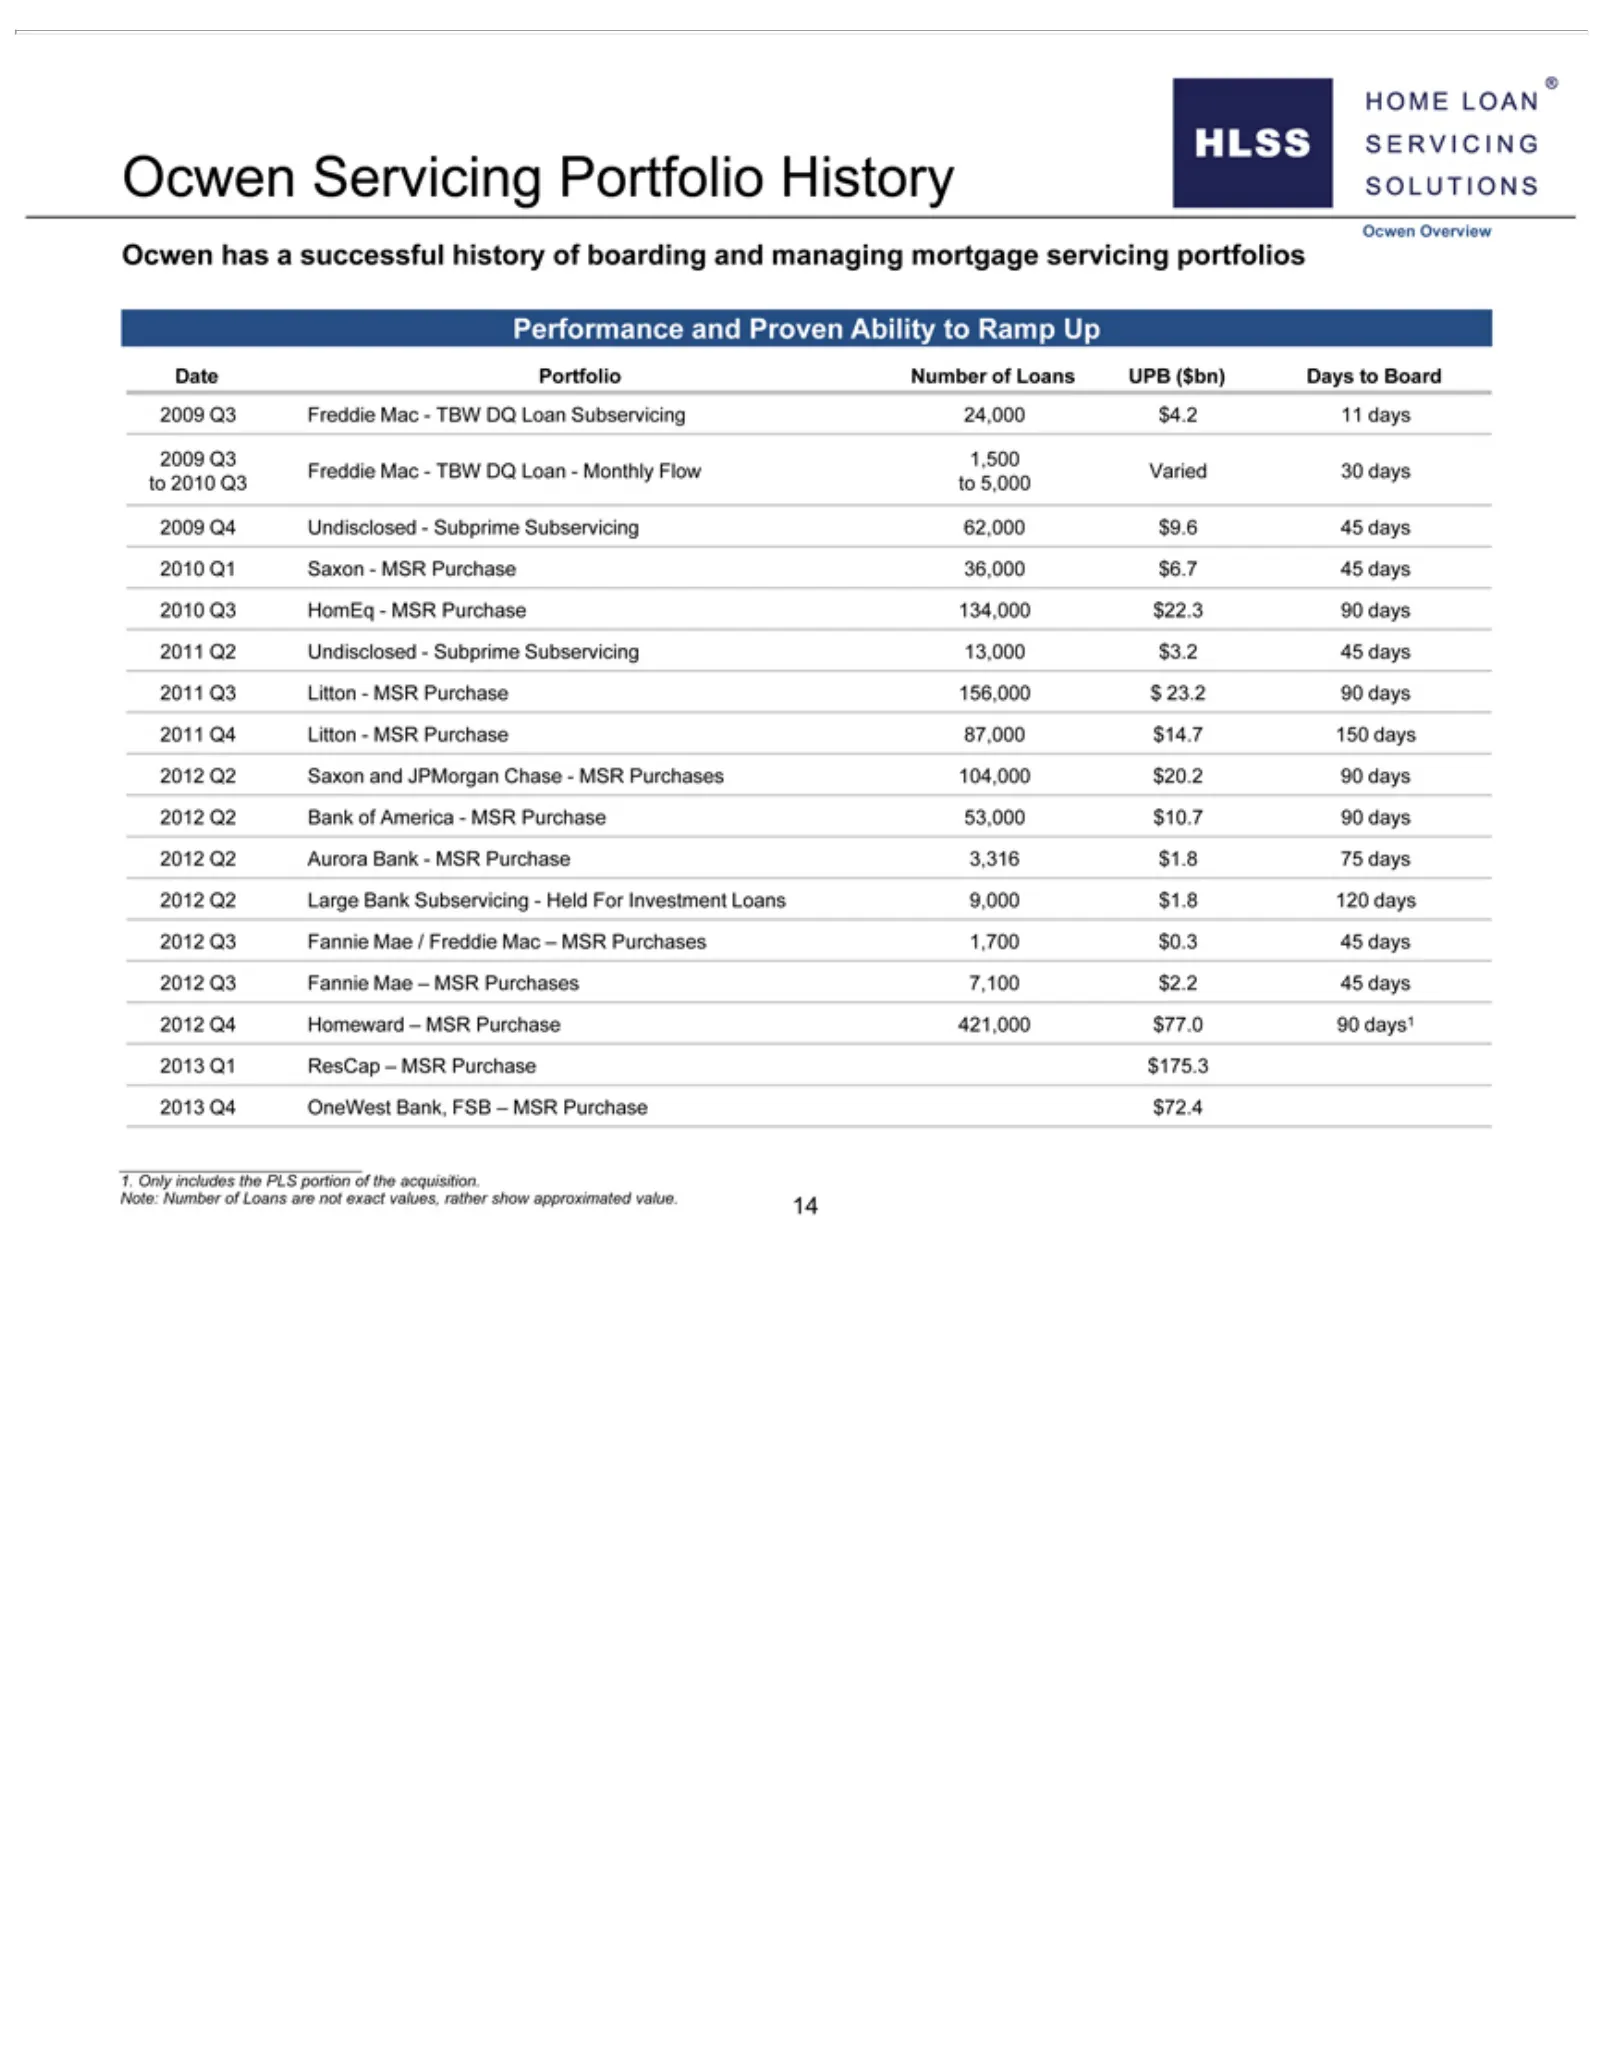
Slide 18: Ocwen Servicing Portfolio History
Ocwen of 2009 Subprime Purchases Investment 421,000 exact Loans Q4 values, Servicing $77.0 Undisclosed—Subprime UPB Subservicing 104,000 Loans rather ($bn) 90 Portfolio days1 9,000 $20.2 show Days 13,000 2013 $1.8 90 approximated to History days Board 120 Q1 $3.2 ResCap 2012 days Subservicing Ocwen
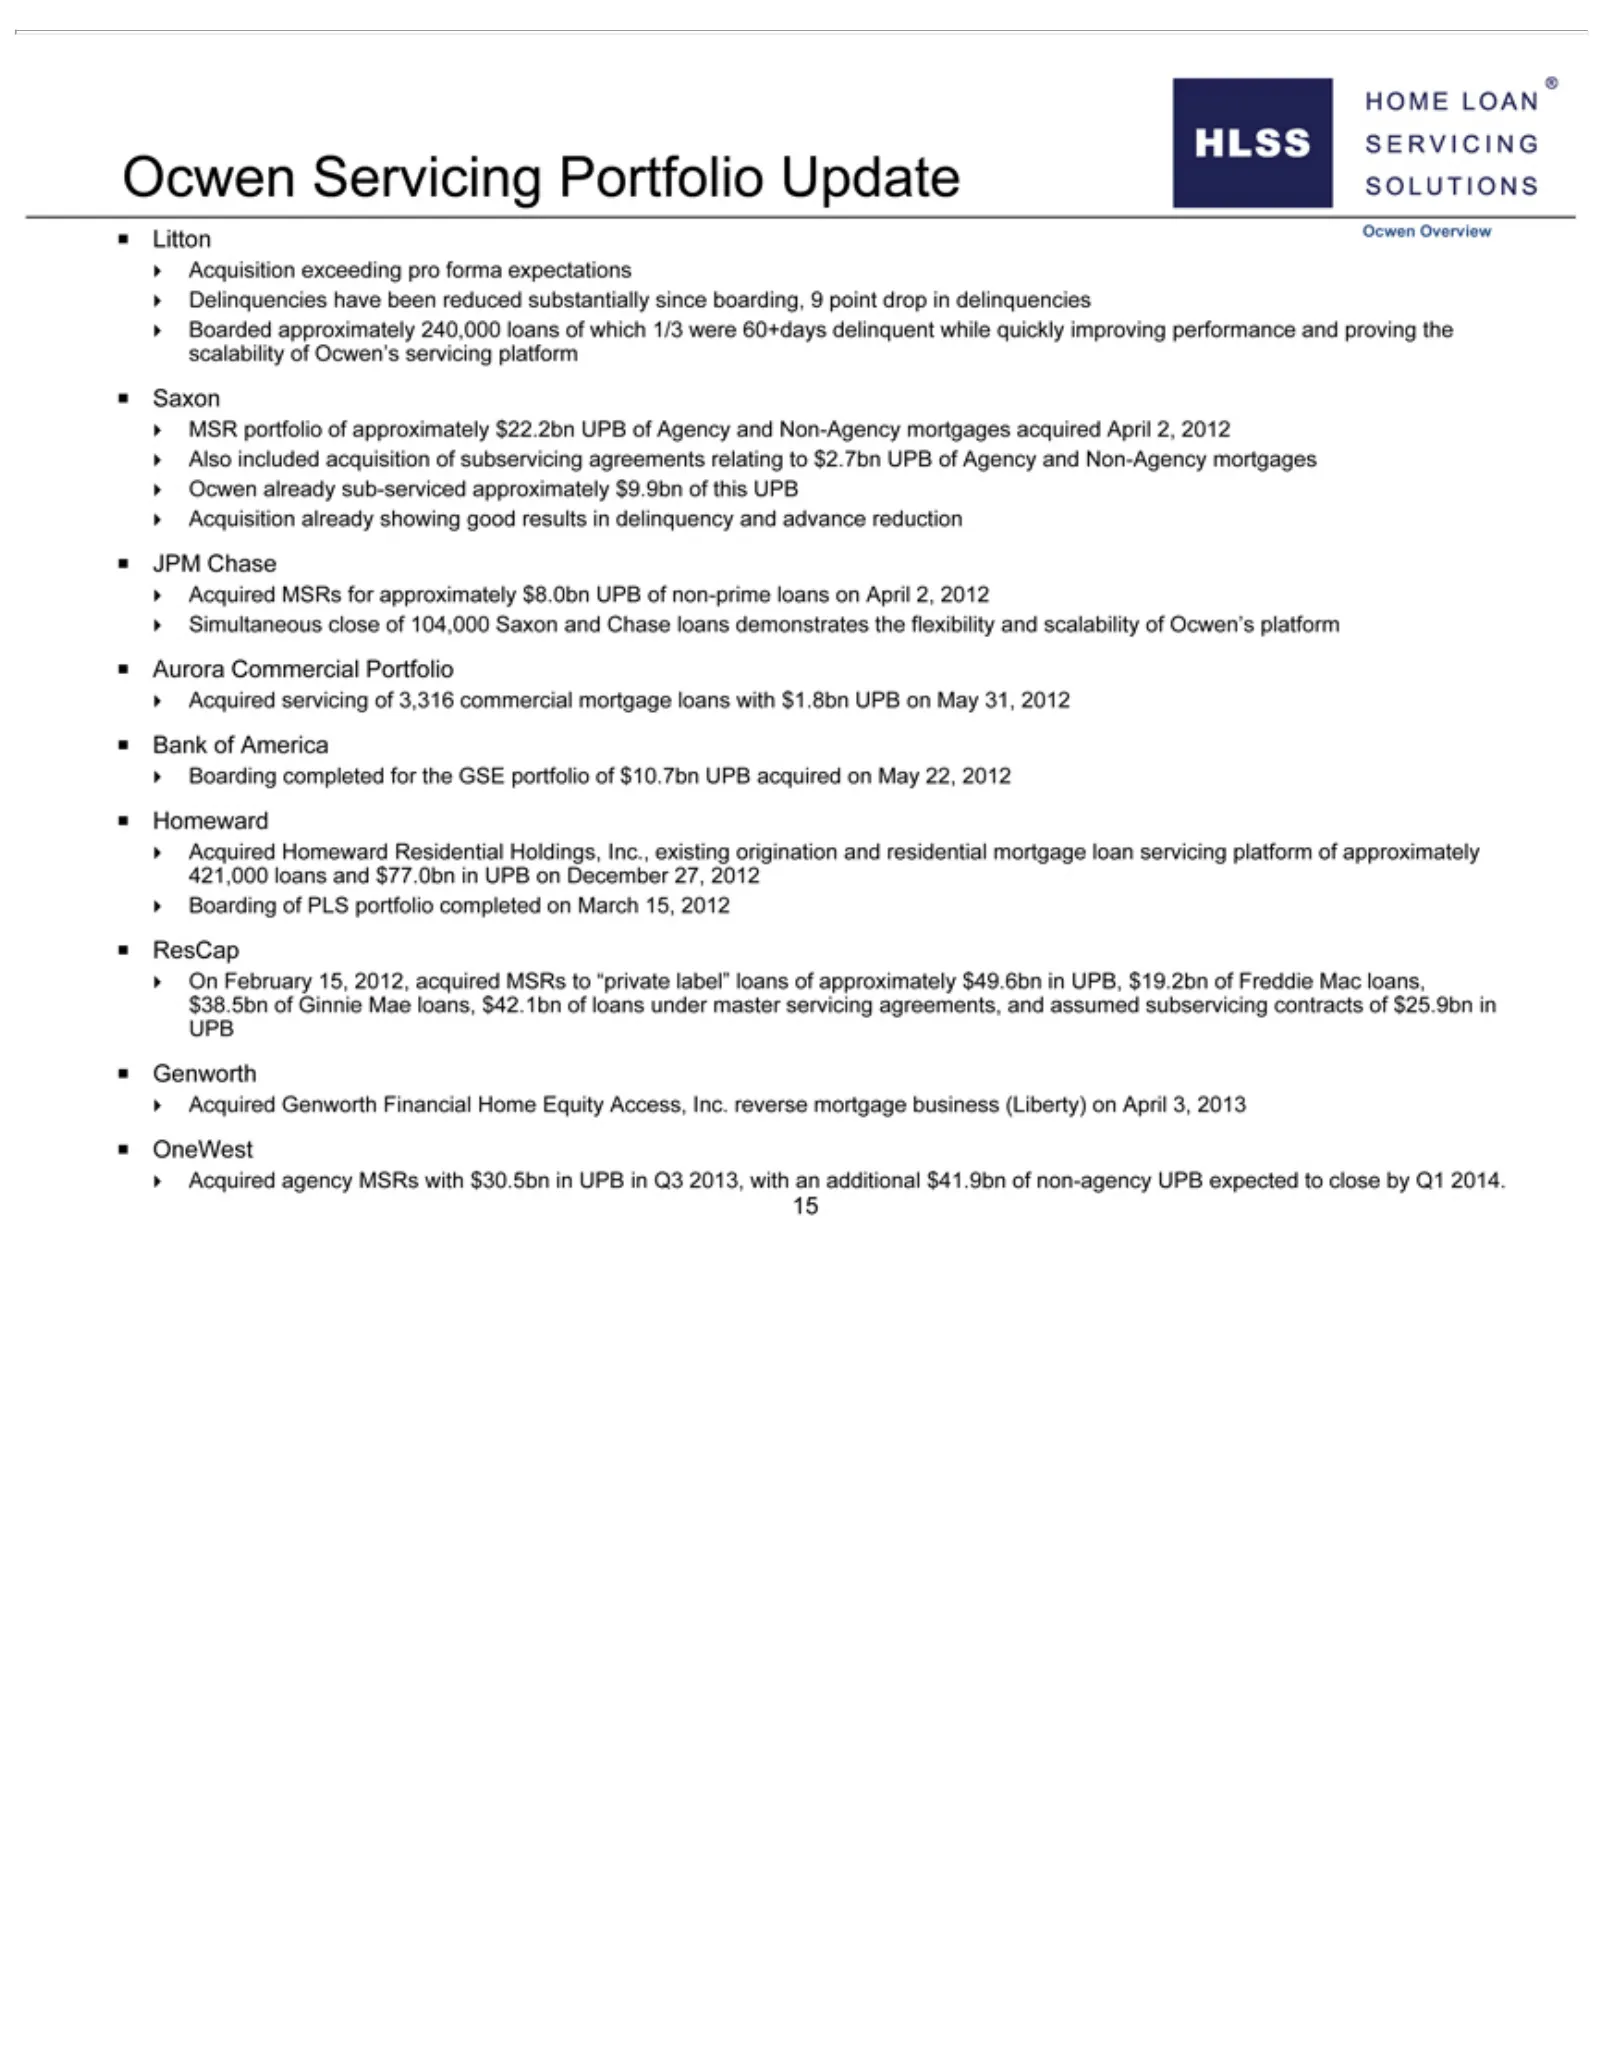
Slide 19: Ocwen Portfolio Update
Boarded approximately Ocwen non-prime 3,316 Homeward portfolio $42.1bn (Liberty) commercial Servicing already of approximately completed onloans loans Residential April $22.2bn sub-serviced on under Portfolio 3, mortgage April on 2013 March Holdings, master UPB 240,000 2,?Update 2012 OneWest loans a
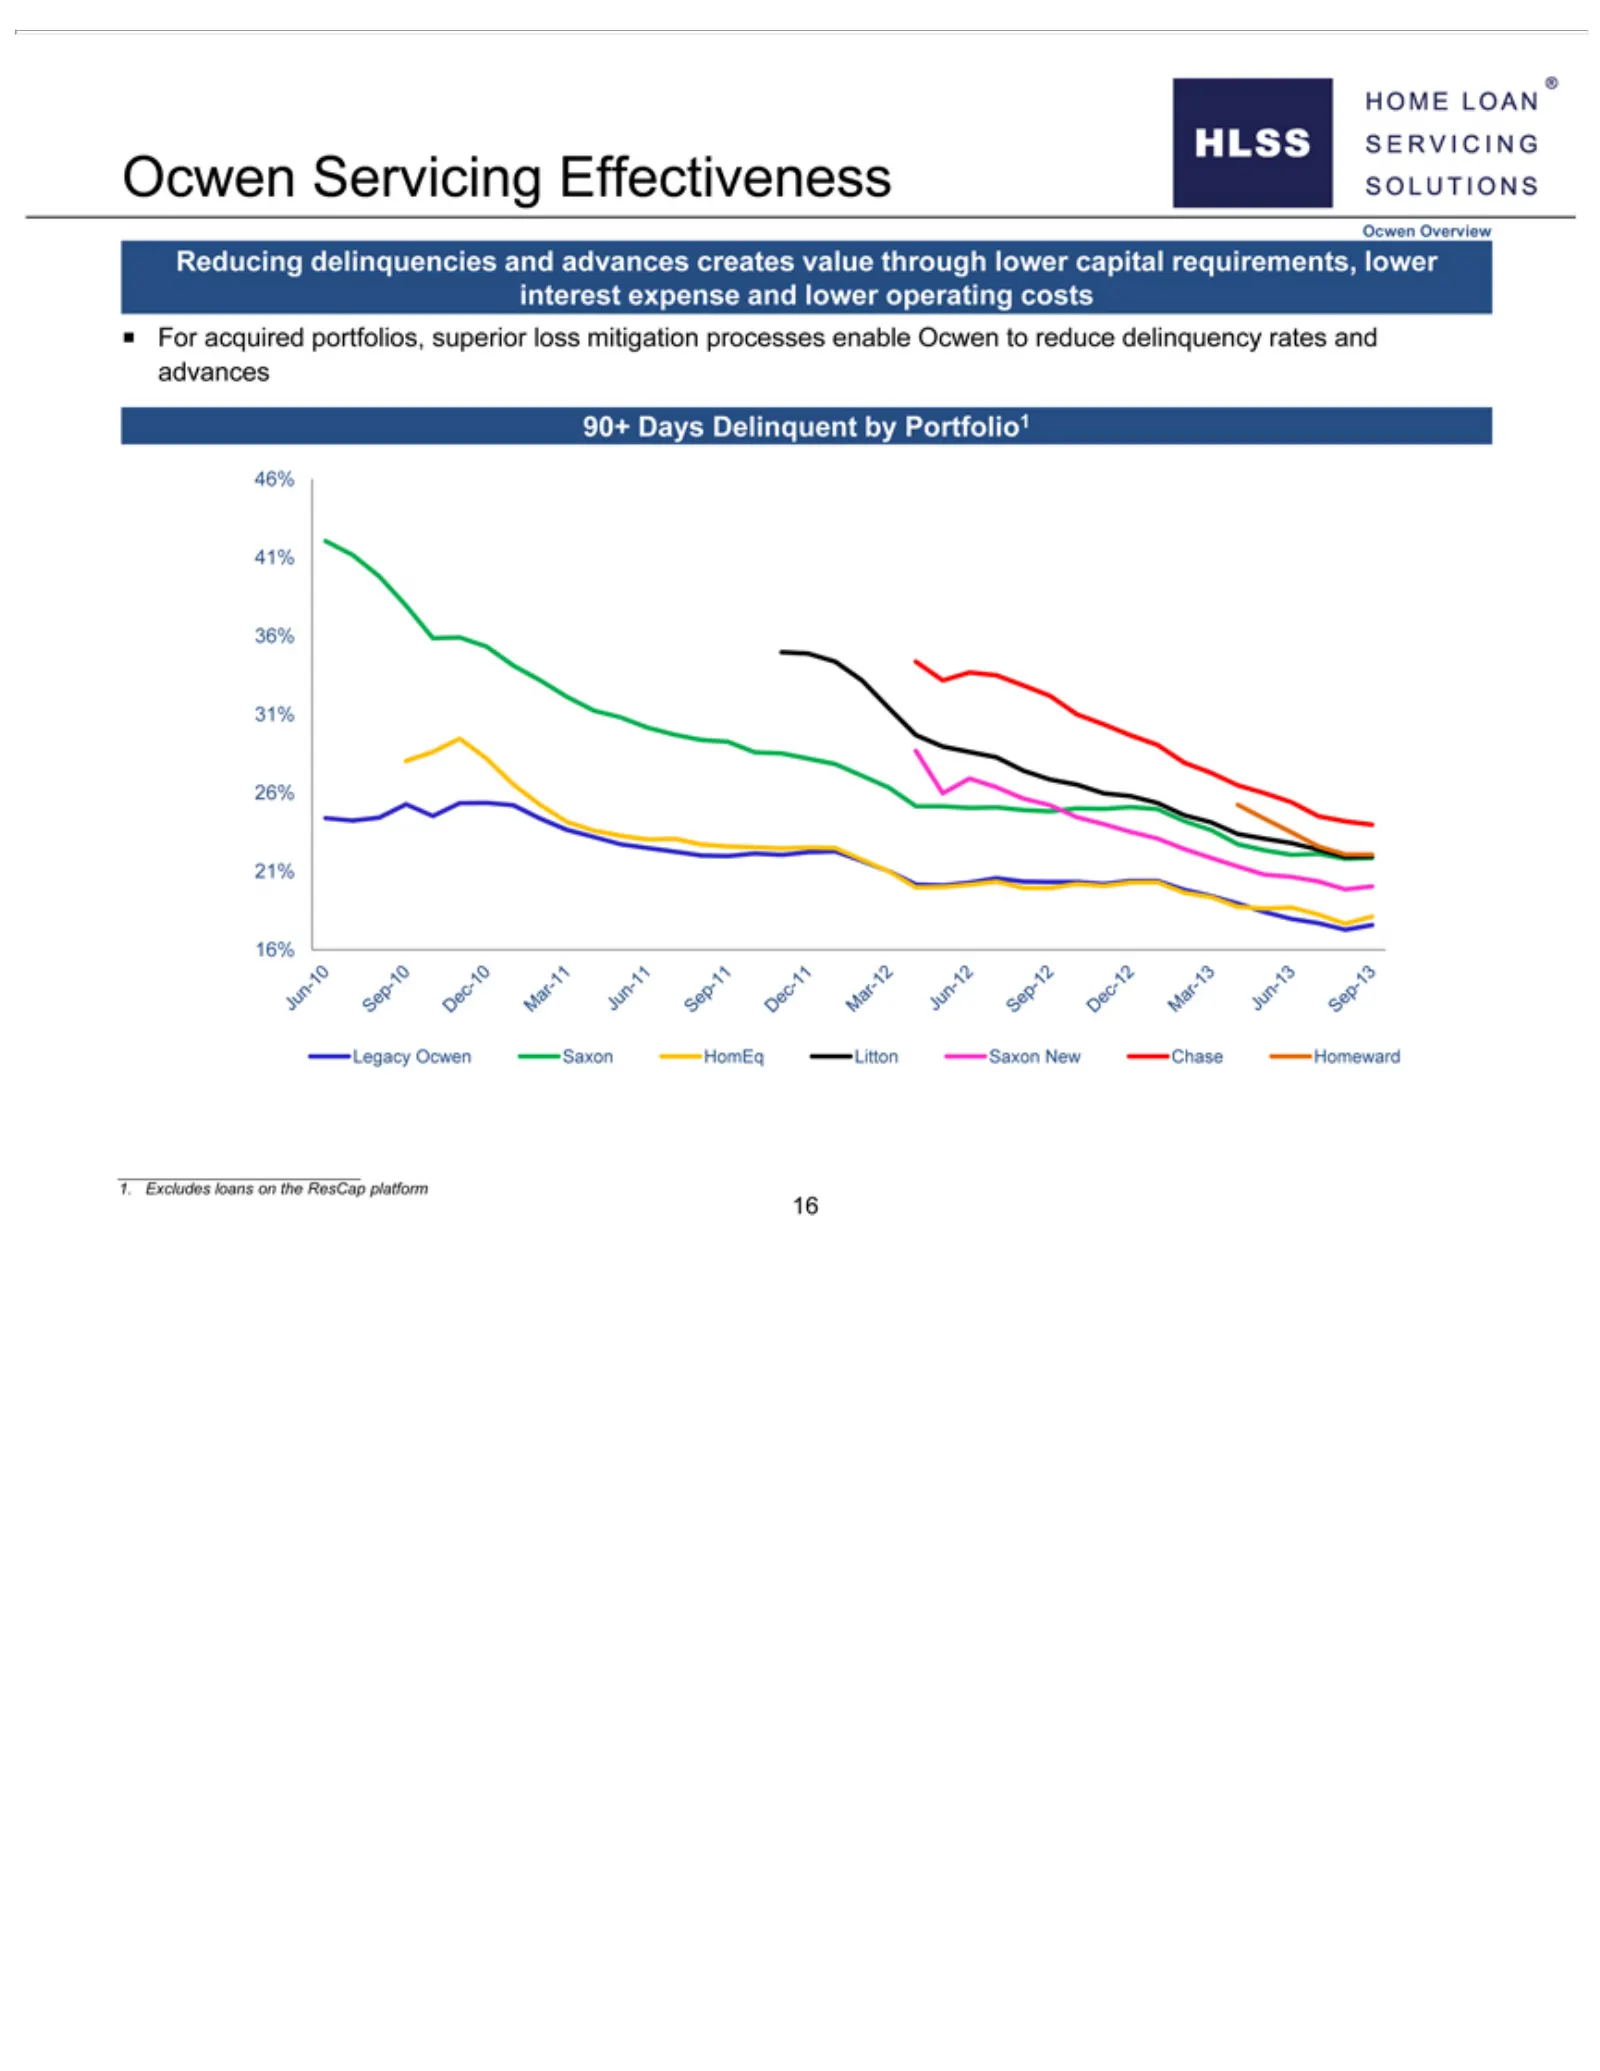
Slide 20: Ocwen Servicing Effectiveness
OcwenNew portfolios, Saxon Servicing superior ChaseEffectiveness Homeward loss mitigation Ocwen processes 1.Overview Excludes enable Reducing loans Ocwen on the to delinquencies reduce ResCapdelinquency platform and advances 16rates and creates advances value 90+ through Dayslower Delinquent capital
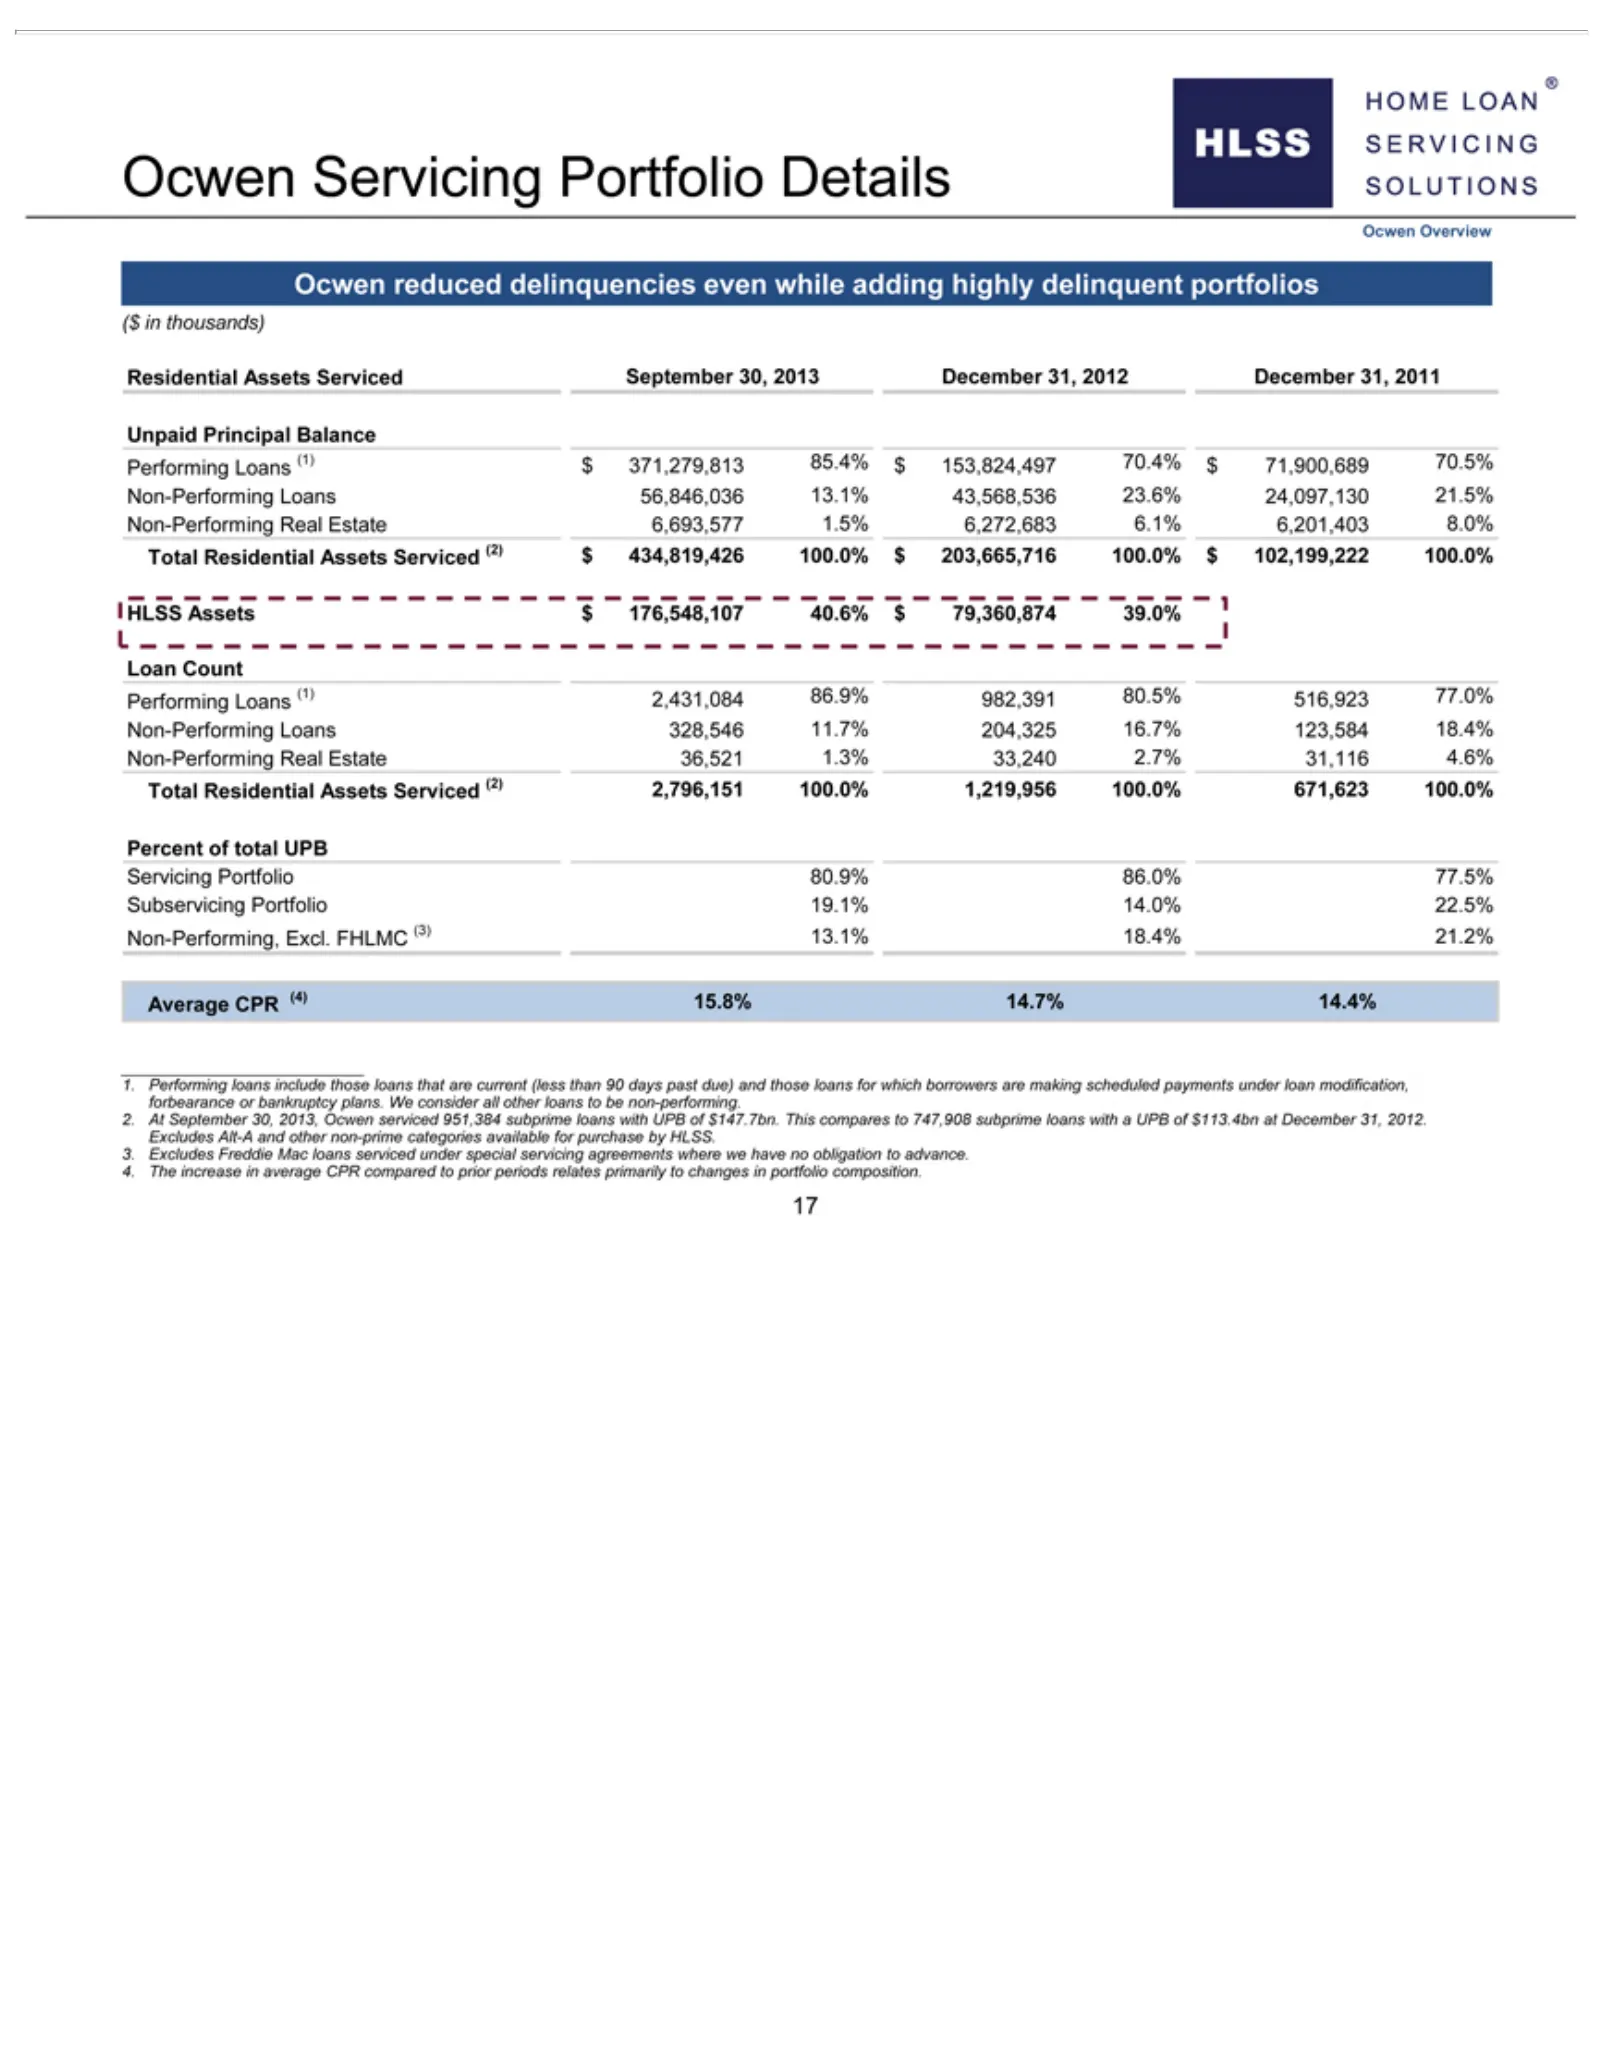
Slide 21: Ocwen Servicing Portfolio Details
Ocwen 2012 21.5% 176,548,107 Performing 77.5% (less September prime to prior than December categories Non-Performing Subservicing Servicing periods 90 30, Real 40.6% days 2013, relates 31, available Estate Portfolio past $2011 Portfolio Ocwen 79,360,874 due) primarily 36,521 Real Unpaid for Details
Slide 22: HSART Master Trust Overview
HOME LOAN” SERVICING SOLUTIONS HSART Master Trust Overview
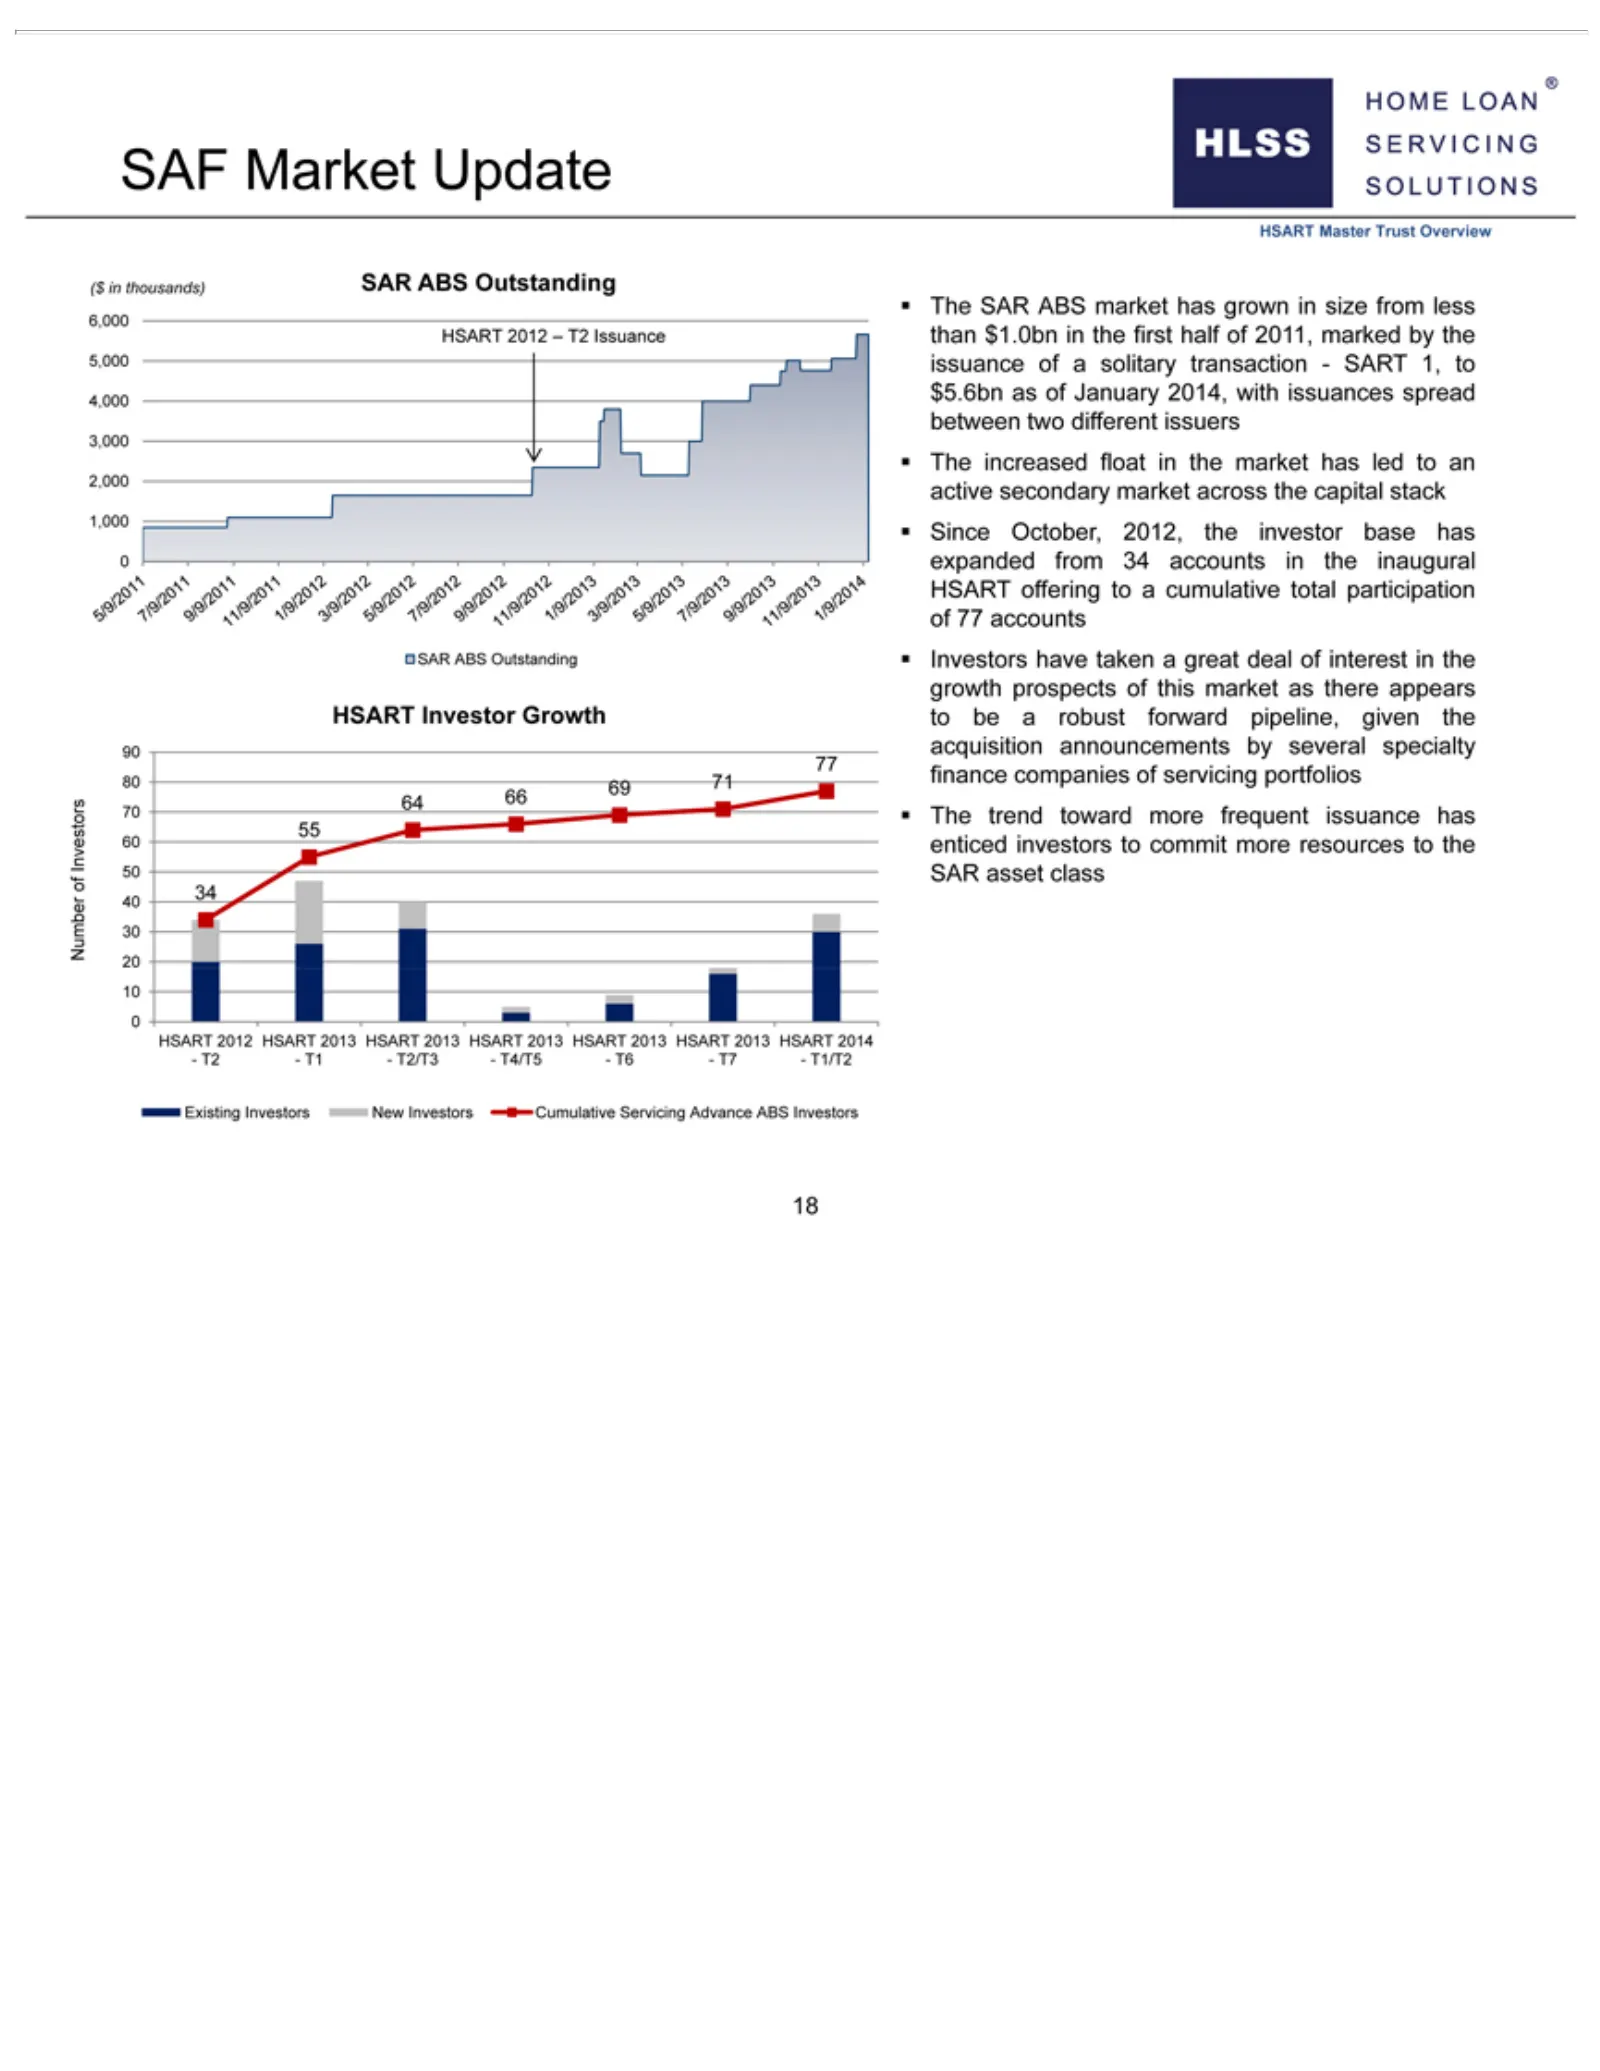
Slide 23: Servicer Advance Receivables Market Update
SAF 2011, an accounts acquisition resources Existing 2,000 Market marked Investors active SAR toannouncements the Update by ABS secondary ofthe New 50 Outstandingn HSART 5,000 SAR Investors market issuance asset byMaster several class Cumulative across Investors of Trust specialty 40 asolitary the 3
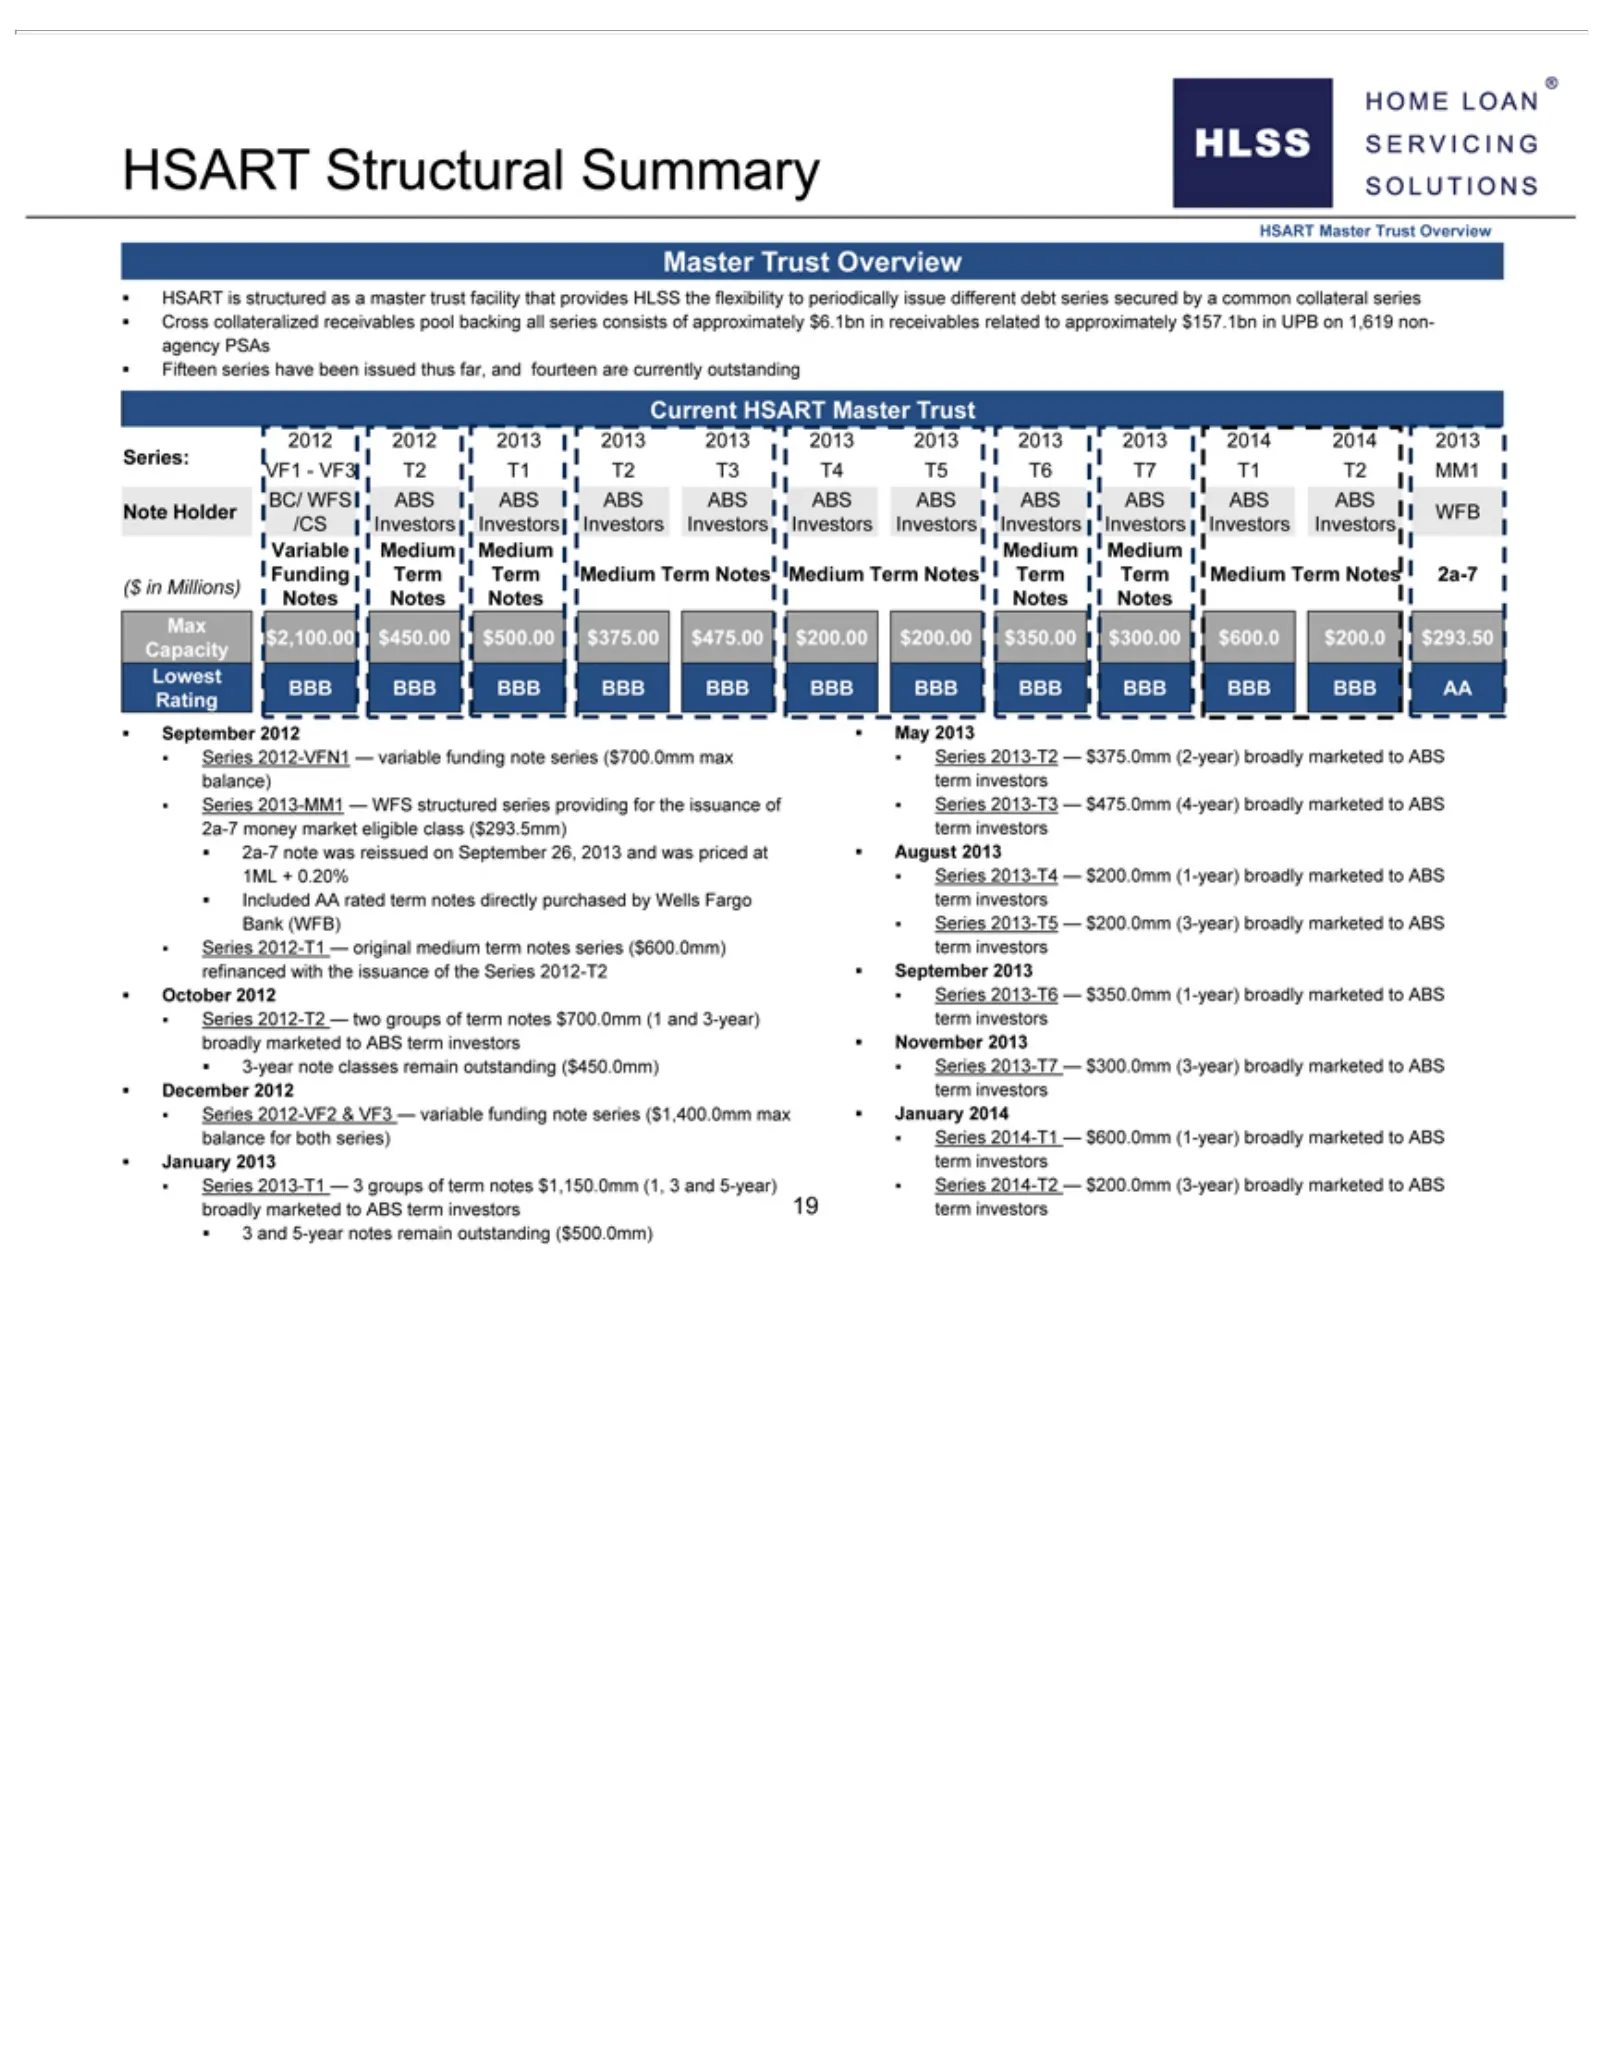
Slide 24: HSART Structural Summary
HSART secured PSAsn T2 Investors $2,100.00 2012n structured September investors marketed 2012-VF2 Series yearT3notes T4 2012-T2n 2013-T1 May Fifteen by Structural Bank Variable to T5 series $450.00 remain &26, a2013 ABS common T6 VF3 2013 series (WFB)n —T7 providing September nterm outstanding — Med
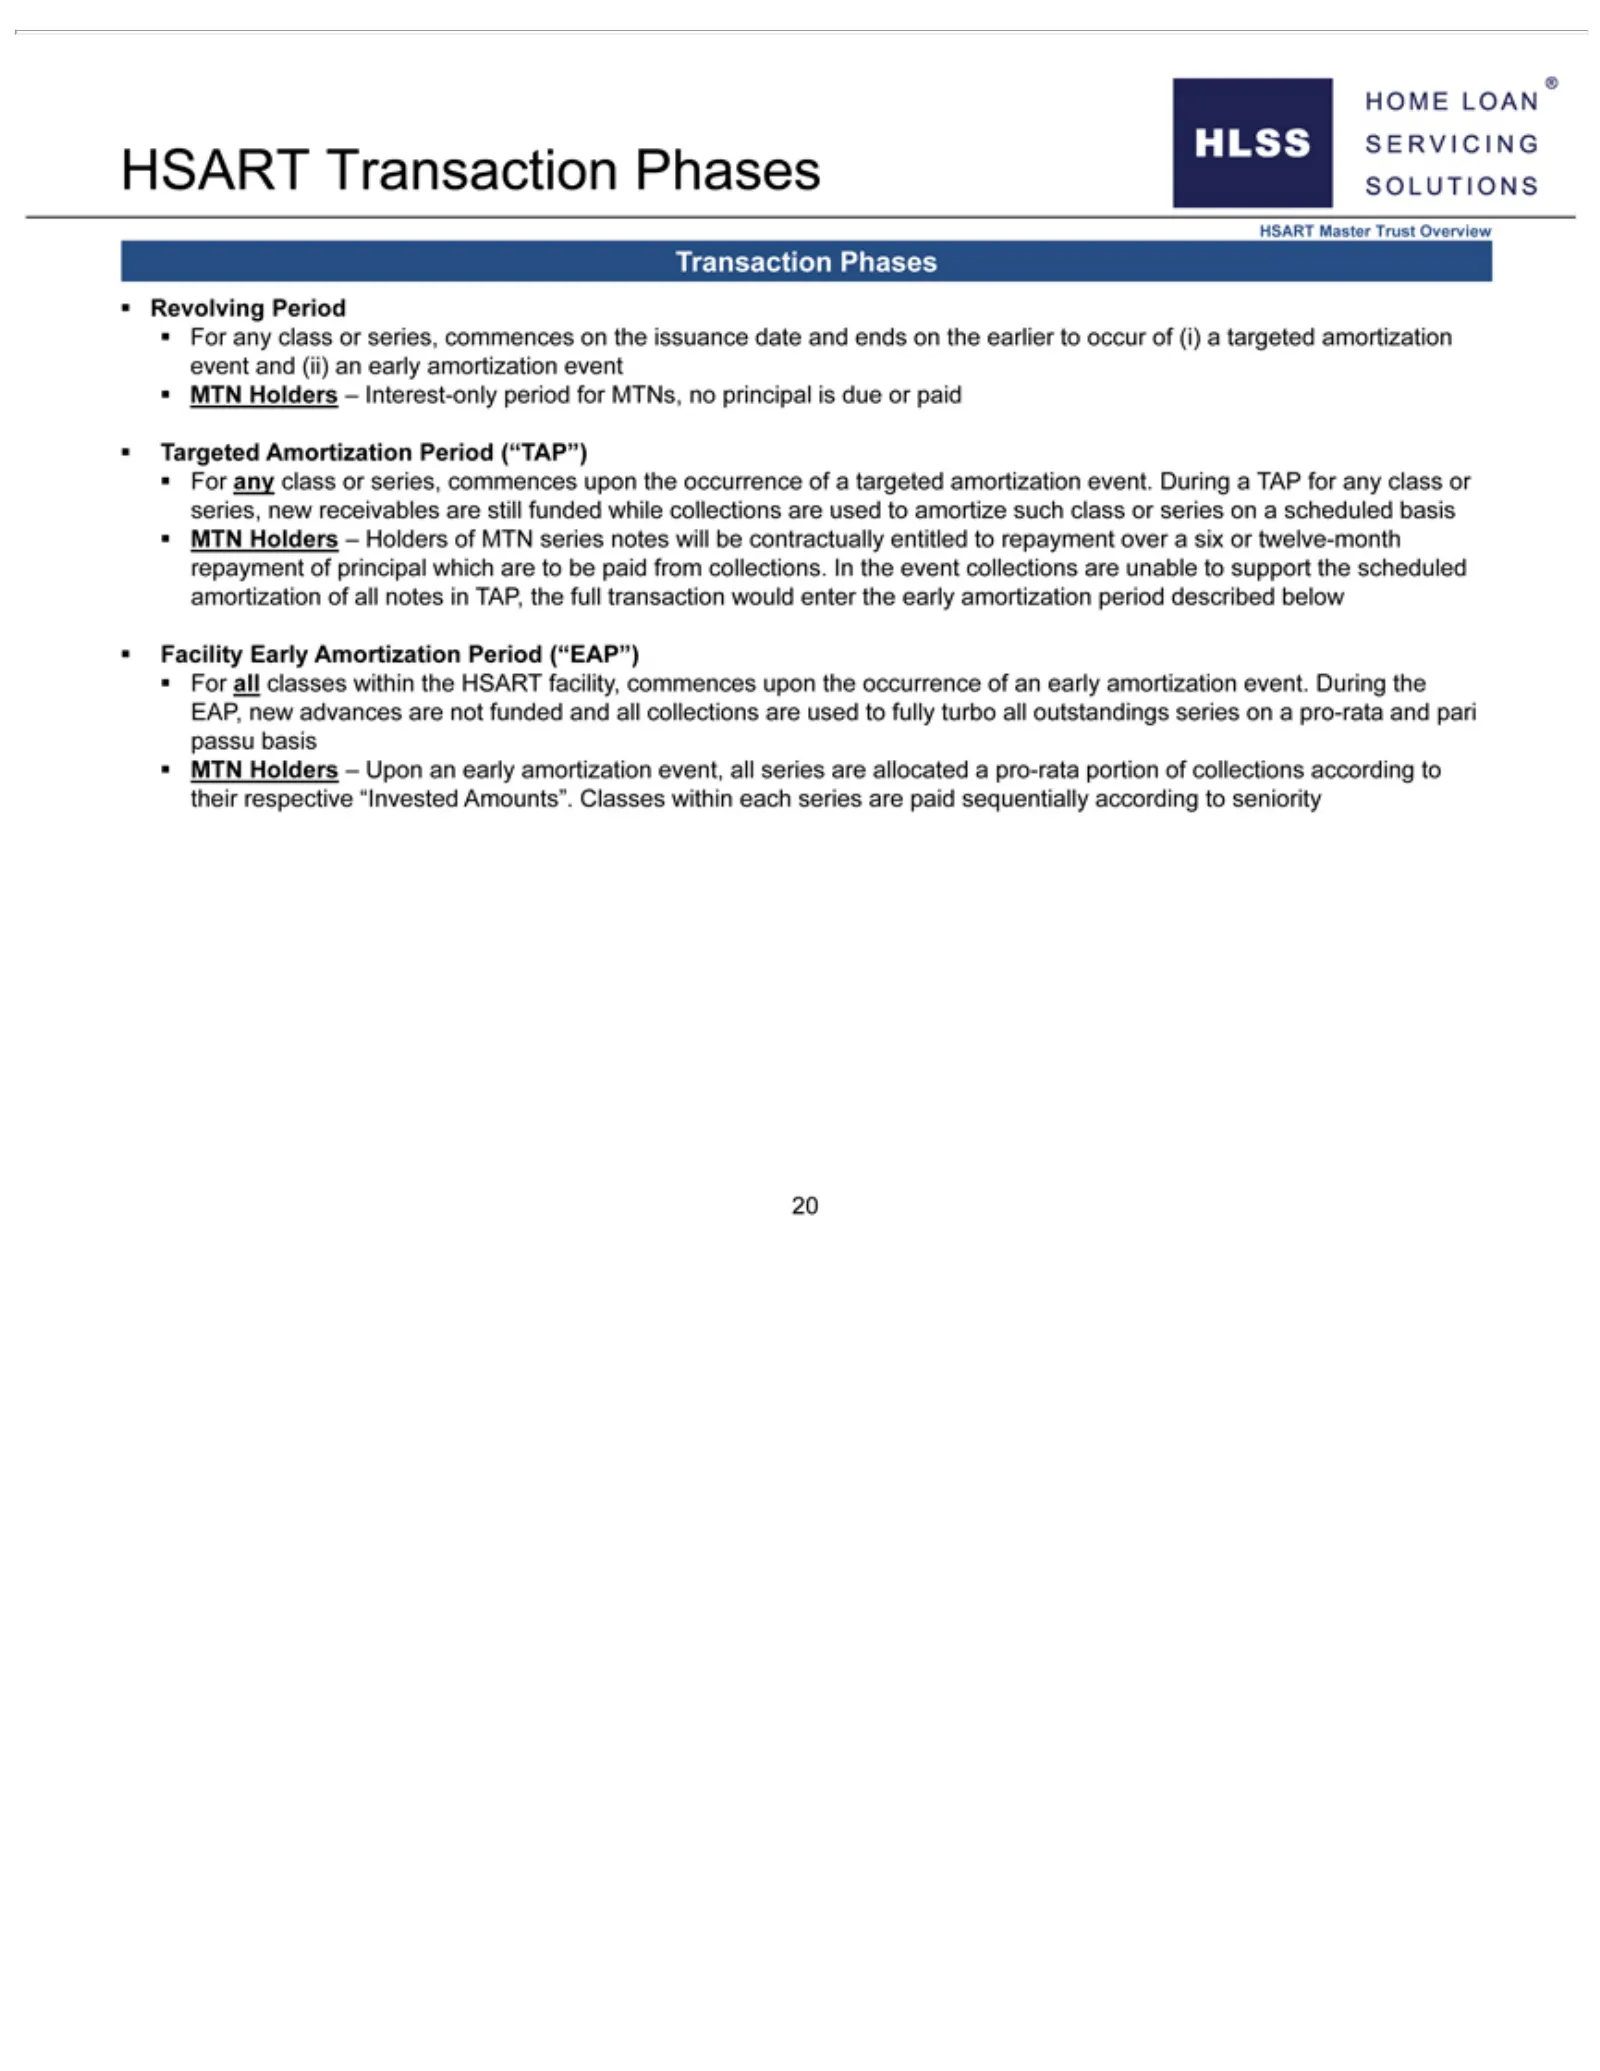
Slide 25: HSART Transaction Amortization Phases
amortization upon Holders support HSART pari sequentially passu thethe –Transaction facility, occurrence Holders basisn scheduled according eventcommences MTN of and of Phases MTN amortization to (ii) aHolders targeted seniority an series HSART upon early – amortization notes Upon the of amortizatio
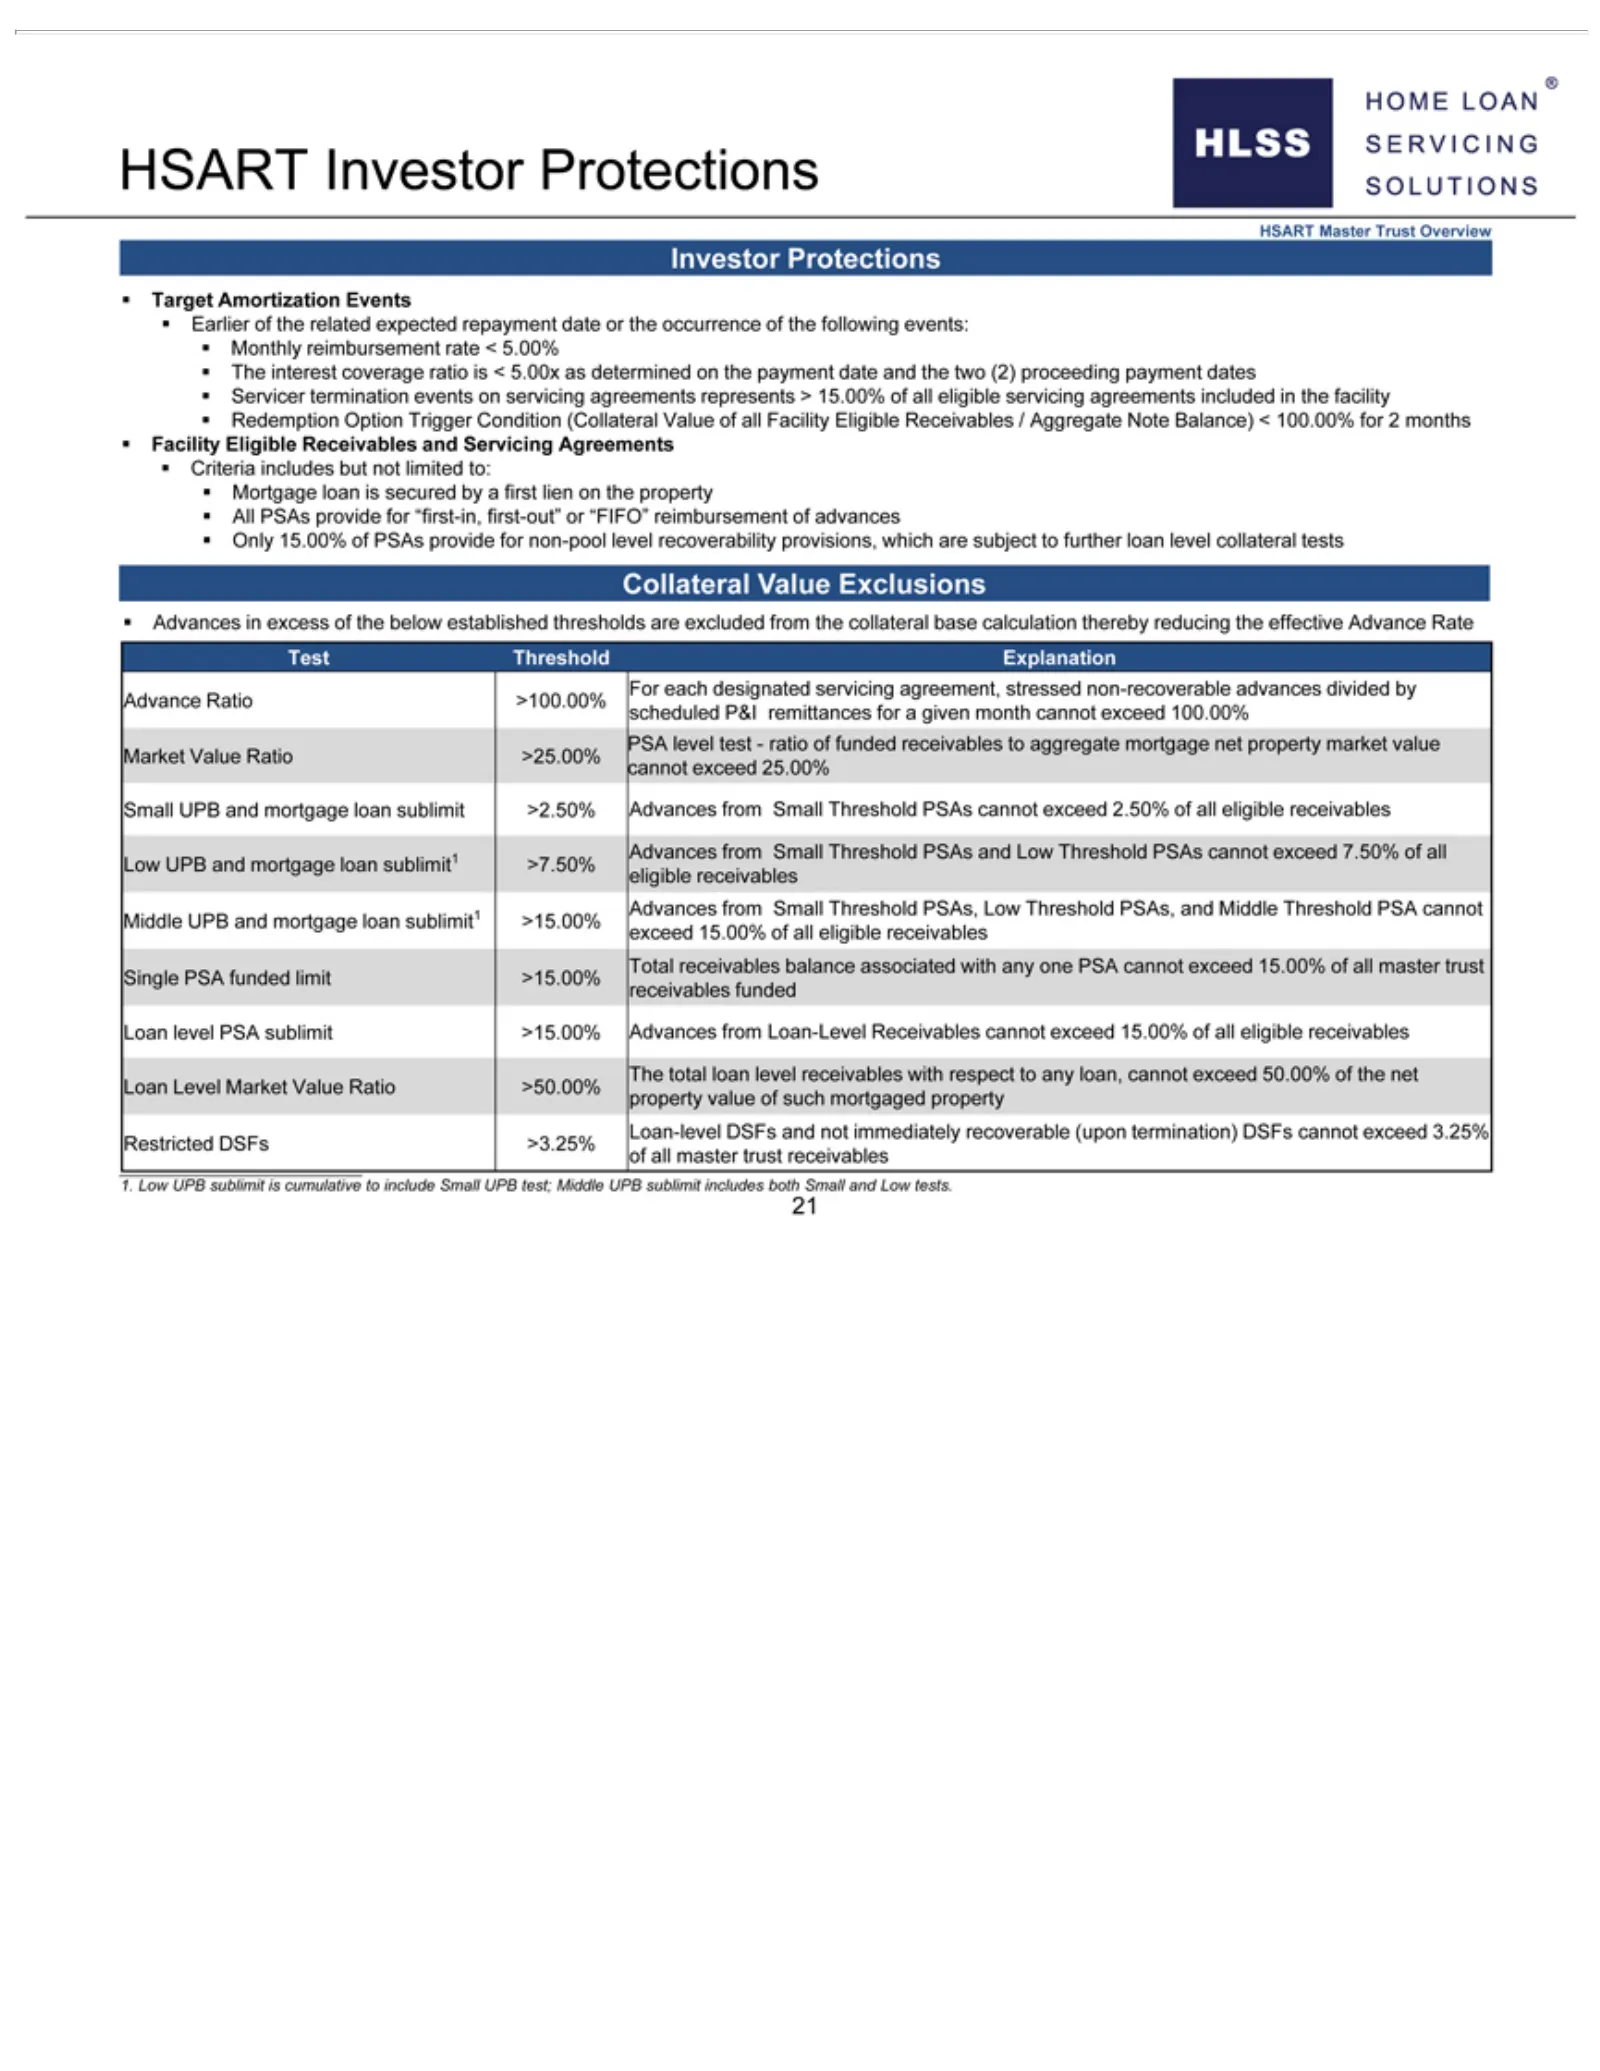
Slide 26: HSART Investor Protections
HSART Monthly represents for “FIFO” excess stressed net PSAs, cannot receivables not UPB 2property immediately months sublimit Low of exceed reimbursement non-recoverable Investor reimbursement the >The 1Threshold market 15.00% nbelow Advances includes 15.00% Facility total recoverable Protections e
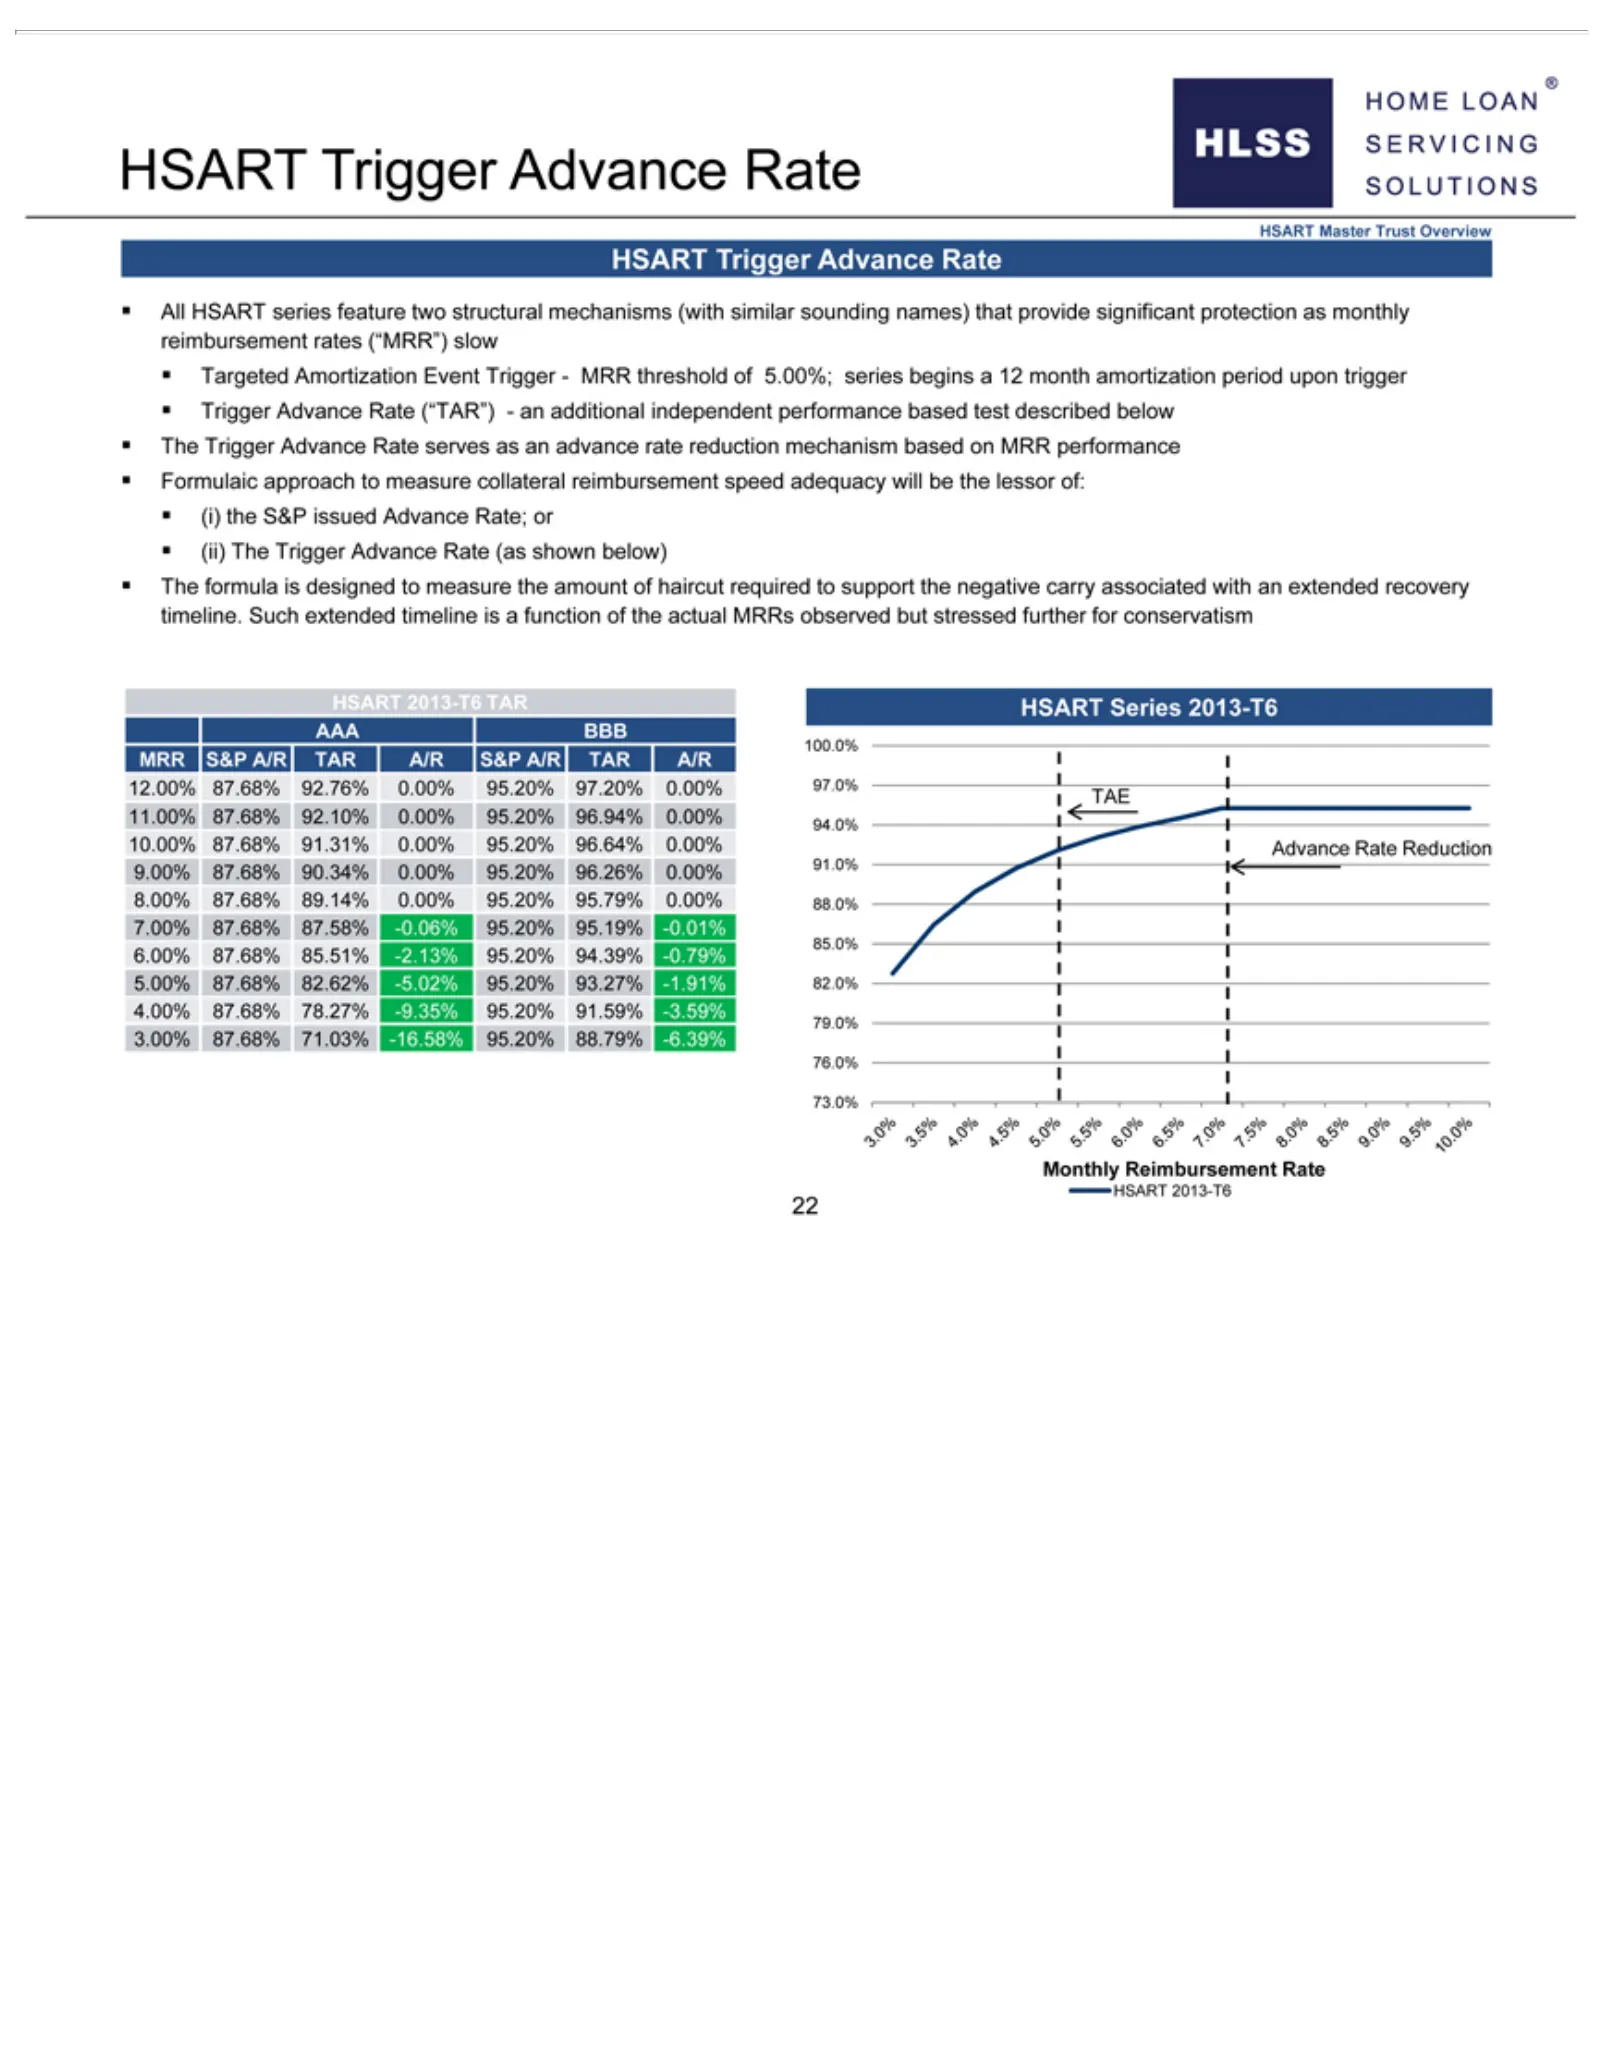
Slide 27: HSART Target Advance Rate Protection
HSART protection (“TAR”)—an measure haircut T6 96.94% 95.79% 87.68% TARrequired 000% 0.00% 78.27% Trigger HSART collateral as monthly additional .88.0% 94.0% Advance to -9.35% Series reimbursement support reimbursement 7.00% 10.00% 2013-T6 95.20% independent Rate the87.68% negative HSART 87.68% 91.5
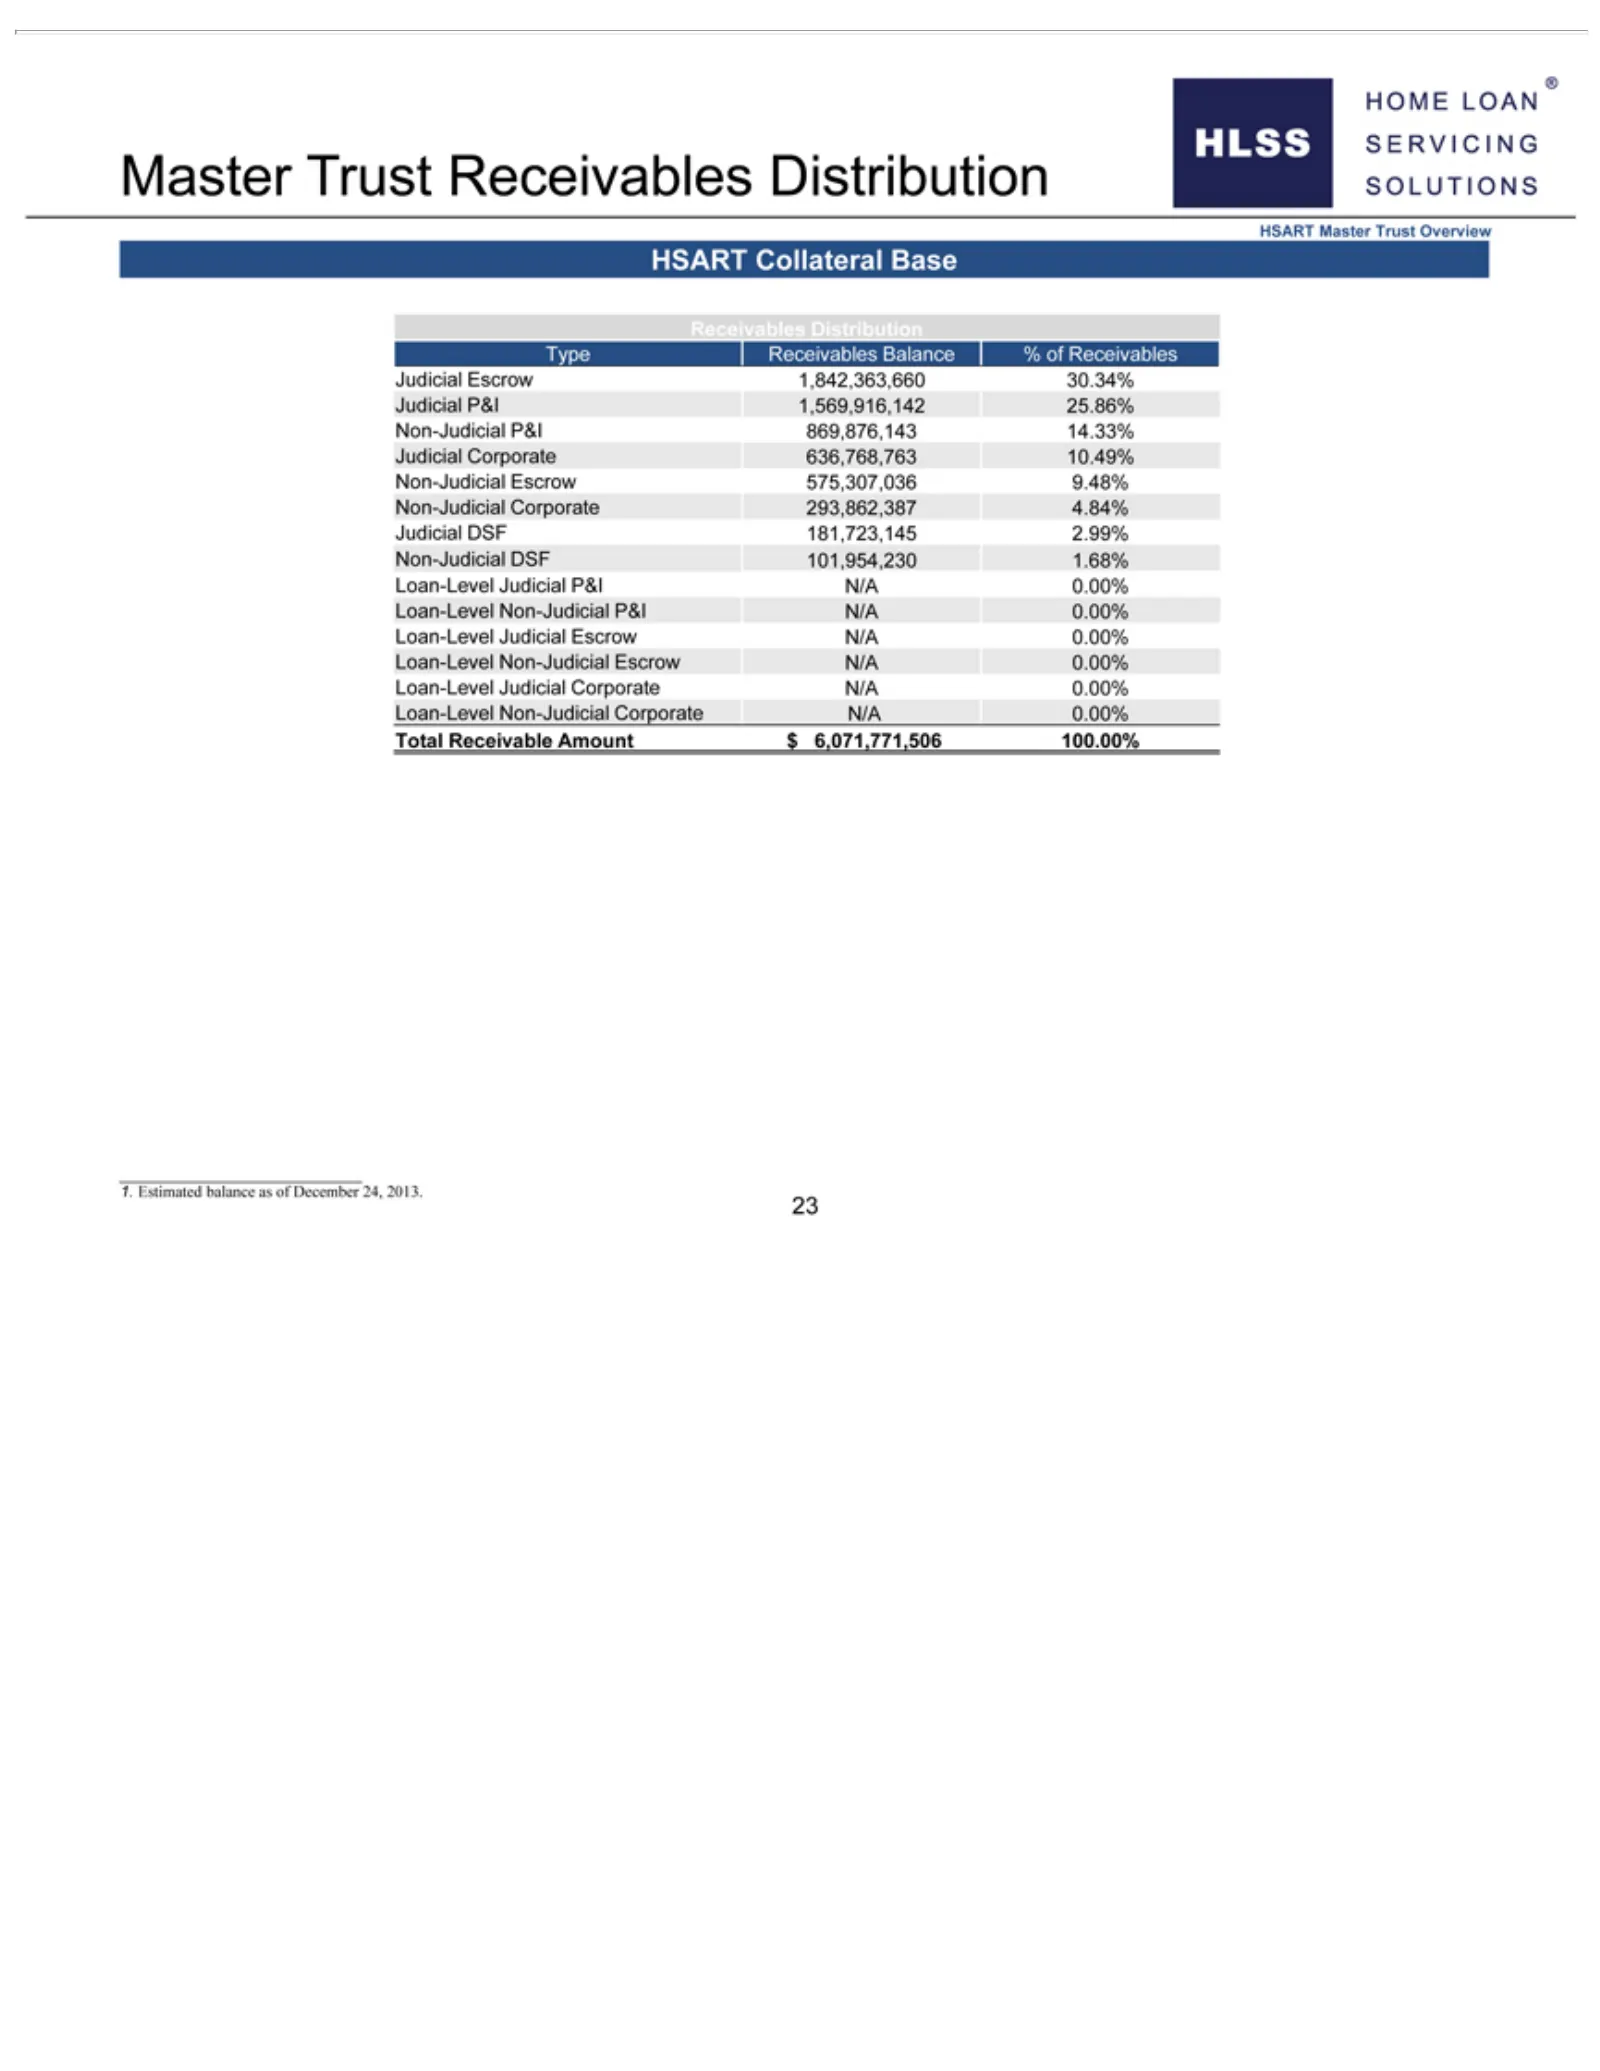
Slide 28: HSART Collateral Receivables
Master Judicial DSF Escrow 2013.181,723,145 23Trust N/A P&I 0.00% 1,569,916,142 Receivables 2.99% Loan-Level Non-Judicial Distribution 25.86% Judicial Non-Judicial HSART DSF Corporate 101,954,230 Master P&I N/A869,876,143 Trust 0.00% 1.68% Overview Loan-Level Loan-Level 14.33% HSART Non-Judicial Jud
Slide 29: Appendices
HOME LOAN” SERVICING SOLUTIONS Appendices
Slide 30: Appendix: Past Transactions
Appendix: Past Transactions
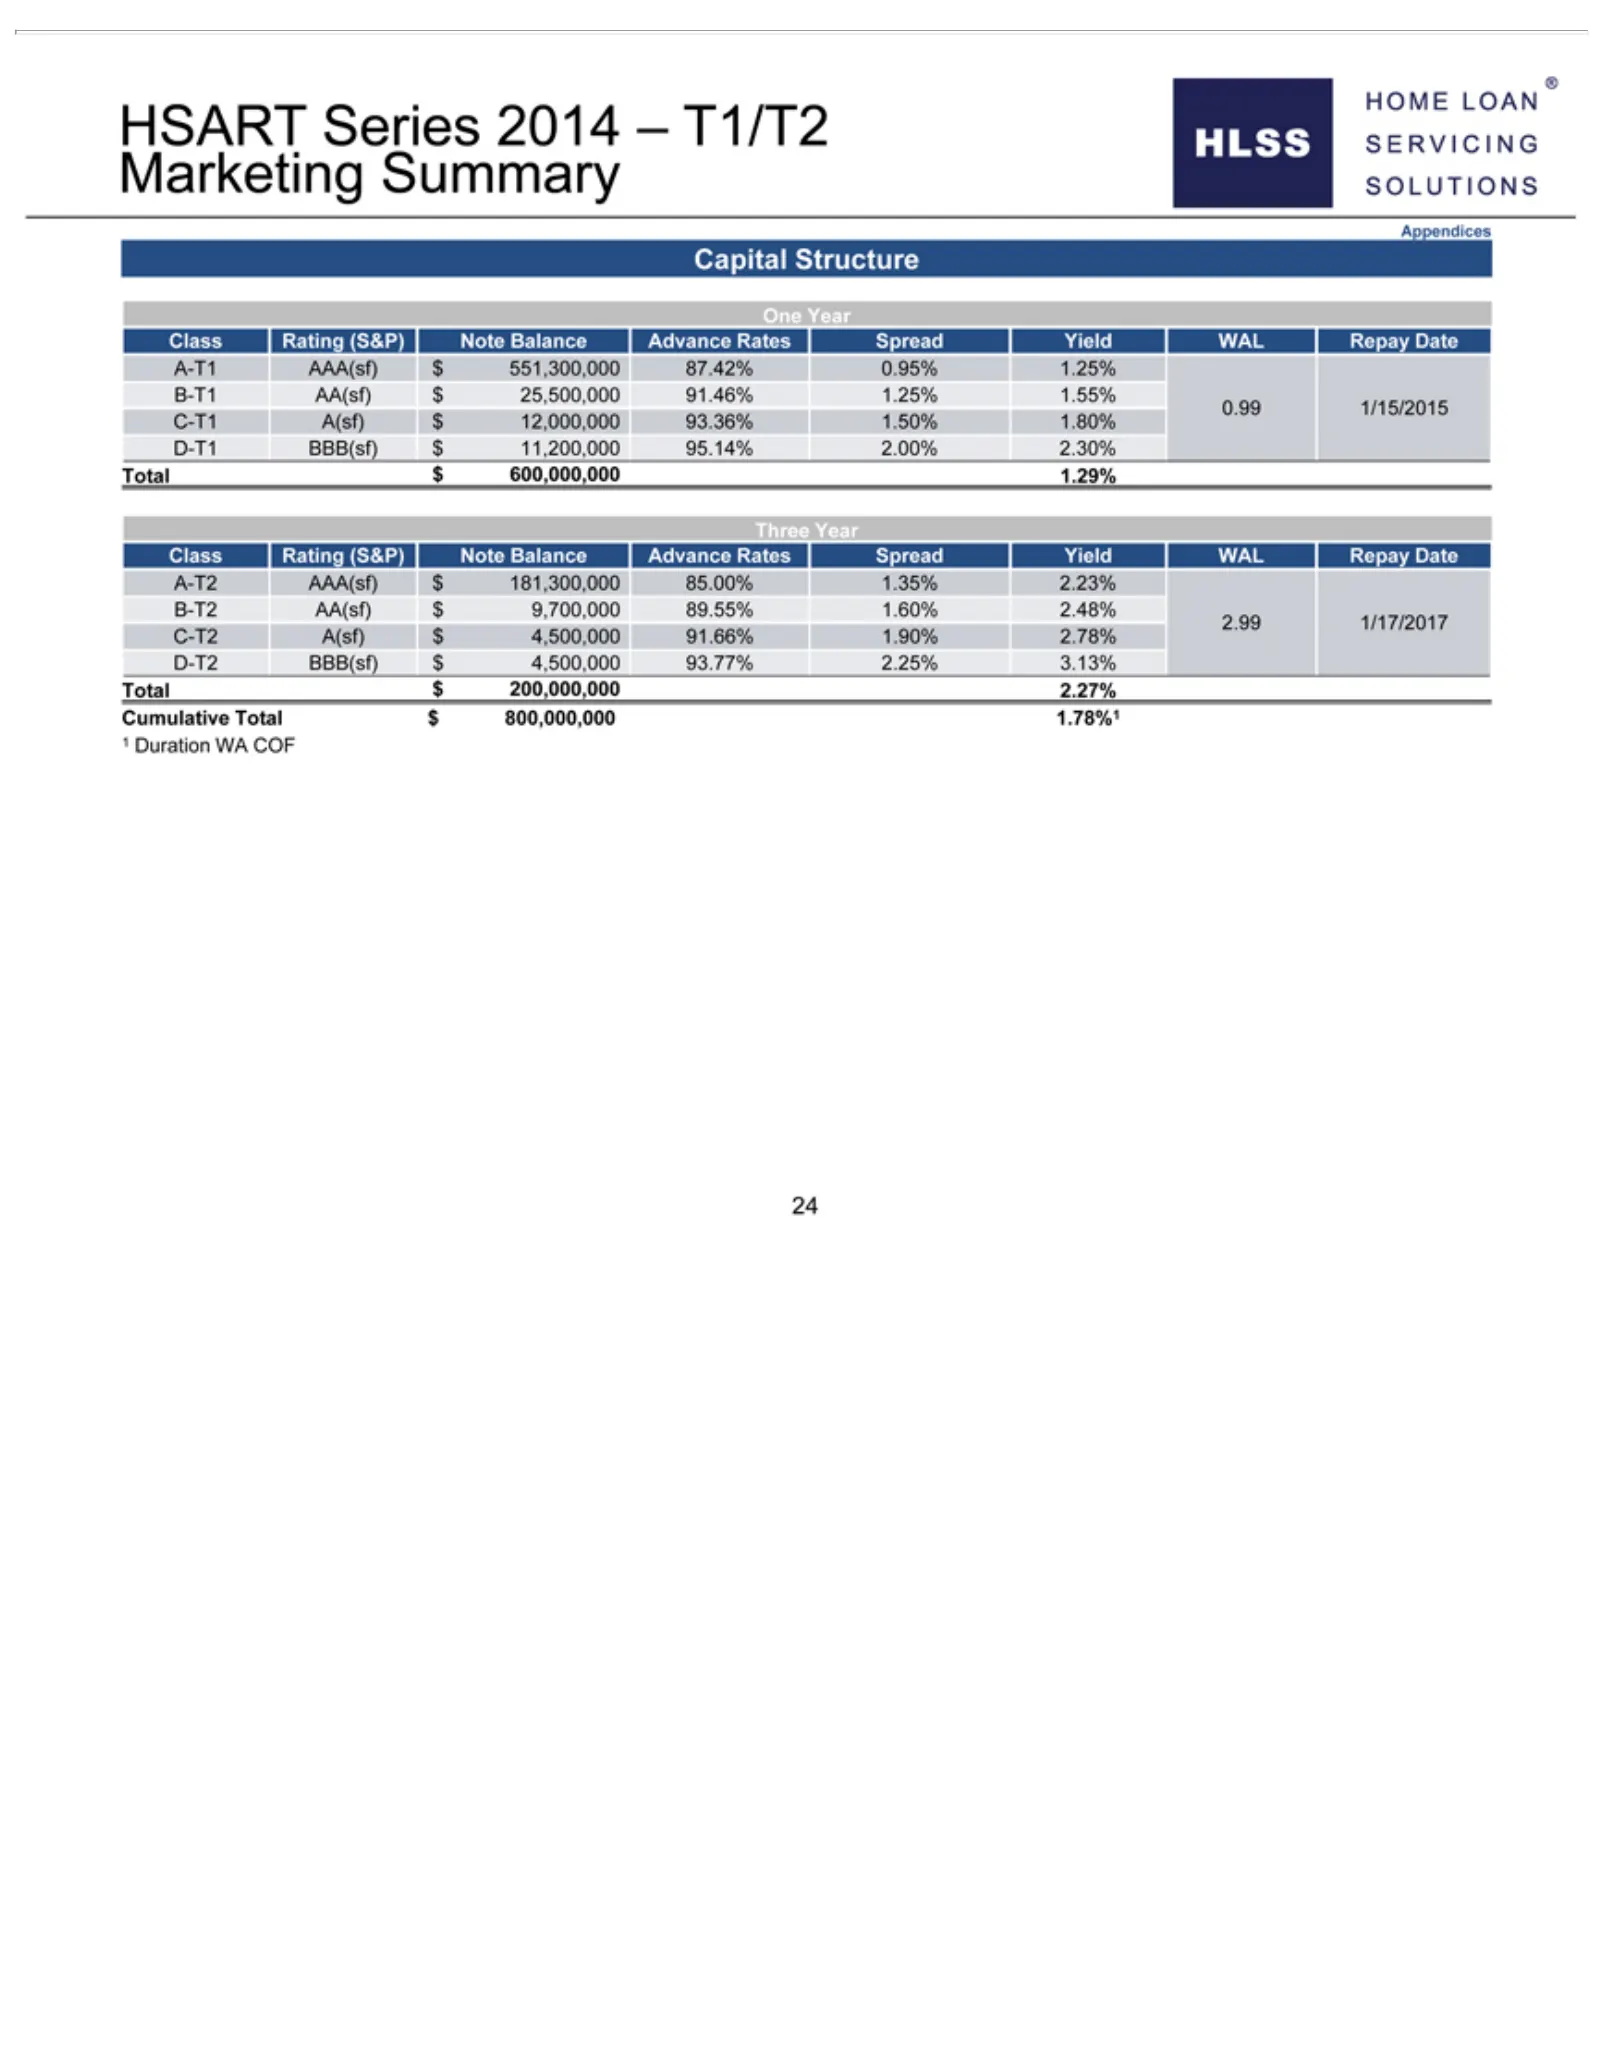
Slide 31: HSART 2014 Series T1/T2 Marketing Summary
HSART 0.95% Year A(sf)Class $1.25% 4,500,000 Series Rating B-T1 2014 91.66% (S&P) AA(sf) – T1/T2 Note 1.90% $ 25,500,000 Marketing Balance 2.78%Advance Summary D-T2 91.46% BBB(sf) Rates 1.25% Appendices Spread $1.55% 4,500,000 Yield Capital 0.99 93.77% WAL 1/15/2015 Structure Repay 2.25% C-T1 One Da
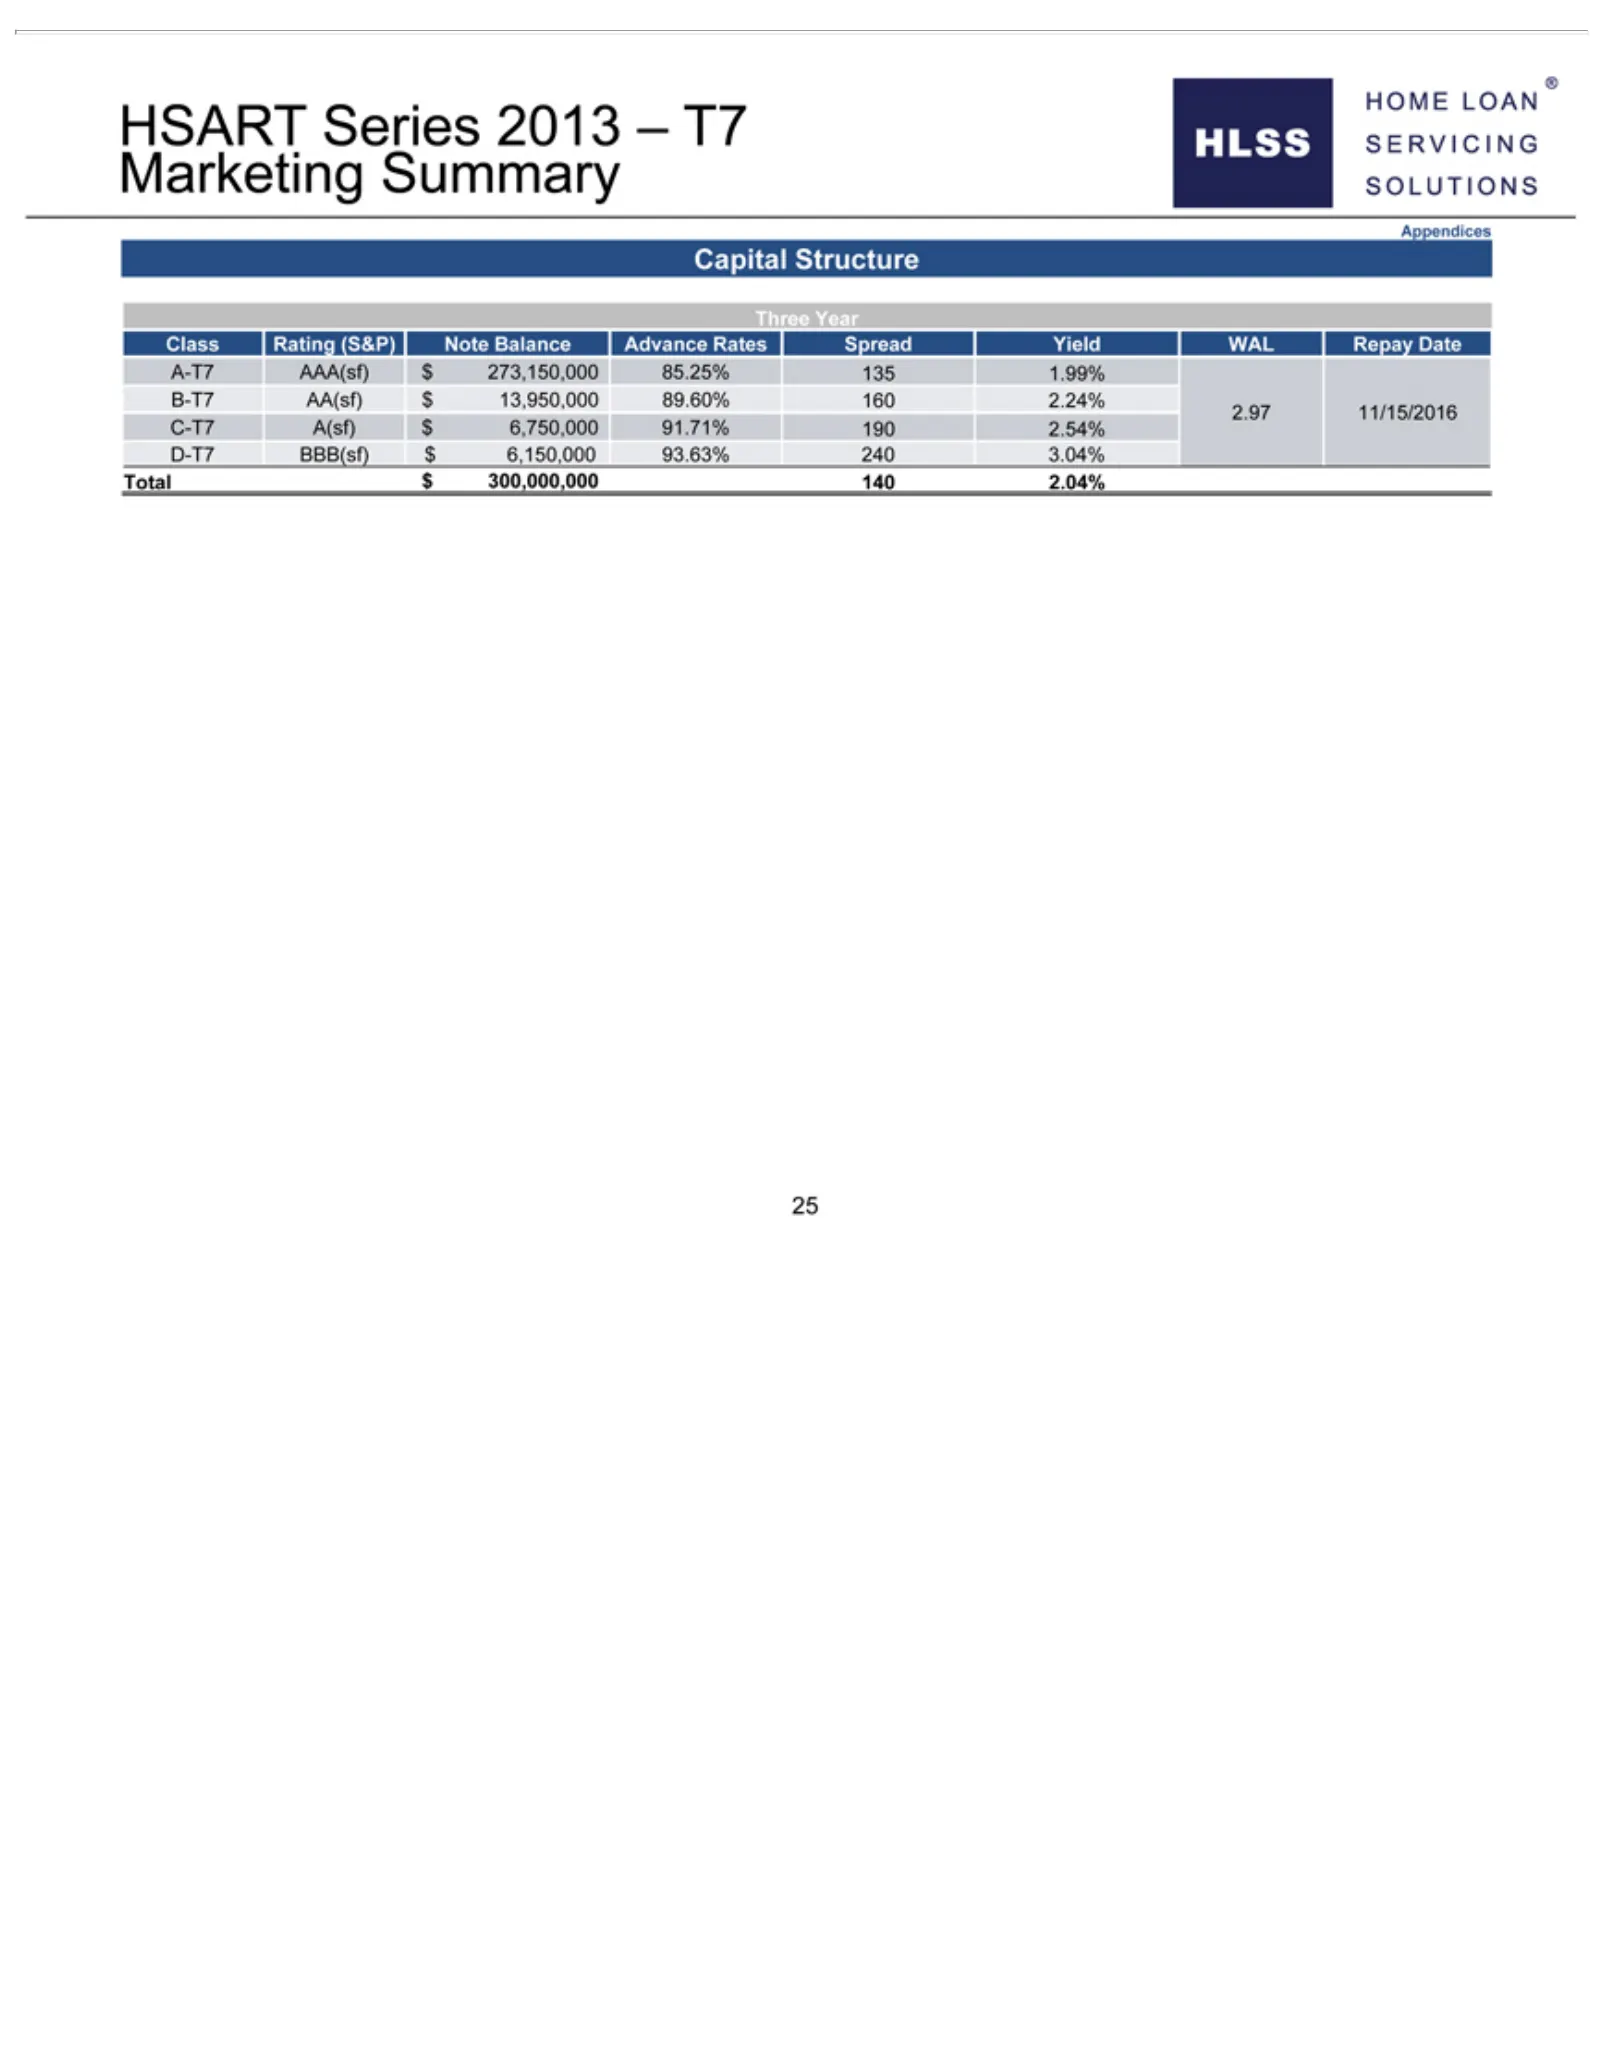
Slide 32: HSART 2013 Series T7 Marketing Summary
HSART 135 1.99% Series B-T7 2013 AA(sf) – T7$Marketing 13,950,000Summary 89.60% 160 Appendices 2.24% 2.97 Capital 11/15/2016 Structure C-T7 Three A(sf) Year $ 6,750,000 Class Rating 91.71% (S&P)190 Note 2.54% Balance D-T7Advance BBB(sf)Rates $ 6,150,000 Spread Yield 93.63%WAL 240Repay 3.04%Date Tota
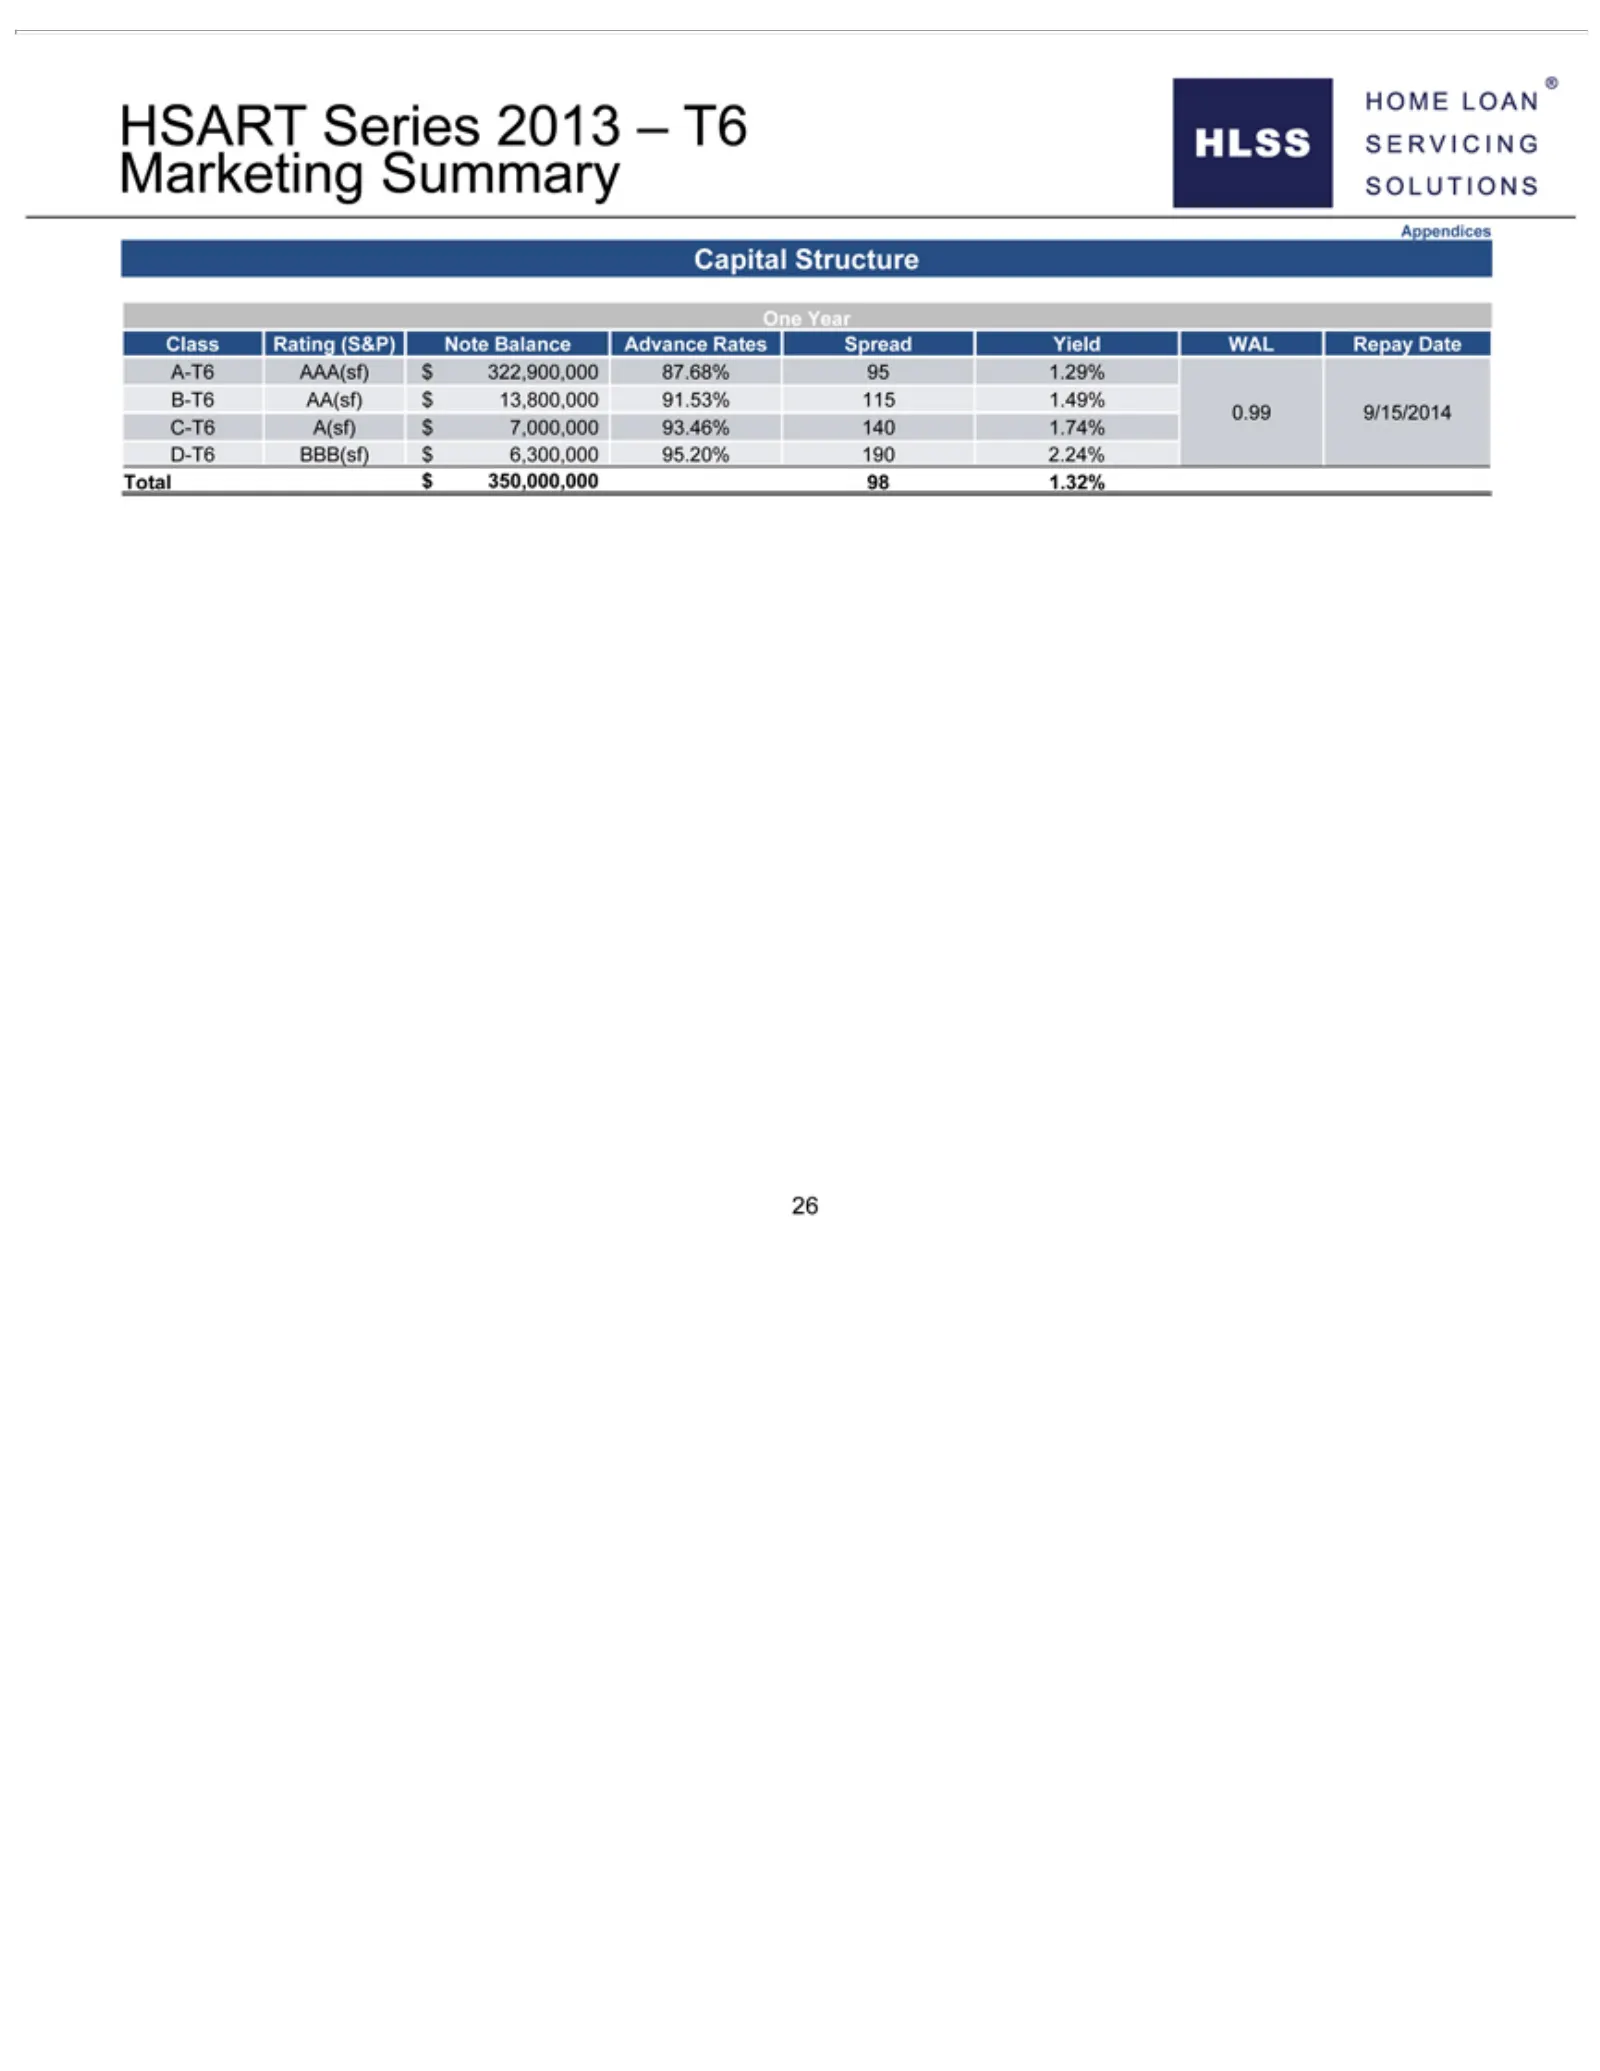
Slide 33: HSART 2013 Series T6 Marketing Summary
HSARTB-T6 1.29% Series AA(sf) 2013 $– 13,800,000 T6 Marketing 91.53% Summary 115 1.49% Appendices 0.99 9/15/2014 Capital Structure C-T6 A(sf) One$Year 7,000,000 Class Rating 93.46%(S&P) 140 1.74% Note Balance D-T6 BBB(sf) Advance $ 6,300,000 Rates Spread 95.20% Yield190 WAL2.24% Repay Total Date $ 3
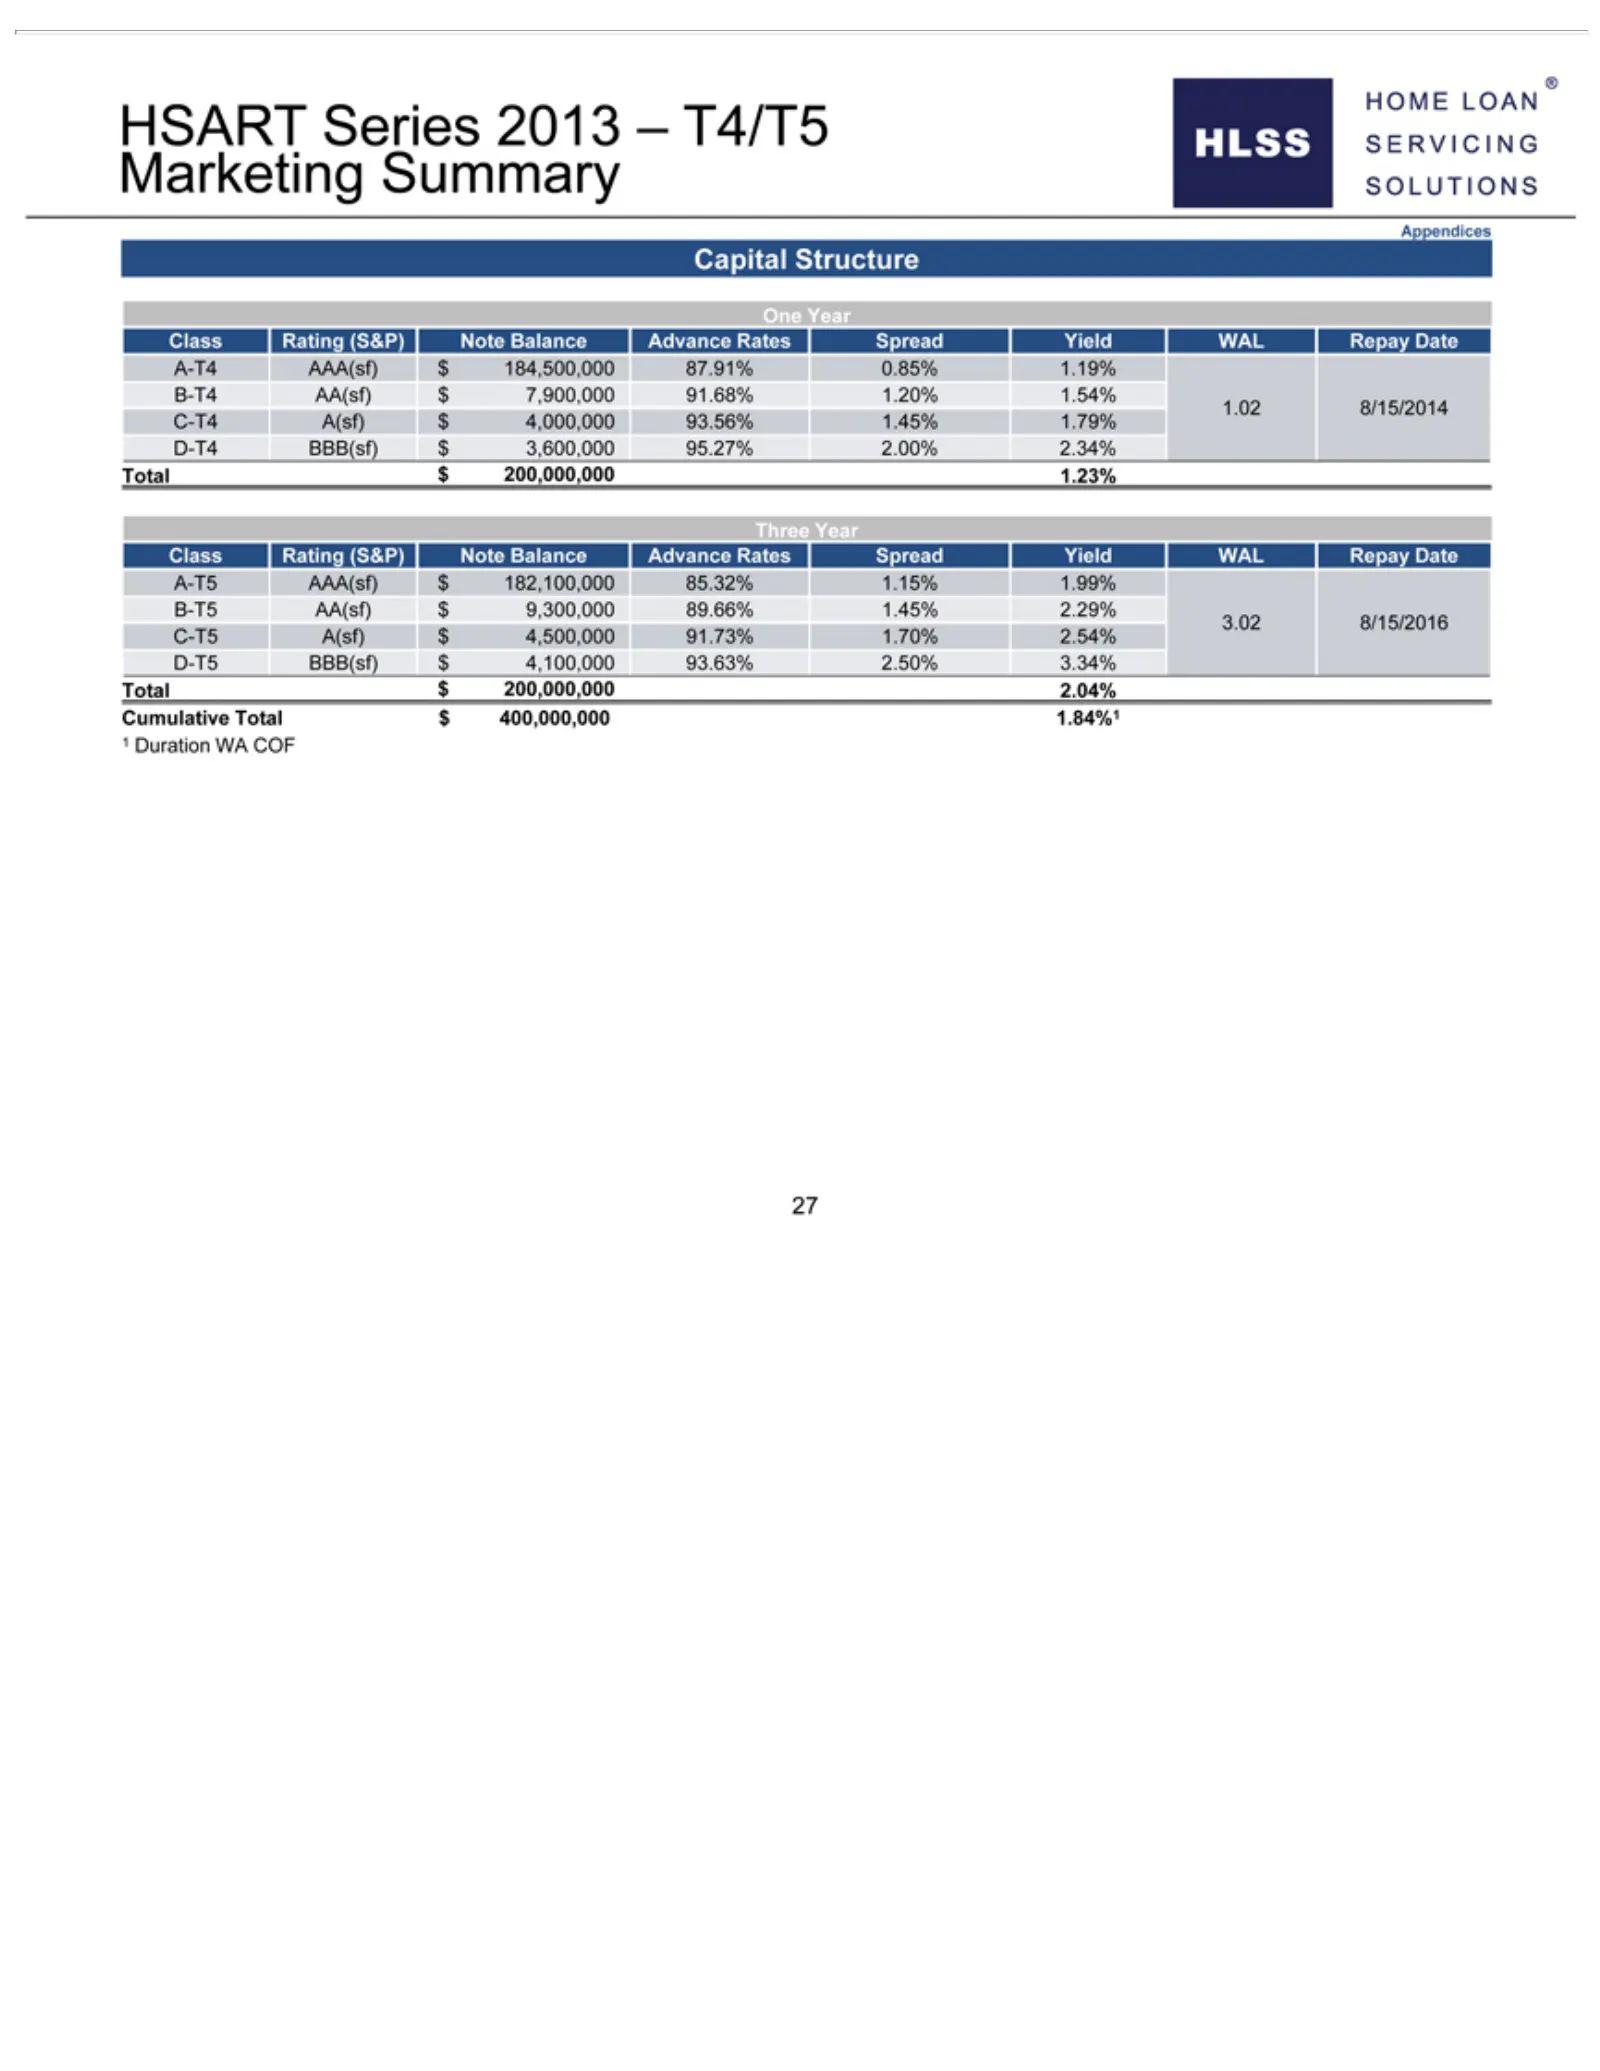
Slide 34: HSART 2013 Series T4/T5 Marketing Summary
HSART 0.85% Year A(sf)Class $1.19% 4,500,000 Series Rating B-T4 2013 91.73% (S&P) AA(sf) – T4/T5 Note 1.70% $ 7,900,000 Marketing Balance 2.54%Advance 91.68% Summary D-T5 BBB(sf) 1.20% Rates Appendices Spread 1.54% $ 4,100,000 1.02 Yield Capital 8/15/2014 93.63% WALStructure Repay 2.50% C-T4 One Dat
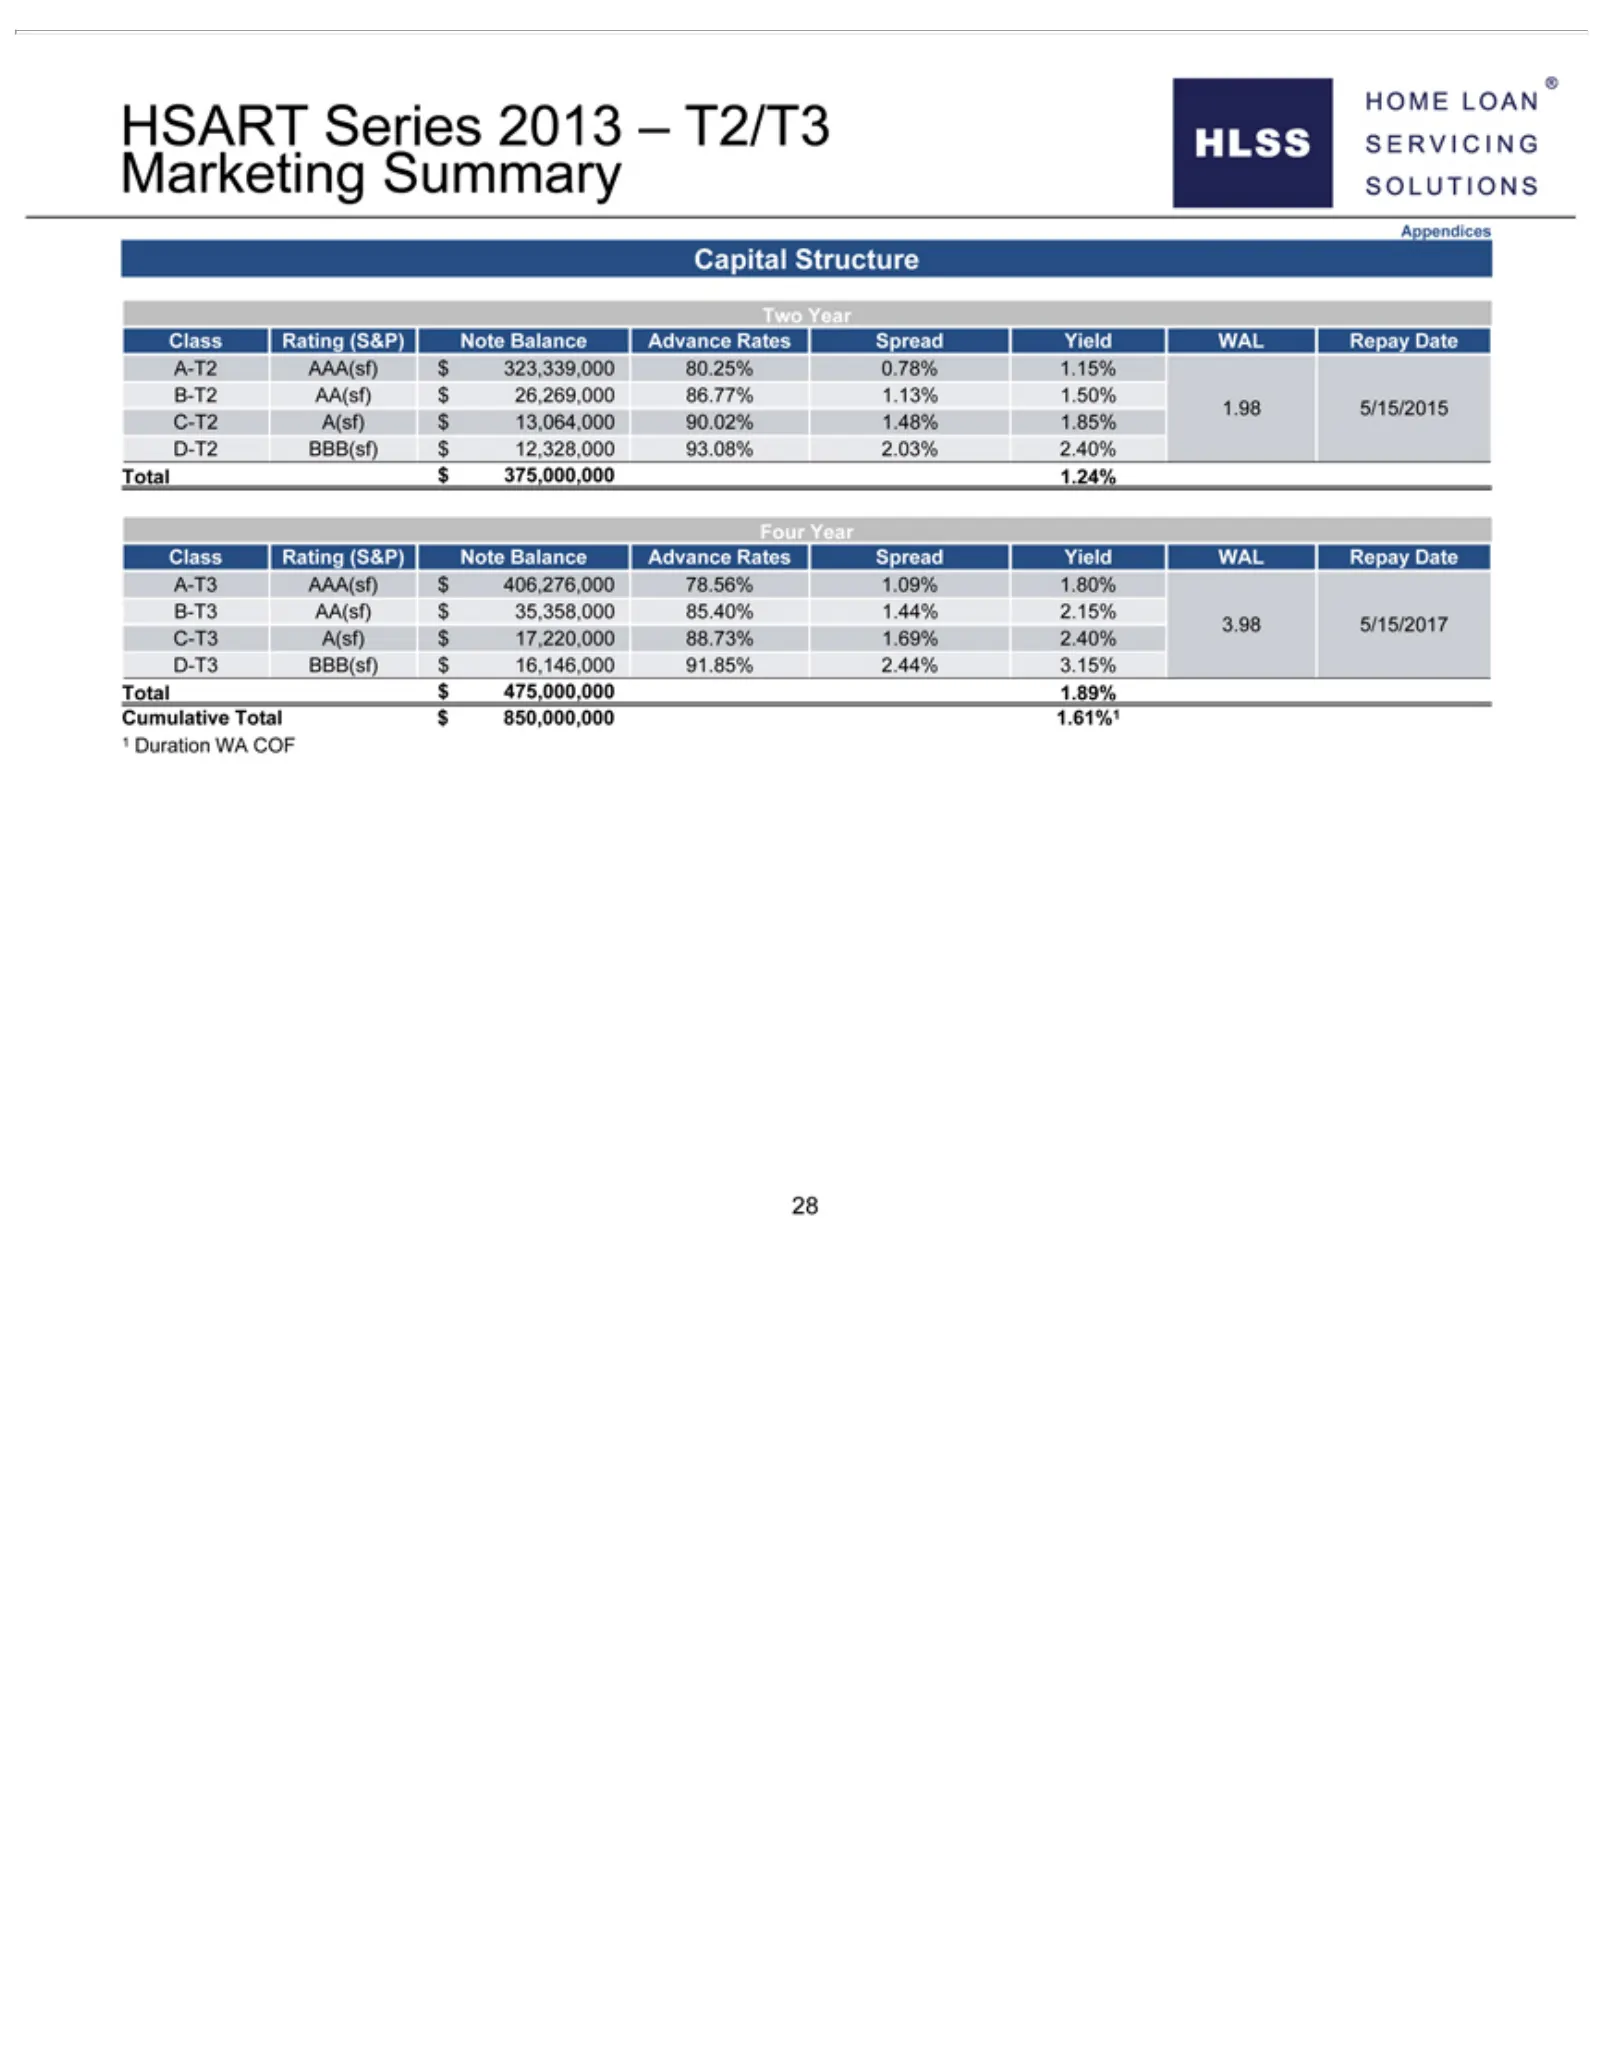
Slide 35: HSART 2013 Series T2/T3 Marketing Summary
HSART 0.78% Year A(sf)Class $1.15% 17,220,000 Series Rating B-T2 2013 (S&P) 88.73% AA(sf) – T2/T3 Note $1.69% 26,269,000 Marketing Balance 2.40%Advance Summary 86.77% D-T3 BBB(sf) Rates 1.13% Appendices Spread 1.50% $ 16,146,000 Yield Capital 1.98 WAL 5/15/2015 91.85% Structure Repay 2.44% C-T2 Two
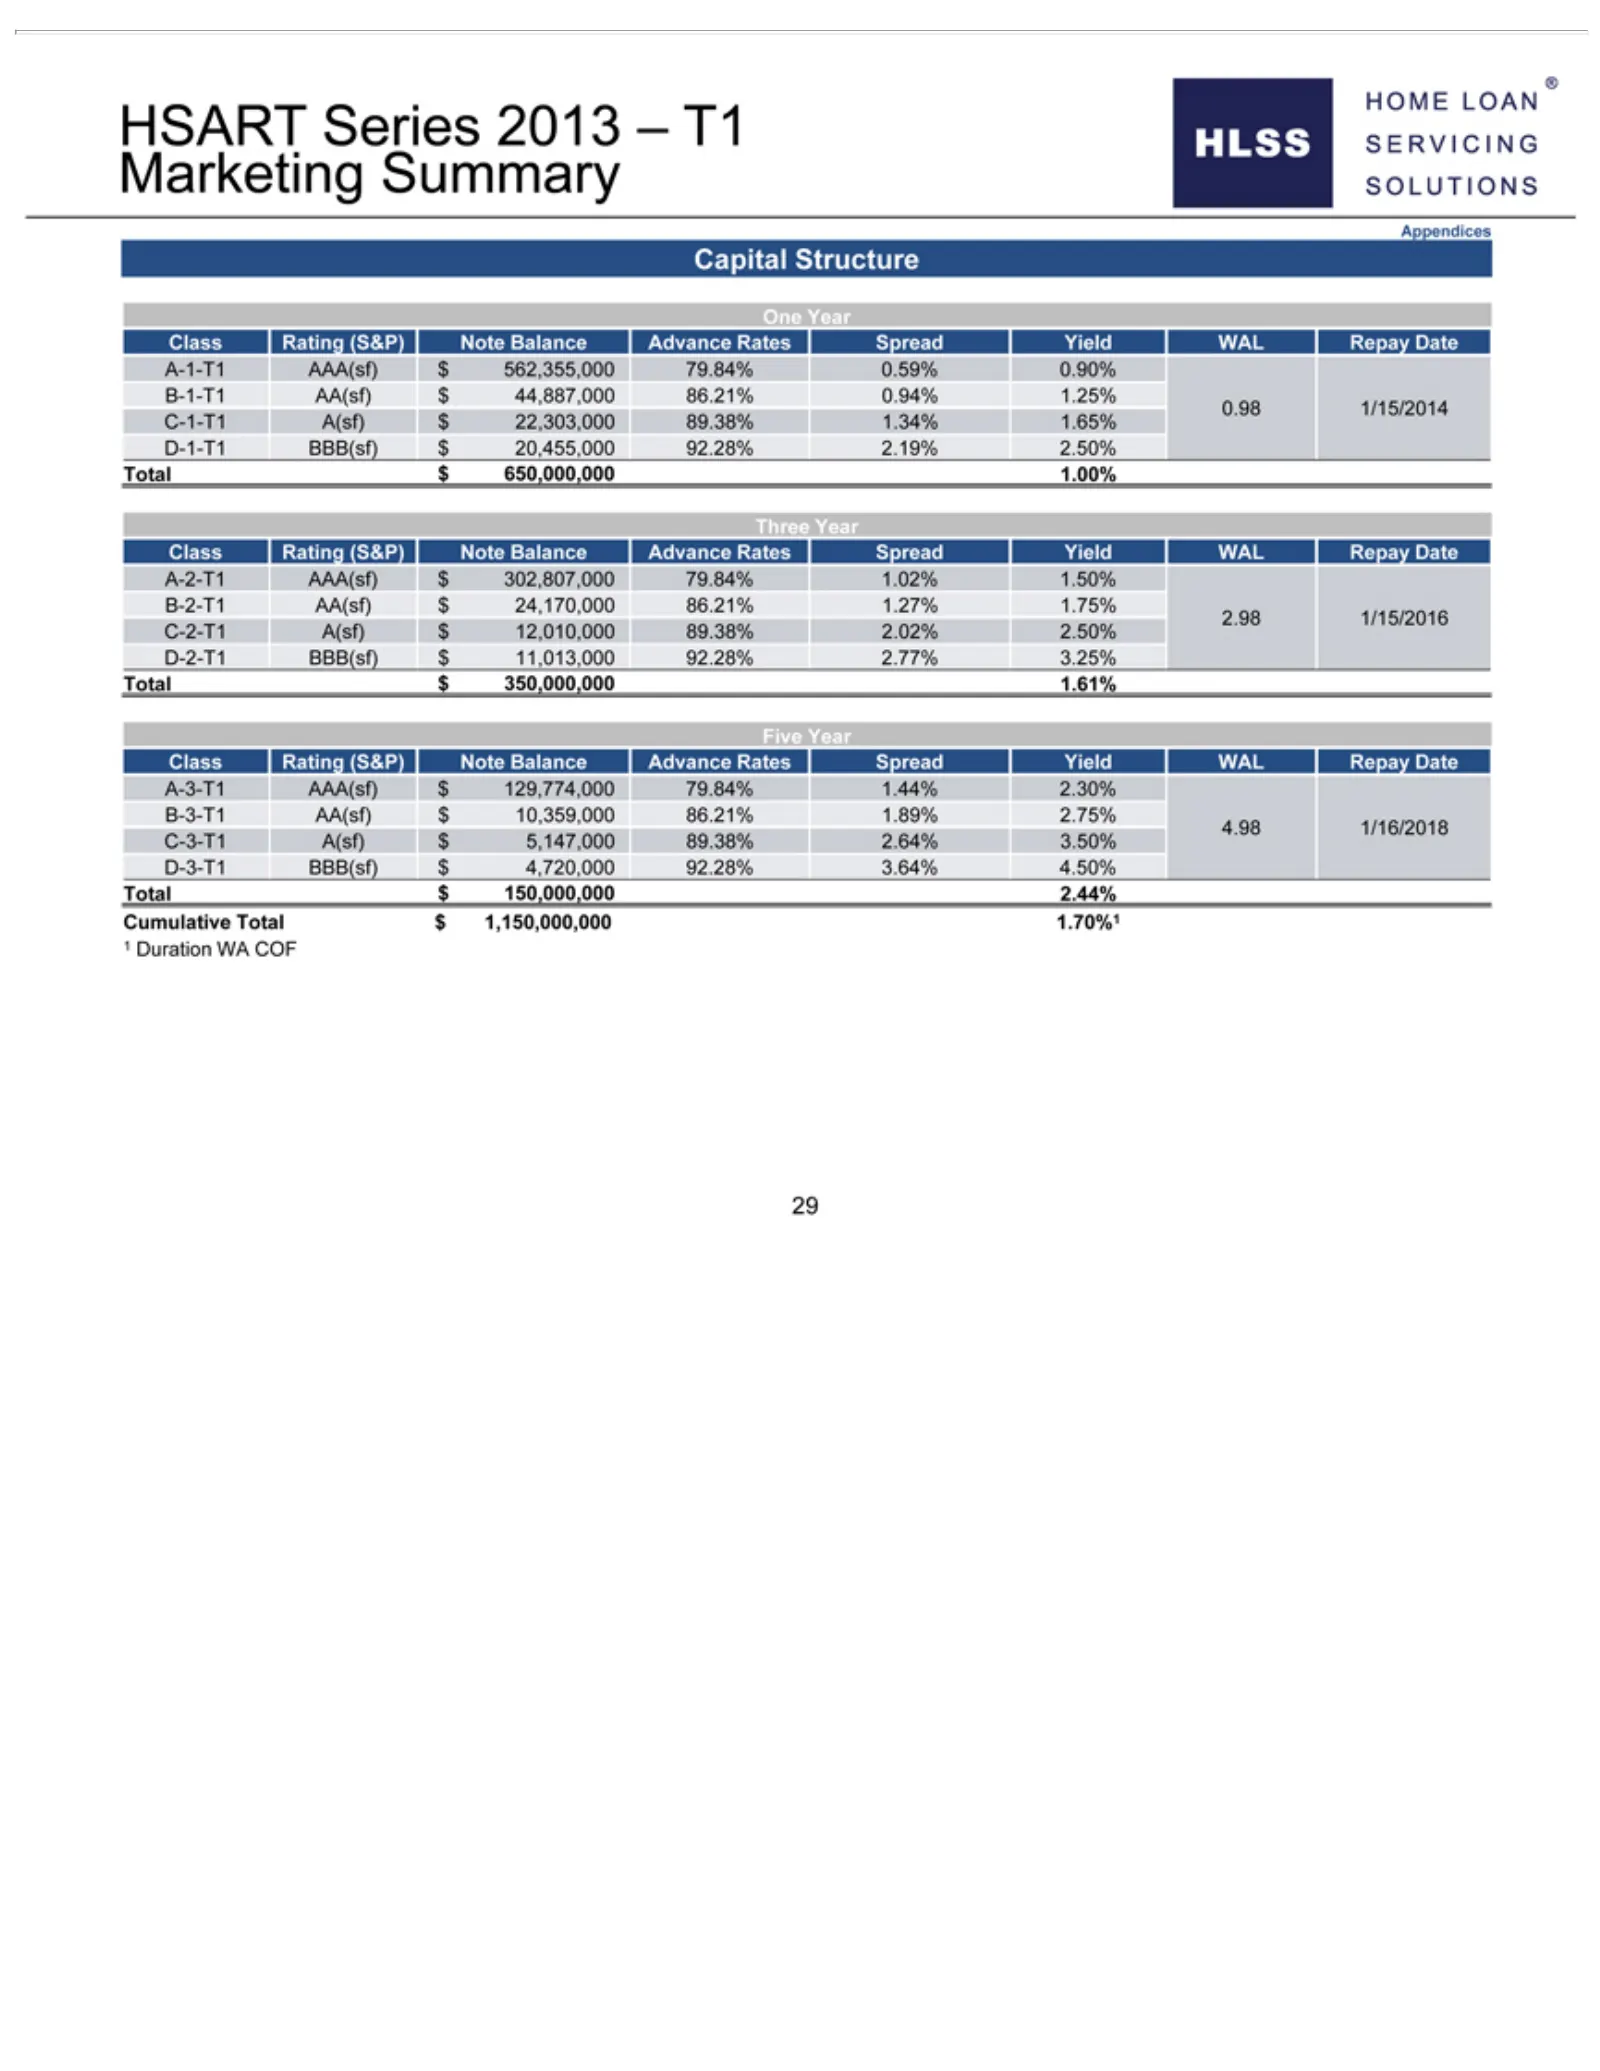
Slide 36: HSART 2013 Series T1 Marketing Summary
HSART 0.59% Three 1/15/2016 Yield $ 4,720,000 WAL Year 0.90% Series C-2-T1 Class Repay 92.28% B-1-T1 2013 Rating A(sf) Date 3.64% –AA(sf) T1A-3-T1 $(S&P) Marketing 12,010,000 4.50% $ 44,887,000 Note AAA(sf) Total Summary Balance 89.38% $$150,000,000 86.21% 129,774,000 Advance 2.02% Appendices 0.94%
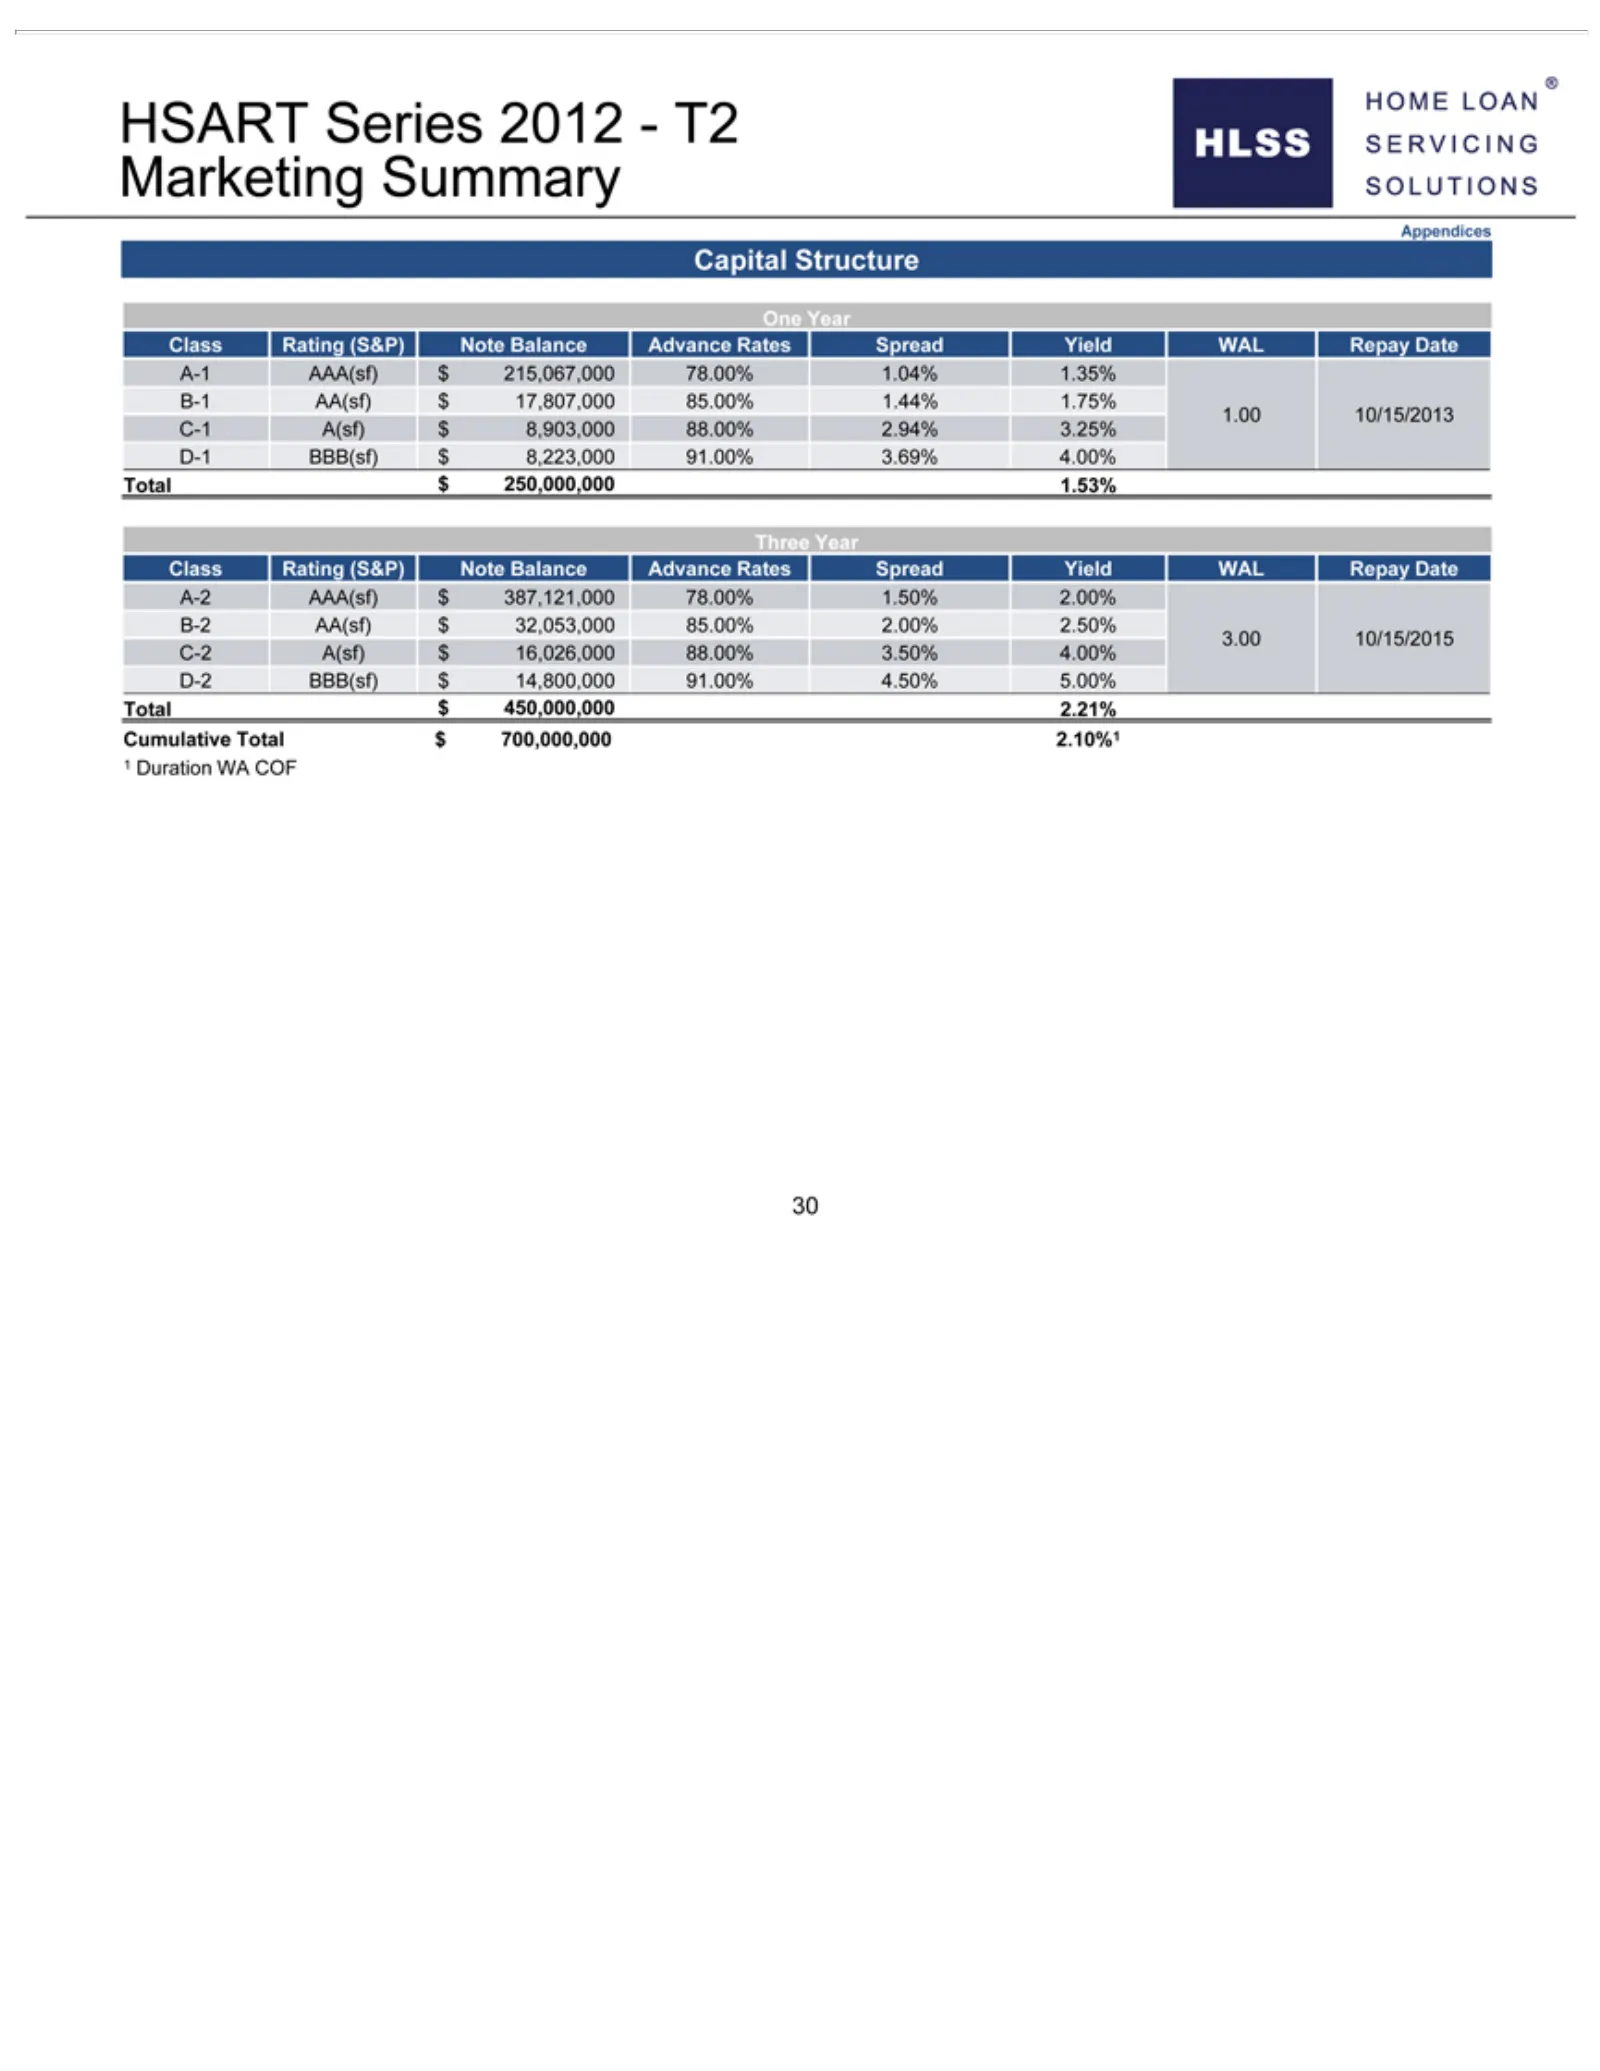
Slide 37: HSART 2012 Series T2 Marketing Summary
HSART 1.04% Class 16,026,000 Rating 1.35% Series 88.00% (S&P) B-1 2012—T2 AA(sf) 3.50% Note Balance $Marketing 4.00% 17,807,000 Advance D-2Summary BBB(sf) 85.00% Rates Appendices $1.44% 14,800,000 Spread 1.75% Yield Capital 91.00% 1.00 WAL 10/15/2013 Structure Repay 4.50%Date 5.00% One C-1 A-2 Year
Slide 38: Appendix: Performance
Appendix: Performance
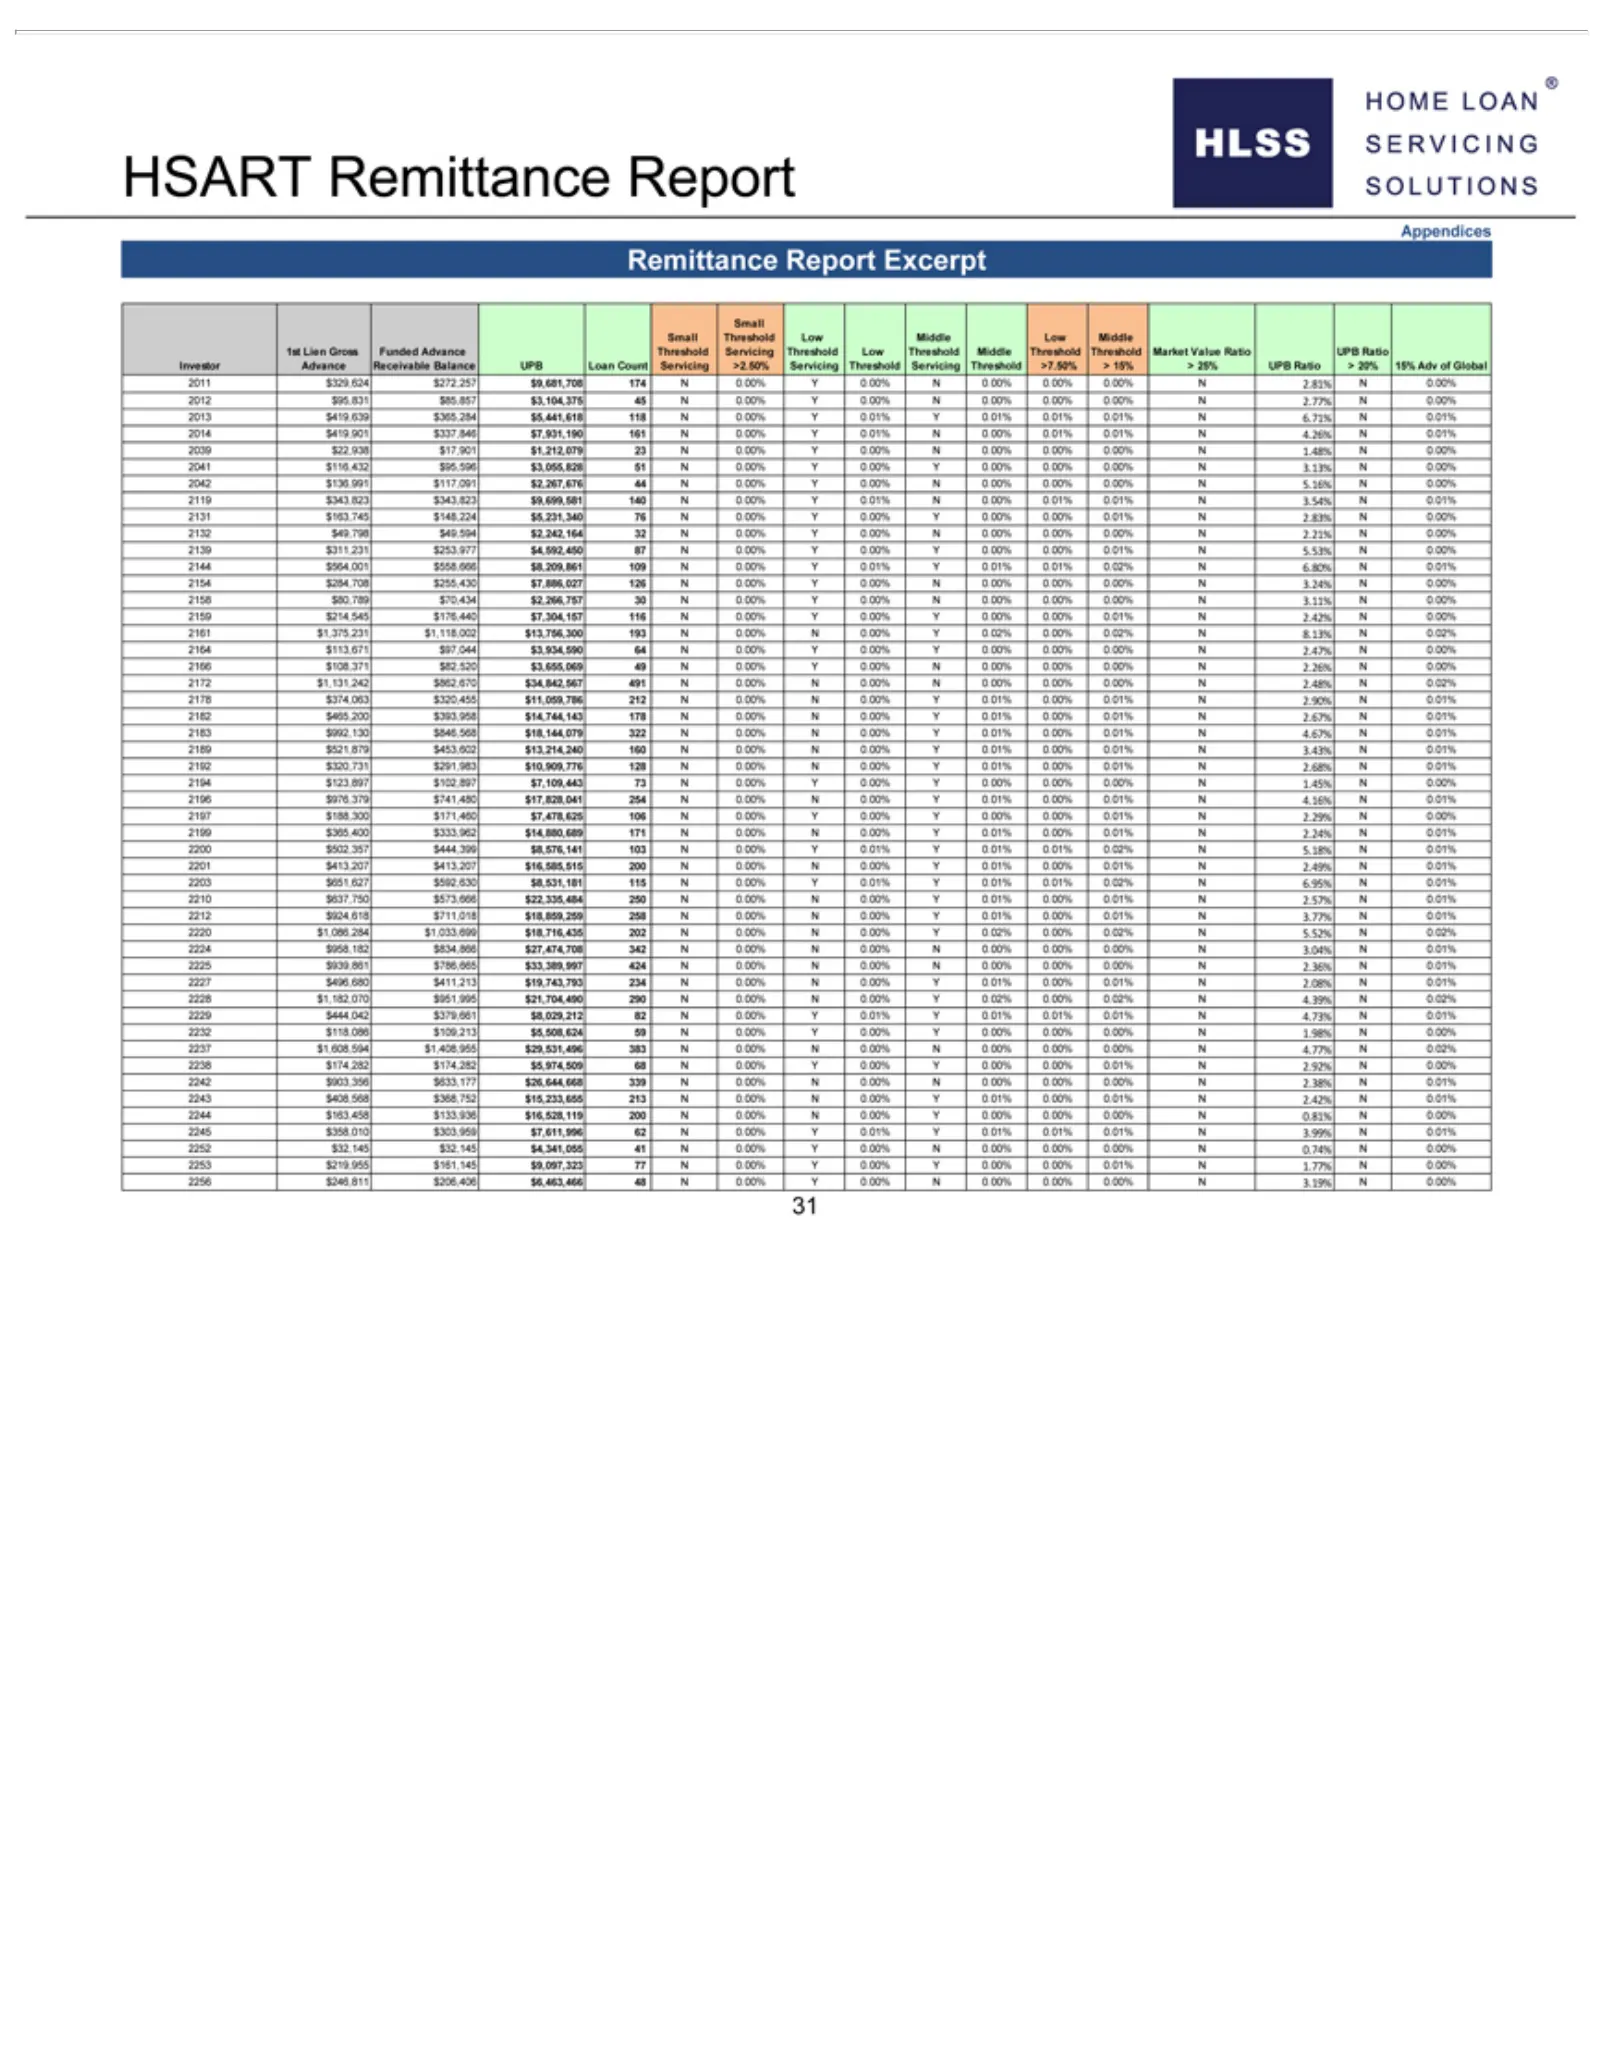
Slide 39: HSART Remittance Report Threshold Data
HSART Threshold 15% 2042 $163,745 $253,977 $255,430 $7,304,157 $3,934,590 $34,842,567 $14,744,143 $13,214,240 $7,109,443 $7,478,625 $444,399 $592,630 $711,018 $834,866 $411,213 $379,661 $1,408,955 N0.00% N0.01% 2256 Adv $136,991 $246,811 Remittance 2013 2039 2242 2244 2252 $18,859,259 $19,743,793 of
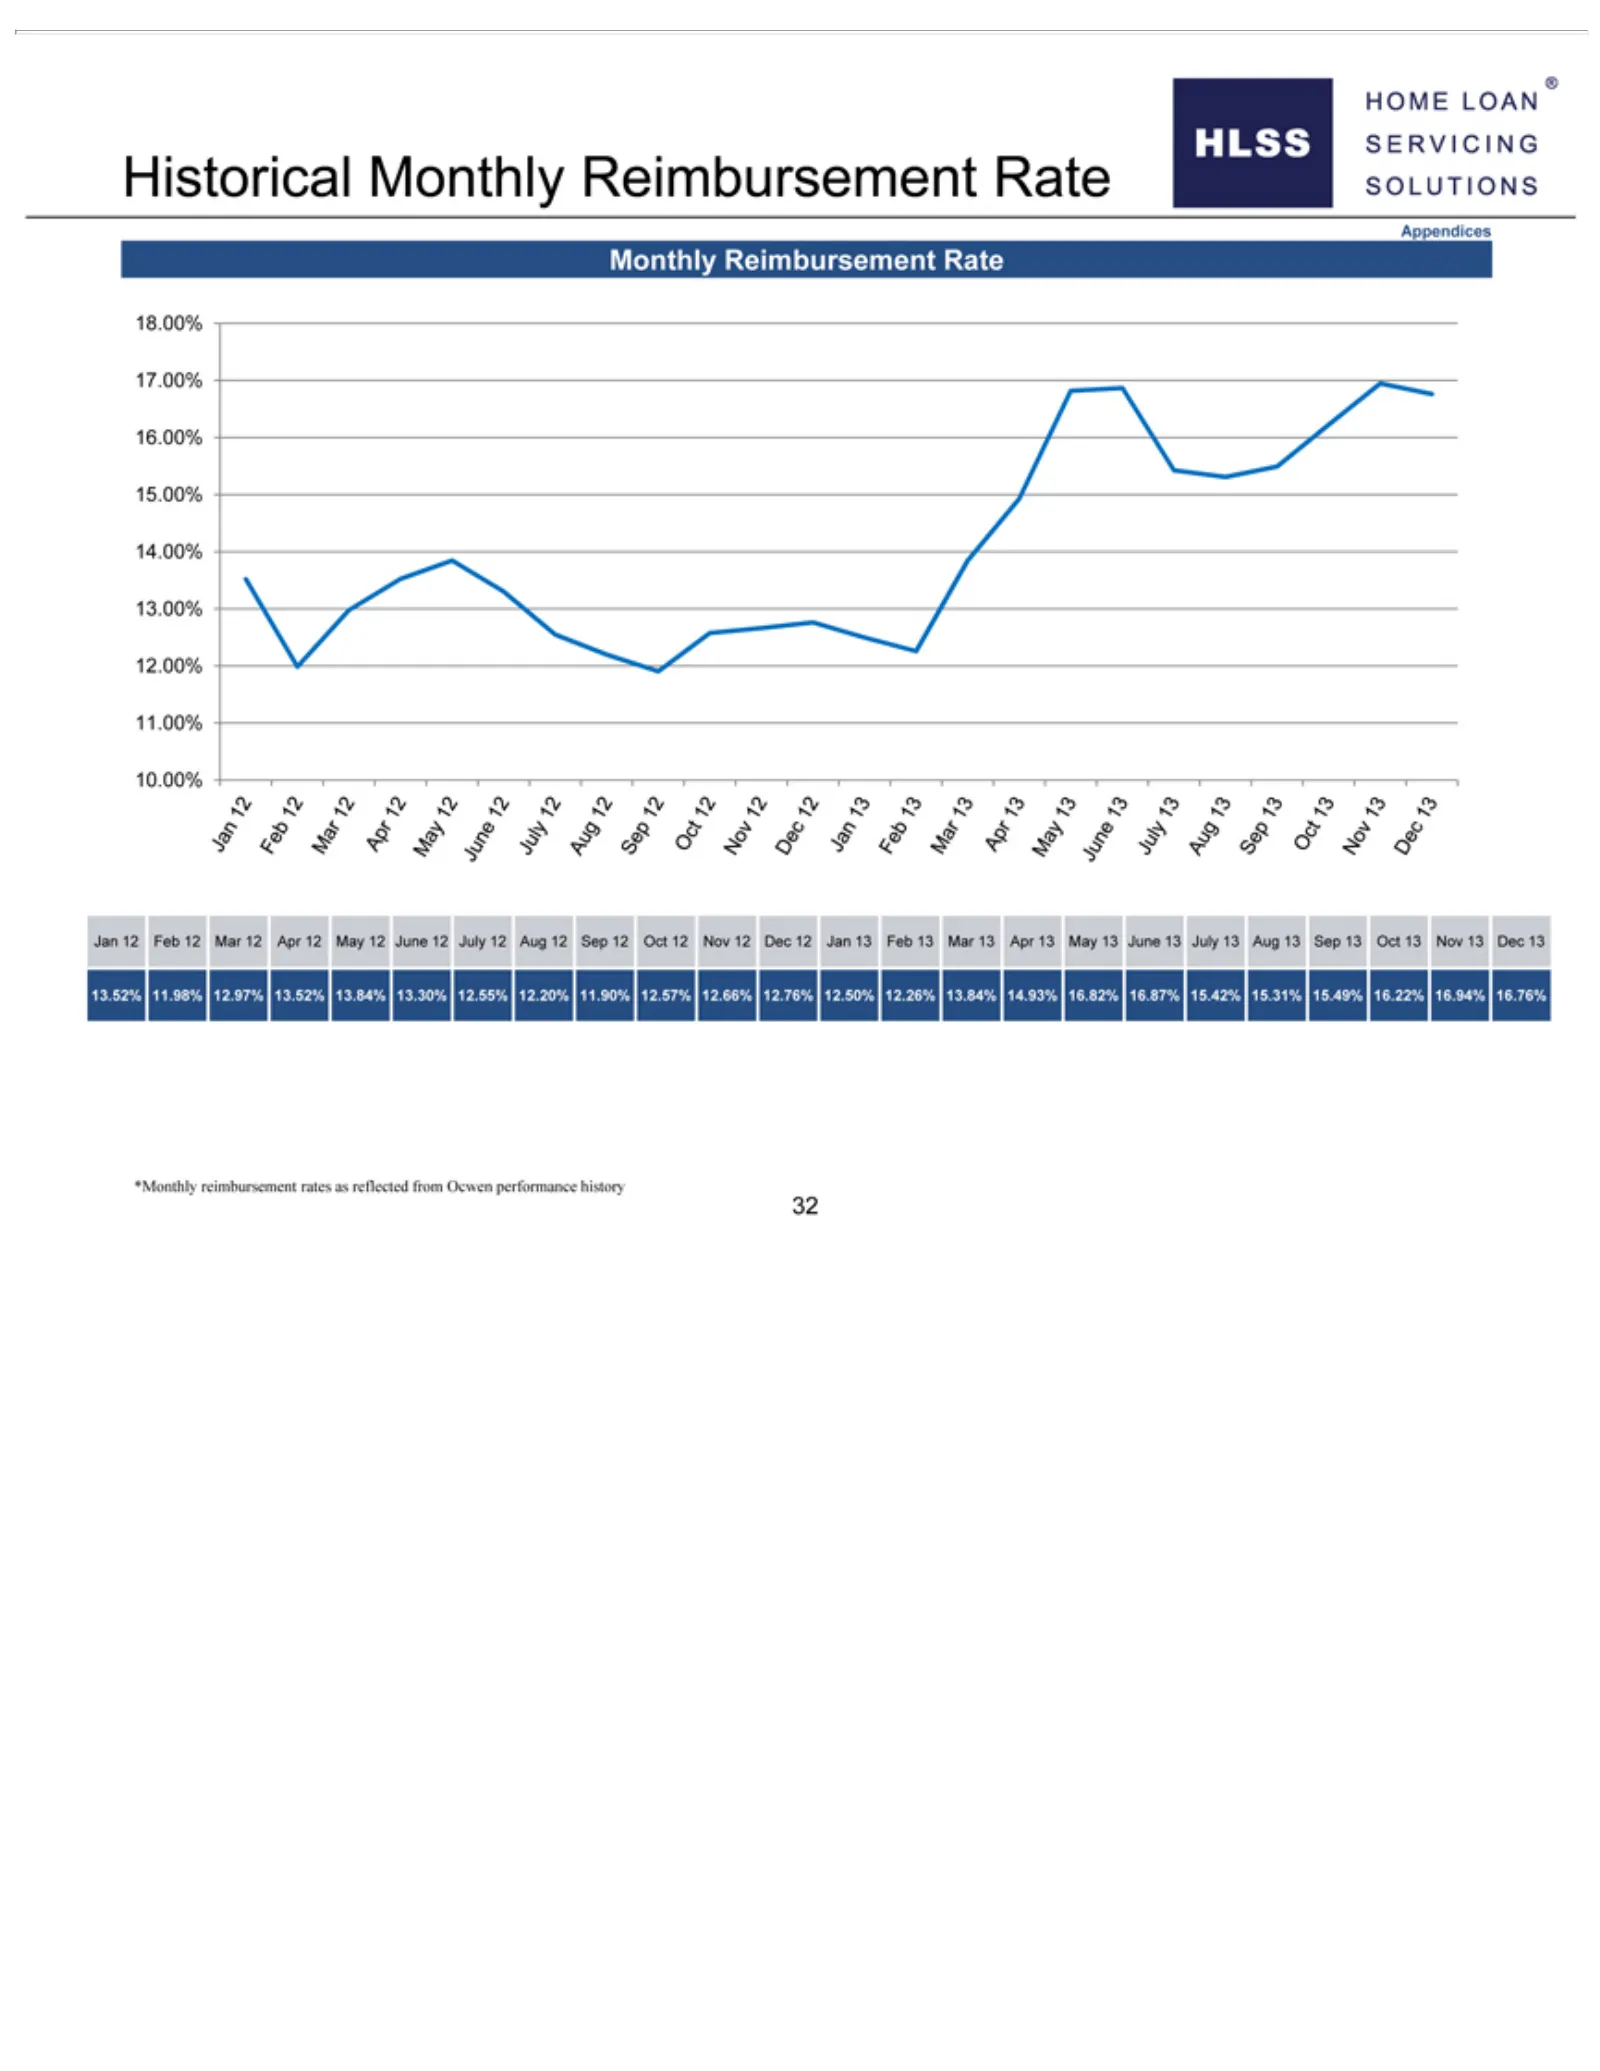
Slide 40: Historical Monthly Reimbursement Rate
Historical 12 12.55% performance May 12.20% 12Monthly June history 11.90% 12 Reimbursement July 32 12 12.57% Aug 12 12.66% Sep Rate12 Appendices 12.76% Oct 1212.50% NovMonthly 12 12.26% Dec Reimbursement 12 Jan 13.84% 13 Feb 14.93% 13Rate Mar 16.82% 18.00% 13 Apr16.87% 17.00% 13 May15.42% 16.00% 13
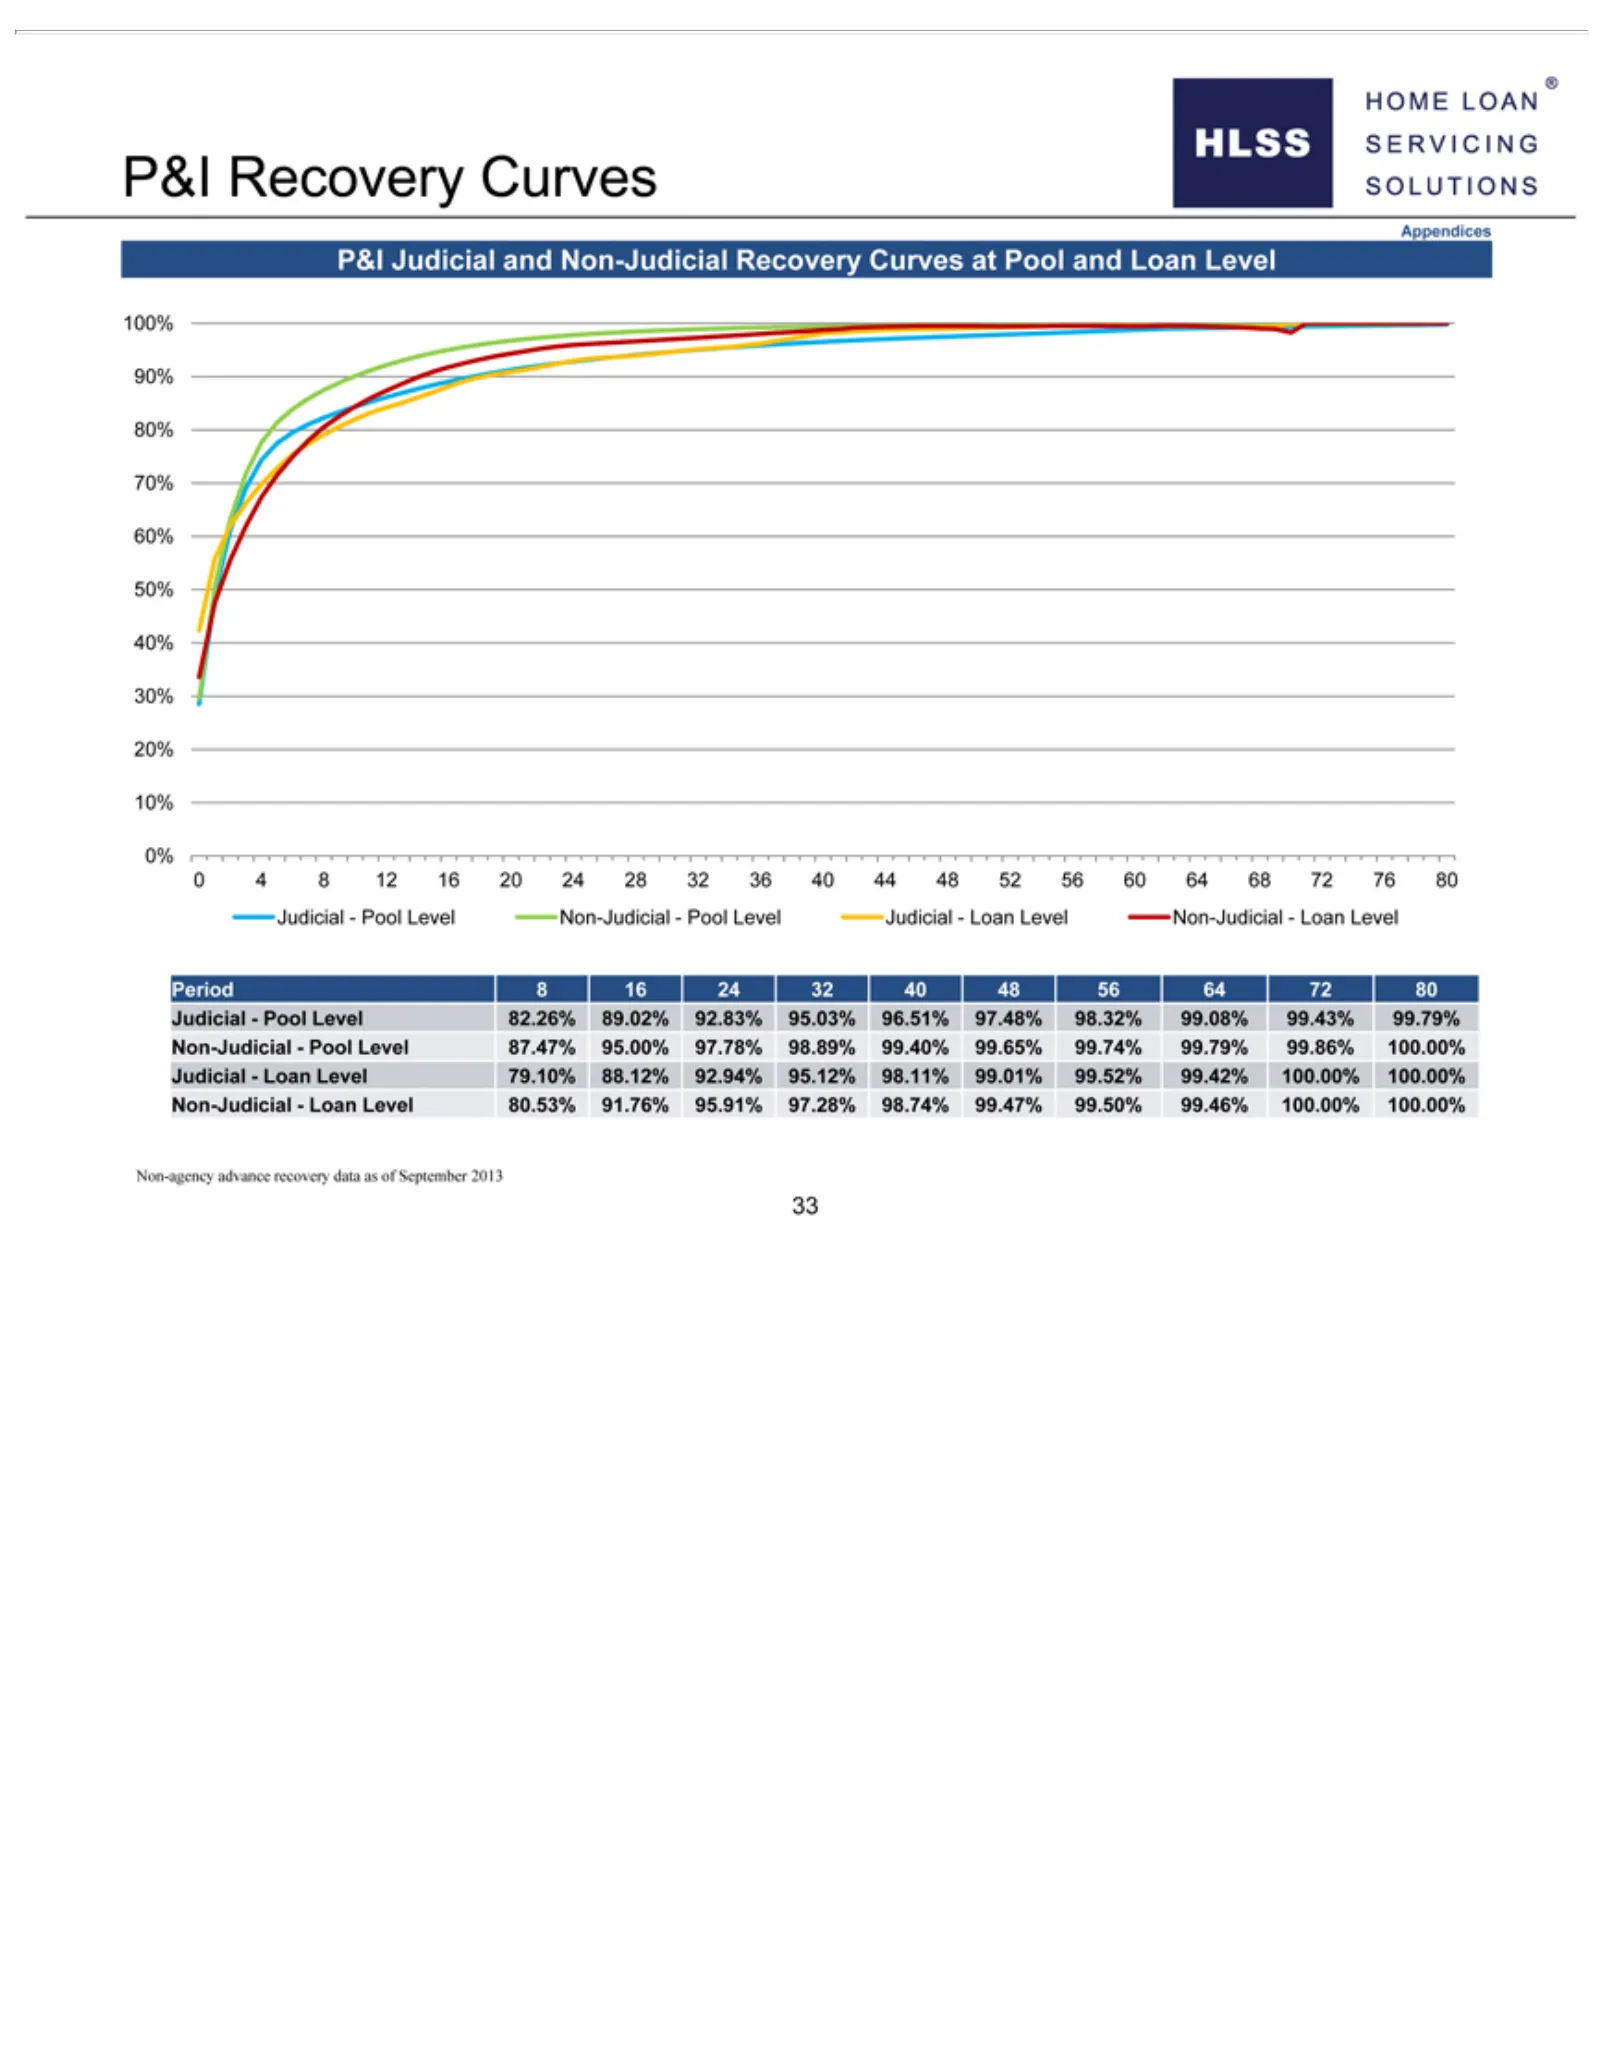
Slide 41: P&I Recovery Curves
P&I Recovery 64687276 97.48% 98.11% September 99.01% 98.32% 80 2013 Judicial—Pool Curves 99.52% 99.08% 33 Appendices 99.42% 99.43% Level 100.00% 99.79% P&I Non-Judicial—Pool Judicial Non-Judicial—Pool 100.00% and Non-Judicial—Loan Non-Judicial Level Level Judicial—Loan Recovery 87.47% Level Curves 9
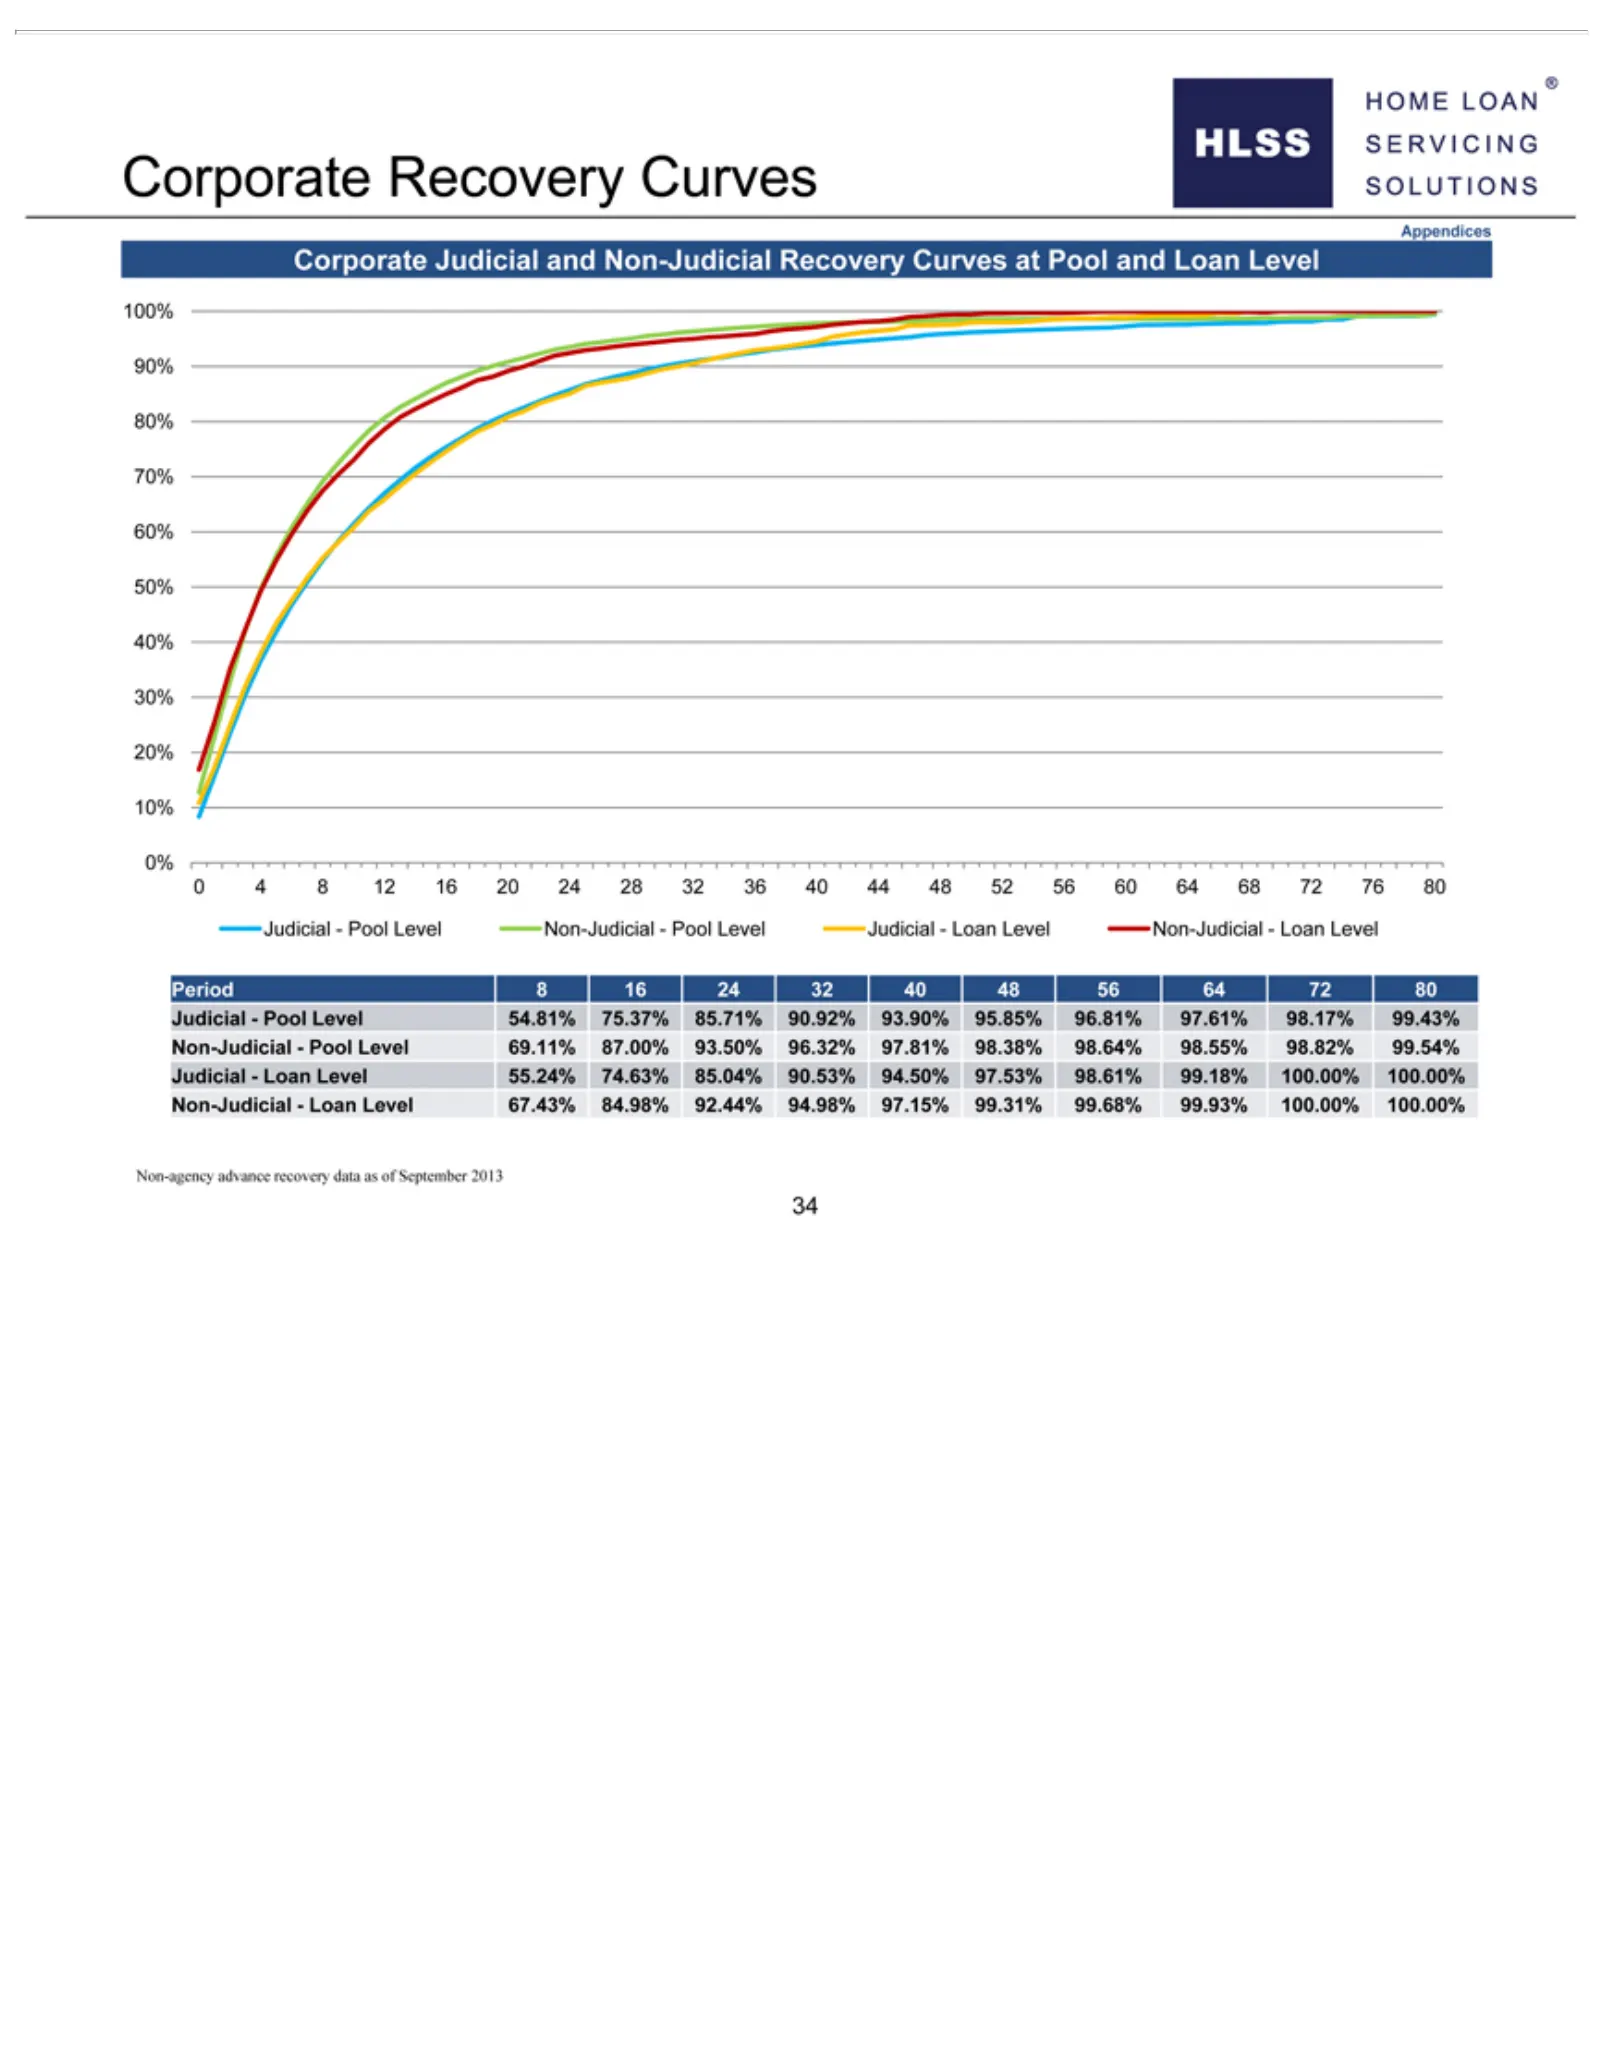
Slide 42: Corporate Recovery Curves
Corporate 485256 93.90% 90.53% of September 606468 95.85% 94.50% Recovery 2013 727680 96.81% 97.53% 34 Curves Judicial—Pool 97.61% 98.61% Appendices 98.17%Level 99.18% Corporate 99.43% 100.00% Non-Judicial—Pool Non-Judicial—Pool 100.00% Judicial and Non-Judicial—Loan Non-Judicial Level Level Judicia
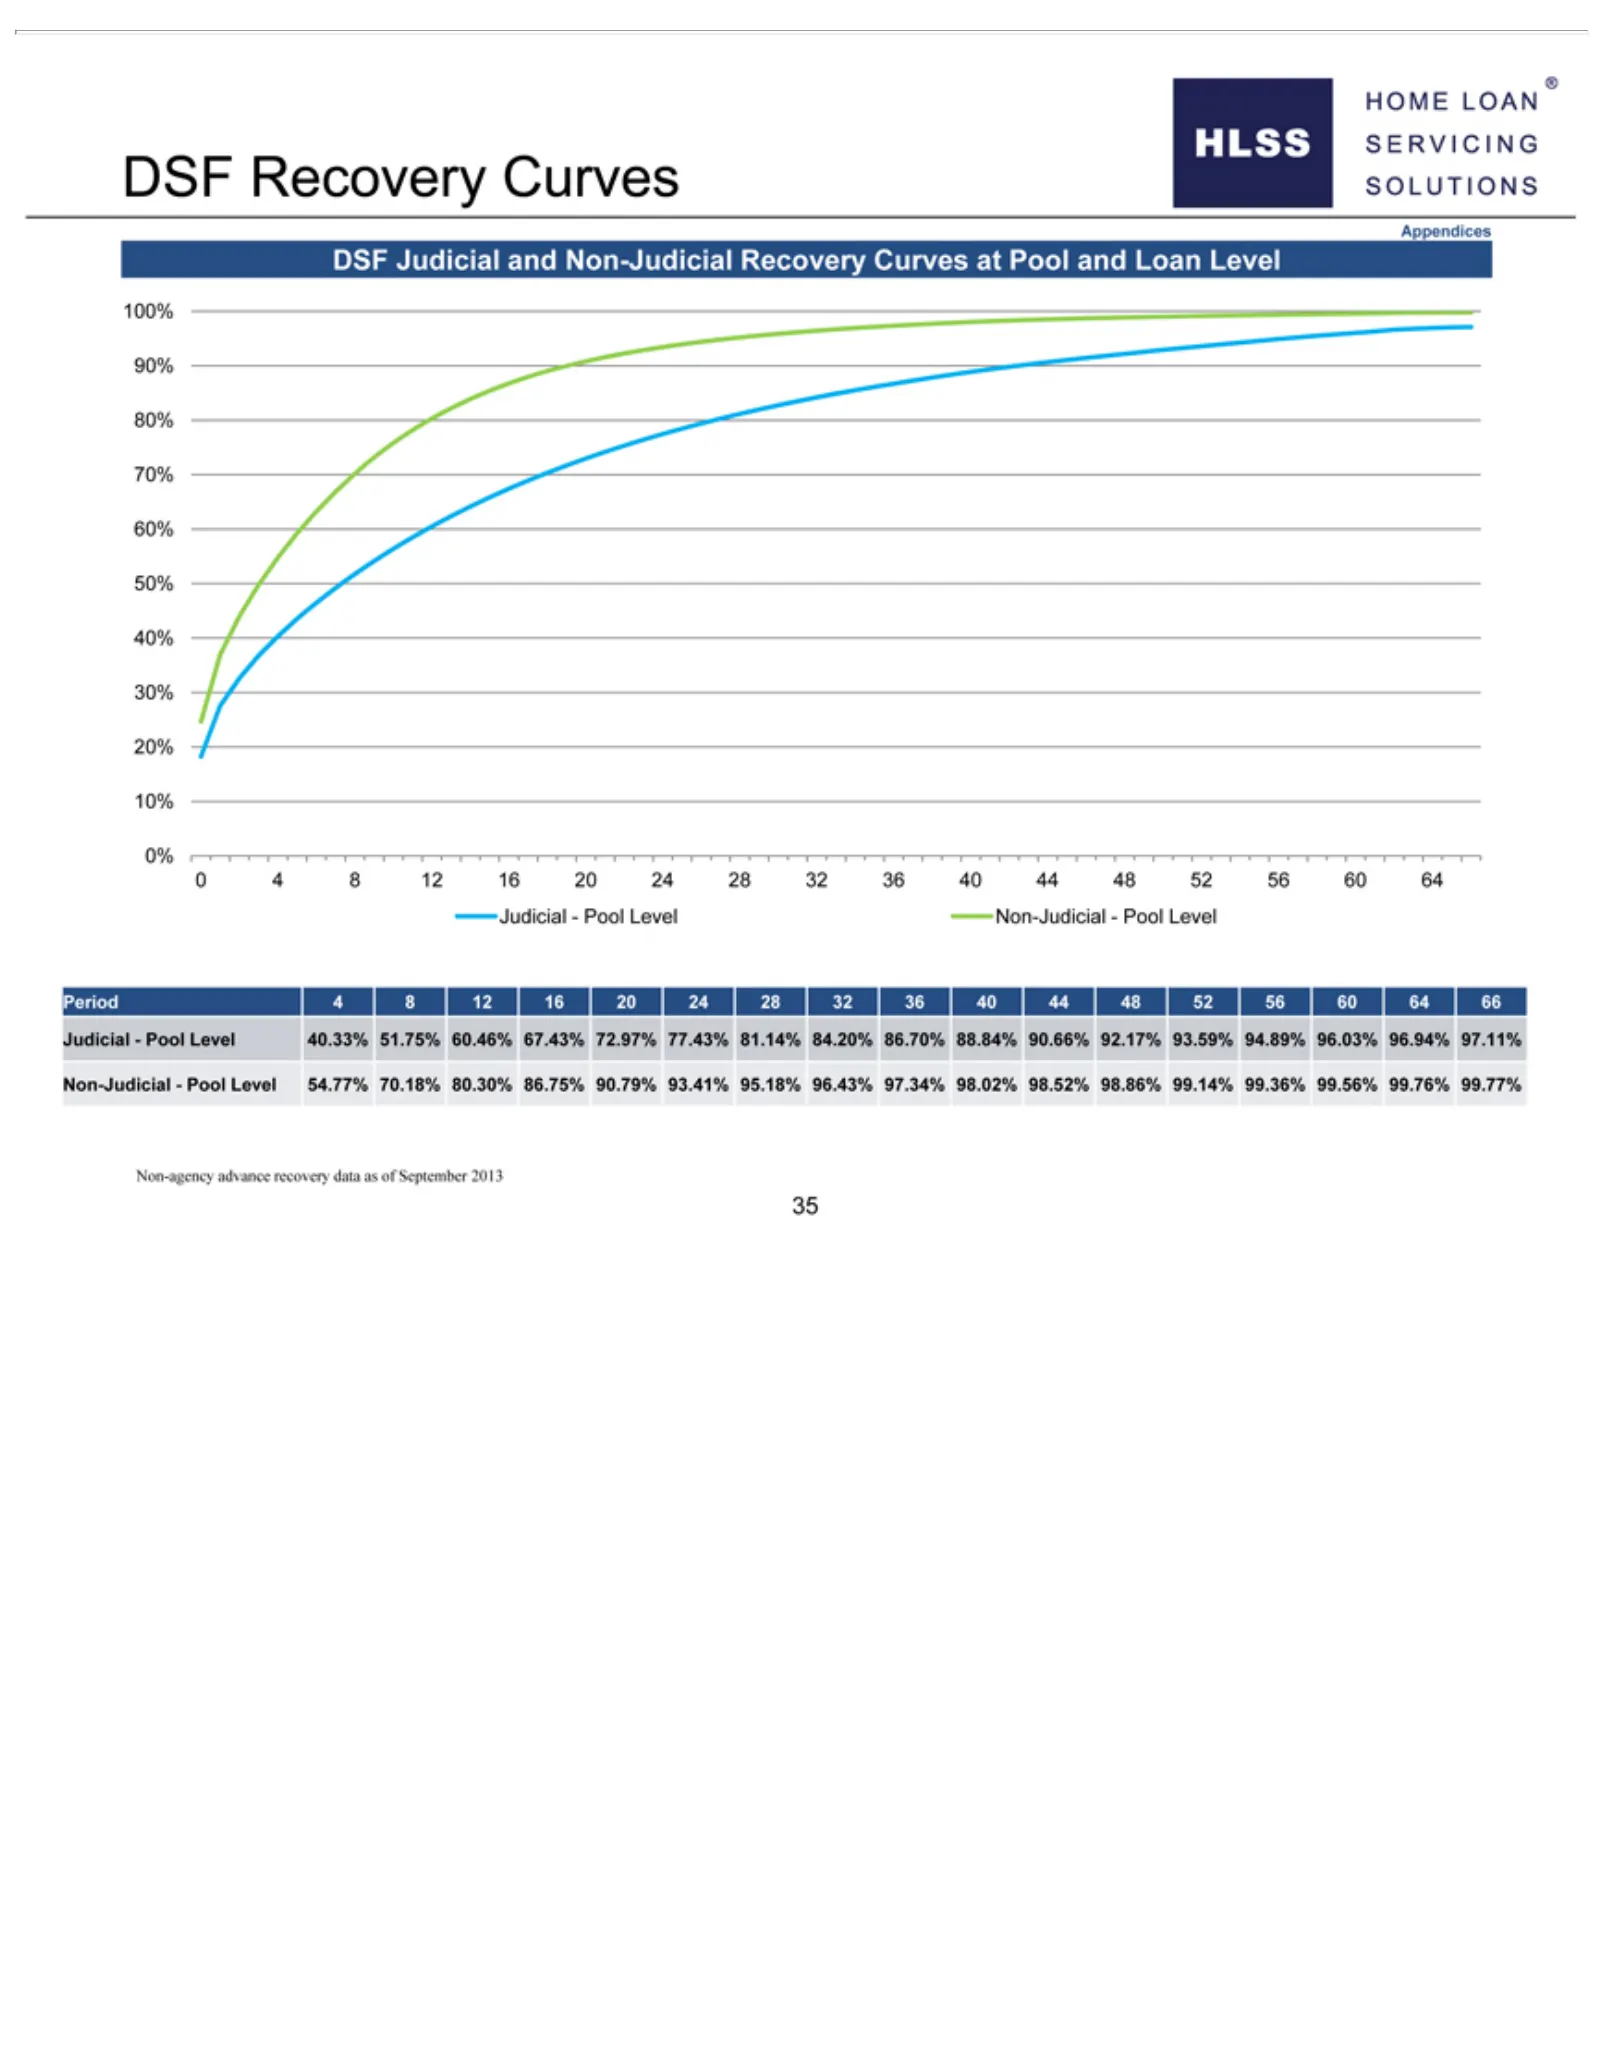
Slide 43: DSF Recovery Curves
DSF 64 88.84% 99.56% Judicial—Pool Recovery 90.66%Curves 99.76% 92.17% 99.77% Level Appendices Non-Judicial—Pool 93.59% 94.89% Non-agency DSFadvance Judicial 96.03% Level recovery and 96.94% Period Non-Judicial data 97.11% 4 as 8 12 of 16 September Non-Judicial—Pool Recovery 20 24 28Curves 2013 32 3
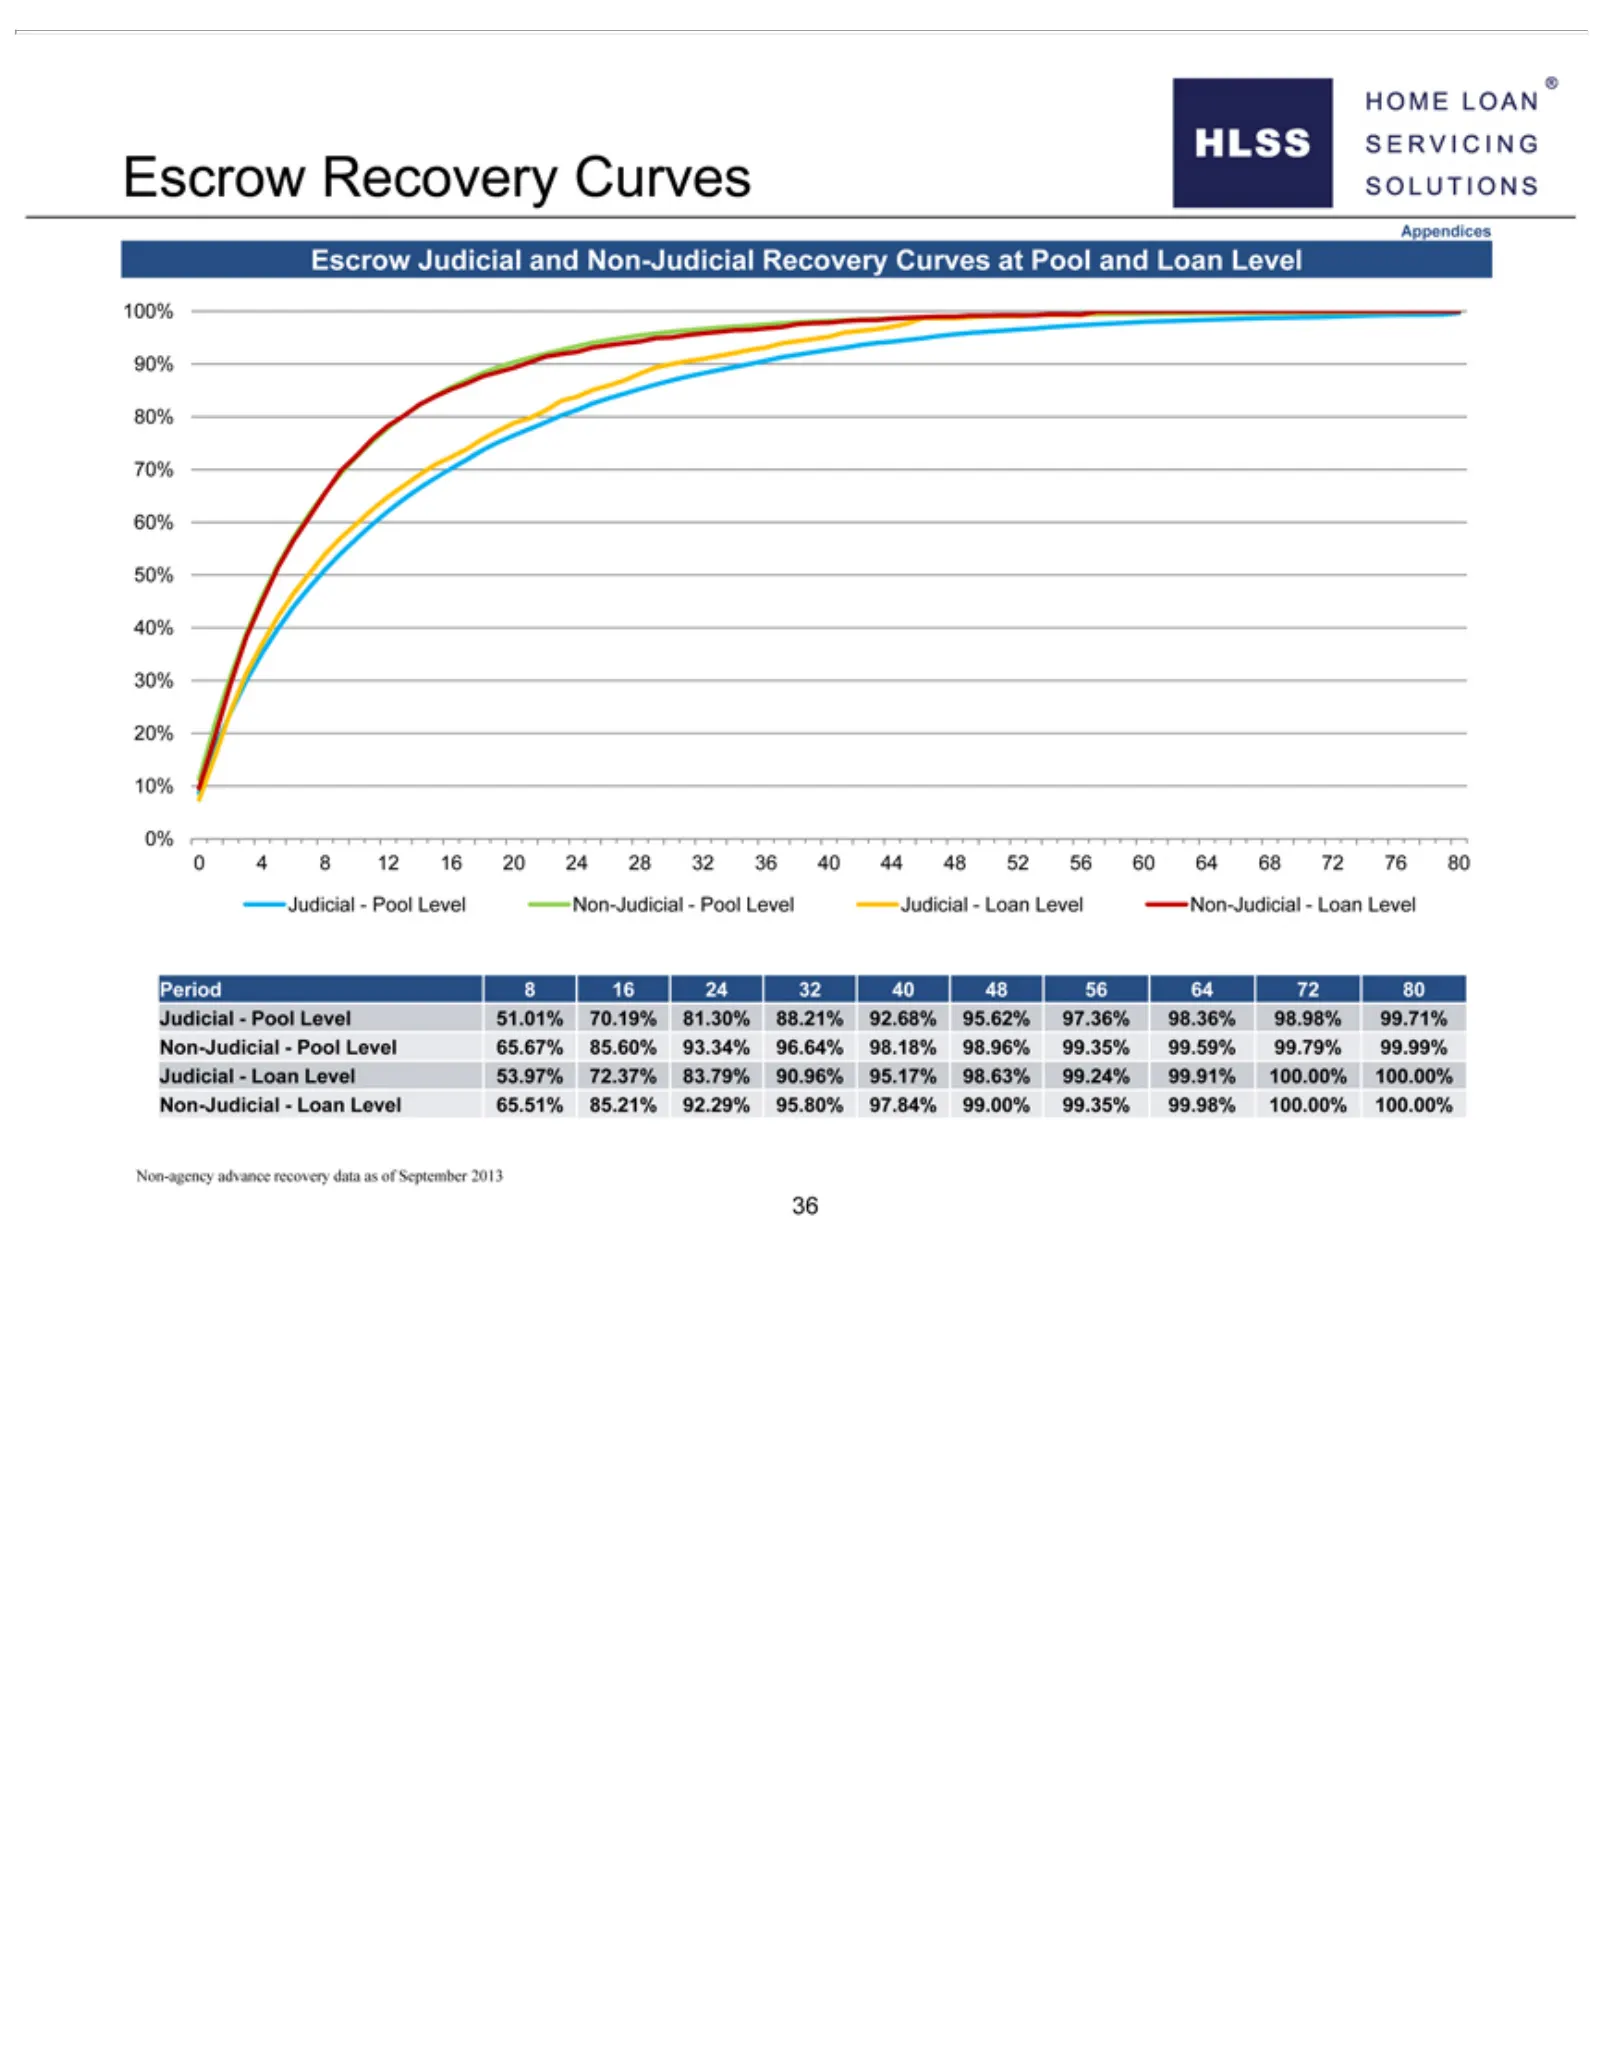
Slide 44: Escrow Recovery Curves
Escrow 56 92.68% 90.96% of September 60 64Recovery 95.62% 95.17% 68 722013 76 97.36% 98.63% Curves 80 36Judicial—Pool 98.36% 99.24% Appendices 98.98% 99.91% Level Escrow 99.71% 100.00% Non-Judicial—Pool Judicial Non-Judicial—Pool 100.00% and Non-Judicial Non-Judicial—Loan Level Judicial—Loan Level R
Slide 45: HLSS Servicer Advance Receivables Trust
HLSS Servicer Advance Receivables Trust
Source: SEC EDGAR · 8-K filed Jan 23, 2014
More decks from Home Loan Servicing Solutions Ltd
 Merger or Acquisition (February 2015)6 slides · Feb 23, 2015
 Q3 2014 Earnings Presentation15 slides · Oct 21, 2014
 Debt Investor Presentation (September 2014)40 slides · Sep 22, 2014
 Investor Presentation (September 2014)14 slides · Sep 8, 2014
 Investor Presentation (May 2014)17 slides · May 20, 2014
 Investor Presentation (December 2013)40 slides · Dec 3, 2013