Home Loan Servicing Solutions Ltd
Home Loan Servicing Solutions — Debt Investor Presentation (September 2014)
40 slides from Home Loan Servicing Solutions's debt investor presentation, Sep 22, 2014
Slide 1: HLSS Servicer Advance Receivables Trust ABS East 2014
HLSS Servicer Advance Receivables Trust ABS East 2014 Investor Presentation
Slide 2: Disclaimer
Disclaimer 2 FORWARD-LOOKING STATEMENT: This news release contains forward-looking statements within the meaning of Section 27A of the Securities Act of 1933, as amended, and Section 21E of the Securities Exchange Act of 1934, as amended. All statements, other than statements of historical facts, in
Slide 3: Table of Contents
Table of Contents Agenda 1. HLSS Overview 2. Ocwen Overview 3. HSART Master Trust Overview 4. Appendices 3
Slide 4: HLSS Overview
HOME LOAN ° SERVICING SOLUTIONS HLSS Overview
Slide 5: HLSS Overview
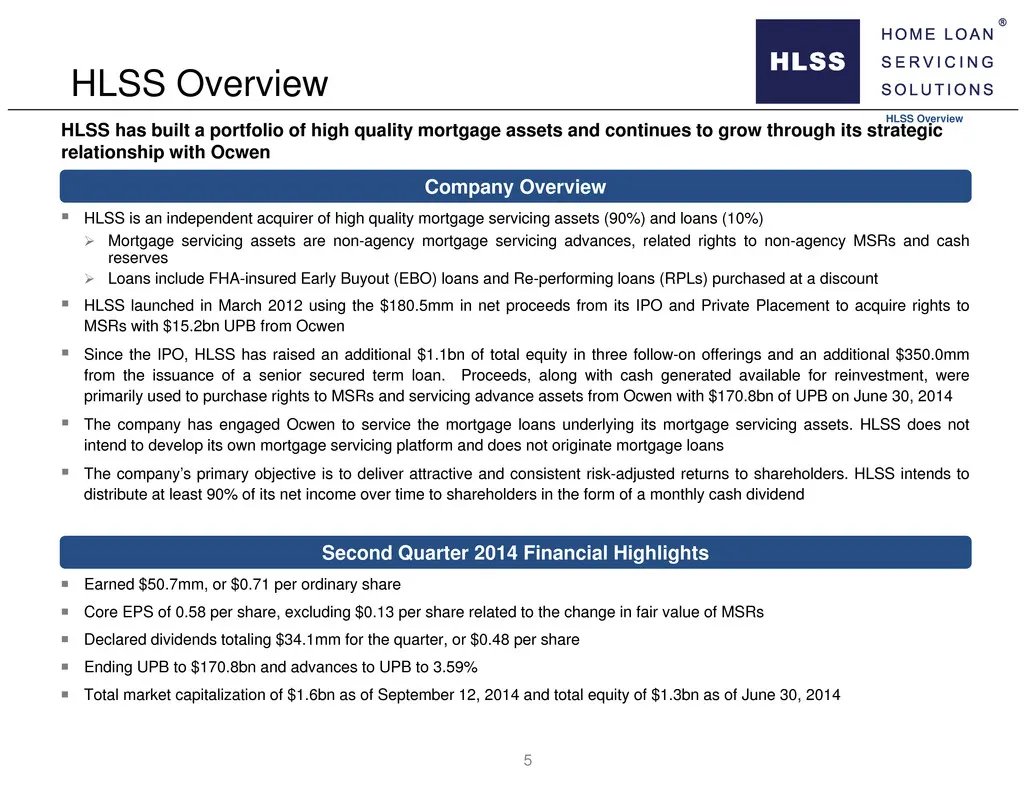
HLSS Overview Earned $50.7mm, or $0.71 per ordinary share Core EPS of 0.58 per share, excluding $0.13 per share related to the change in fair value of MSRs Declared dividends totaling $34.1mm for the quarter, or $0.48 per share Ending UPB to $170.8bn and advances to UPB to 3.59% Total mark
Slide 6: HLSS Milestones
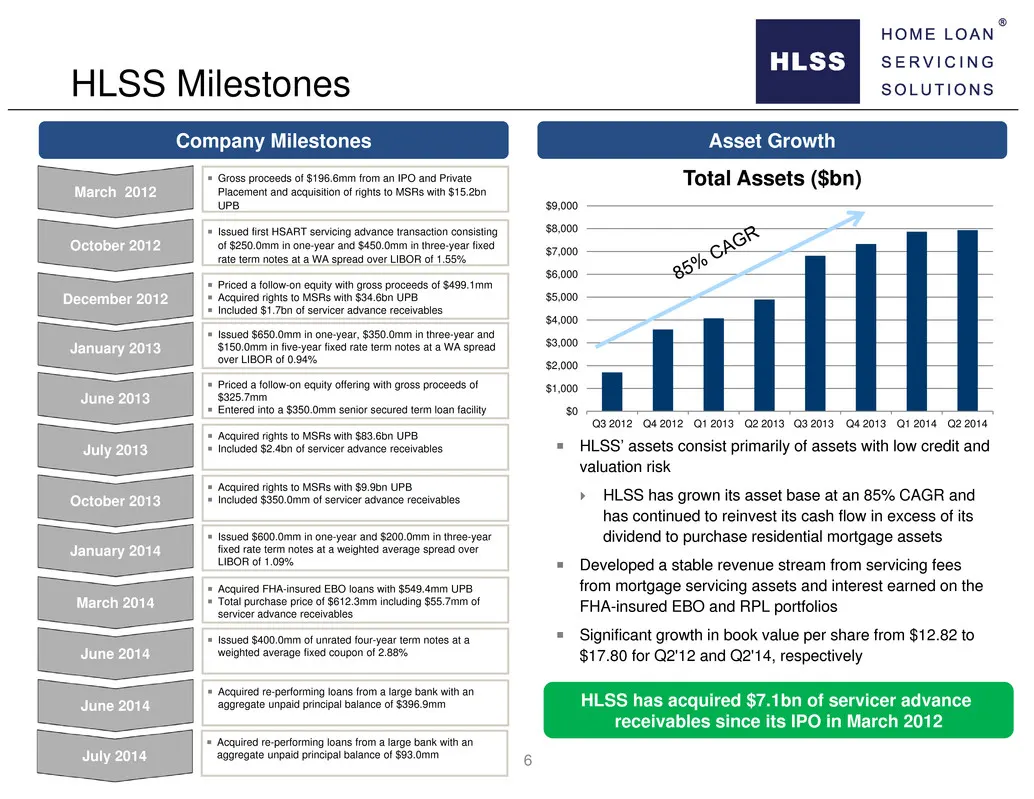
HLSS Milestones 6 Asset GrowthCompany Milestones HLSS’ assets consist primarily of assets with low credit and valuation risk HLSS has grown its asset base at an 85% CAGR and has continued to reinvest its cash flow in excess of its dividend to purchase residential mortgage assets Developed a st
Slide 7: HLSS Leadership Team
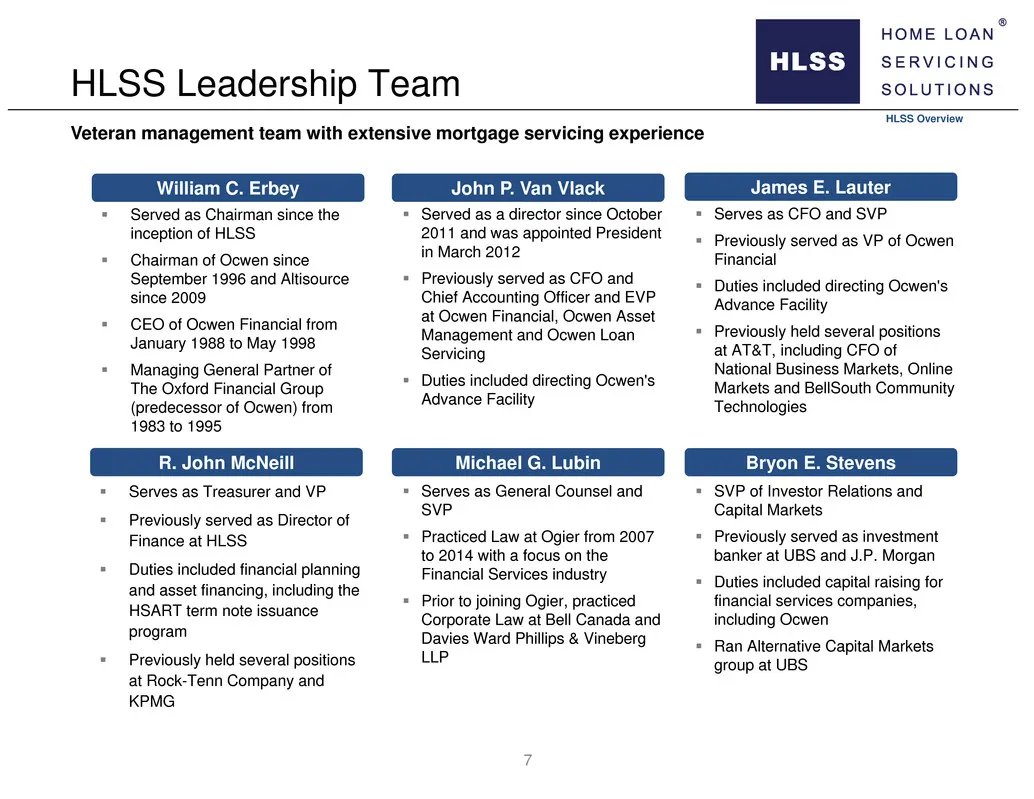
Veteran management team with extensive mortgage servicing experience HLSS Overview HLSS Leadership Team Served as Chairman since the inception of HLSS Chairman of Ocwen since September 1996 and Altisource since 2009 CEO of Ocwen Financial from January 1988 to May 1998 Managing General Partne
Slide 8: Assets Have Limited Credit and Valuation Risk
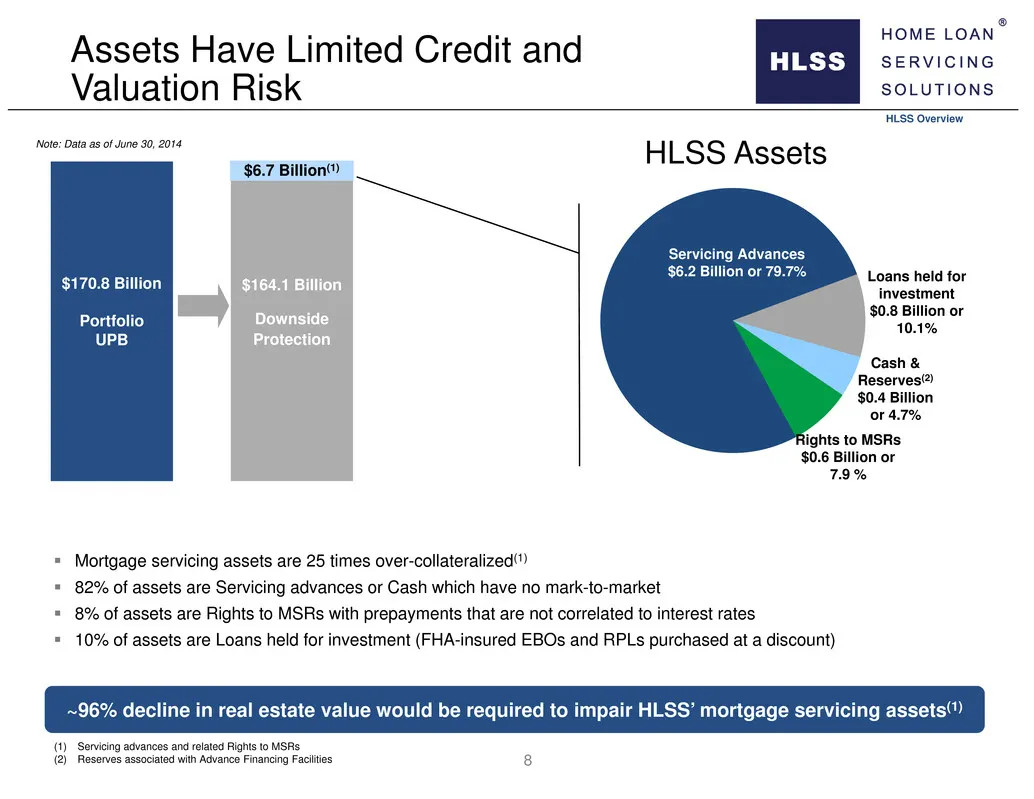
Assets Have Limited Credit and Valuation Risk HLSS Overview Servicing Advances $6.39 Billion or 87% 8 Servici g Advances $6.1 Billion or 77.3% $170.8 Billion Portfolio UPB $164.1 Billion Downside Protection Servicing Advances $6.2 Billion or 79.7% $6.7 Billion(1) ~96% decline in real estate value wo
Slide 9: Components of Income
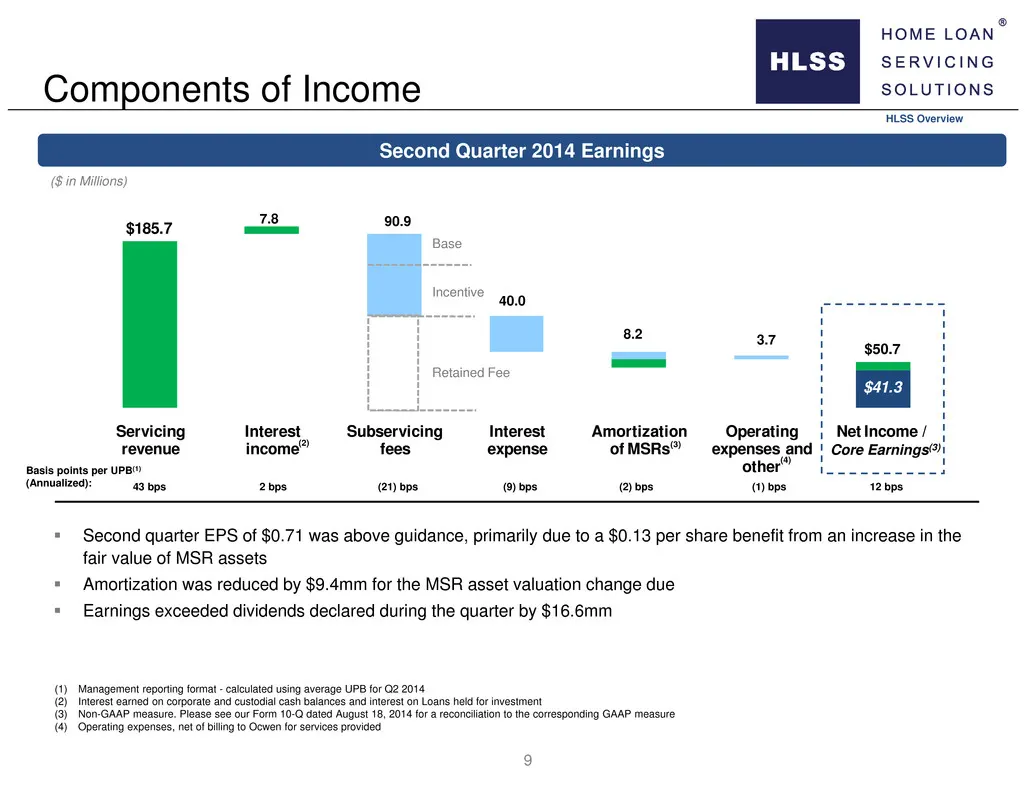
HLSS Overview Components of Income 9 $185.7 $41.3 Servicing revenue Interest income Subservicing fees Interest expense Amortization of MSRs Operating expenses and other Net Income / (4) ($ in Millions) 90.9 Basis points per UPB(1) (Annualized): (1) Management reporting format - calculated using aver
Slide 10: Historical Performance
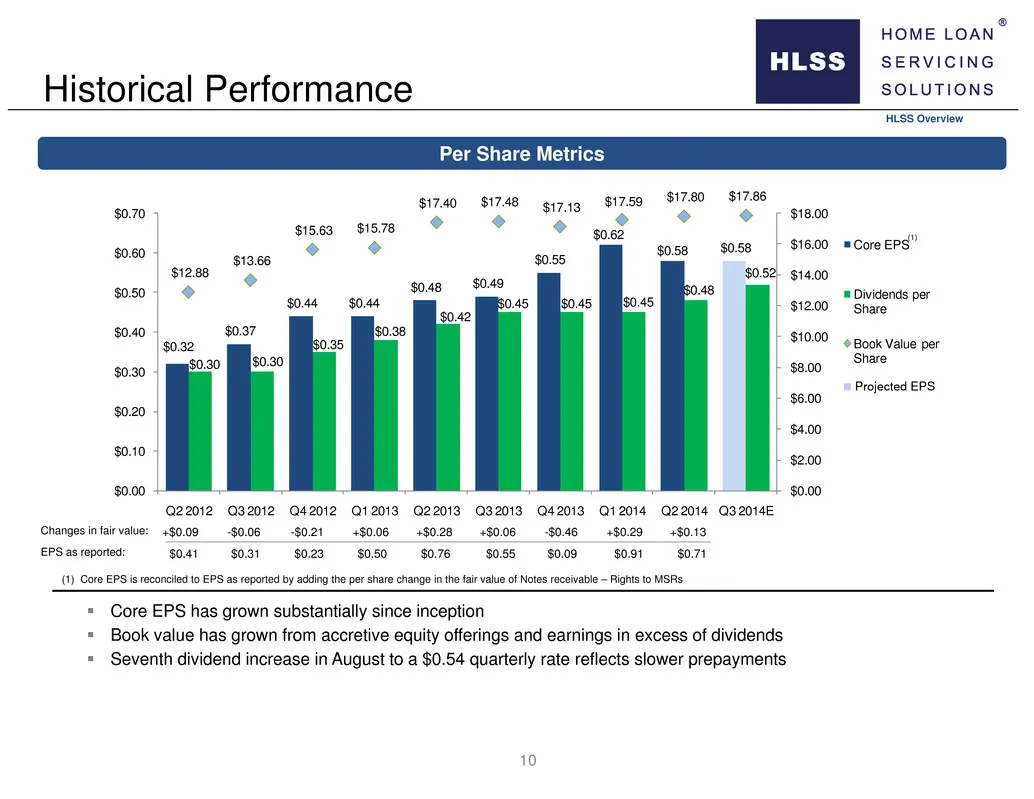
Historical Performance HLSS Overview 10 $0.32 $0.37 $0.44 $0.44 $0.48 $0.49 $0.55 $0.62 $0.58 $0.58 $0.30 $0.30 $0.35 $0.38 $0.42 $0.45 $0.45 $0.45 $0.48 $0.52 $12.88 $13.66 $15.63 $15.78 $17.40 $17.48 $17.13 $17.59 $17.80 $17.86 $0.00 $2.00 $4.00 $6.00 $8.00 $10.00 $12.00 $14.00 $16.00 $18.00 $0.00
Slide 11: HLSS Term Note Issuance Program
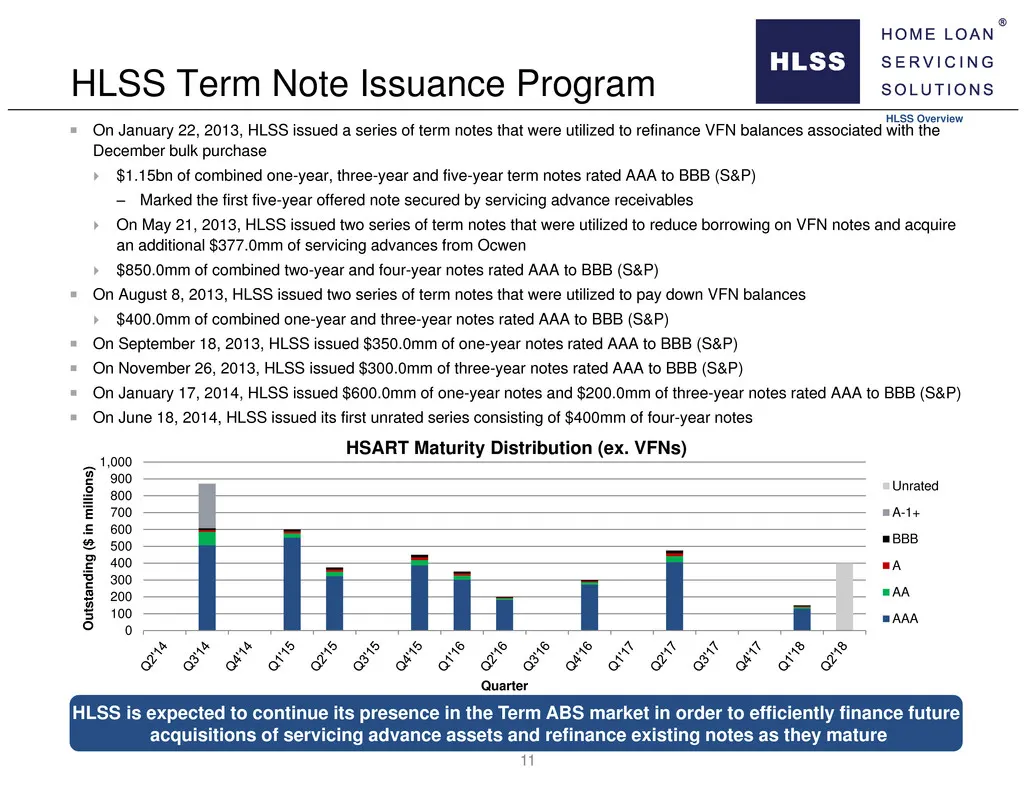
HLSS is expected to continue its presence in the Term ABS market in order to efficiently finance future acquisitions of servicing advance assets and refinance existing notes as they mature HLSS Term Note Issuance Program HLSS Overview 11 On January 22, 2013, HLSS issued a series of term notes that
Slide 12: HLSS Portfolio Details
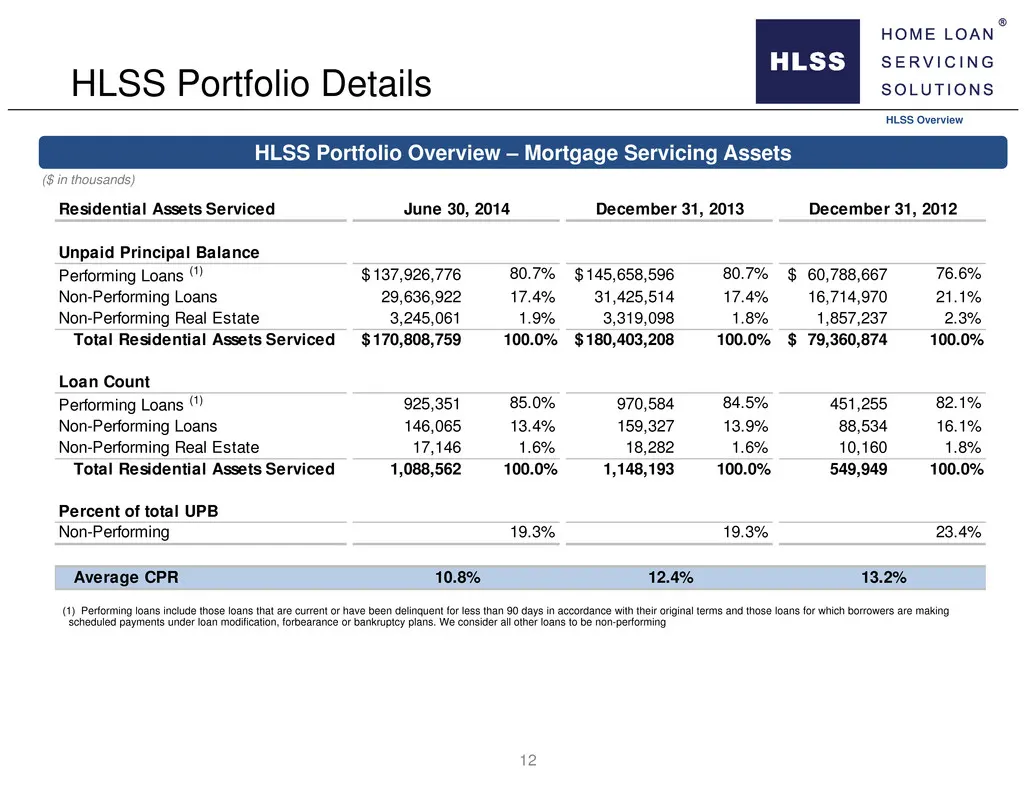
HLSS Overview HLSS Portfolio Details (1) Performing loans include those loans that are current or have been delinquent for less than 90 days in accordance with their original terms and those loans for which borrowers are making scheduled payments under loan modification, forbearance or bankruptcy pl
Slide 13: HLSS Highlights
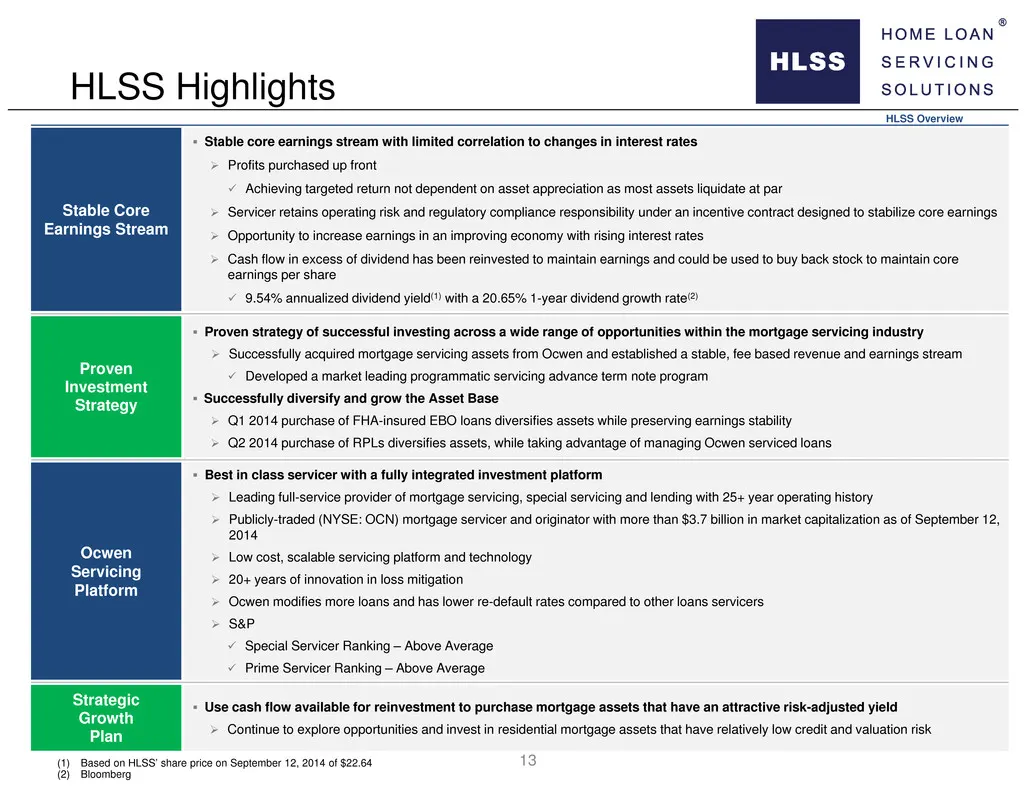
HLSS Highlights HLSS Overview 13(1) Based on HLSS’ share price on September 12, 2014 of $22.64 (2) Bloomberg Stable Core Earnings Stream Stable core earnings stream with limited correlation to changes in interest rates Profits purchased up front Achieving targeted return not dependent on asset
Slide 14: Overview of HLSS-Ocwen Relationship
Overview of HLSS-Ocwen Relationship
Slide 15: The HLSS-Ocwen subservicing relationship
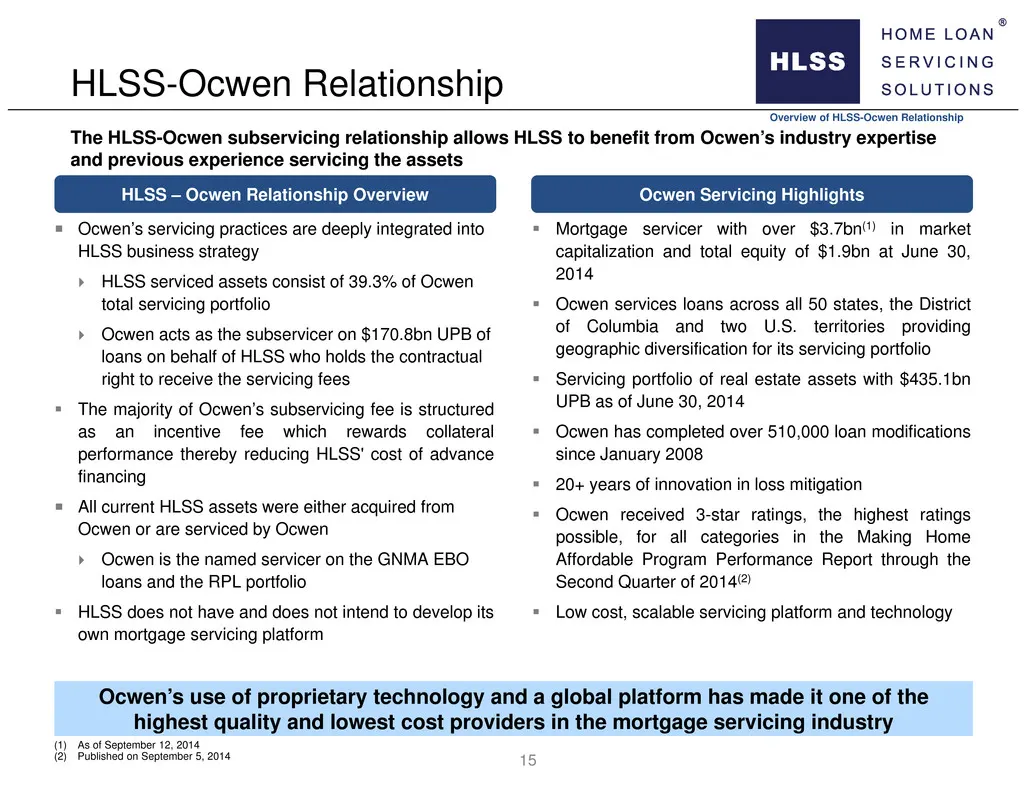
The HLSS-Ocwen subservicing relationship allows HLSS to benefit from Ocwen’s industry expertise and previous experience servicing the assets Overview of HLSS-Ocwen Relationship Ocwen’s servicing practices are deeply integrated into HLSS business strategy HLSS serviced assets consist of 39.3% of
Slide 16: Global Servicing Platform
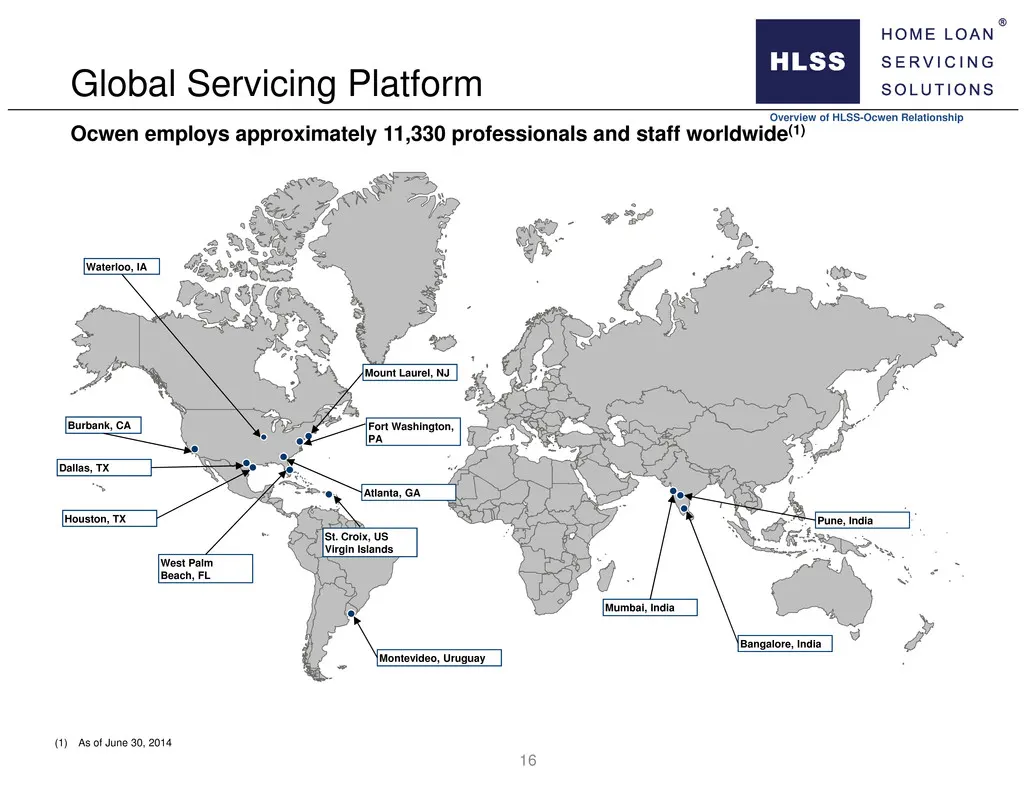
Overview of HLSS-Ocwen Relationship Global Servicing Platform Ocwen employs approximately 11,330 professionals and staff worldwide(1) Houston, TX Bangalore, India Mumbai, India Montevideo, Uruguay Atlanta, GA West Palm Beach, FL St. Croix, US Virgin Islands (1) As of June 30, 2014 Mount Laurel, NJ D
Slide 17: Ocwen Servicing Effectiveness
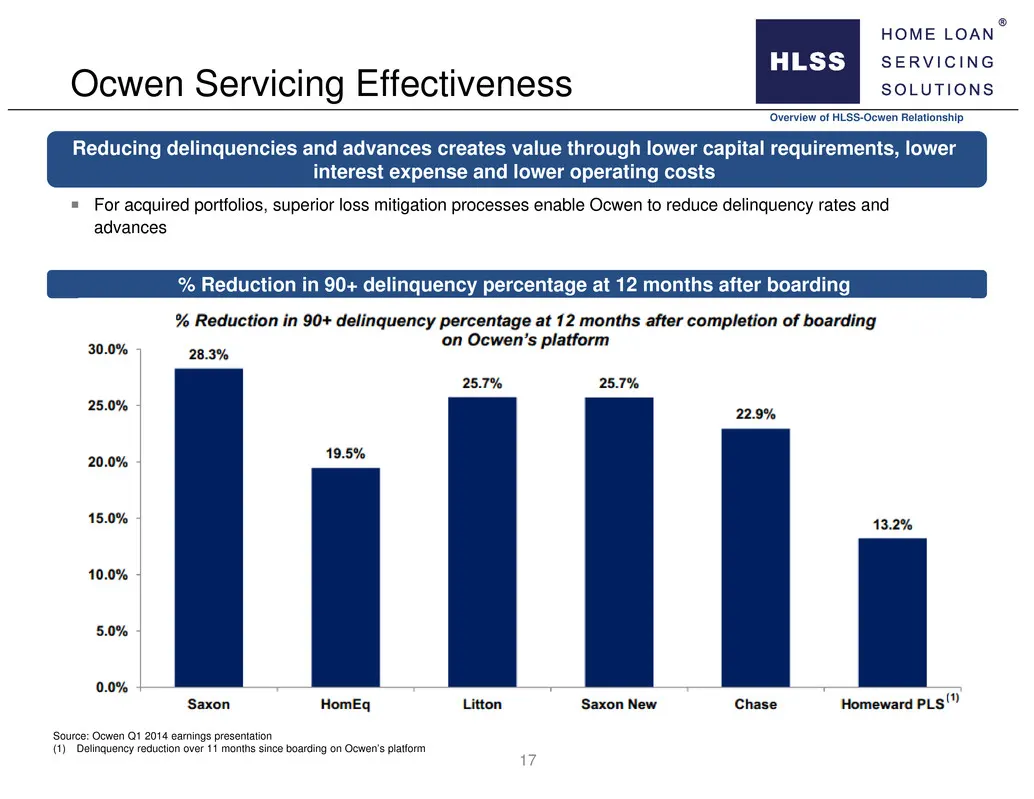
Ocwen Servicing Effectiveness Overview of HLSS-Ocwen Relationship 17 For acquired portfolios, superior loss mitigation processes enable Ocwen to reduce delinquency rates and advances % Reduction in 90+ delinquency percentage at 12 months after boarding Reducing delinquencies and advances creates v
Slide 18: Ocwen Servicing Effectiveness: Subprime DQ to Liquidation Timeline
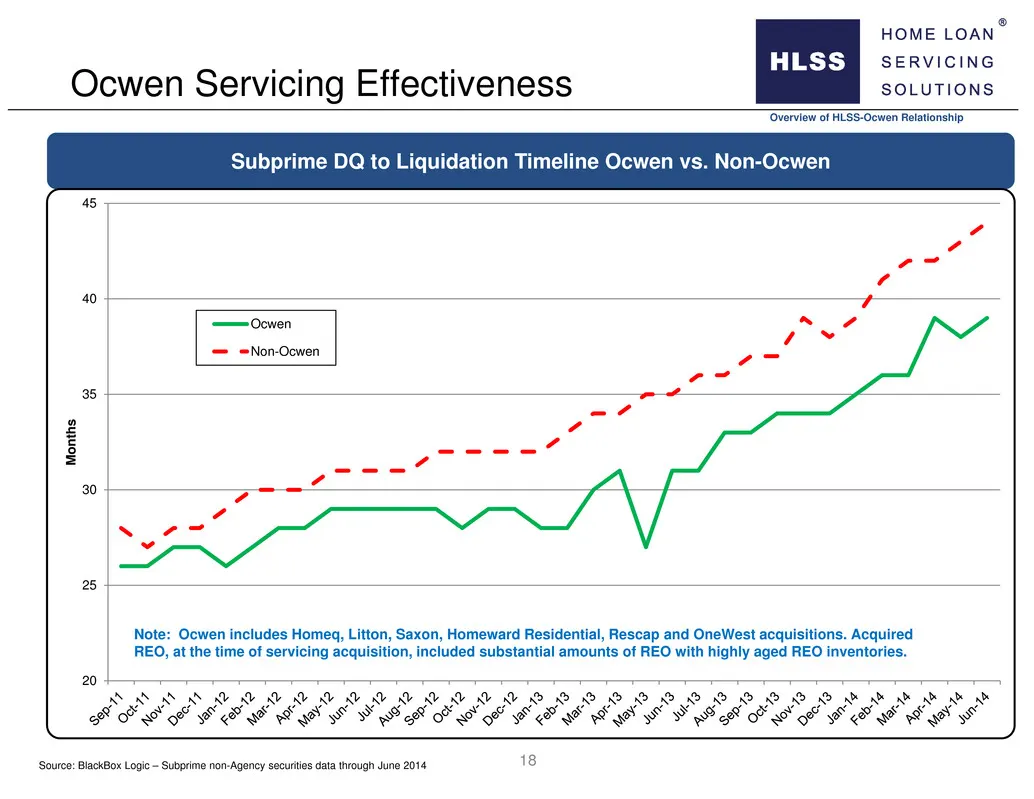
Ocwen Servicing Effectiveness Overview of HLSS-Ocwen Relationship 18 Subprime DQ to Liquidation Timeline Ocwen vs. Non-Ocwen 20 25 30 35 40 45 M o n t h s Ocwen Non-Ocwen Note: Ocwen includes Homeq, Litton, Saxon, Homeward Residential, Rescap and OneWest acquisitions. Acquired REO, at the time of se
Slide 19: Ocwen Residential Assets Serviced
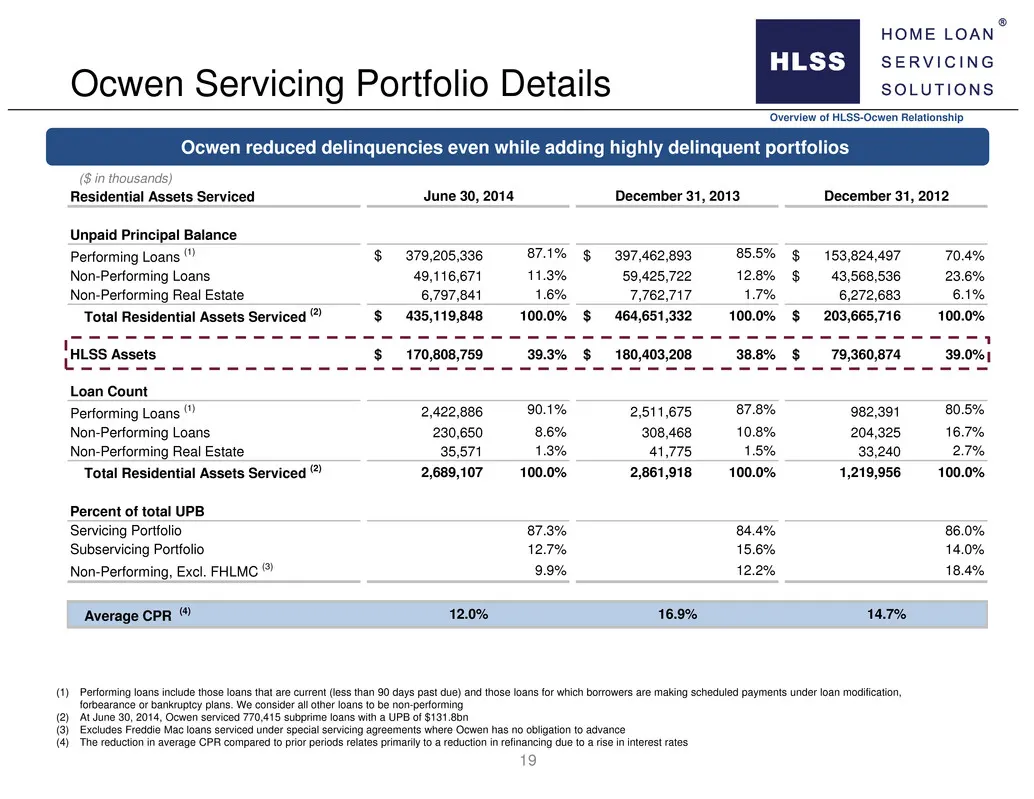
Residential Assets Serviced Unpaid Principal Balance Performing Loans (1) 379,205,336$ 87.1% 397,462,893$ 85.5% 153,824,497$ 70.4% Non-Performing Loans 49,116,671 11.3% 59,425,722 12.8% 43,568,536$ 23.6% Non-Performing Real Estate 6,797,841 1.6% 7,762,717 1.7% 6,272,683 6.1% Total Residential Assets
Slide 20: HSART Master Trust Overview
HOME LOAN ° SERVICING SOLUTIONS HSART Master Trust Overview
Slide 21: SAF Market Update
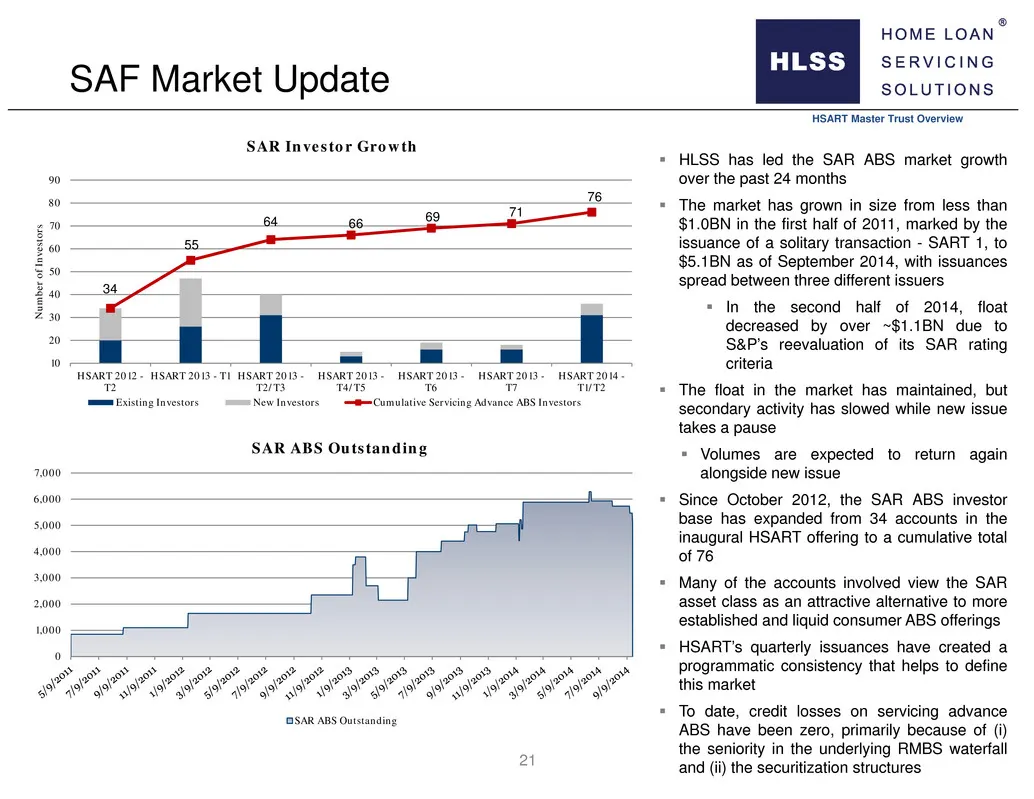
SAF Market Update HSART Master Trust Overview HLSS has led the SAR ABS market growth over the past 24 months The market has grown in size from less than $1.0BN in the first half of 2011, marked by the issuance of a solitary transaction - SART 1, to $5.1BN as of September 2014, with issuances spr
Slide 22: Current HSART Master Trust Series
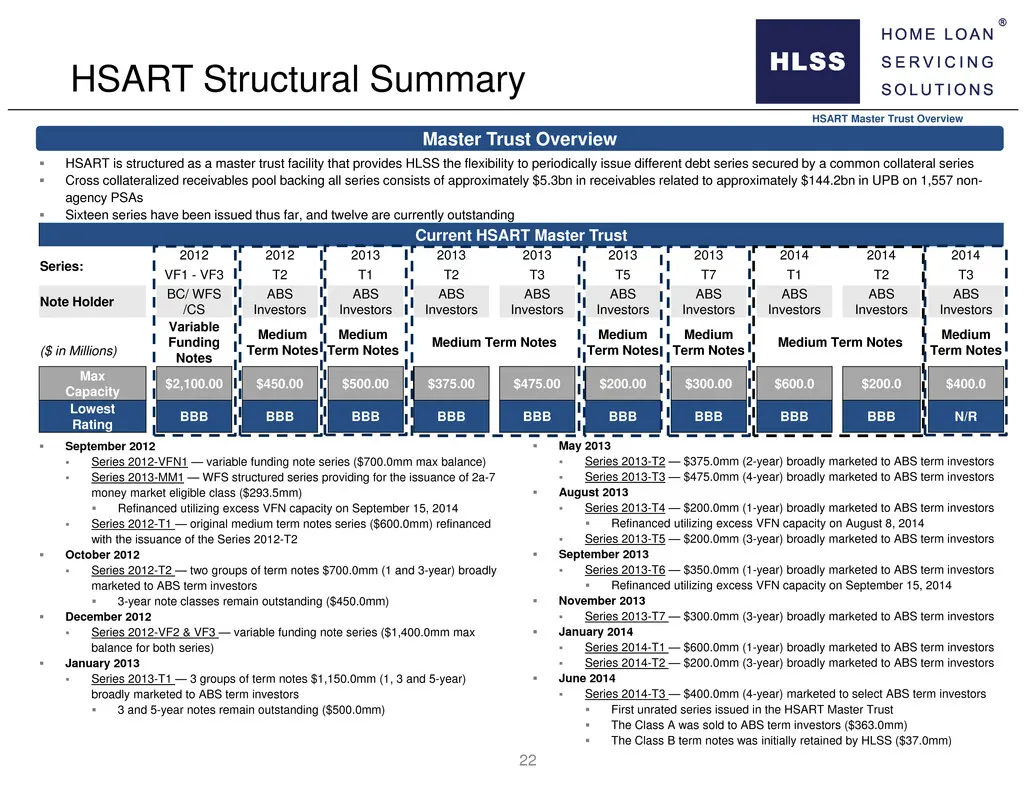
Current HSART Master Trust Series: 2012 2012 2013 2013 2013 2013 2013 2014 2014 2014 VF1 - VF3 T2 T1 T2 T3 T5 T7 T1 T2 T3 Note Holder BC/ WFS /CS ABS Investors ABS Investors ABS Investors ABS Investors ABS Investors ABS Investors ABS Investors ABS Investors ABS Investors Variable Funding Notes Mediu
Slide 23: Revolving Period and Amortization Periods
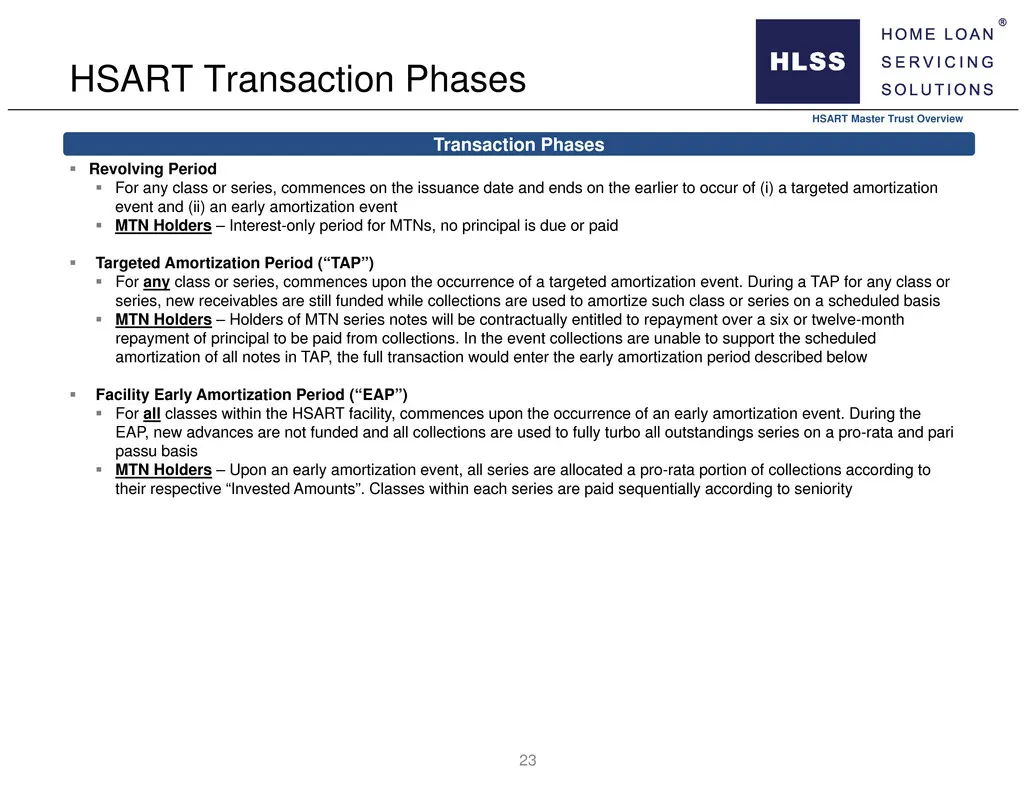
Revolving Period For any class or series, commences on the issuance date and ends on the earlier to occur of (i) a targeted amortization event and (ii) an early amortization event MTN Holders – Interest-only period for MTNs, no principal is due or paid Targeted Amortization Period (“TAP”)
Slide 24: Collateral Thresholds and Target Amortization Events
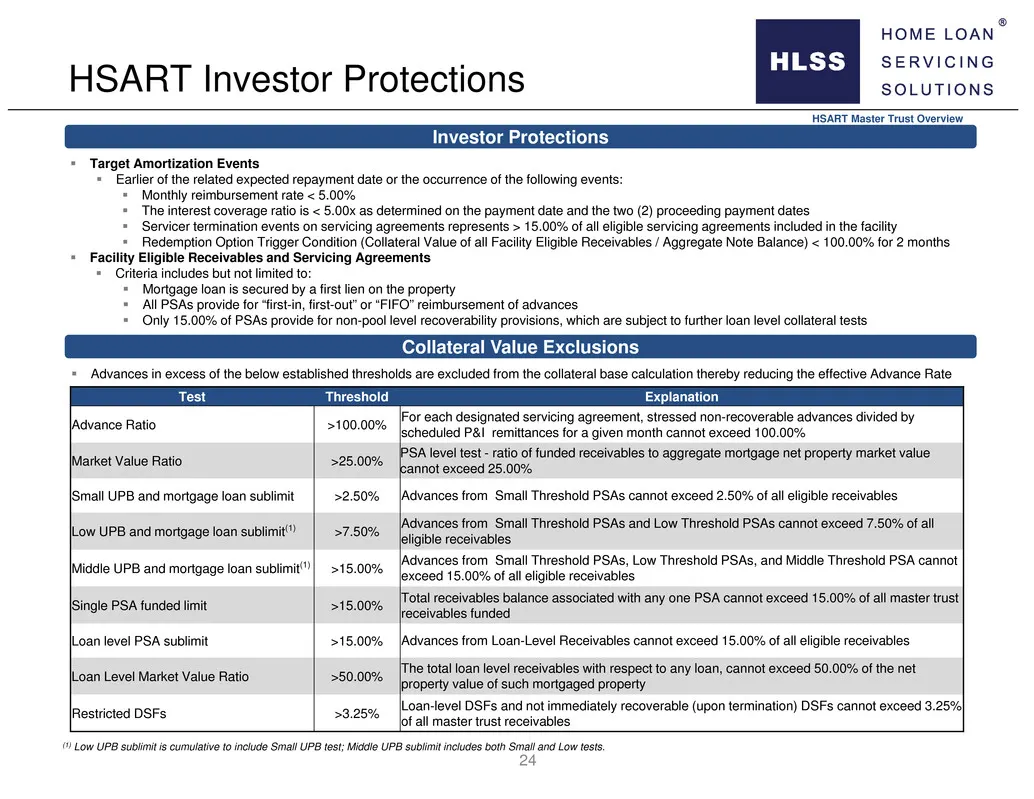
Advances in excess of the below established thresholds are excluded from the collateral base calculation thereby reducing the effective Advance Rate Target Amortization Events Earlier of the related expected repayment date or the occurrence of the following events: Monthly reimbursement rate
Slide 25: Structural Mechanisms: Trigger Advance Rate
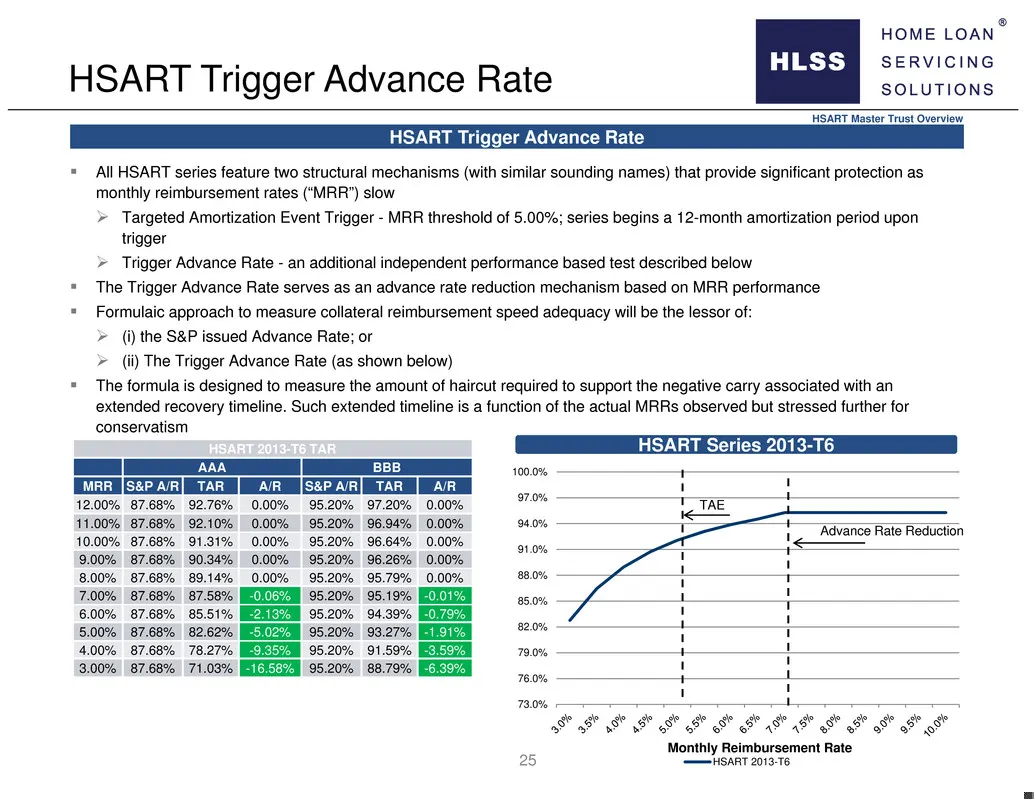
All HSART series feature two structural mechanisms (with similar sounding names) that provide significant protection as monthly reimbursement rates (“MRR”) slow Targeted Amortization Event Trigger - MRR threshold of 5.00%; series begins a 12-month amortization period upon trigger Trigger Advan
Slide 26: Master Trust Receivables Distribution
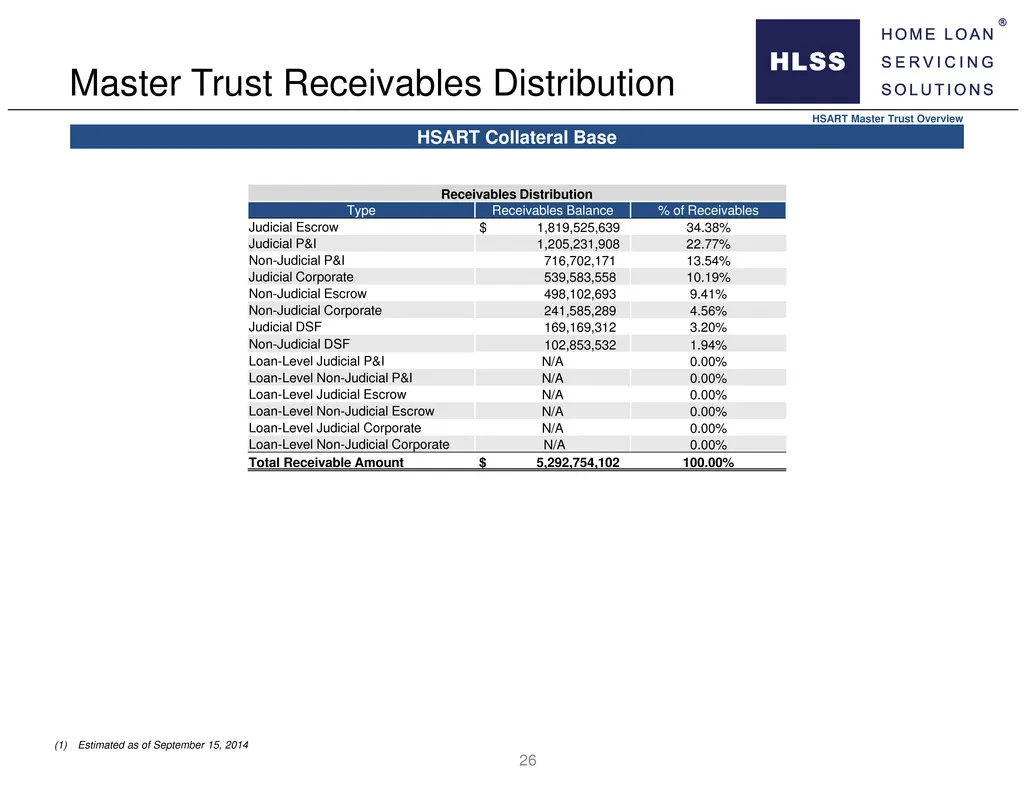
Master Trust Receivables Distribution HSART Master Trust Overview (1) Estimated as of September 15, 2014 Receivables Distribution Type Receivables Balance % of Receivables Judicial Escrow $ 1,819,525,639 34.38% Judicial P&I 1,205,231,908 22.77% Non-Judicial P&I 716,702,171 13.54% Judicial Corporate
Slide 27: Appendices
HOME LOAN ° SERVICING SOLUTIONS Appendices
Slide 28: Appendix: Select Past Transactions
Appendix: Select Past Transactions
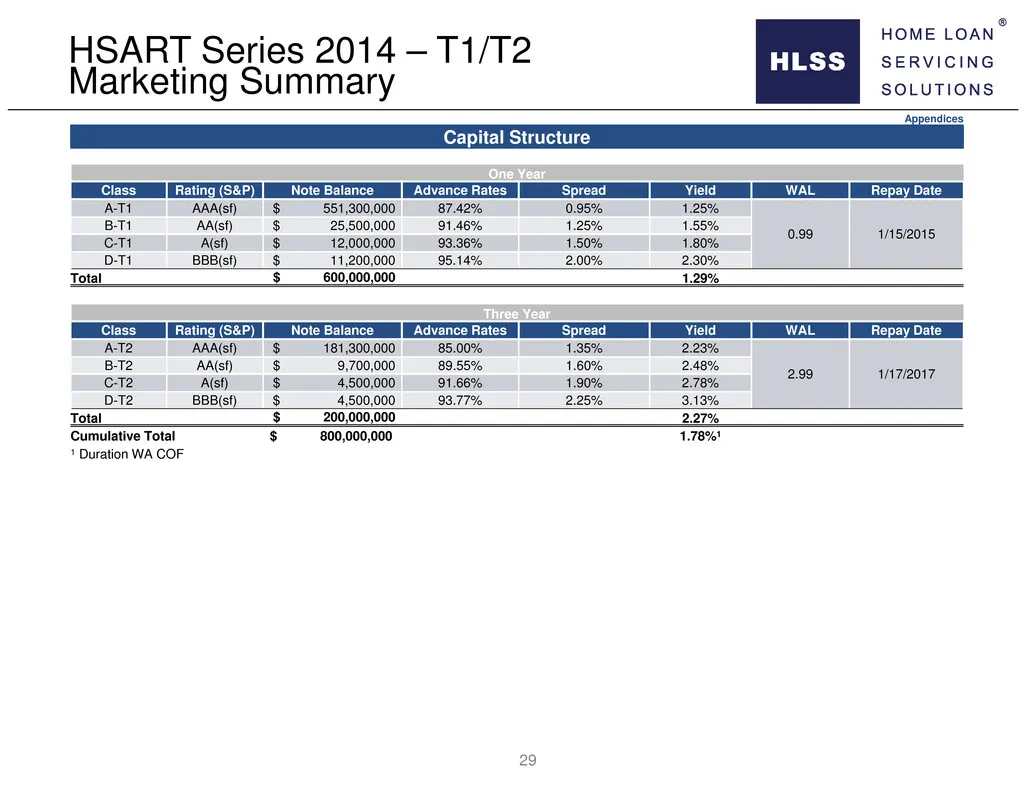
Slide 29: Capital Structure HSART Series 2014 – T1/T2
Capital Structure HSART Series 2014 – T1/T2 Marketing Summary Appendices One Year Class Rating (S&P) Note Balance Advance Rates Spread Yield WAL Repay Date A-T1 AAA(sf) $ 551,300,000 87.42% 0.95% 1.25% 0.99 1/15/2015 B-T1 AA(sf) $ 25,500,000 91.46% 1.25% 1.55% C-T1 A(sf) $ 12,000,000 93.36% 1.50% 1.
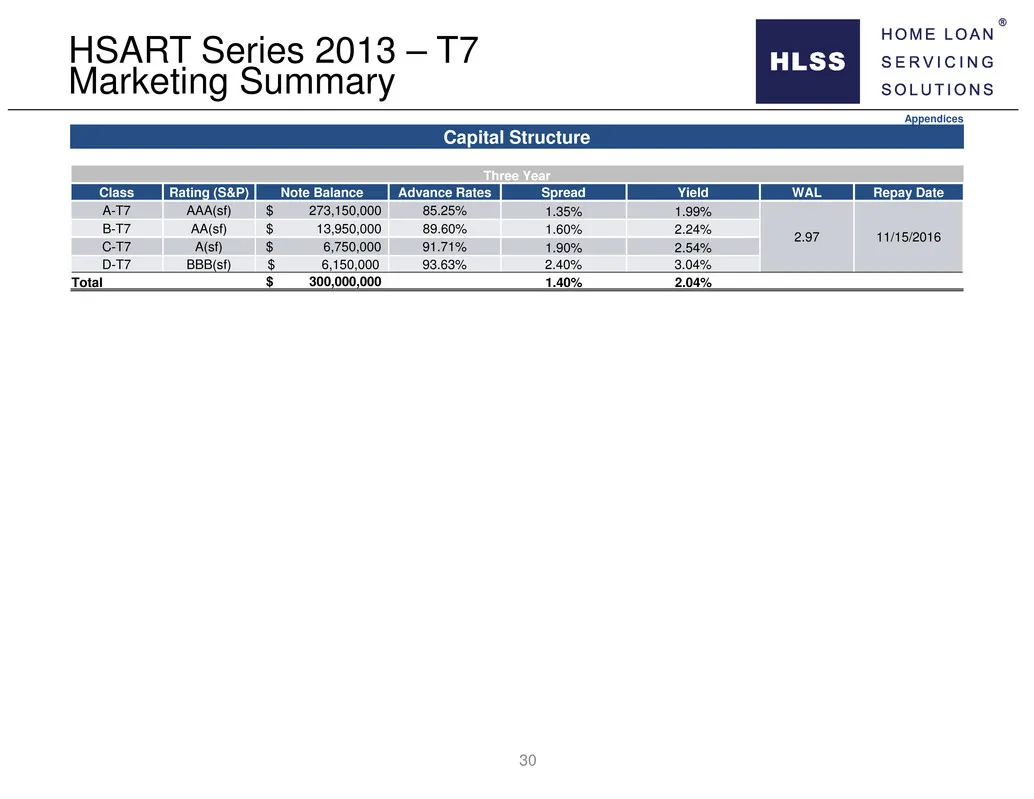
Slide 30: Capital Structure HSART Series 2013 – T7
Capital Structure HSART Series 2013 – T7 Marketing Summary Appendices Three Year Class Rating (S&P) Note Balance Advance Rates Spread Yield WAL Repay Date A-T7 AAA(sf) $ 273,150,000 85.25% 1.35% 1.99% 2.97 11/15/2016 B-T7 AA(sf) $ 13,950,000 89.60% 1.60% 2.24% C-T7 A(sf) $ 6,750,000 91.71% 1.90% 2.5
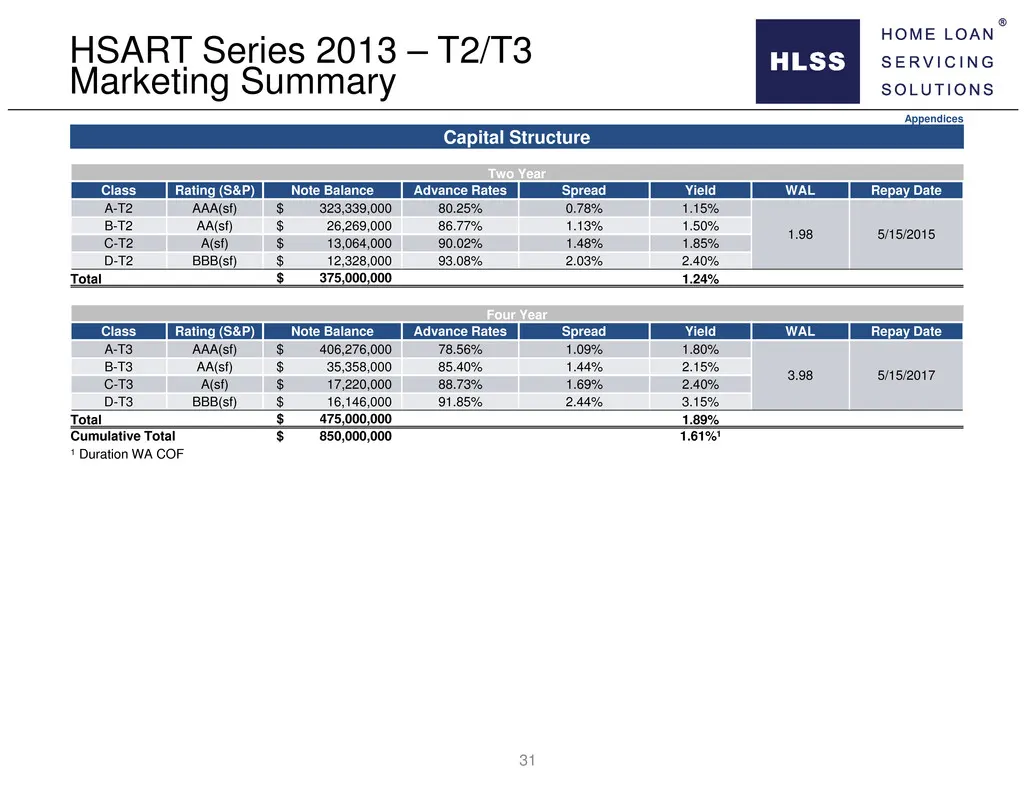
Slide 31: Capital Structure HSART Series 2013 – T2/T3
Capital Structure HSART Series 2013 – T2/T3 Marketing Summary Appendices Two Year Class Rating (S&P) Note Balance Advance Rates Spread Yield WAL Repay Date A-T2 AAA(sf) $ 323,339,000 80.25% 0.78% 1.15% 1.98 5/15/2015 B-T2 AA(sf) $ 26,269,000 86.77% 1.13% 1.50% C-T2 A(sf) $ 13,064,000 90.02% 1.48% 1.
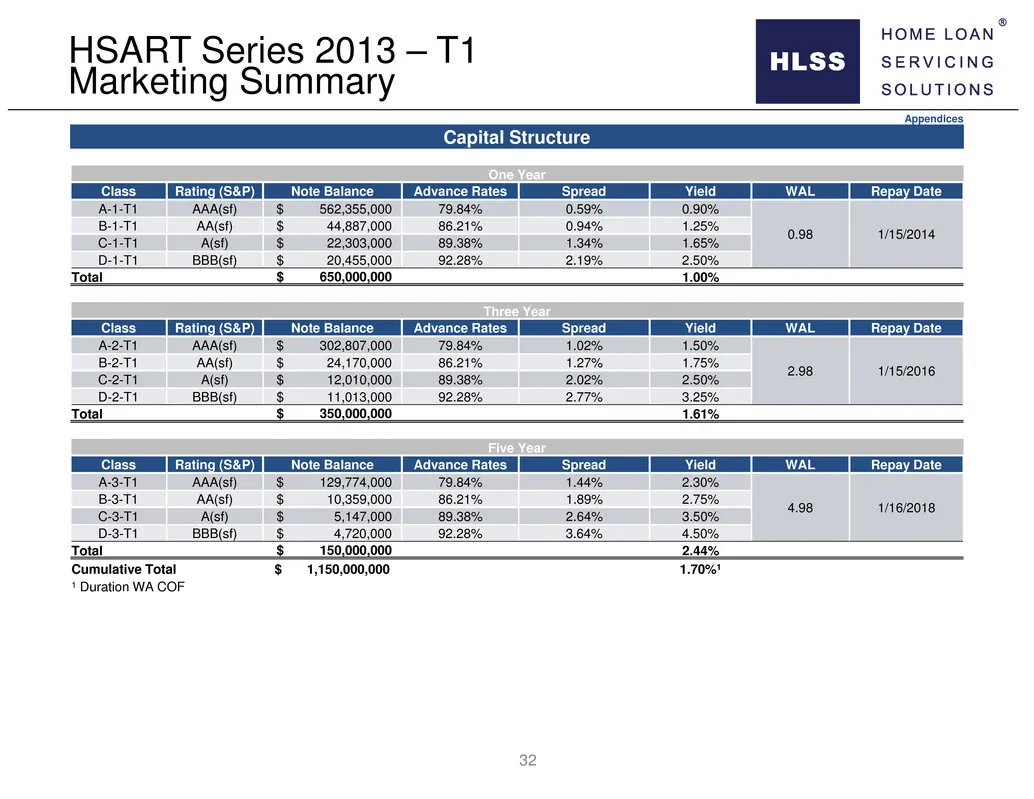
Slide 32: Capital Structure HSART Series 2013 – T1
Capital Structure HSART Series 2013 – T1 Marketing Summary Appendices One Year Class Rating (S&P) Note Balance Advance Rates Spread Yield WAL Repay Date A-1-T1 AAA(sf) $ 562,355,000 79.84% 0.59% 0.90% 0.98 1/15/2014 B-1-T1 AA(sf) $ 44,887,000 86.21% 0.94% 1.25% C-1-T1 A(sf) $ 22,303,000 89.38% 1.34%
Slide 33: Appendix: Performance
Appendix: Performance
Slide 34: Remittance Report Excerpt
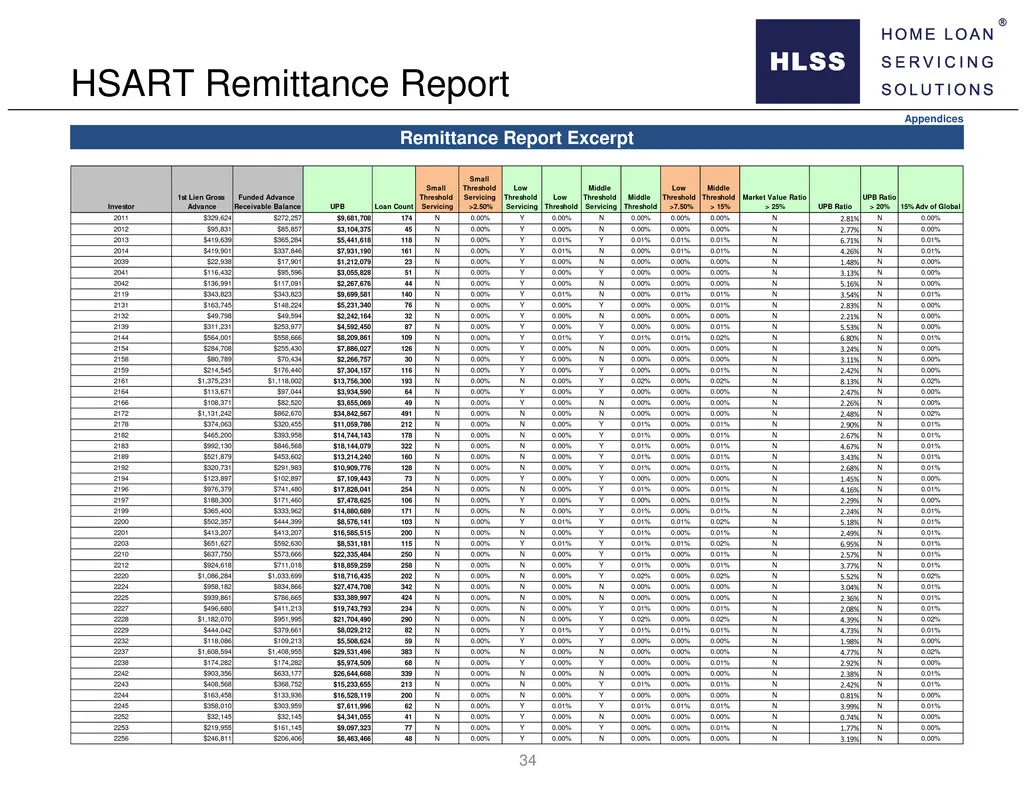
Remittance Report Excerpt Appendices HSART Remittance Report Investor 1st Lien Gross Advance Funded Advance Receivable Balance UPB Loan Count Small Threshold Servicing Small Threshold Servicing >2.50% Low Threshold Servicing Low Threshold Middle Threshold Servicing Middle Threshold Low Threshold >7.
Slide 35: Monthly Reimbursement Rate
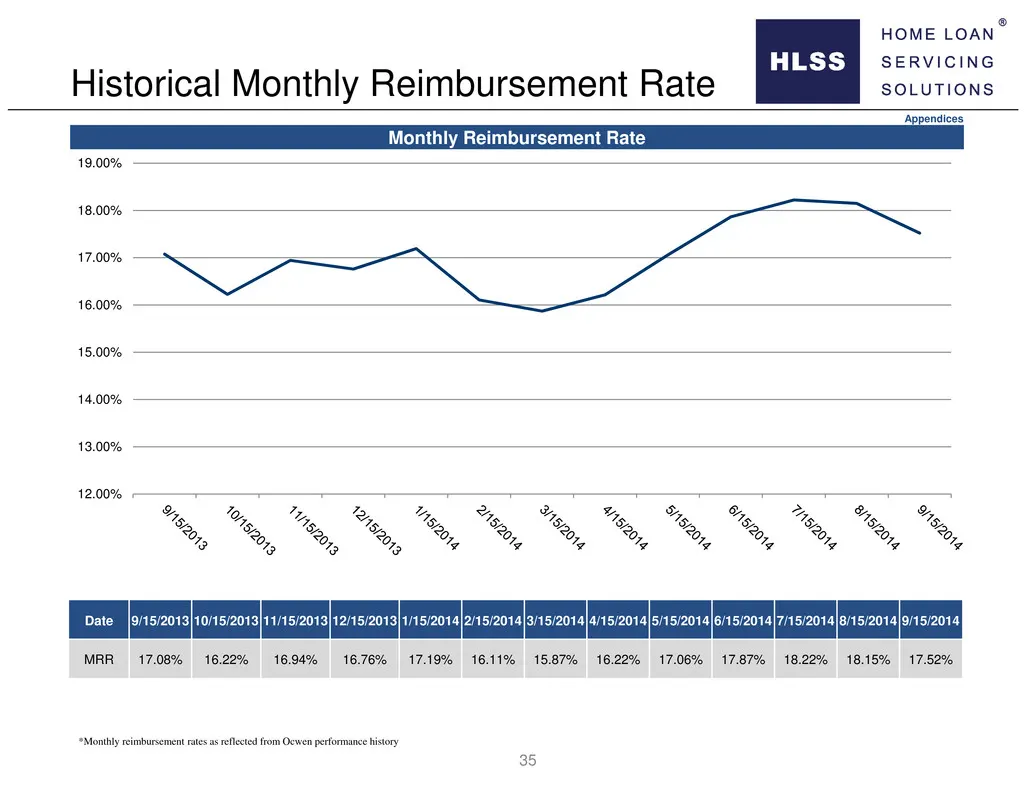
Monthly Reimbursement Rate Appendices Historical Monthly Reimbursement Rate *Monthly reimbursement rates as reflected from Ocwen performance history 35 12.00% 13.00% 14.00% 15.00% 16.00% 17.00% 18.00% 19.00% Date 9/15/2013 10/15/2013 11/15/2013 12/15/2013 1/15/2014 2/15/2014 3/15/2014 4/15/2014 5/15
Slide 36: P&I Judicial and Non-Judicial Recovery Curves
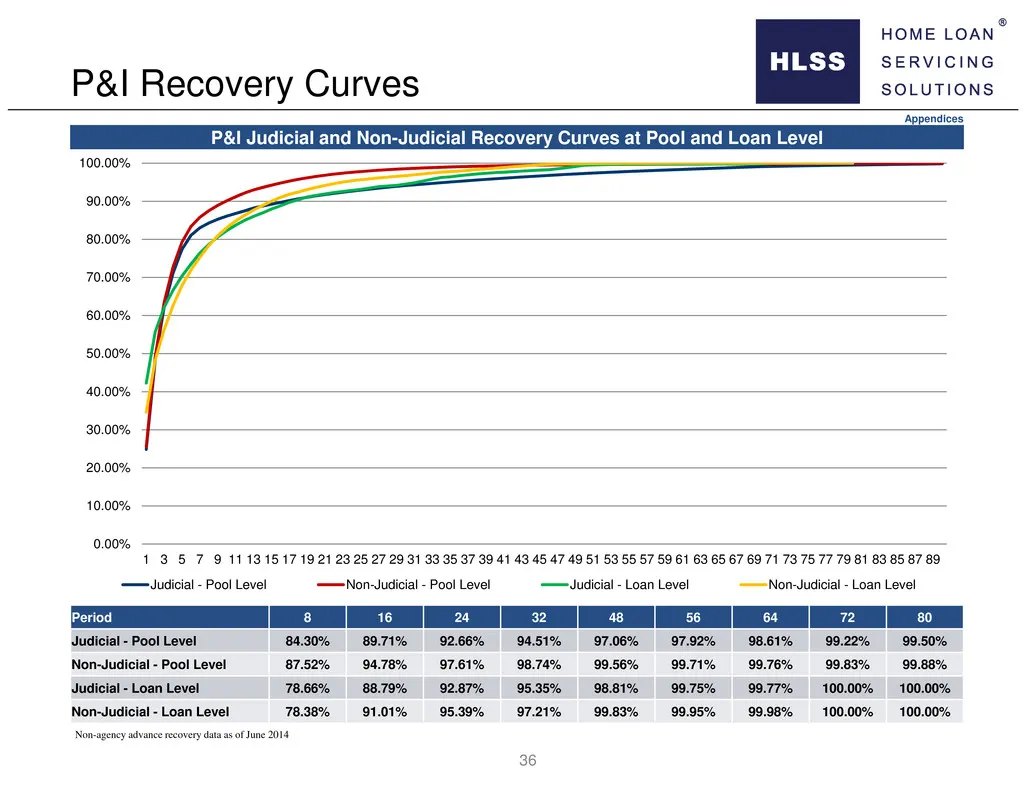
P&I Judicial and Non-Judicial Recovery Curves at Pool and Loan Level Appendices P&I Recovery Curves Non-agency advance recovery data as of June 2014 36 Period 8 16 24 32 48 56 64 72 80 Judicial - Pool Level 84.30% 89.71% 92.66% 94.51% 97.06% 97.92% 98.61% 99.22% 99.50% Non-Judicial - Pool Level 87.5
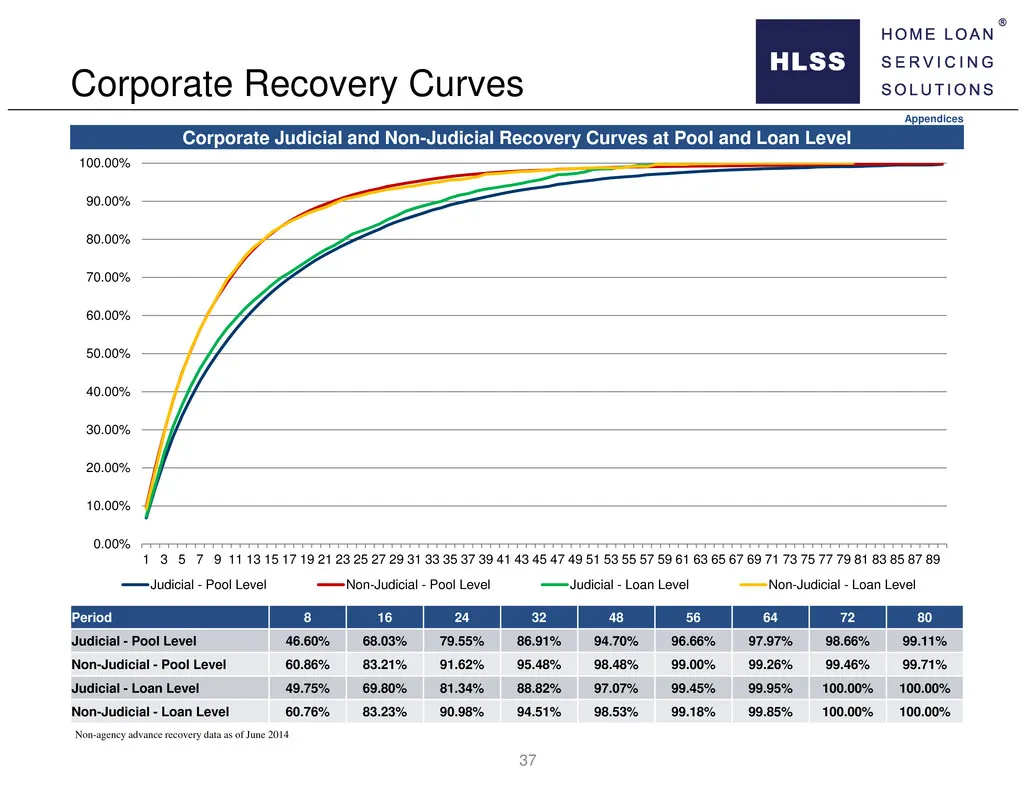
Slide 37: Corporate Judicial and Non-Judicial Recovery Curves
Corporate Judicial and Non-Judicial Recovery Curves at Pool and Loan Level Appendices Corporate Recovery Curves 37 Non-agency advance recovery data as of June 2014 Period 8 16 24 32 48 56 64 72 80 Judicial - Pool Level 46.60% 68.03% 79.55% 86.91% 94.70% 96.66% 97.97% 98.66% 99.11% Non-Judicial - Poo
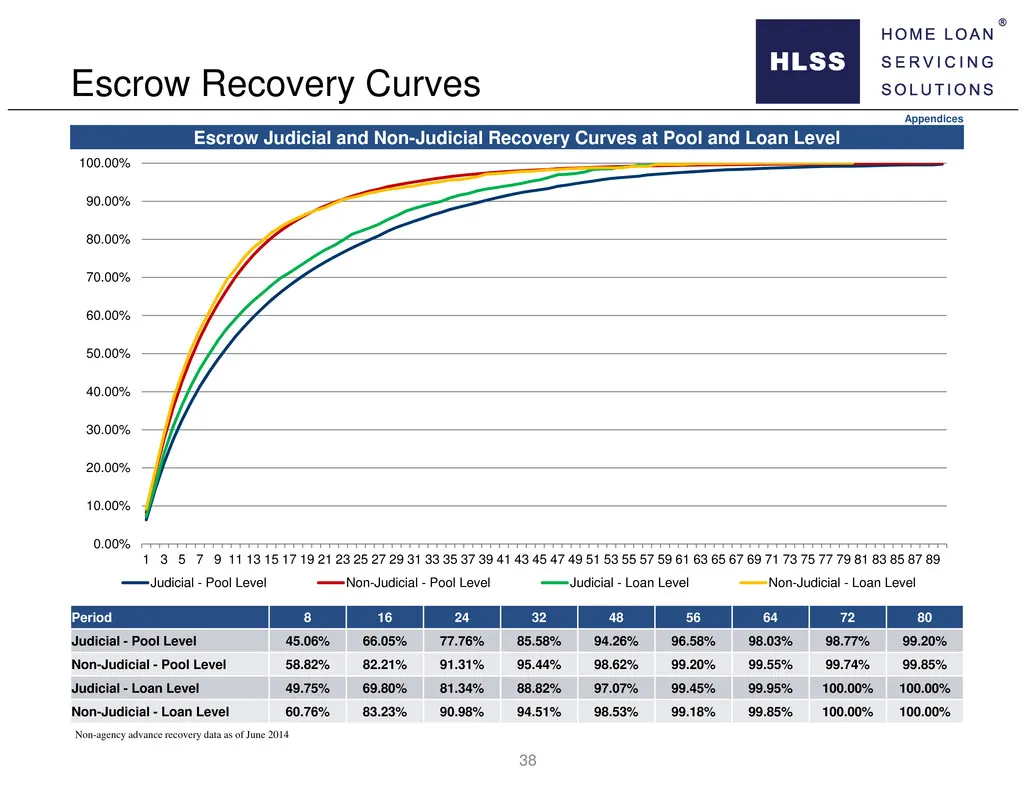
Slide 38: Escrow Judicial and Non-Judicial Recovery Curves
Escrow Judicial and Non-Judicial Recovery Curves at Pool and Loan Level Appendices Escrow Recovery Curves 38 Non-agency advance recovery data as of June 2014 Period 8 16 24 32 48 56 64 72 80 Judicial - Pool Level 45.06% 66.05% 77.76% 85.58% 94.26% 96.58% 98.03% 98.77% 99.20% Non-Judicial - Pool Leve
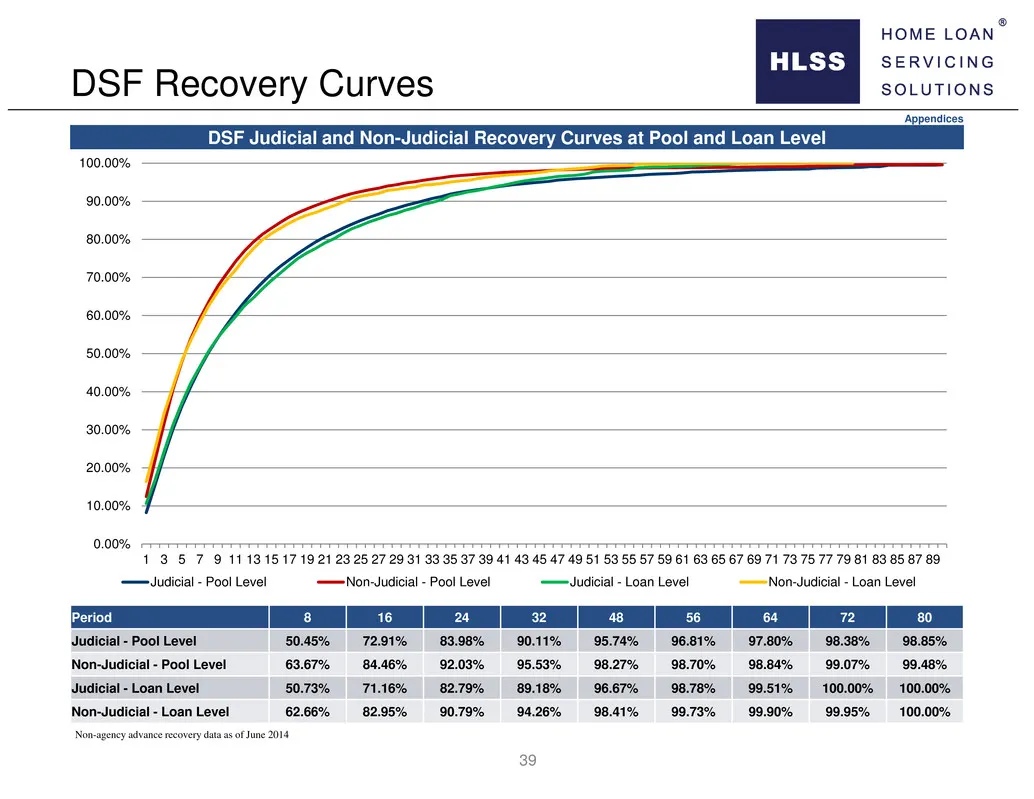
Slide 39: DSF Judicial and Non-Judicial Recovery Curves
DSF Judicial and Non-Judicial Recovery Curves at Pool and Loan Level Appendices DSF Recovery Curves 39 Non-agency advance recovery data as of June 2014 Period 8 16 24 32 48 56 64 72 80 Judicial - Pool Level 50.45% 72.91% 83.98% 90.11% 95.74% 96.81% 97.80% 98.38% 98.85% Non-Judicial - Pool Level 63.6
Slide 40: HLSS Servicer Advance Receivables Trust ABS East 2014
HLSS Servicer Advance Receivables Trust ABS East 2014 Investor Presentation
Source: SEC EDGAR · 8-K filed Sep 22, 2014
More decks from Home Loan Servicing Solutions Ltd
 Merger or Acquisition (February 2015)6 slides · Feb 23, 2015
 Q3 2014 Earnings Presentation15 slides · Oct 21, 2014
 Investor Presentation (September 2014)14 slides · Sep 8, 2014
 Investor Presentation (May 2014)17 slides · May 20, 2014
 Debt Investor Presentation (January 2014)45 slides · Jan 23, 2014
 Investor Presentation (December 2013)40 slides · Dec 3, 2013