Deutsche Rohstoff AG · XETR:DR0
Deutsche Rohstoff — Investor Presentation (February 2023)
28 slides from Deutsche Rohstoff's investor presentation, Feb 28, 2023
Slide 1: Company presentation
Company presentation March 2023
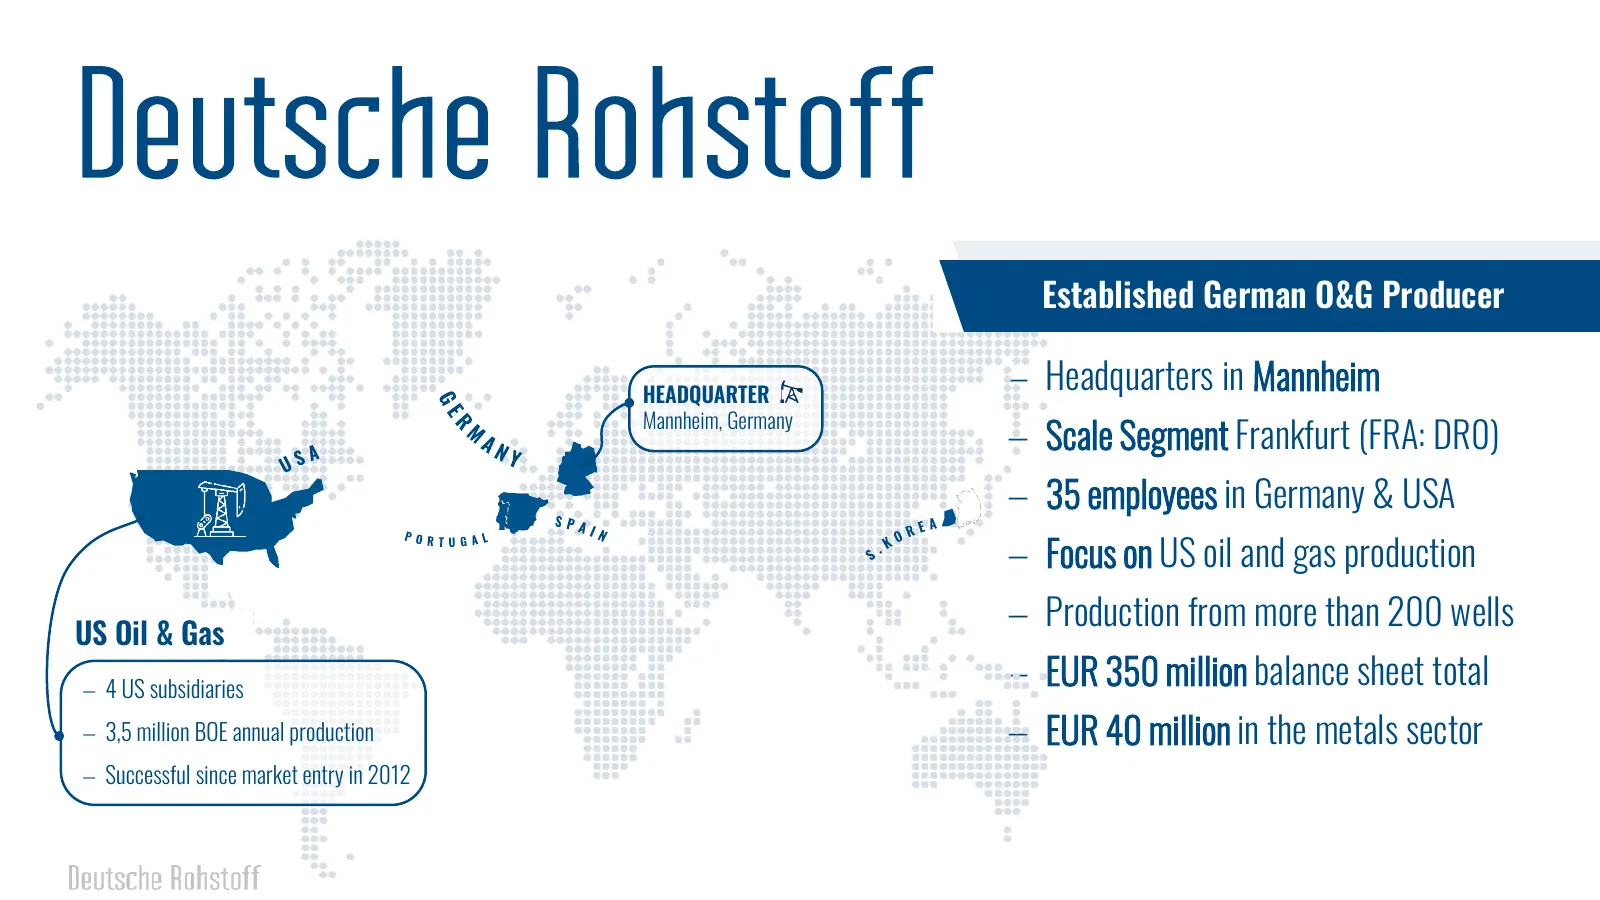
Slide 2: Established German O&G Producer
Established German O&G Producer HEADQUARTER − Headquarters in Mannheim Mannheim, Germany − Scale Segment Frankfurt (FRA: DR0) − 35 employees in Germany & USA − Focus on US oil and gas production − Production from more than 200 wells US Oil & Gas − 4 US subsidiaries − EUR 350 million balance sheet to
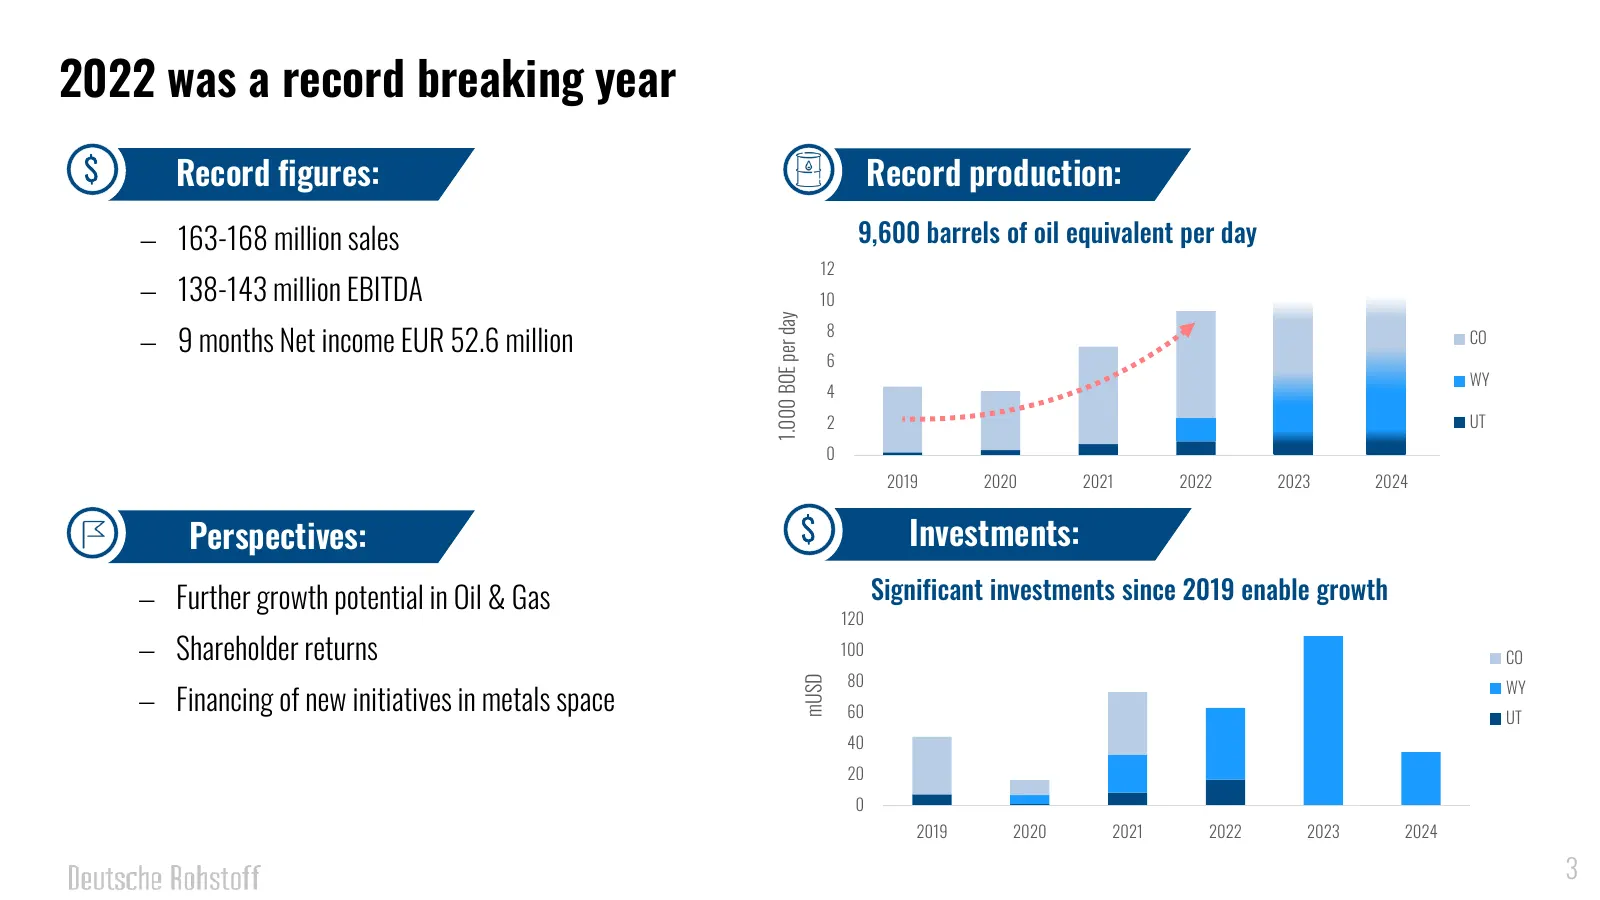
Slide 3: 2022 was a record breaking year
3 2022 was a record breaking year $ Record figures: Record production: − 163-168 million sales 9,600 barrels of oil equivalent per day 12 − 138-143 million EBITDA 10 1.000 BOE per day − 9 months Net income EUR 52.6 million 8 CO 6 WY 4 2 UT 0 2019 2020 2021 2022 2023 2024 Perspectives: $ Investments:
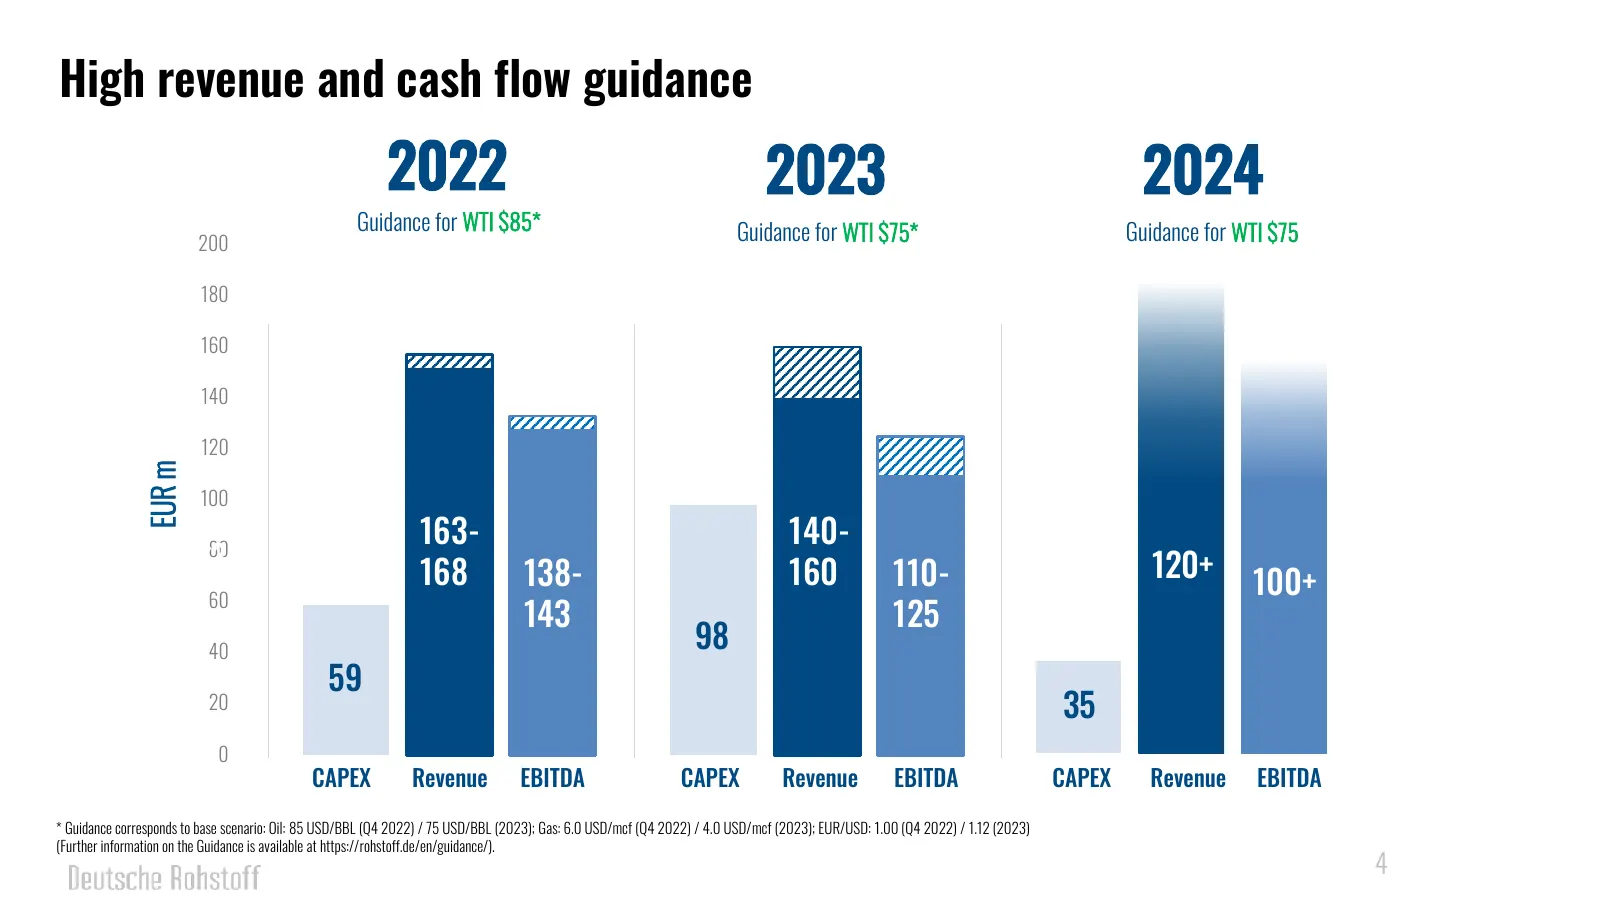
Slide 4: High revenue and cash flow guidance
4 High revenue and cash flow guidance 2022 2023 2024 Guidance for WTI $85* Guidance for WTI $75* Guidance for WTI $75 200 180 160 140 120 EUR m 100 163- 140- 135 80 168 138- 160 110- 120+ 60 131 100+ 143 125 40 98 59 20 35 0 CAPEX Revenue EBITDA CAPEX Revenue EBITDA CAPEX Revenue EBITDA * Guidance c
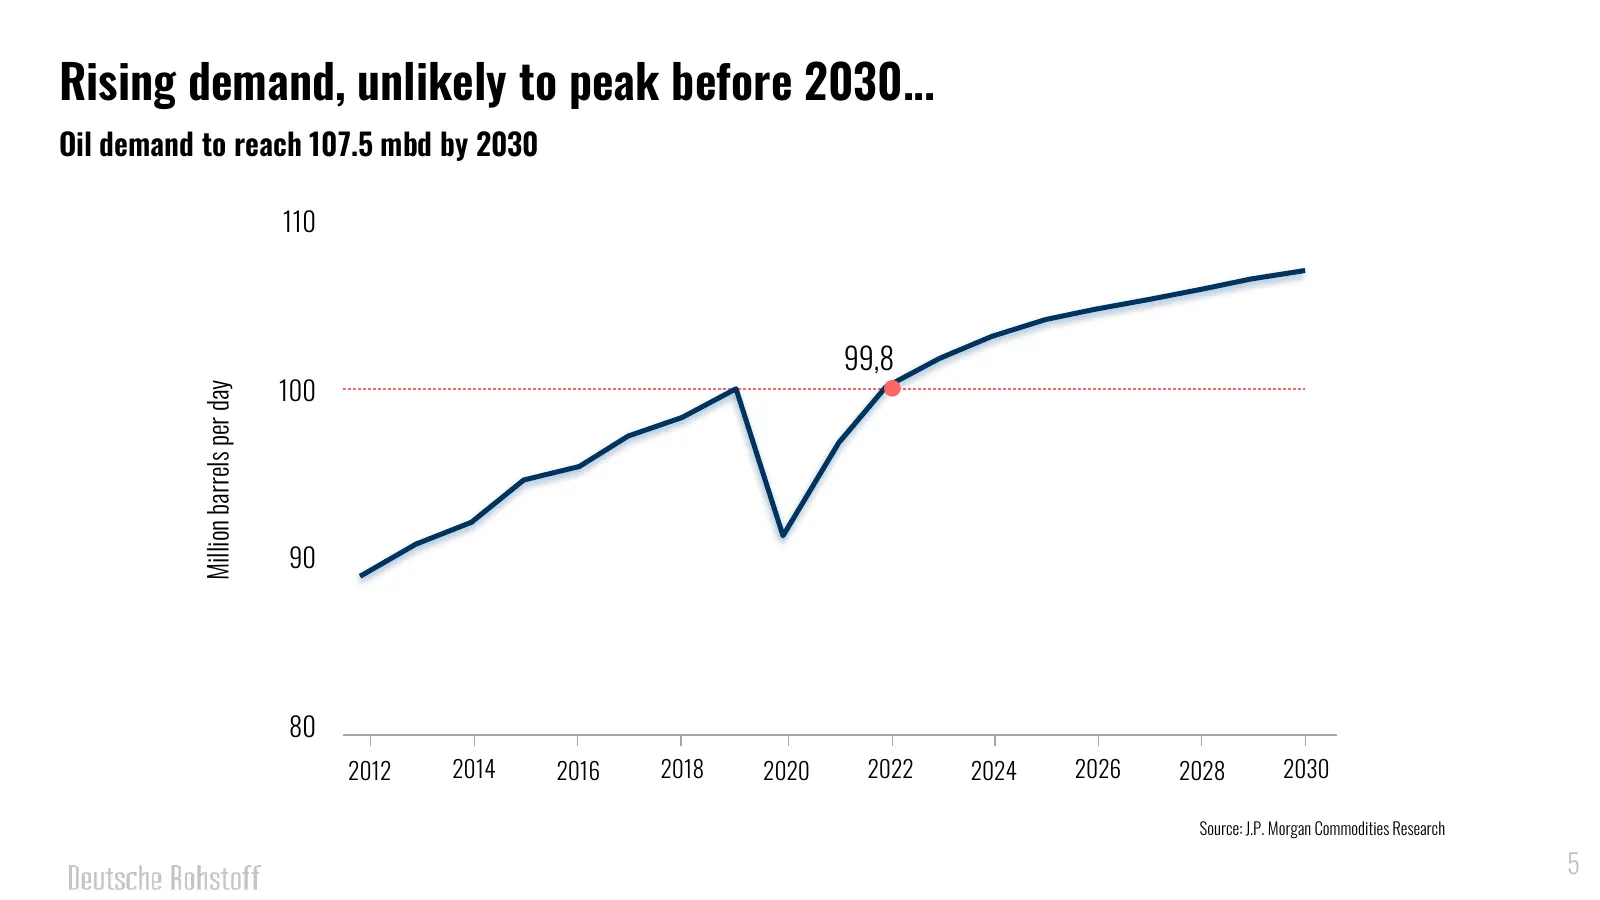
Slide 5: Rising demand, unlikely to peak before 2030
5 Rising demand, unlikely to peak before 2030... Oil demand to reach 107.5 mbd by 2030 110 99,8 100 Million barrels per day 90 80 2012 2014 2016 2018 2020 2022 2024 2026 2028 2030 Source: J.P. Morgan Commodities Research 5
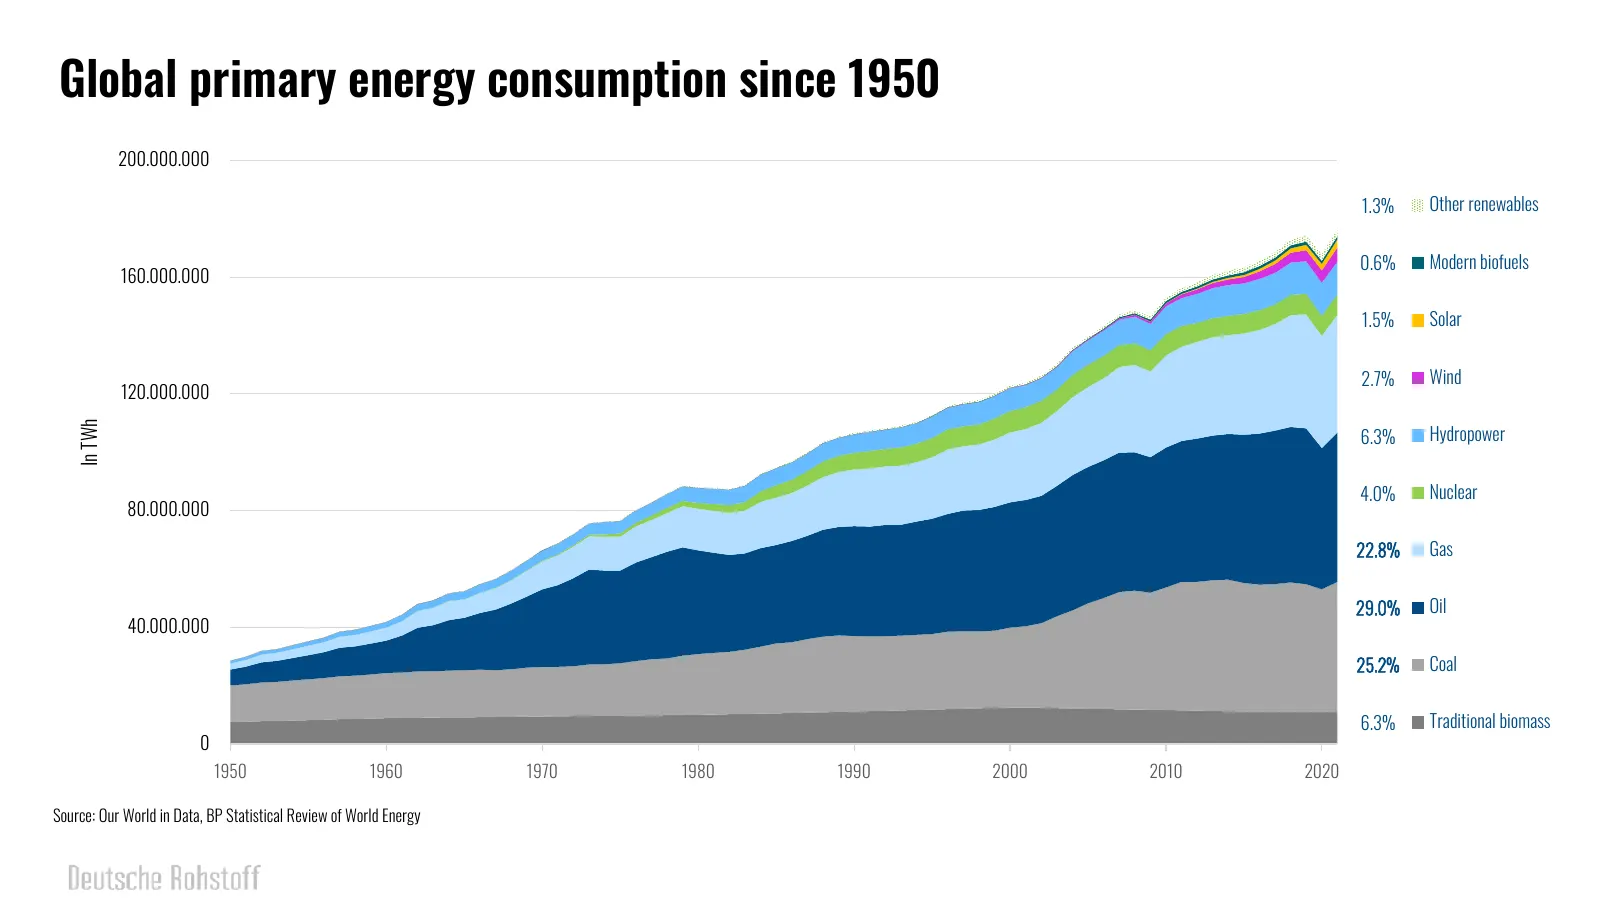
Slide 6: Global primary energy consumption since 1950
6 Global primary energy consumption since 1950 200.000.000 1.3% Other renewables 0.6% Modern biofuels 160.000.000 1.5% Solar 2.7% Wind 120.000.000 In TWh 6.3% Hydropower 4.0% Nuclear 80.000.000 22.8% Gas 29.0% Oil 40.000.000 25.2% Coal 6.3% Traditional biomass 0 1950 1960 1970 1980 1990 2000 2010 20
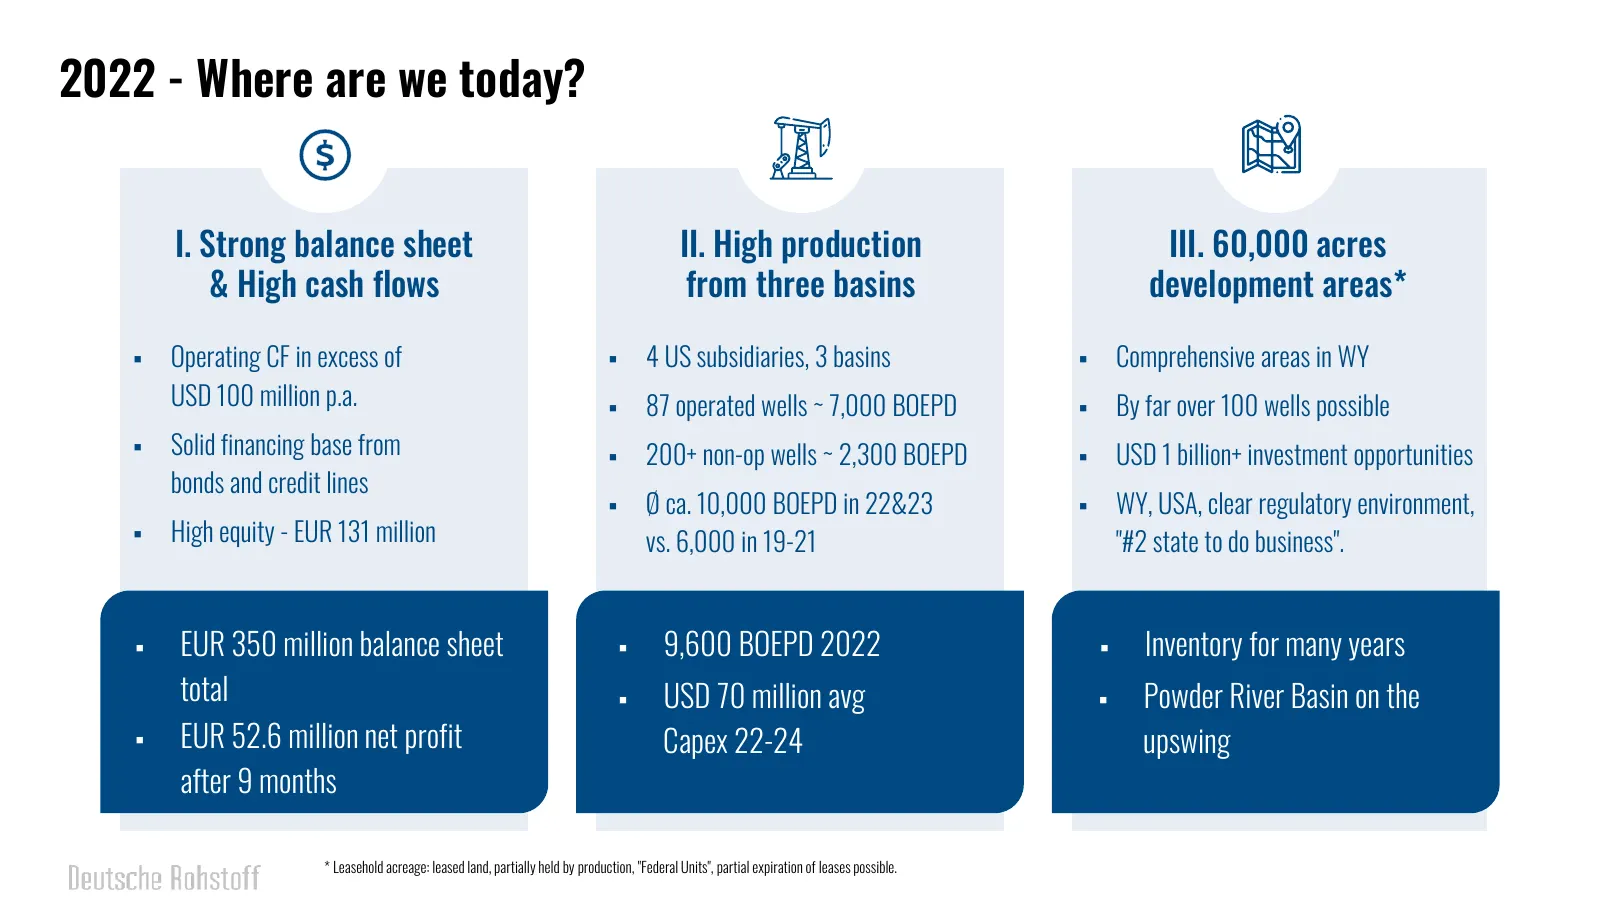
Slide 7: 2022 - Where are we today?
7 2022 - Where are we today? I. Strong balance sheet II. High production III. 60,000 acres & High cash flows from three basins development areas* ▪ Operating CF in excess of ▪ 4 US subsidiaries, 3 basins ▪ Comprehensive areas in WY USD 100 million p.a. ▪ 87 operated wells ~ 7,000 BOEPD ▪ By far over
Slide 8: 8
8 8
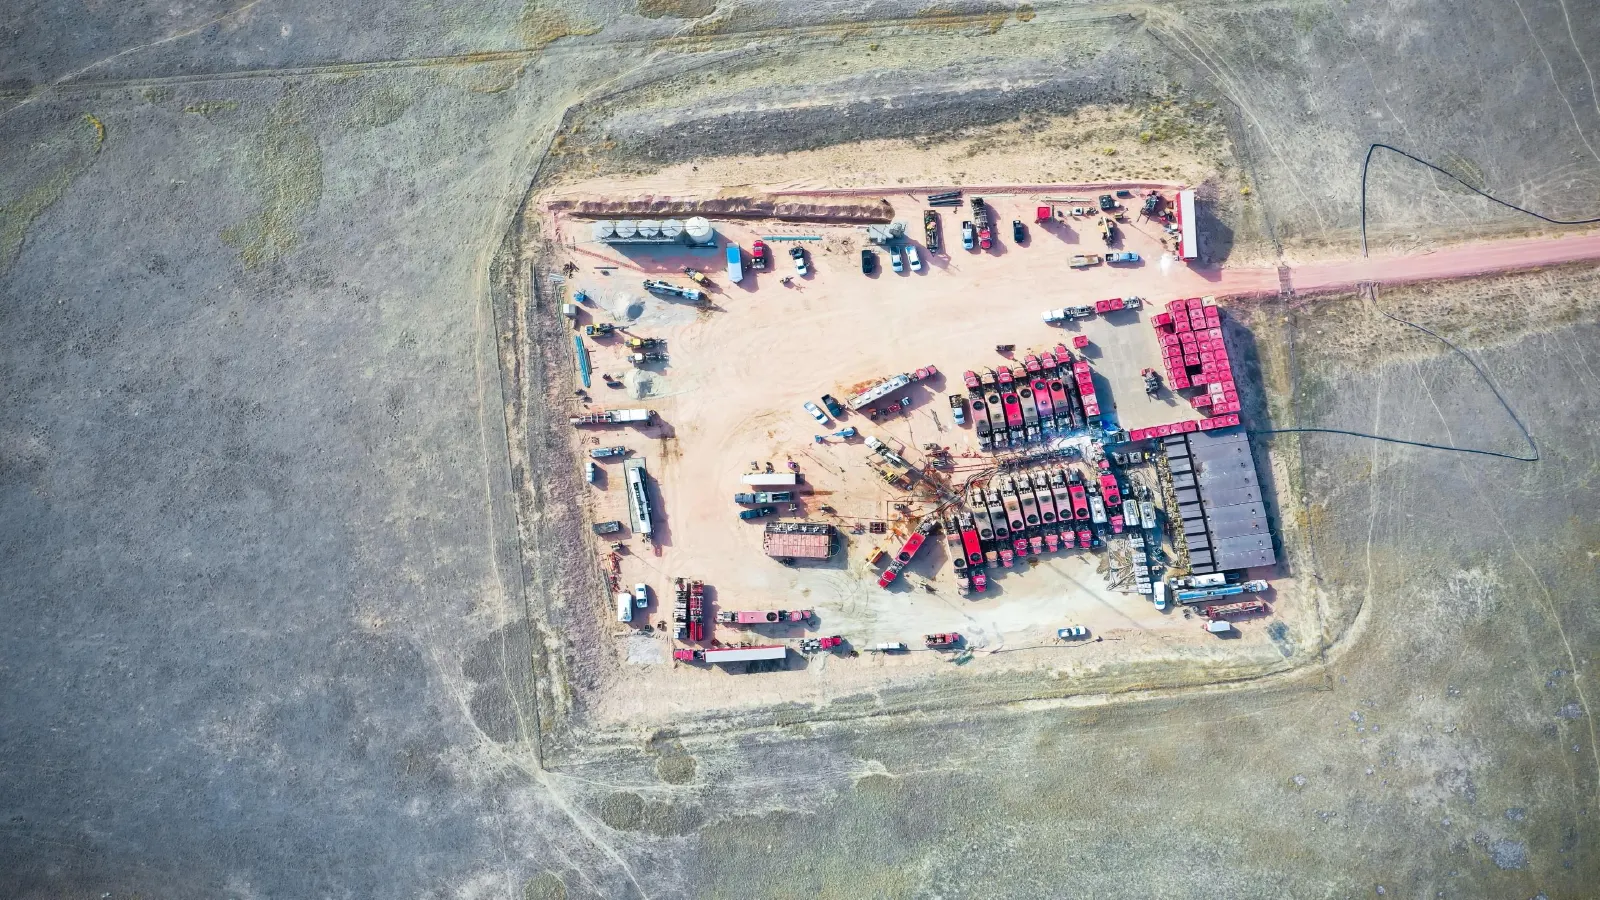
Slide 9: 9
9 9
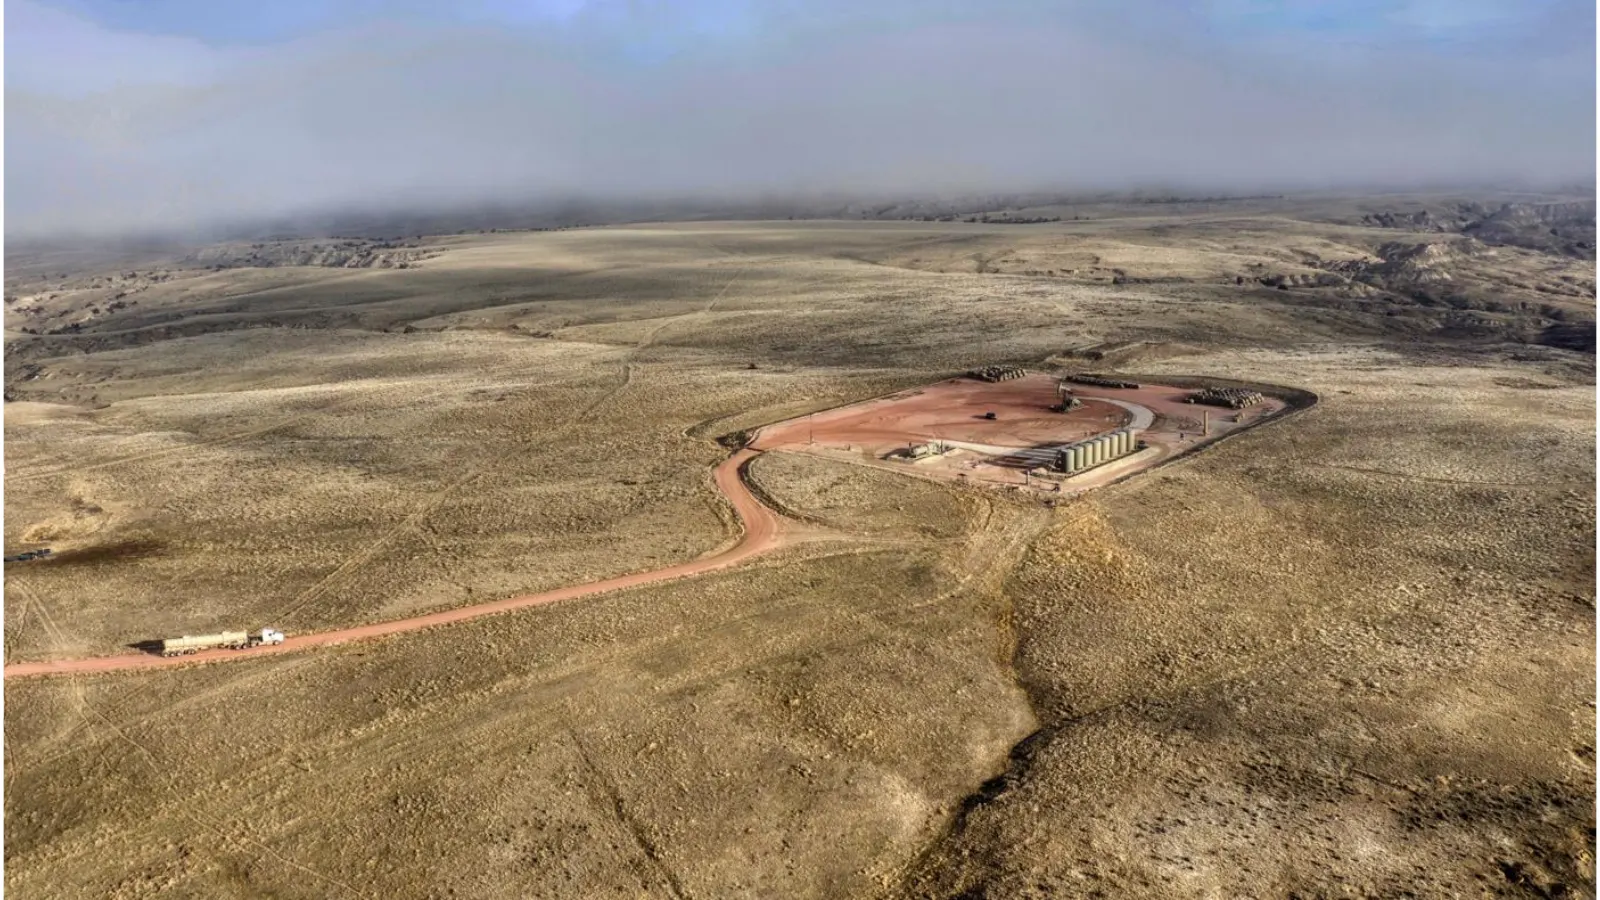
Slide 10: 10
10 10
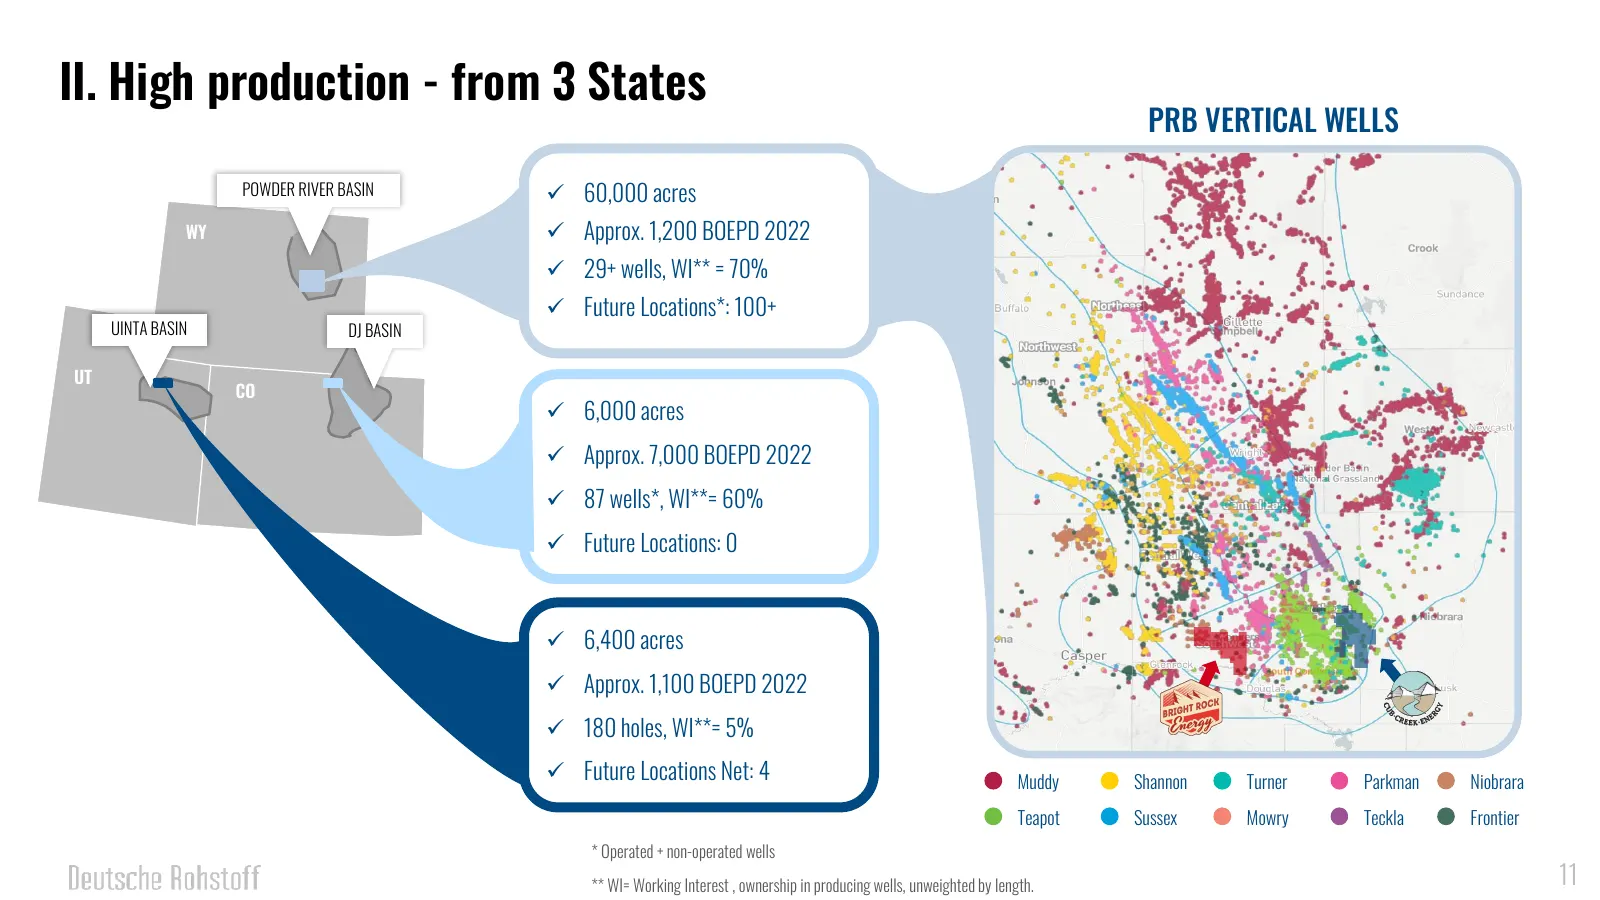
Slide 11: II. High production - from 3 States
11 II. High production - from 3 States PRB VERTICAL WELLS POWDER RIVER BASIN ✓ 60,000 acres WY ✓ Approx. 1,200 BOEPD 2022 ✓ 29+ wells, WI** = 70% ✓ Future Locations*: 100+ UINTA BASIN DJ BASIN UT CO ✓ 6,000 acres ✓ Approx. 7,000 BOEPD 2022 ✓ 87 wells*, WI**= 60% ✓ Future Locations: 0 ✓ 6,400 acres ✓
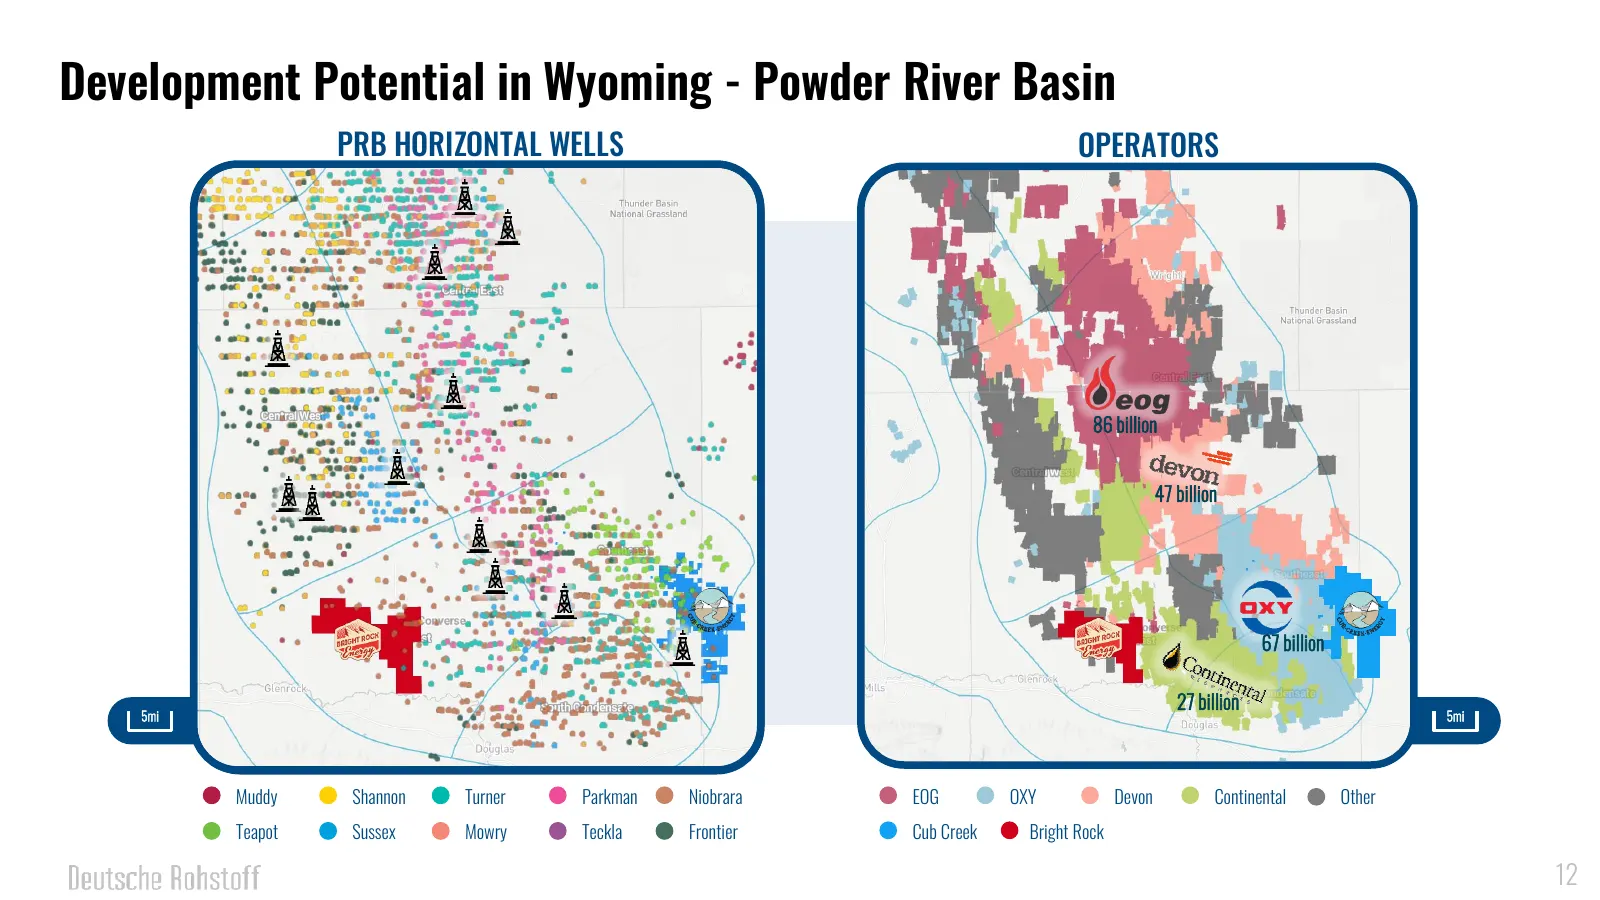
Slide 12: Development Potential in Wyoming - Powder River Basin
12 Development Potential in Wyoming - Powder River Basin PRB HORIZONTAL WELLS OPERATORS 86 billion 47 billion 67 billion 27 billion 5mi 5mi Muddy Shannon Turner Parkman Niobrara EOG OXY Devon Continental Other Teapot Sussex Mowry Teckla Frontier Cub Creek Bright Rock 12
Slide 13: Extensive acreage in Wyoming
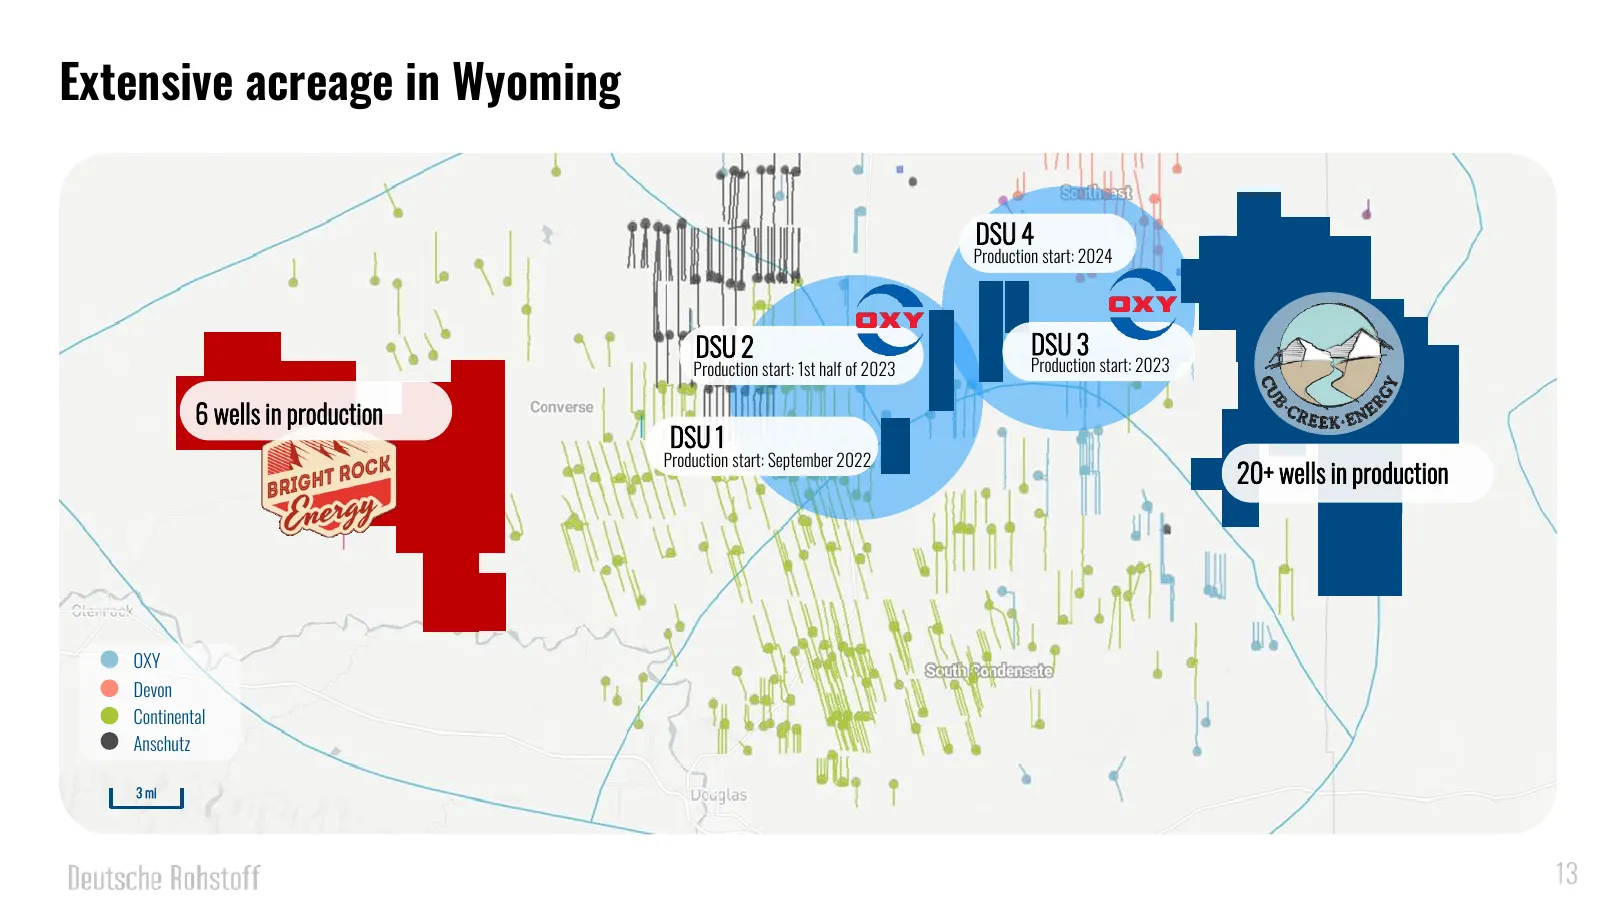
13 Extensive acreage in Wyoming DSU 4 Production start: 2024 DSU 2 DSU 3 Production start: 1st half of 2023 Production start: 2023 6 wells in production DSU 1 Production start: September 2022 20+ wells in production OXY Devon Continental Anschutz 3 mi 13
Slide 14: yor _ Ha
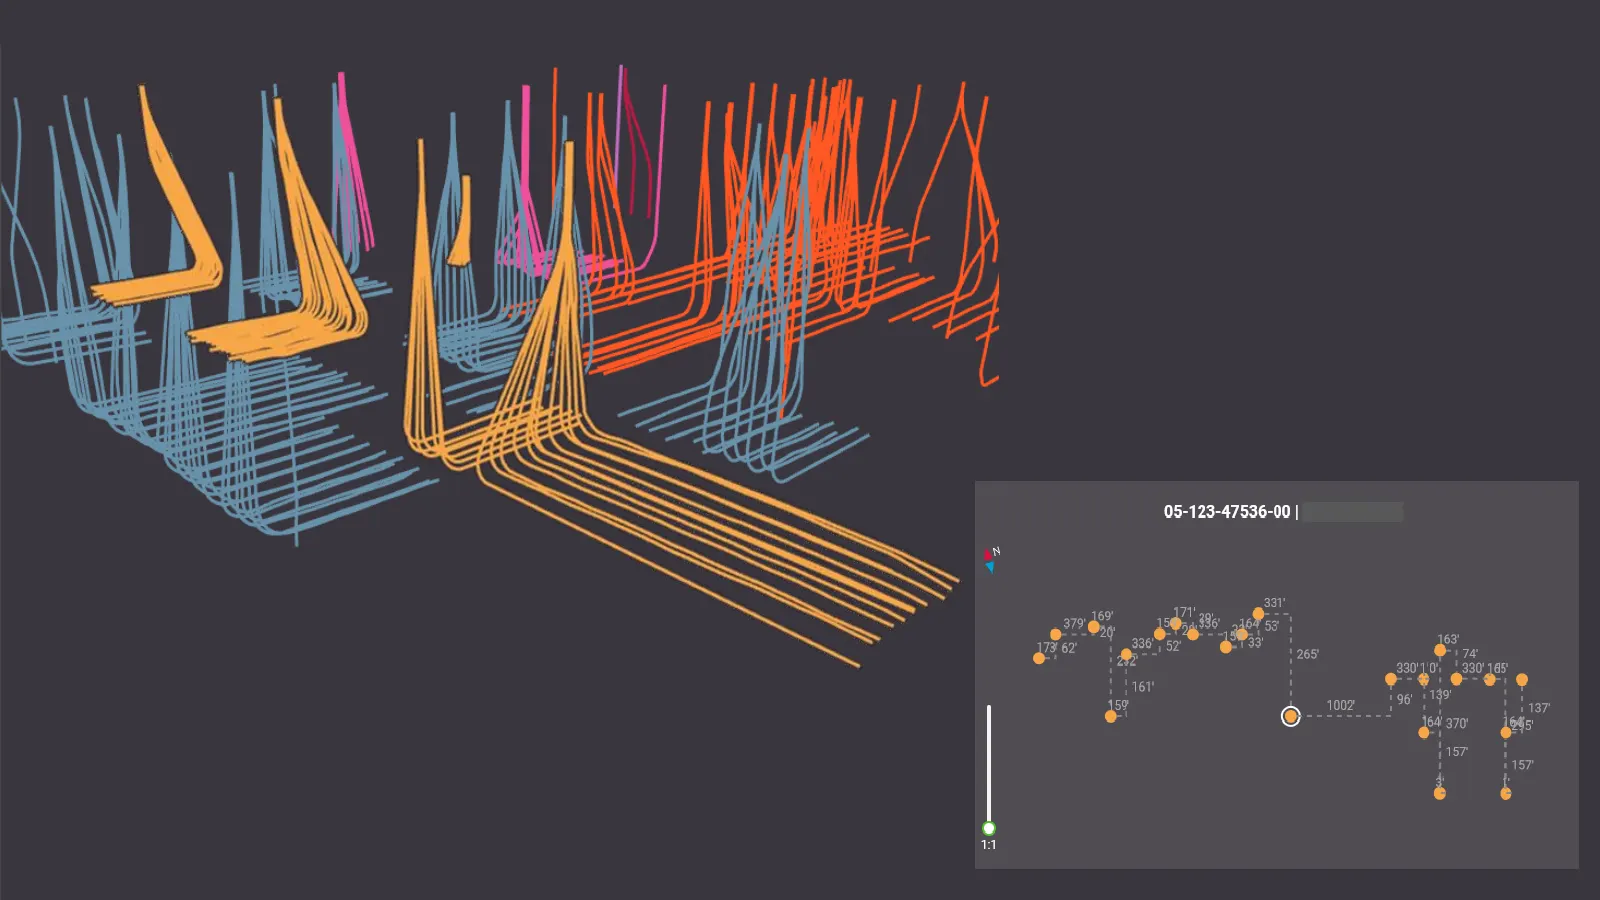
05-123-47536-00 | 63! 178 0 ee yor _ 96 5 Ha © —— em ee io
Slide 15: Wyoming - Example of Potential Wells
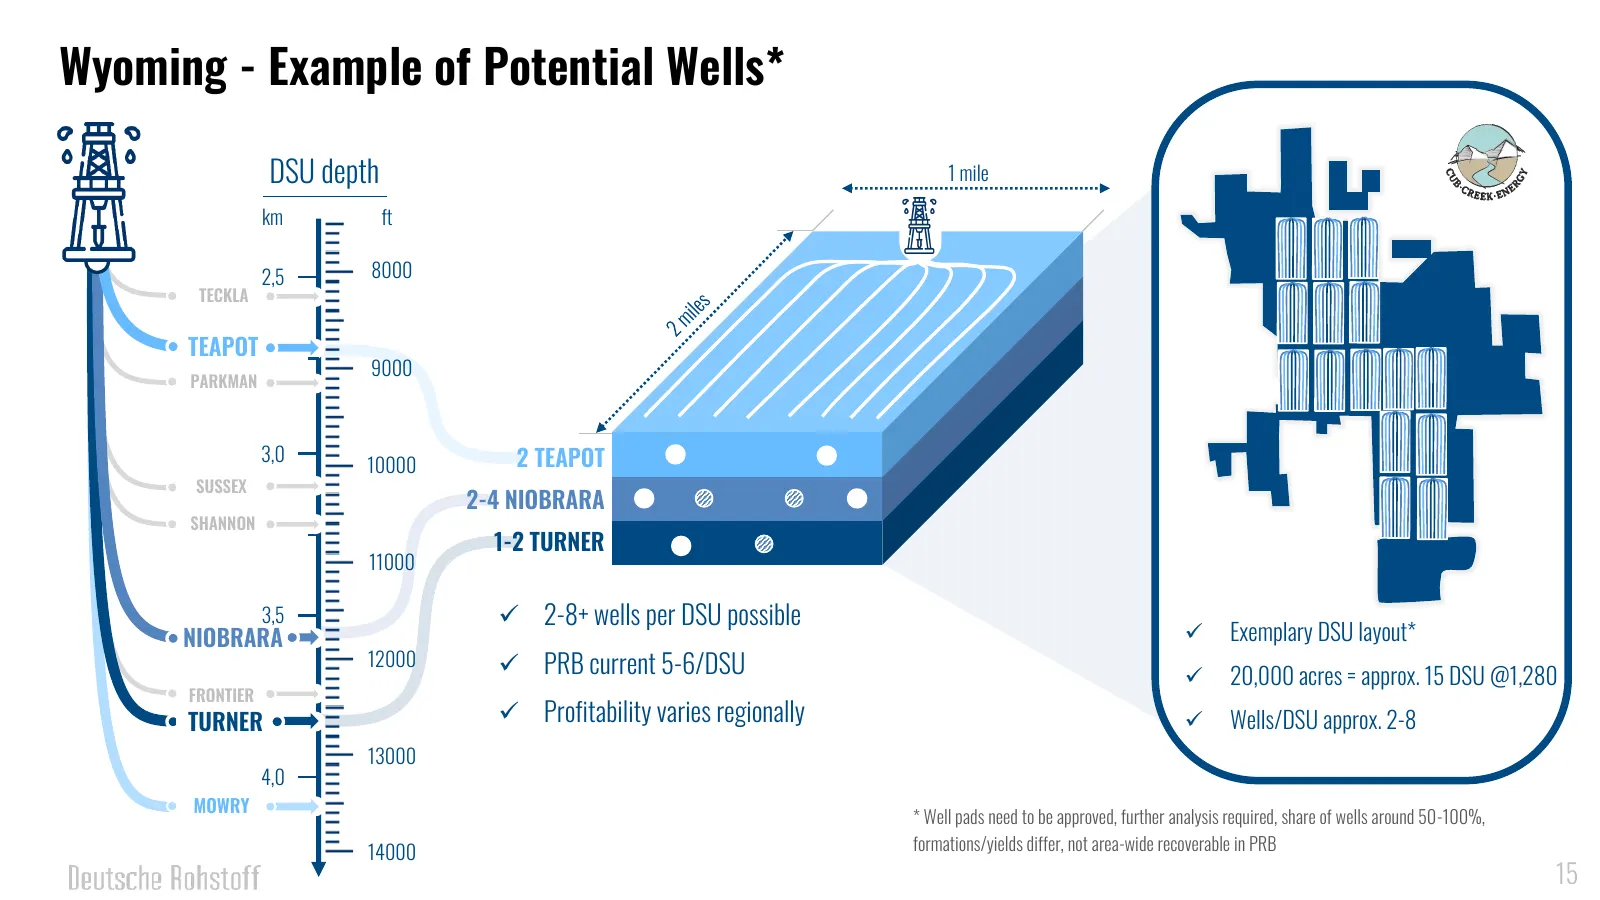
15 Wyoming - Example of Potential Wells* DSU depth 1 mile km ft 2,5 8000 TECKLA TEAPOT 9000 PARKMAN 3,0 2 TEAPOT 10000 SUSSEX 2-4 NIOBRARA SHANNON 1-2 TURNER 11000 3,5 ✓ 2-8+ wells per DSU possible NIOBRARA ✓ Exemplary DSU layout* 12000 ✓ PRB current 5-6/DSU ✓ 20,000 acres = approx. 15 DSU @1,280 FR
Slide 16: Wyoming - Evolution of Well Performance
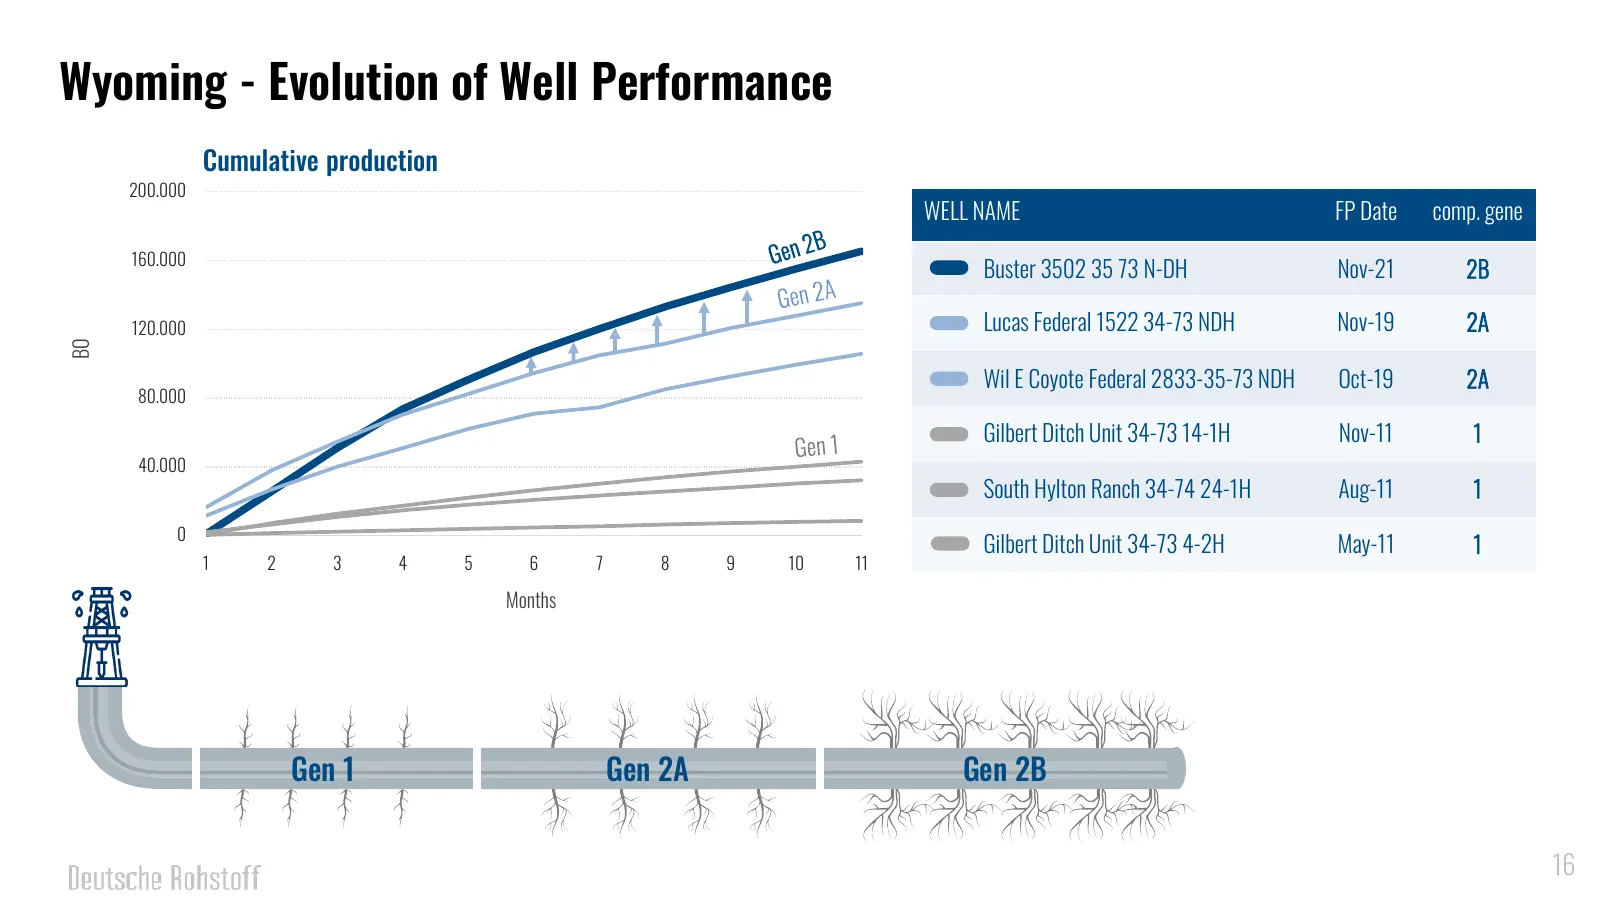
16 Wyoming - Evolution of Well Performance Cumulative production 200.000 WELL NAME FP Date comp. gene 160.000 Buster 3502 35 73 N-DH Nov-21 2B 120.000 Lucas Federal 1522 34-73 NDH Nov-19 2A BO Wil E Coyote Federal 2833-35-73 NDH Oct-19 2A 80.000 Gilbert Ditch Unit 34-73 14-1H Nov-11 1 40.000 South H
Slide 17: CAPEX OPEX
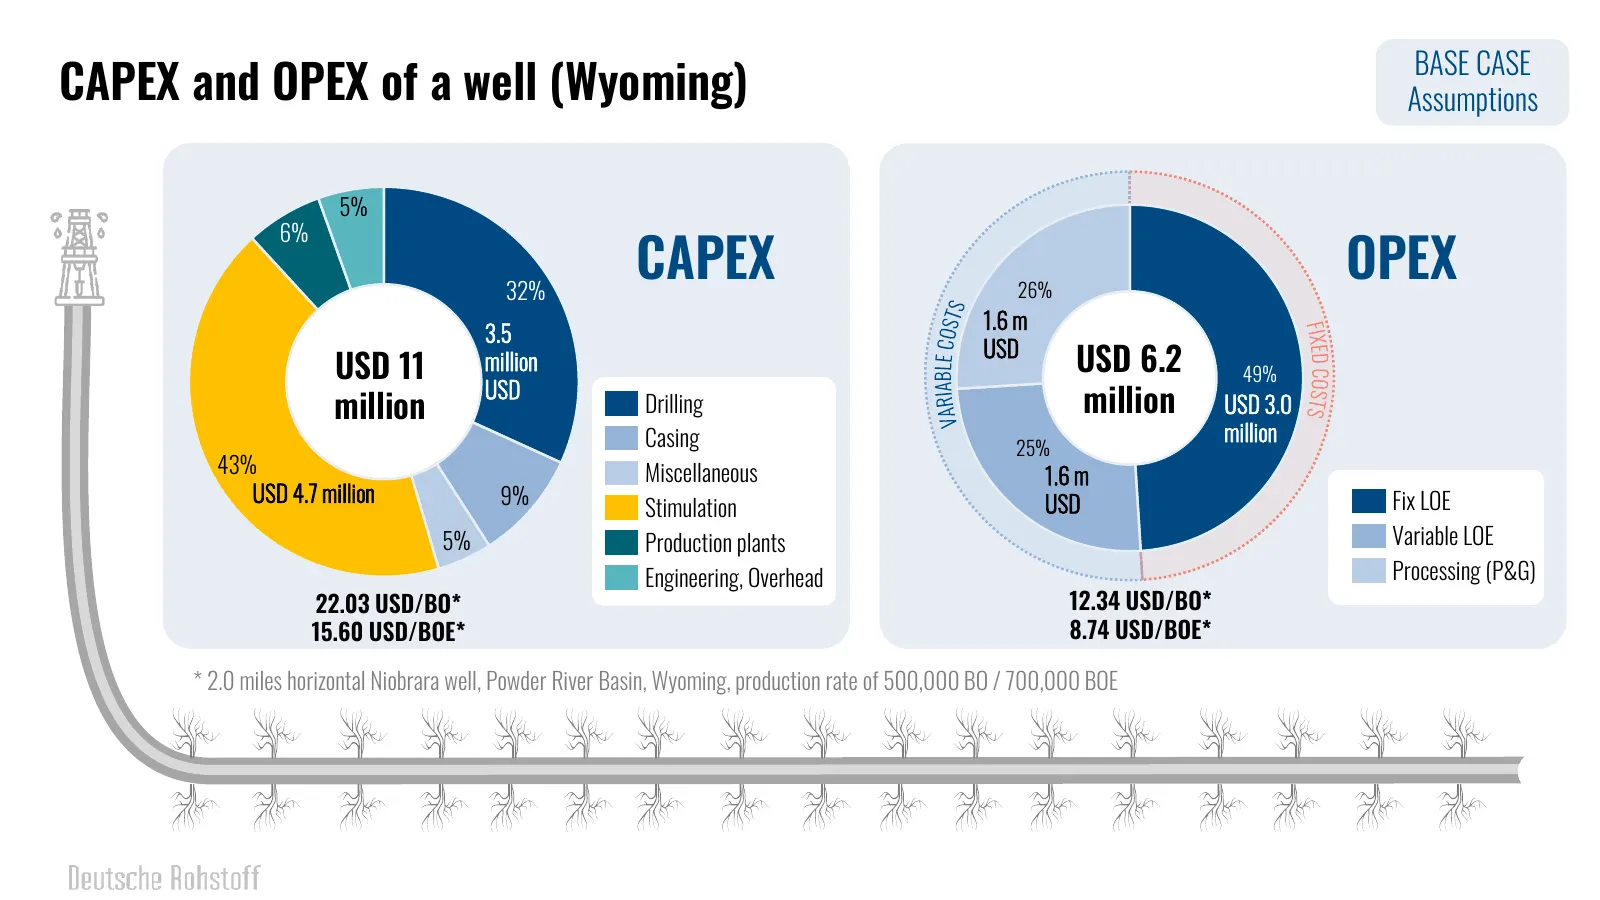
17 BASE CASE CAPEX and OPEX of a well (Wyoming) Assumptions 5% 6% 32% CAPEX 26% OPEX 1.6 m 3.5 USD USD 11 million USD 6.2 49% USD million Drilling million USD 3.0 Casing million 25% 43% Miscellaneous 1.6 m USD 4.7 million 9% USD Fix LOE Stimulation 5% Production plants Variable LOE Engineering, Over
Slide 18: USD/Barrel Oil Cost Breakdown - Wyoming Single Well Economics
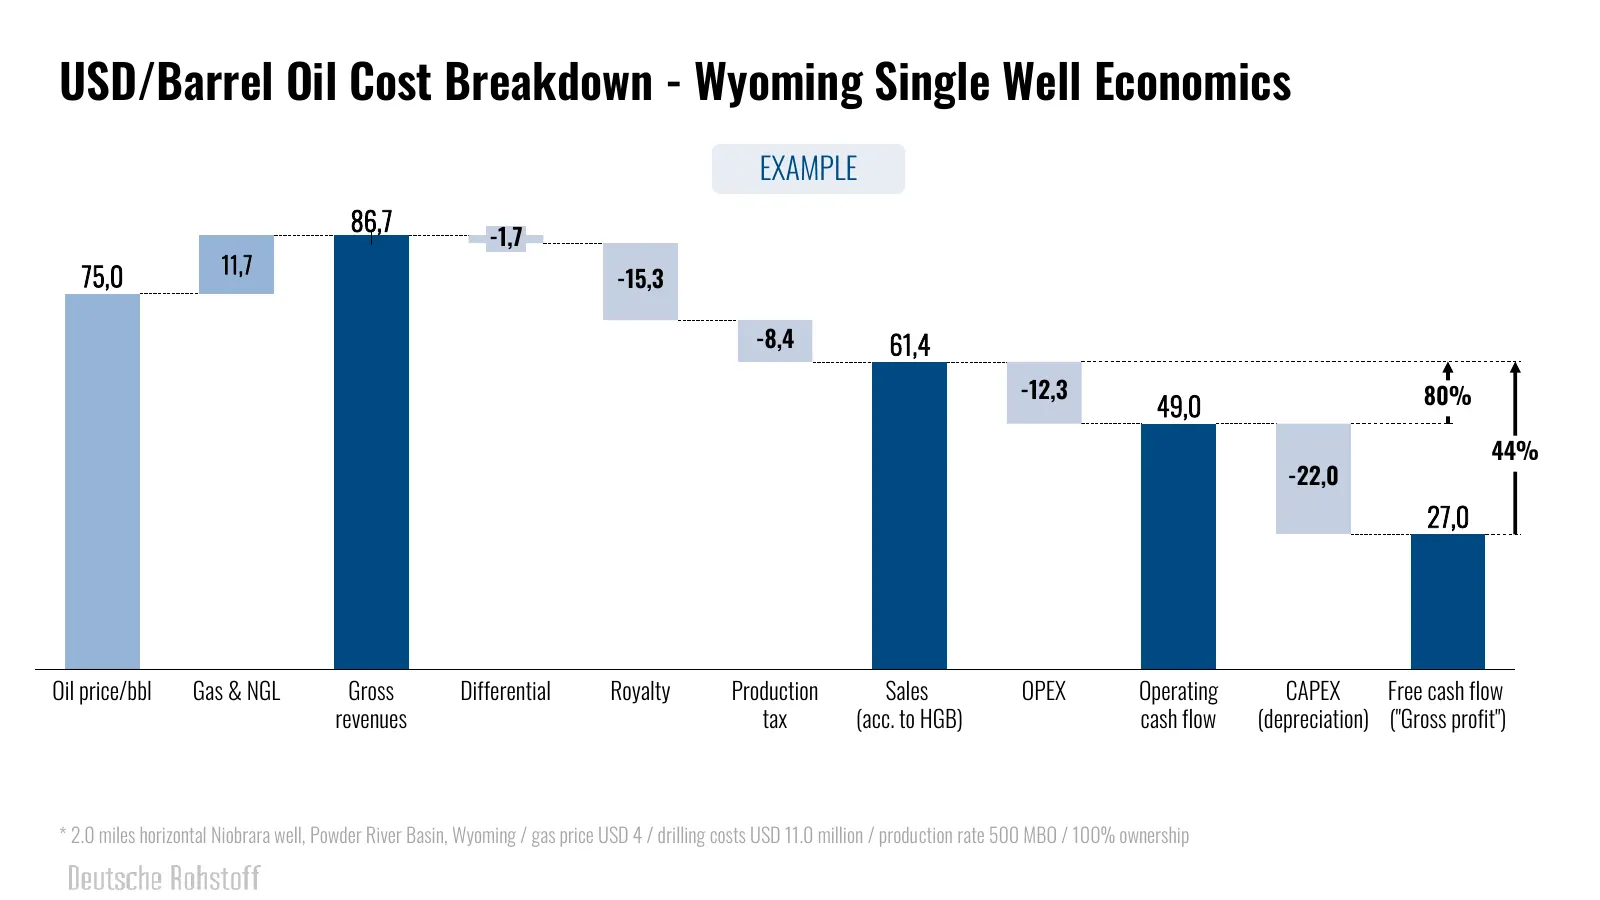
18 USD/Barrel Oil Cost Breakdown - Wyoming Single Well Economics EXAMPLE 86,7 -1,7 11,7 75,0 -15,3 -8,4 61,4 -12,3 80% 49,0 44% -22,0 27,0 Oil price/bbl Gas & NGL Gross Differential Royalty Production Sales OPEX Operating CAPEX Free cash flow revenues tax (acc. to HGB) cash flow (depreciation) ("Gro
Slide 19: Significant investments and extensive development potential
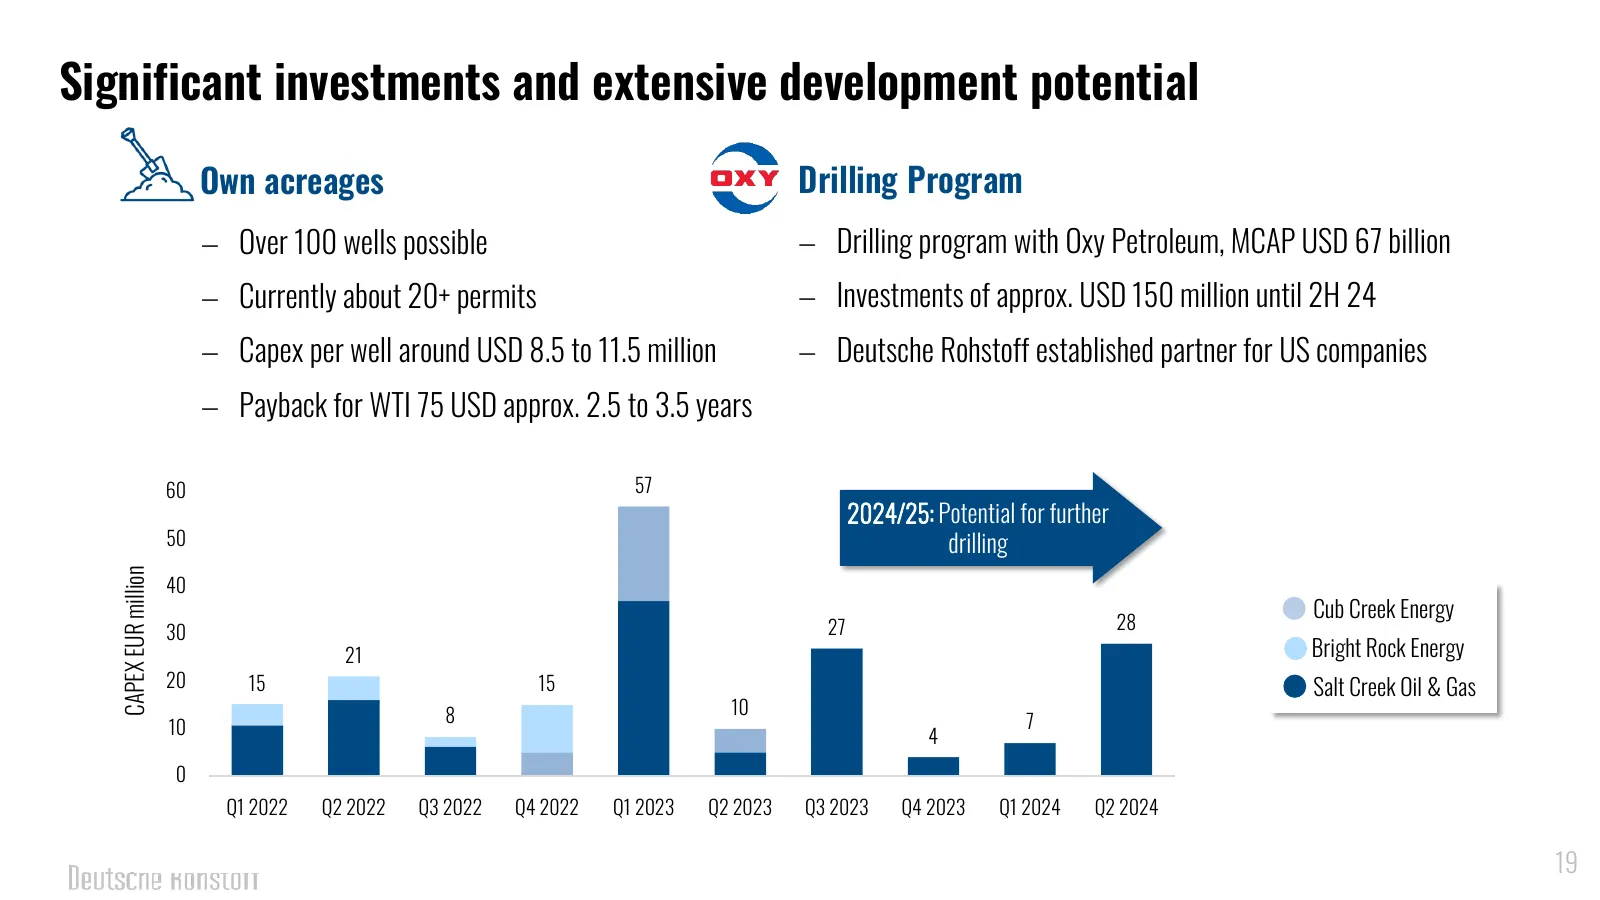
19 Significant investments and extensive development potential Own acreages Drilling Program − Over 100 wells possible − Drilling program with Oxy Petroleum, MCAP USD 67 billion − Currently about 20+ permits − Investments of approx. USD 150 million until 2H 24 − Capex per well around USD 8.5 to 11.5
Slide 20: Rising NPV of oil reserves despite strong production in previous year
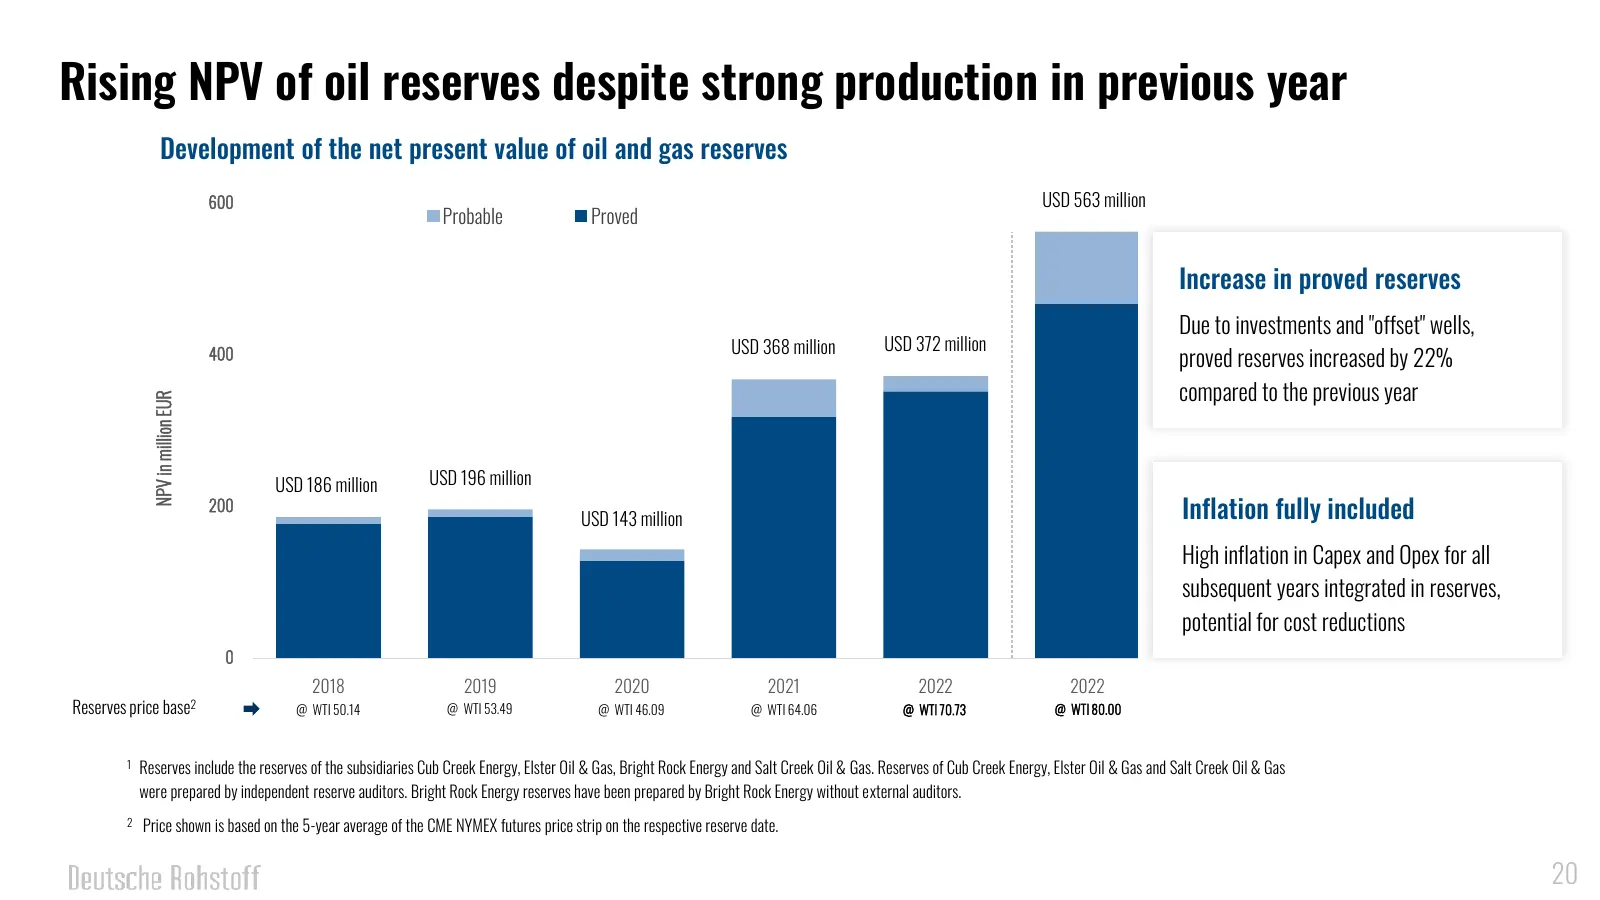
20 Rising NPV of oil reserves despite strong production in previous year Development of the net present value of oil and gas reserves 600 USD 563 million Wahrscheinlich Probable Sicher Proved Increase in proved reserves Due to investments and "offset" wells, USD 368 million USD 372 million 400 prove
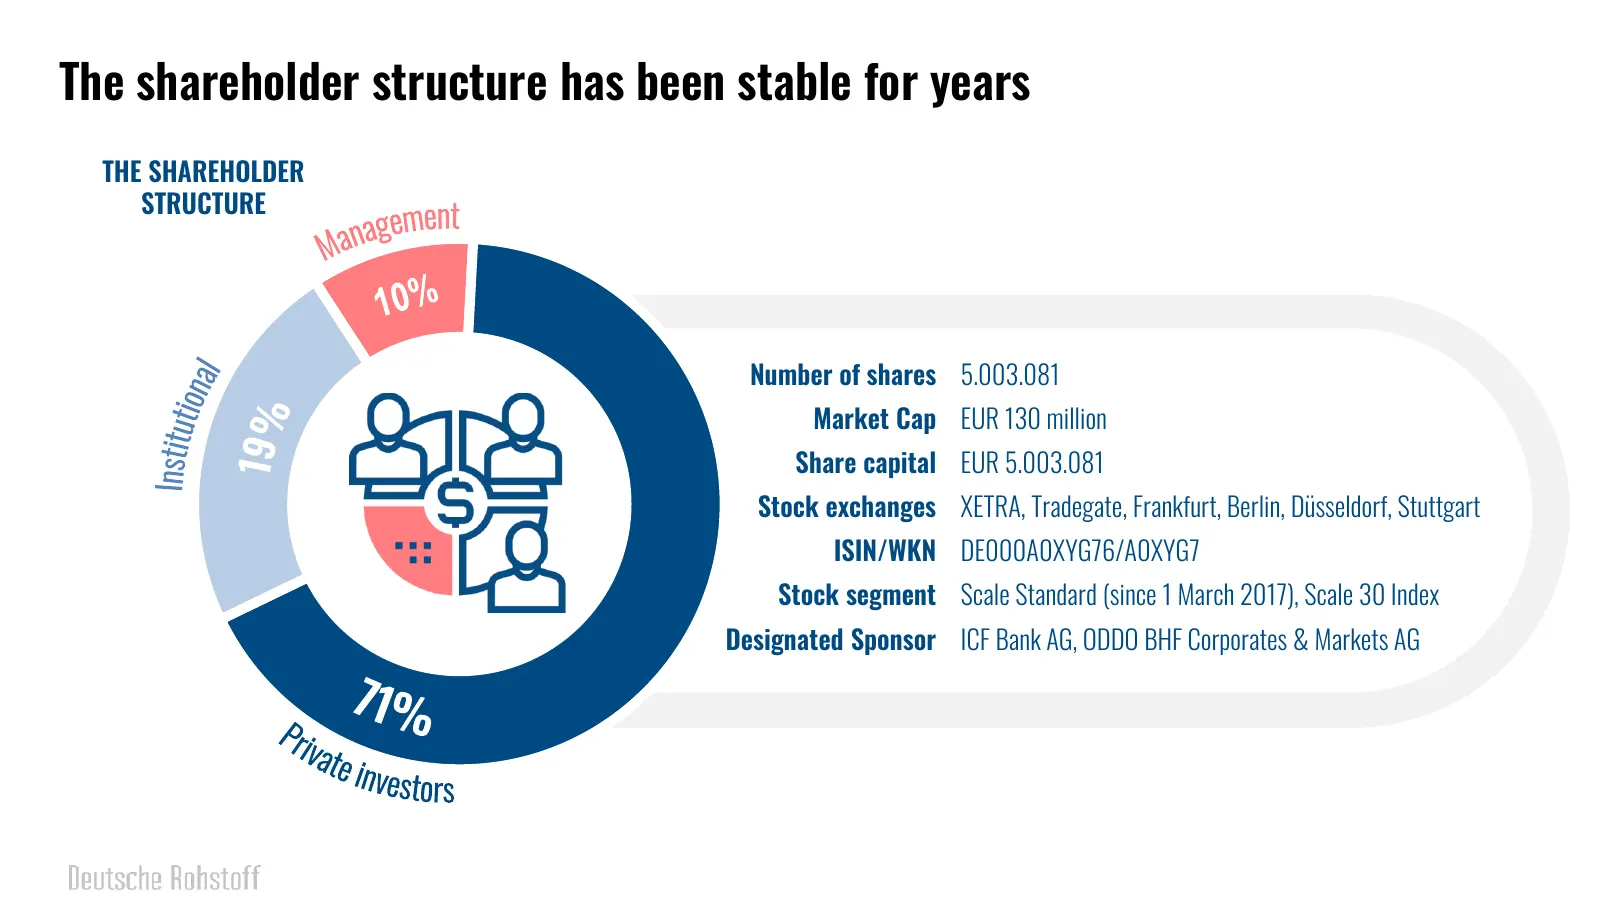
Slide 21: The shareholder structure has been stable for years
21 The shareholder structure has been stable for years THE SHAREHOLDER STRUCTURE Number of shares 5.003.081 Market Cap EUR 130 million Share capital EUR 5.003.081 Stock exchanges XETRA, Tradegate, Frankfurt, Berlin, Düsseldorf, Stuttgart ISIN/WKN DE000A0XYG76/A0XYG7 Stock segment Scale Standard (sin
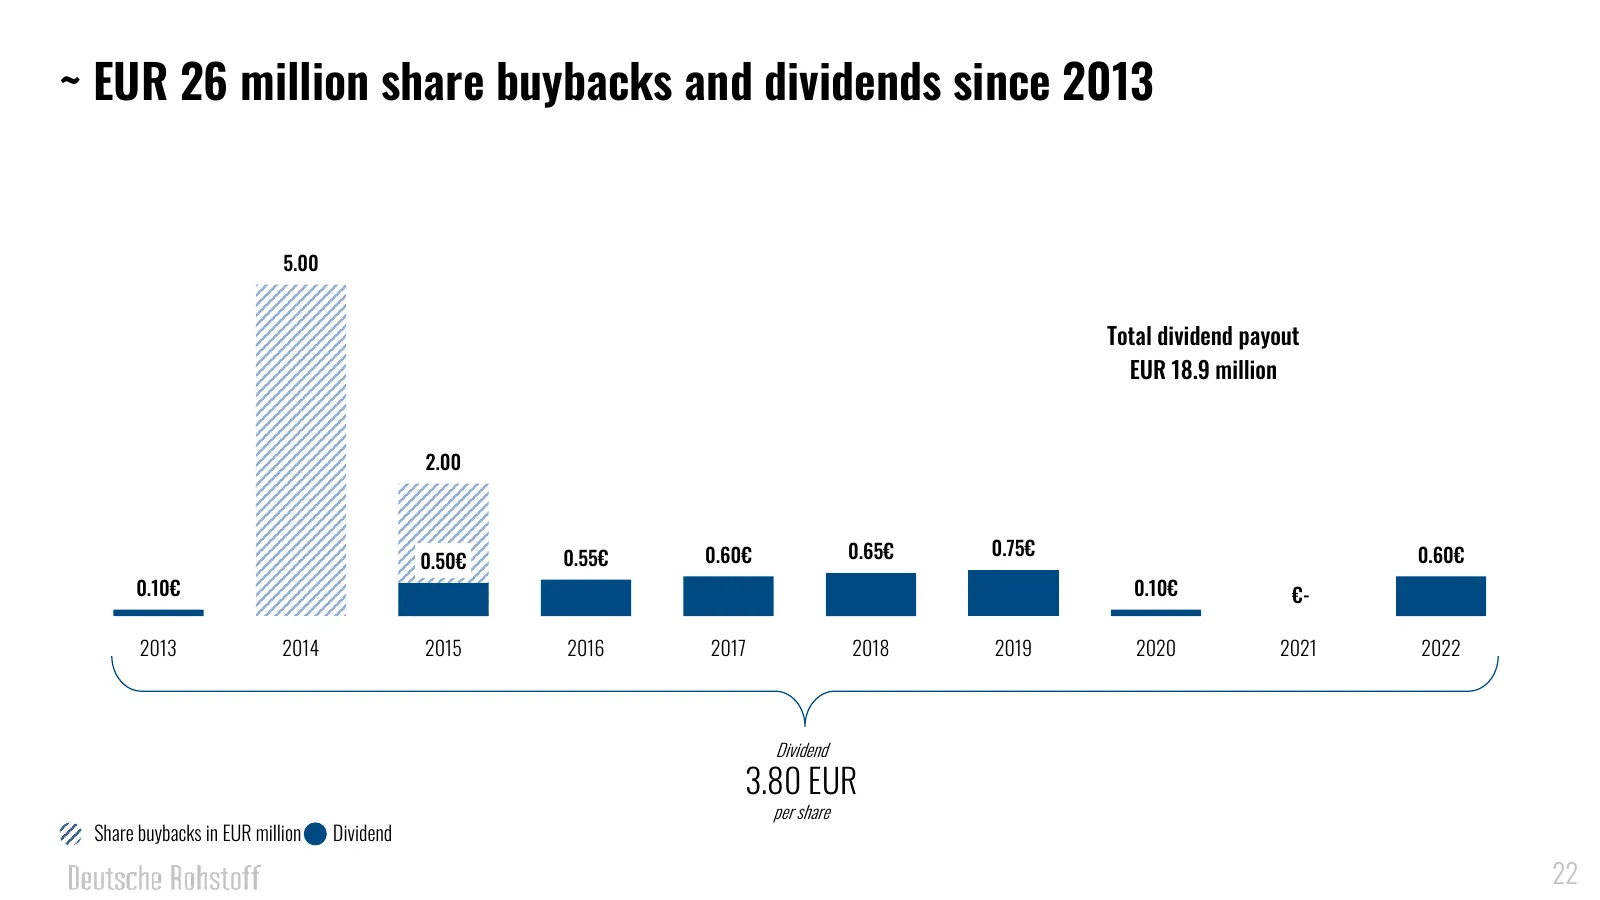
Slide 22: ~EUR 26 million share buybacks and dividends since 2013
22 ~ EUR 26 million share buybacks and dividends since 2013 5.00 Total dividend payout EUR 18.9 million 2.00 0.55€ 0.60€ 0.65€ 0.75€ 0.60€ 0.50€ 0.10€ 0.10€ €- 2013 2014 2015 2016 2017 2018 2019 2020 2021 2022 Dividend 3.80 EUR per share Share buybacks in EUR million Dividend 22
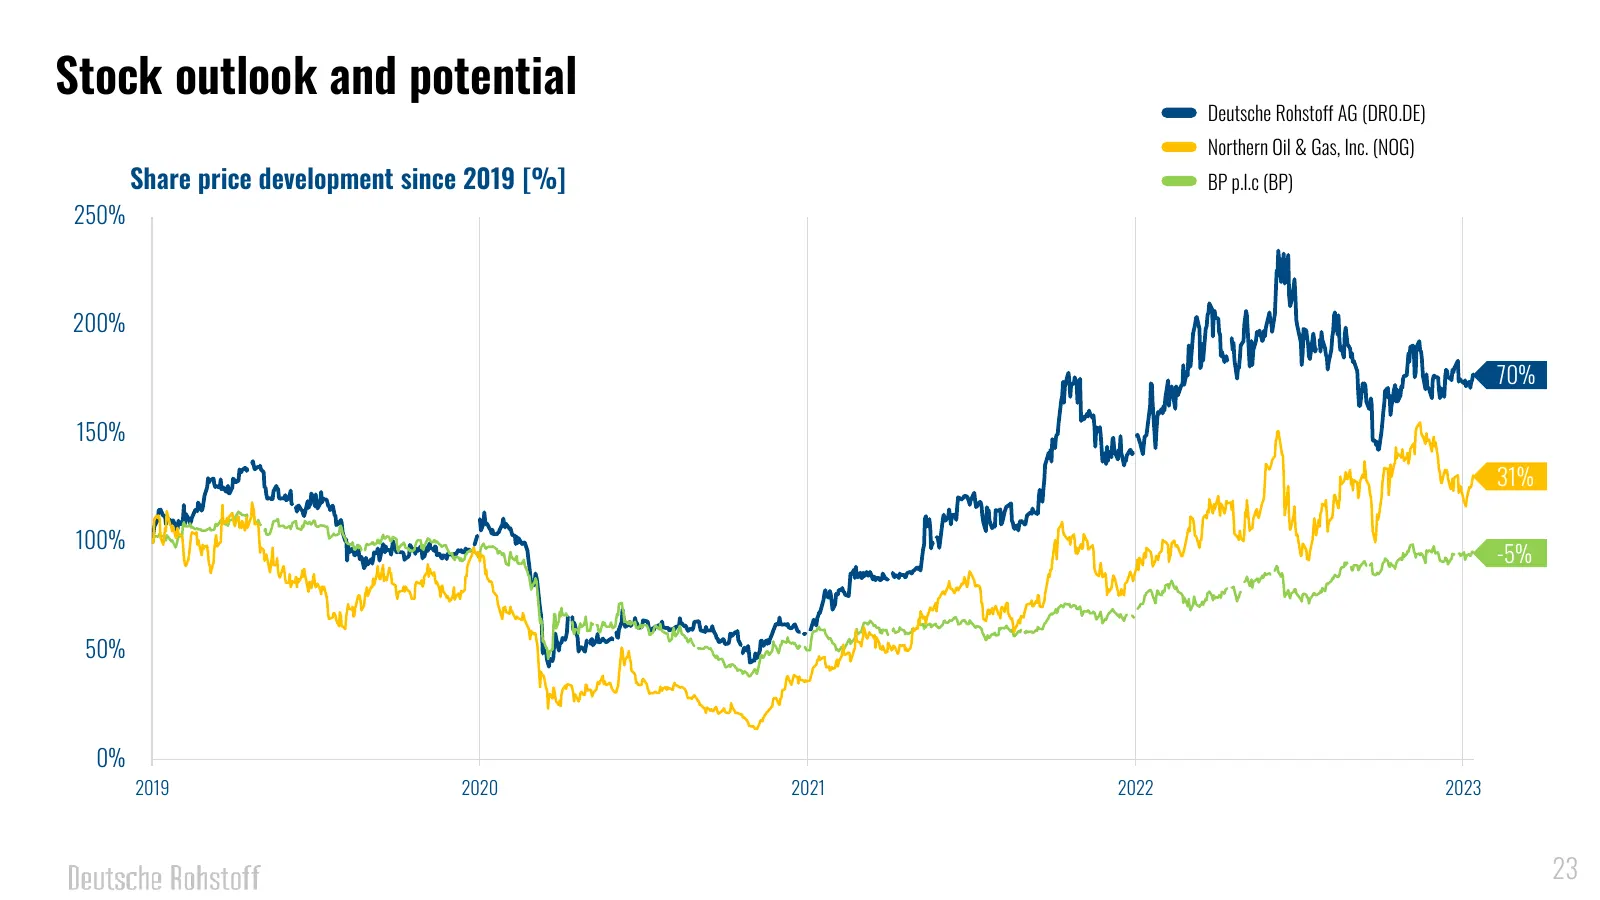
Slide 23: Stock outlook and potential
23 Stock outlook and potential Deutsche Rohstoff AG (DR0.DE) Northern Oil & Gas, Inc. (NOG) Share price development since 2019 [%] BP p.l.c (BP) 250% 200% 70% 150% 31% 100% -5% 50% 0% 2019 2020 2021 2022 2023 23
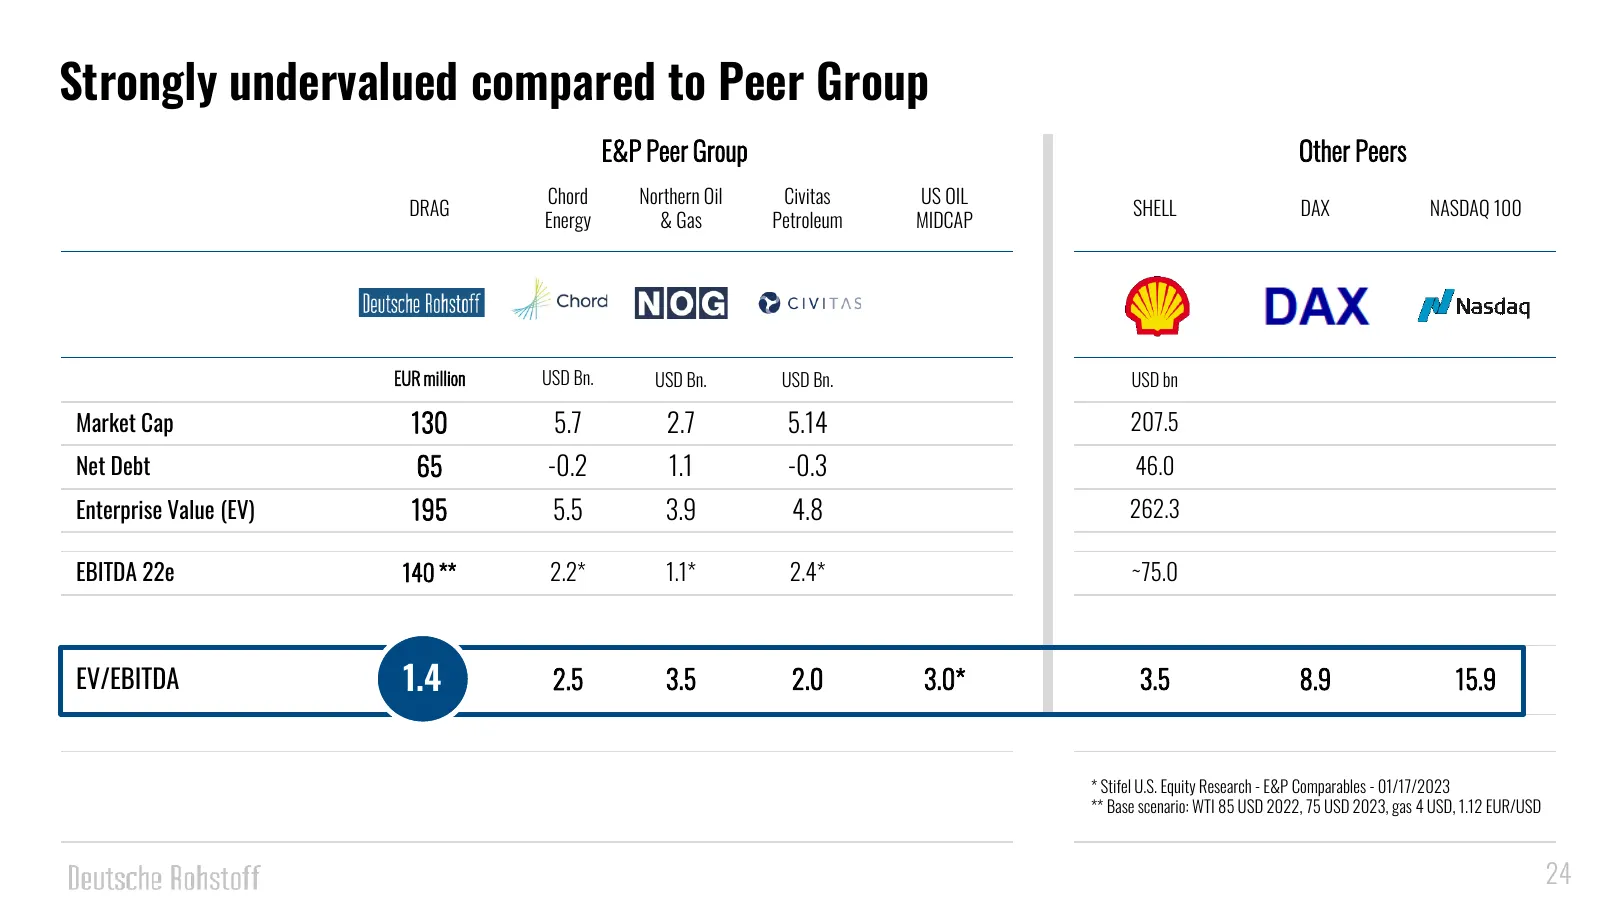
Slide 24: Strongly undervalued compared to Peer Group
24 Strongly undervalued compared to Peer Group E&P Peer Group Other Peers Chord Northern Oil Civitas US OIL DRAG SHELL DAX NASDAQ 100 Energy & Gas Petroleum MIDCAP EUR million USD Bn. USD Bn. USD Bn. USD bn Market Cap 130 5.7 2.7 5.14 207.5 Net Debt 65 -0.2 1.1 -0.3 46.0 Enterprise Value (EV) 195 5.
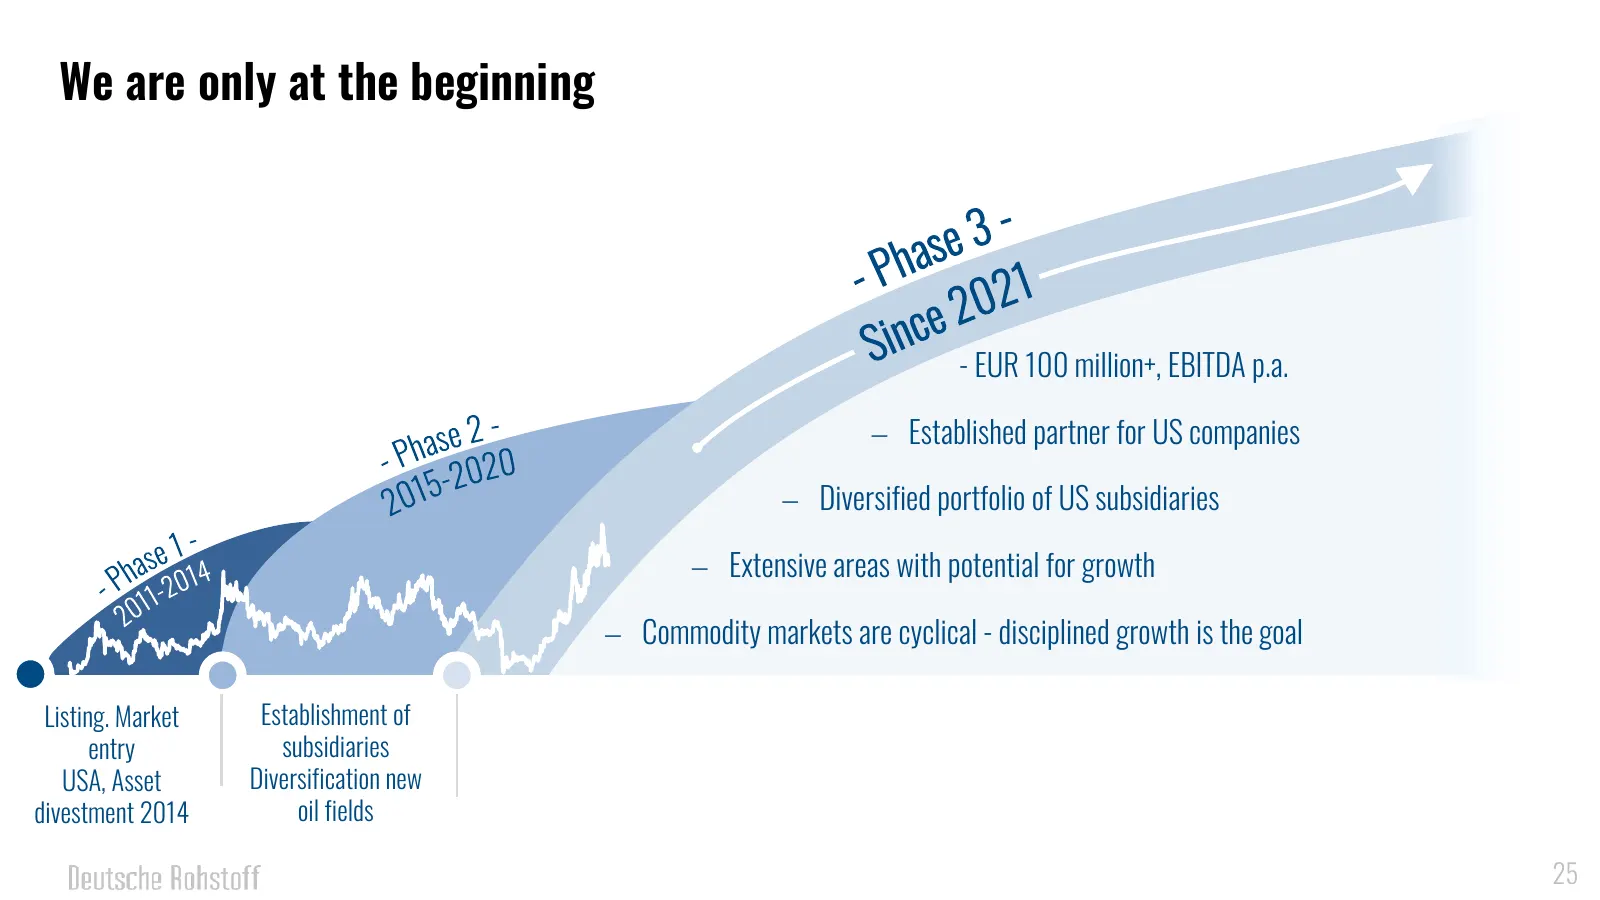
Slide 25: We are only at the beginning
25 We are only at the beginning - EUR 100 million+, EBITDA p.a. − Established partner for US companies − Diversified portfolio of US subsidiaries − Extensive areas with potential for growth − Commodity markets are cyclical - disciplined growth is the goal Listing. Market Establishment of entry subsi
Slide 26: Deutsche Rohstoff AG
26 Deutsche Rohstoff AG Q7, 24 68161 Mannheim, Germany +49 621 490 817 0 info@rohstoff.de
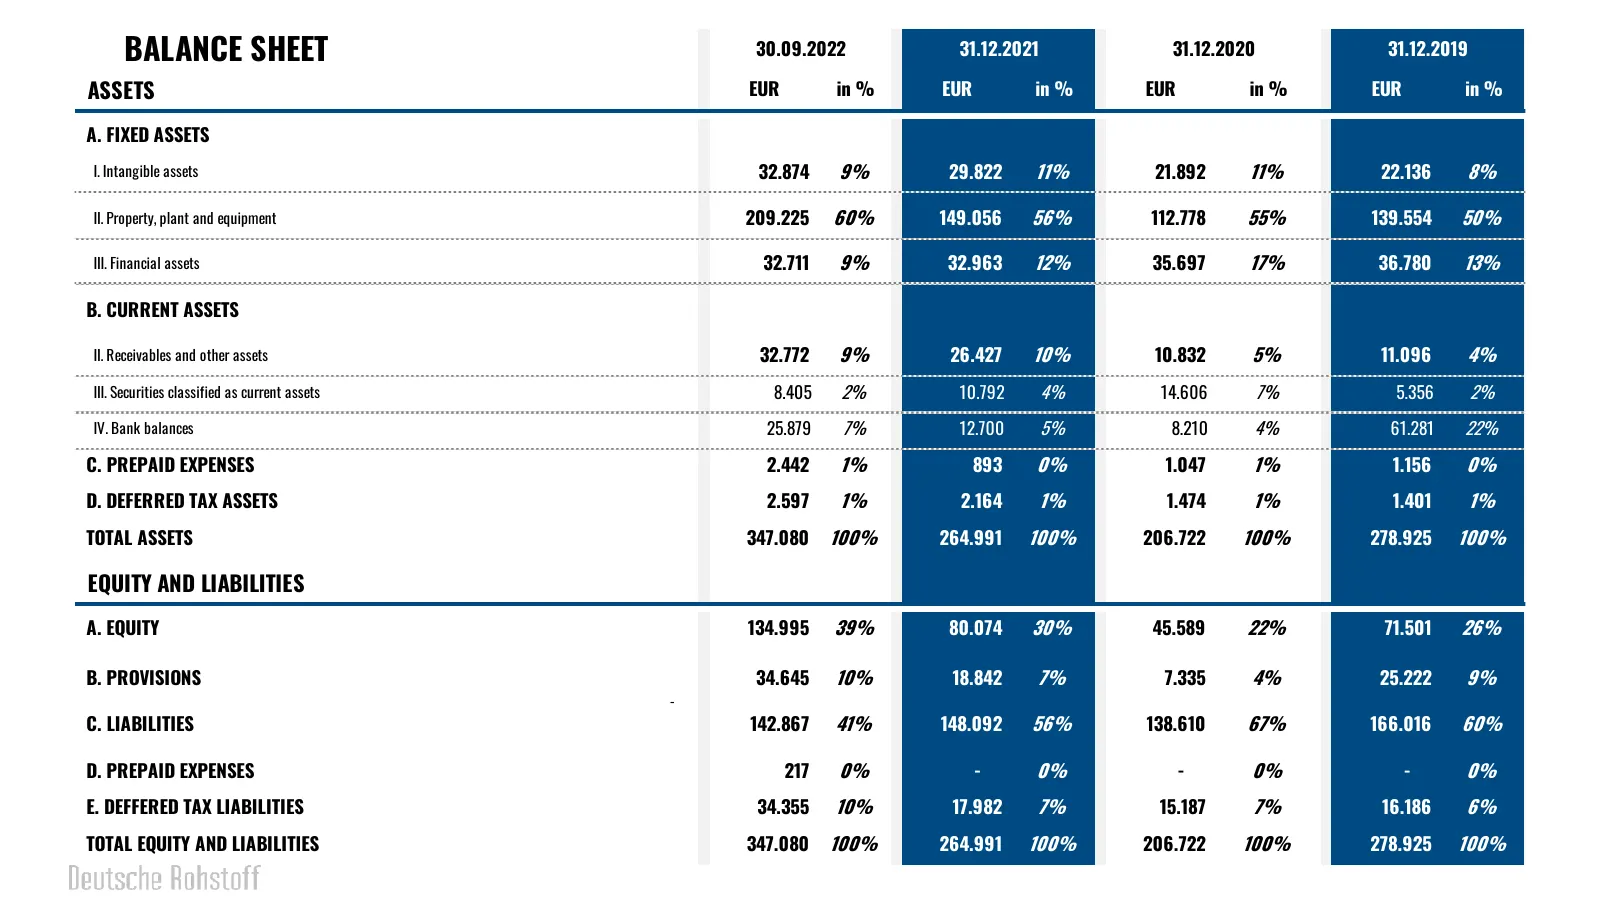
Slide 27: Balance Sheet
BALANCE SHEET 30.09.2022 31.12.2021 31.12.2020 31.12.2019 ASSETS - EUR in % EUR in % EUR in % EUR in % A. FIXED ASSETS I. Intangible assets 32.874 9% 29.822 11% 21.892 11% 22.136 8% II. Property, plant and equipment 209.225 60% 149.056 56% 112.778 55% 139.554 50% III. Financial assets 32.711 9% 32.9
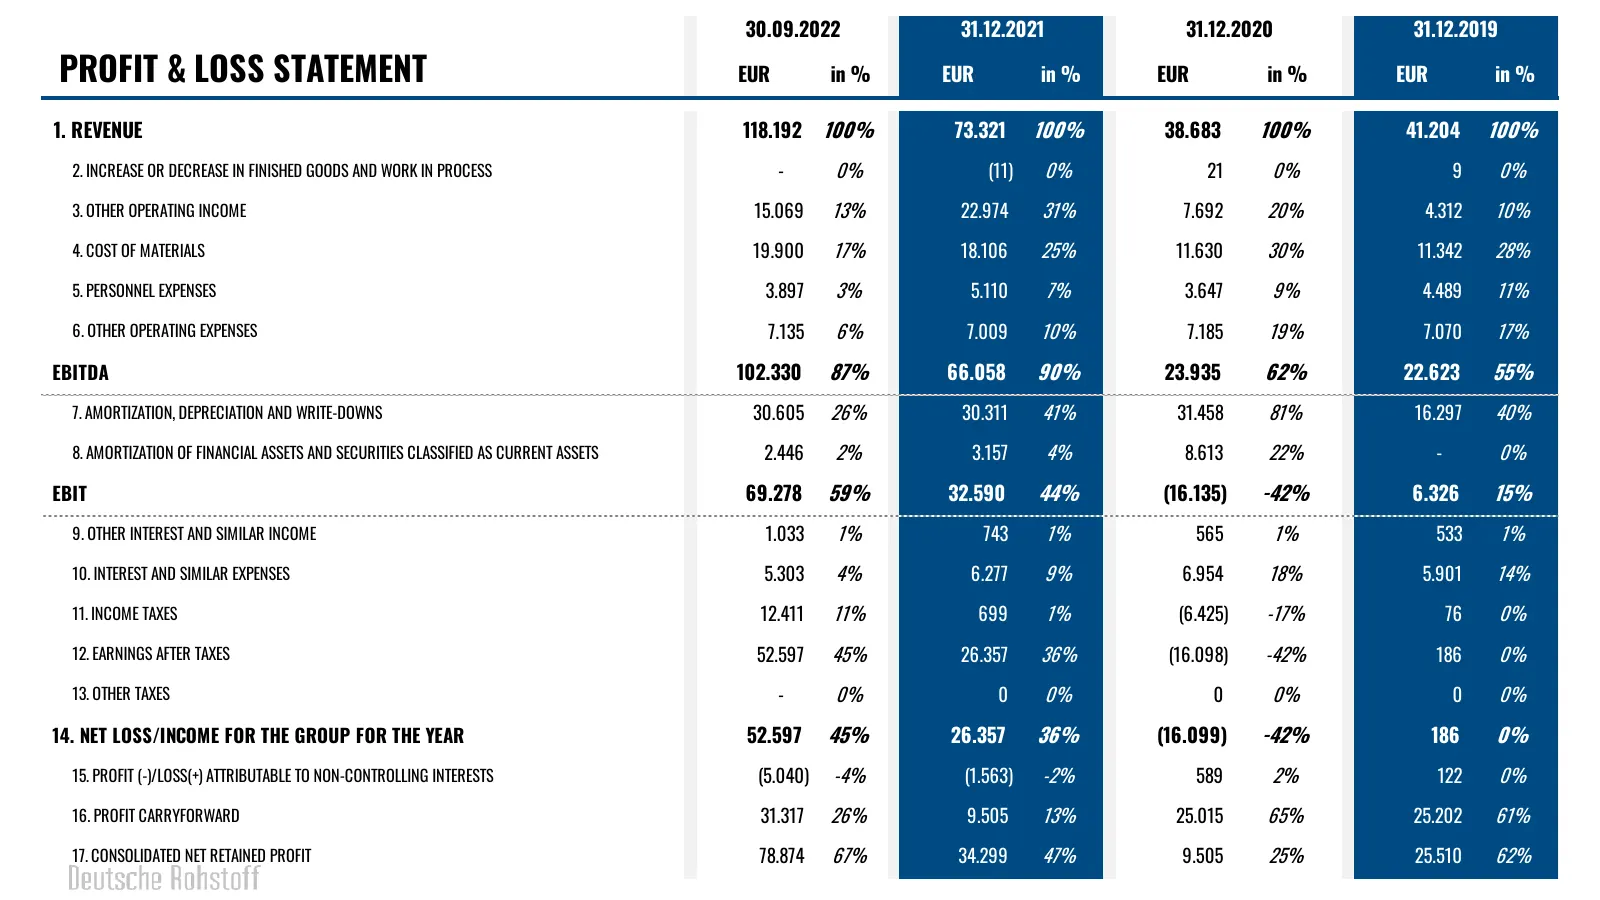
Slide 28: Profit & Loss Statement
30.09.2022 31.12.2021 31.12.2020 31.12.2019 PROFIT & LOSS STATEMENT EUR in % EUR in % EUR in % EUR in % 1. REVENUE 118.192 100% 73.321 100% 38.683 100% 41.204 100% 2. INCREASE OR DECREASE IN FINISHED GOODS AND WORK IN PROCESS - 0% (11) 0% 21 0% 9 0% 3. OTHER OPERATING INCOME 15.069 13% 22.974 31% 7.
Source: Internet Archive copy of rohstoff.de
More decks from Deutsche Rohstoff AG
 Shareholder Meeting (June 2026)49 slides · Jun 23, 2026
 Shareholder Meeting (June 2026)49 slides · Jun 23, 2026
 Investor Day (November 2025)39 slides · Nov 19, 2025
 Investor Day (November 2025)43 slides · Nov 19, 2025
 Shareholder Meeting (June 2025)57 slides · Jun 17, 2025
 Investor Day (November 2024)49 slides · Nov 20, 2024