Sysmex Corporation · TSE:6869
Sysmex — Q3 FY2010 Earnings Presentation
12 slides from Sysmex's earnings presentation, Feb 2, 2010
Slide 1: FY2010 3rd Quarter Business Results
FY2010 3rd Quarter Business Results (FY2010, ending March 31, 2010) February 2, 2010 IR & Corporate Communication Div.
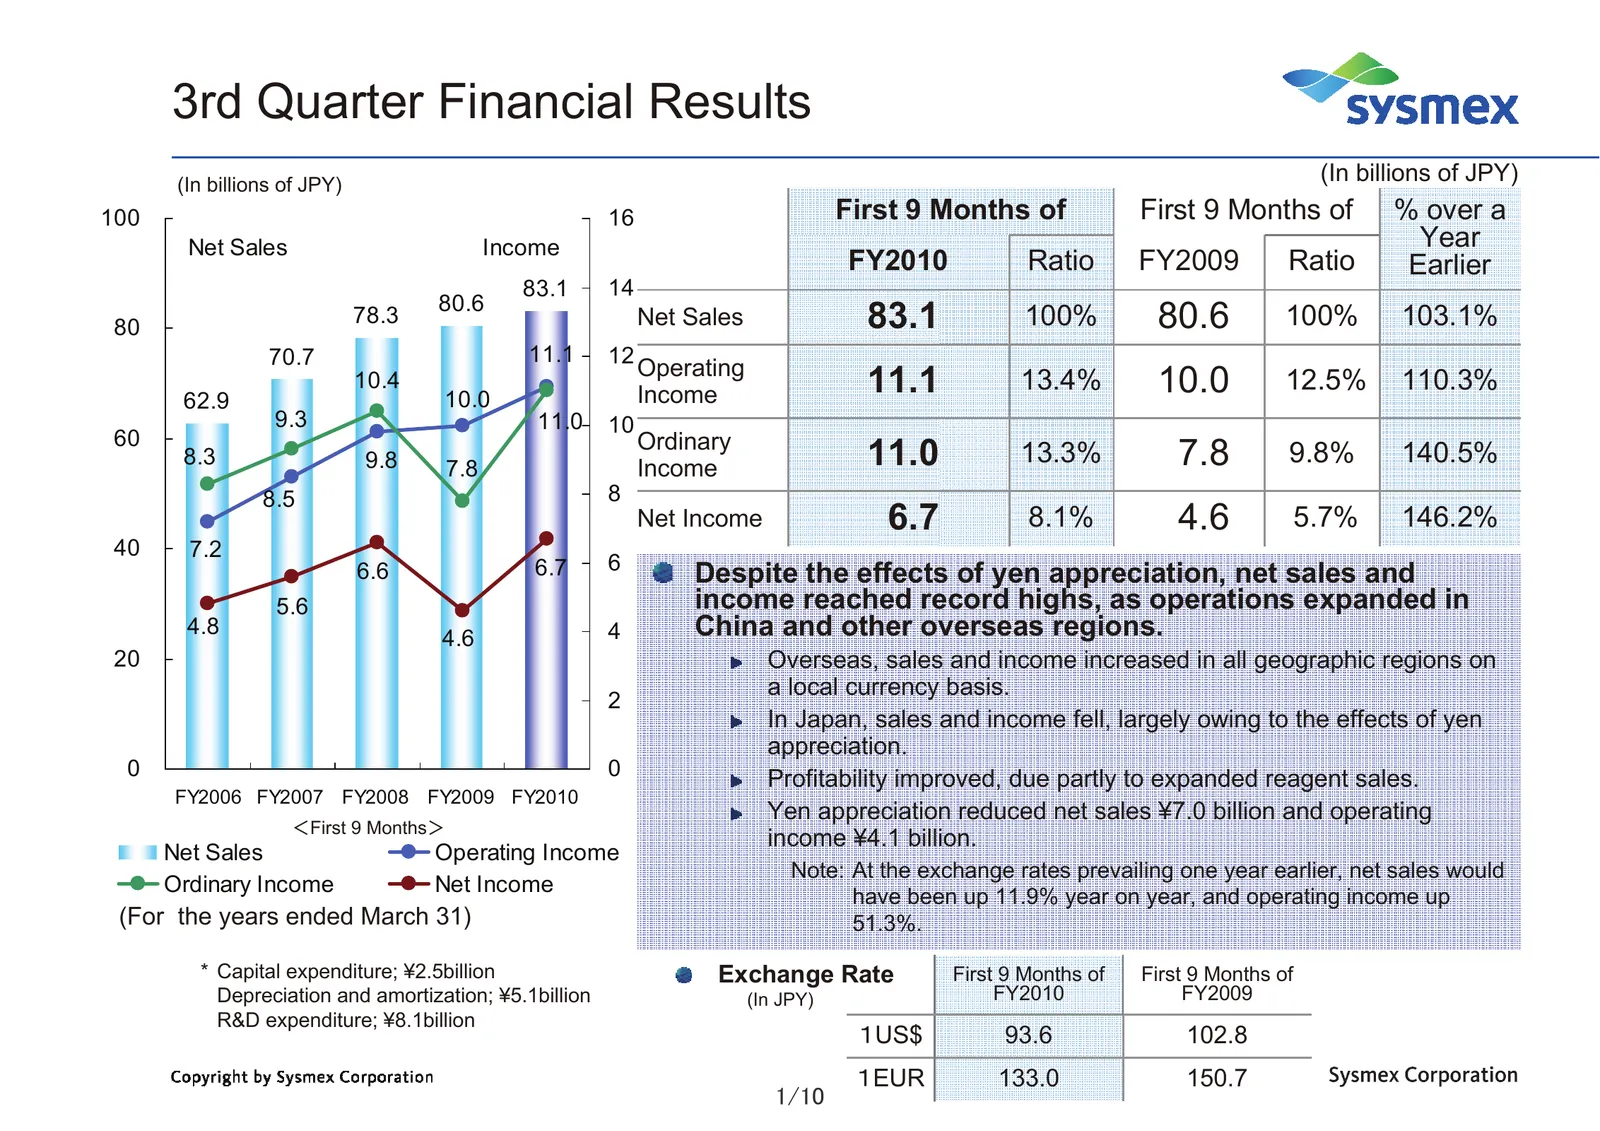
Slide 2: 3rd Quarter Financial Results
3rd Quarter Financial Results (In billions of JPY) (In billions of JPY) 100 16 First 9 Months of First 9 Months of % over a Net Sales Income Year FY2010 Ratio FY2009 Ratio Earlier 83.1 14 80.6 80 78.3 Net Sales 83.1 100% 80.6 100% 103.1% 70.7 11.1 12 Operating 62.9 10.4 10.0 Income 11.1 13.4% 10.0 1
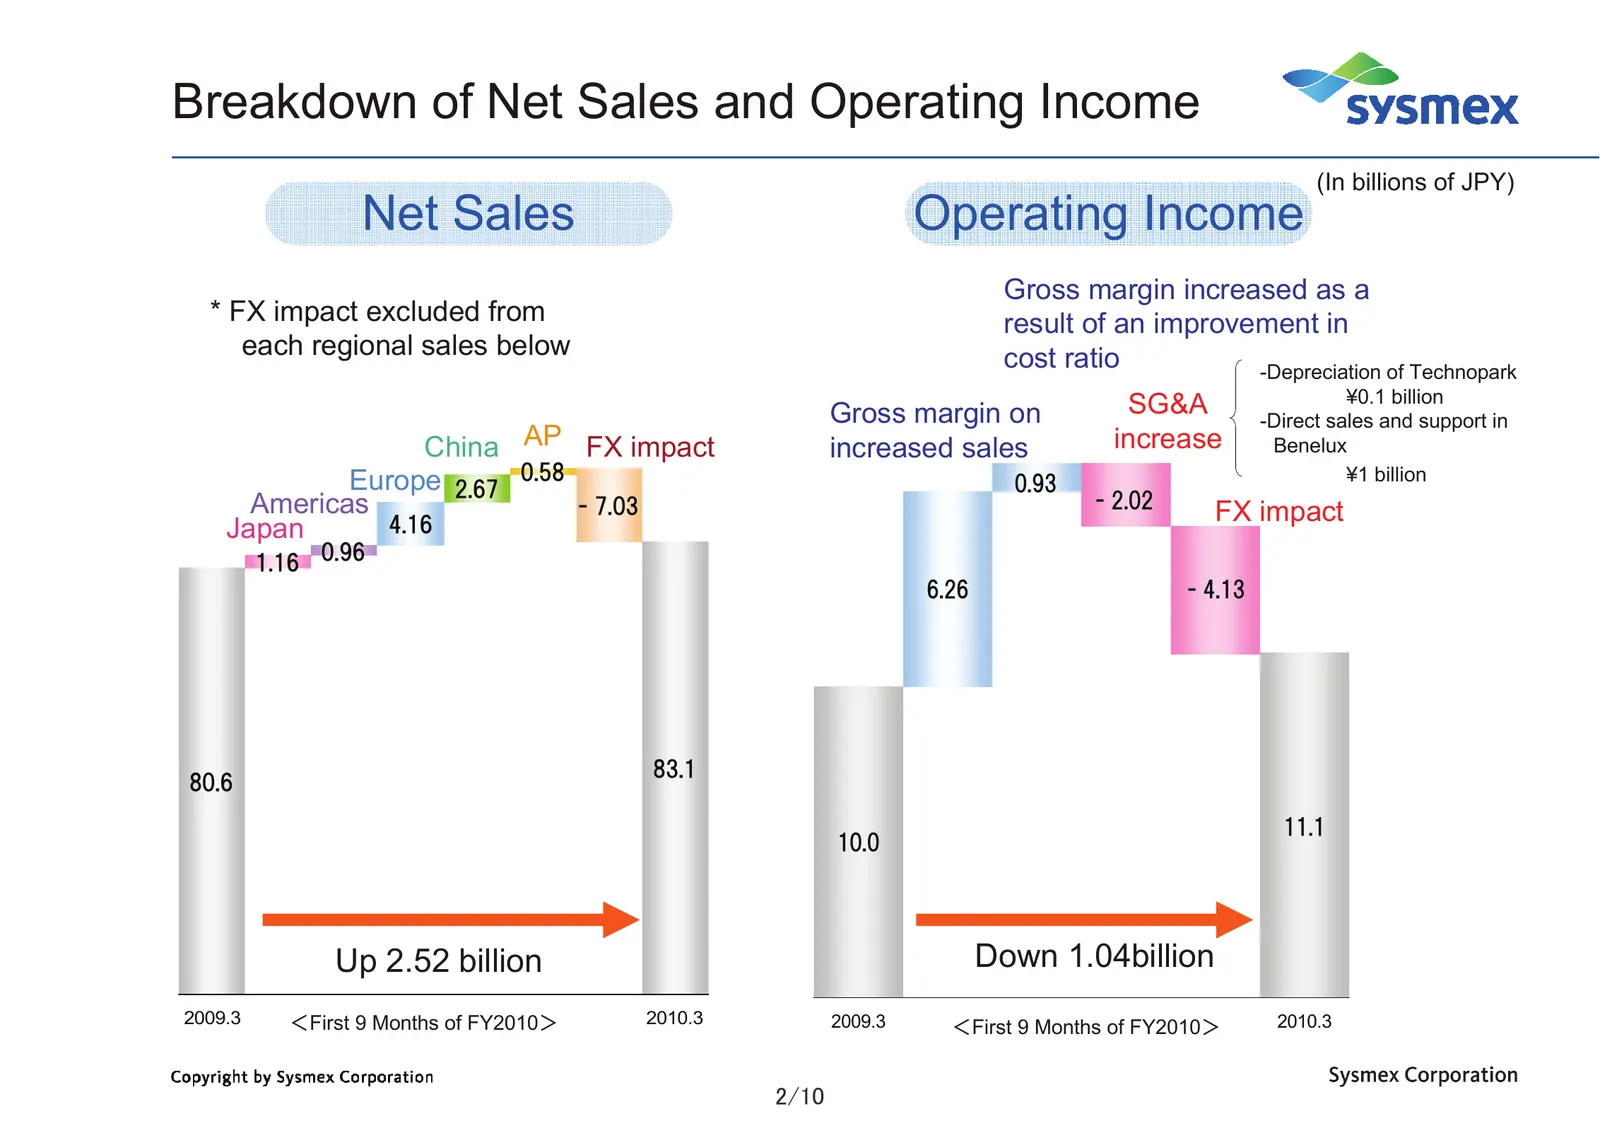
Slide 3: Breakdown of Net Sales and Operating Income
Breakdown of Net Sales and Operating Income (In billions of JPY) Net Sales Operating Income Gross margin increased as a * FX impact excluded from result of an improvement in each regional sales below cost ratio -Depreciation of Technopark ¥0.1 billion Gross margin on SG&A -Direct sales and support i
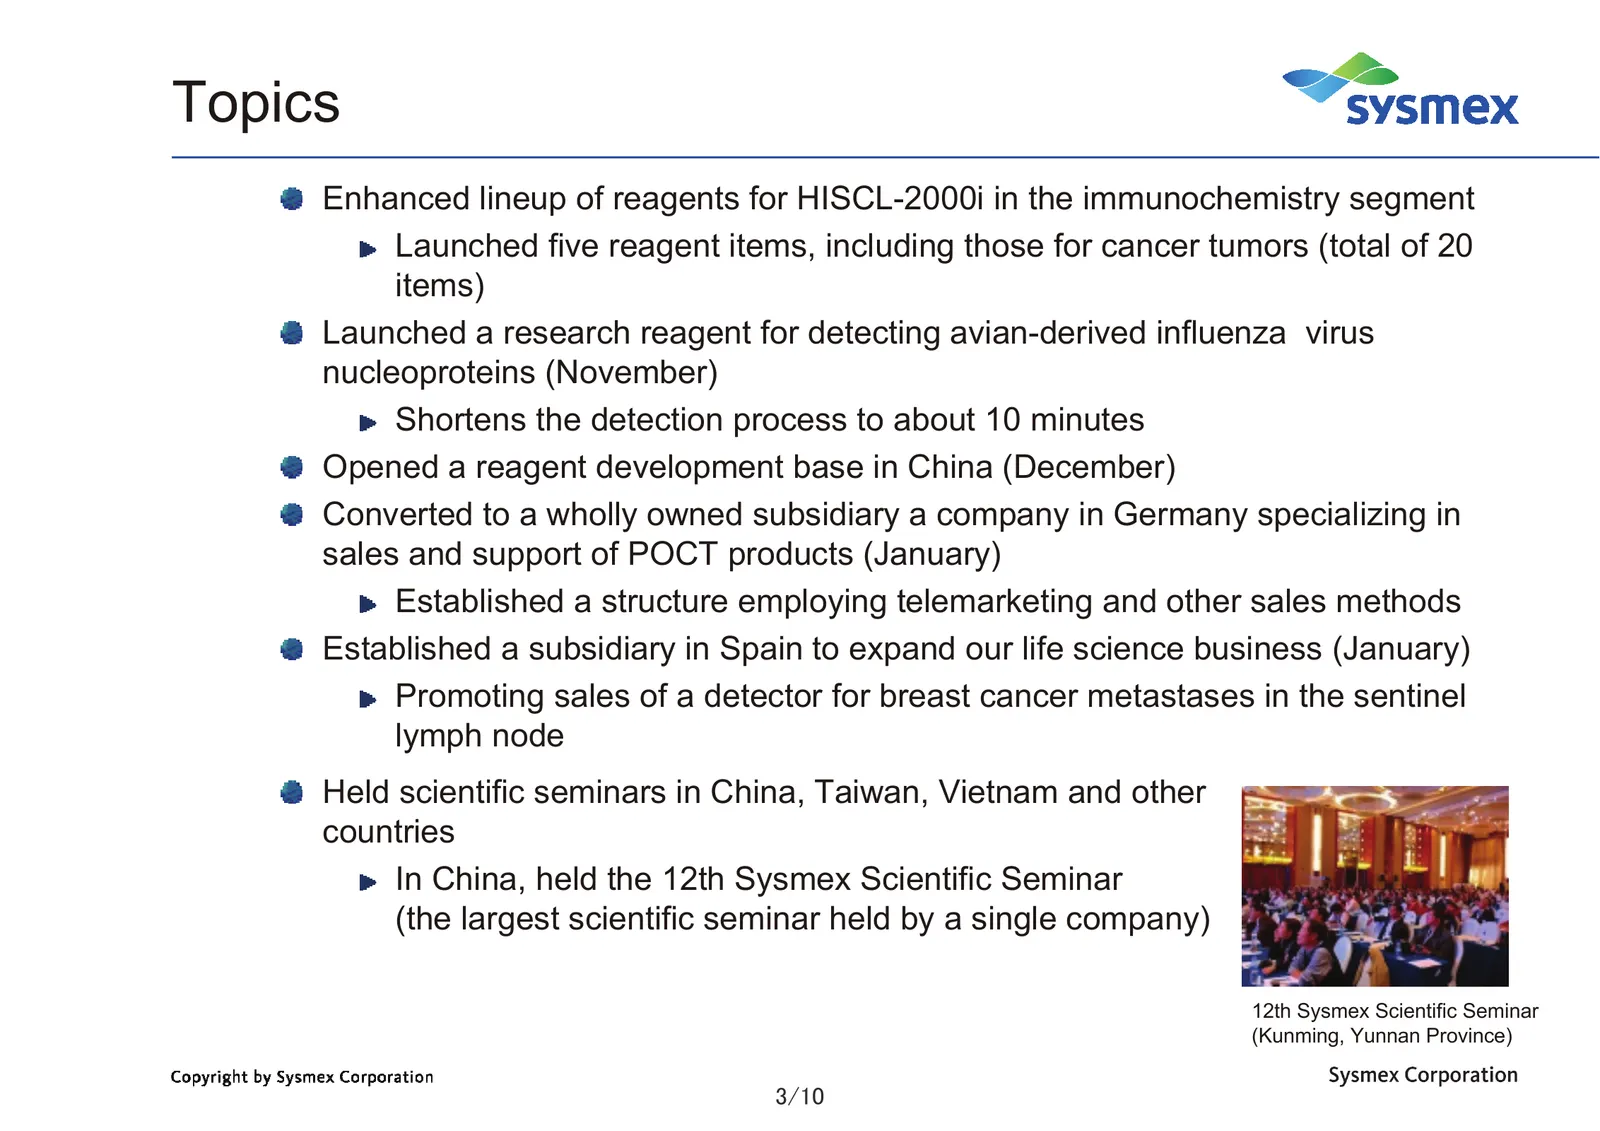
Slide 4: Topics
Topics Enhanced lineup of reagents for HISCL-2000i in the immunochemistry segment Launched five reagent items, including those for cancer tumors (total of 20 items) Launched a research reagent for detecting avian-derived influenza virus nucleoproteins (November) Shortens the detection process to abo
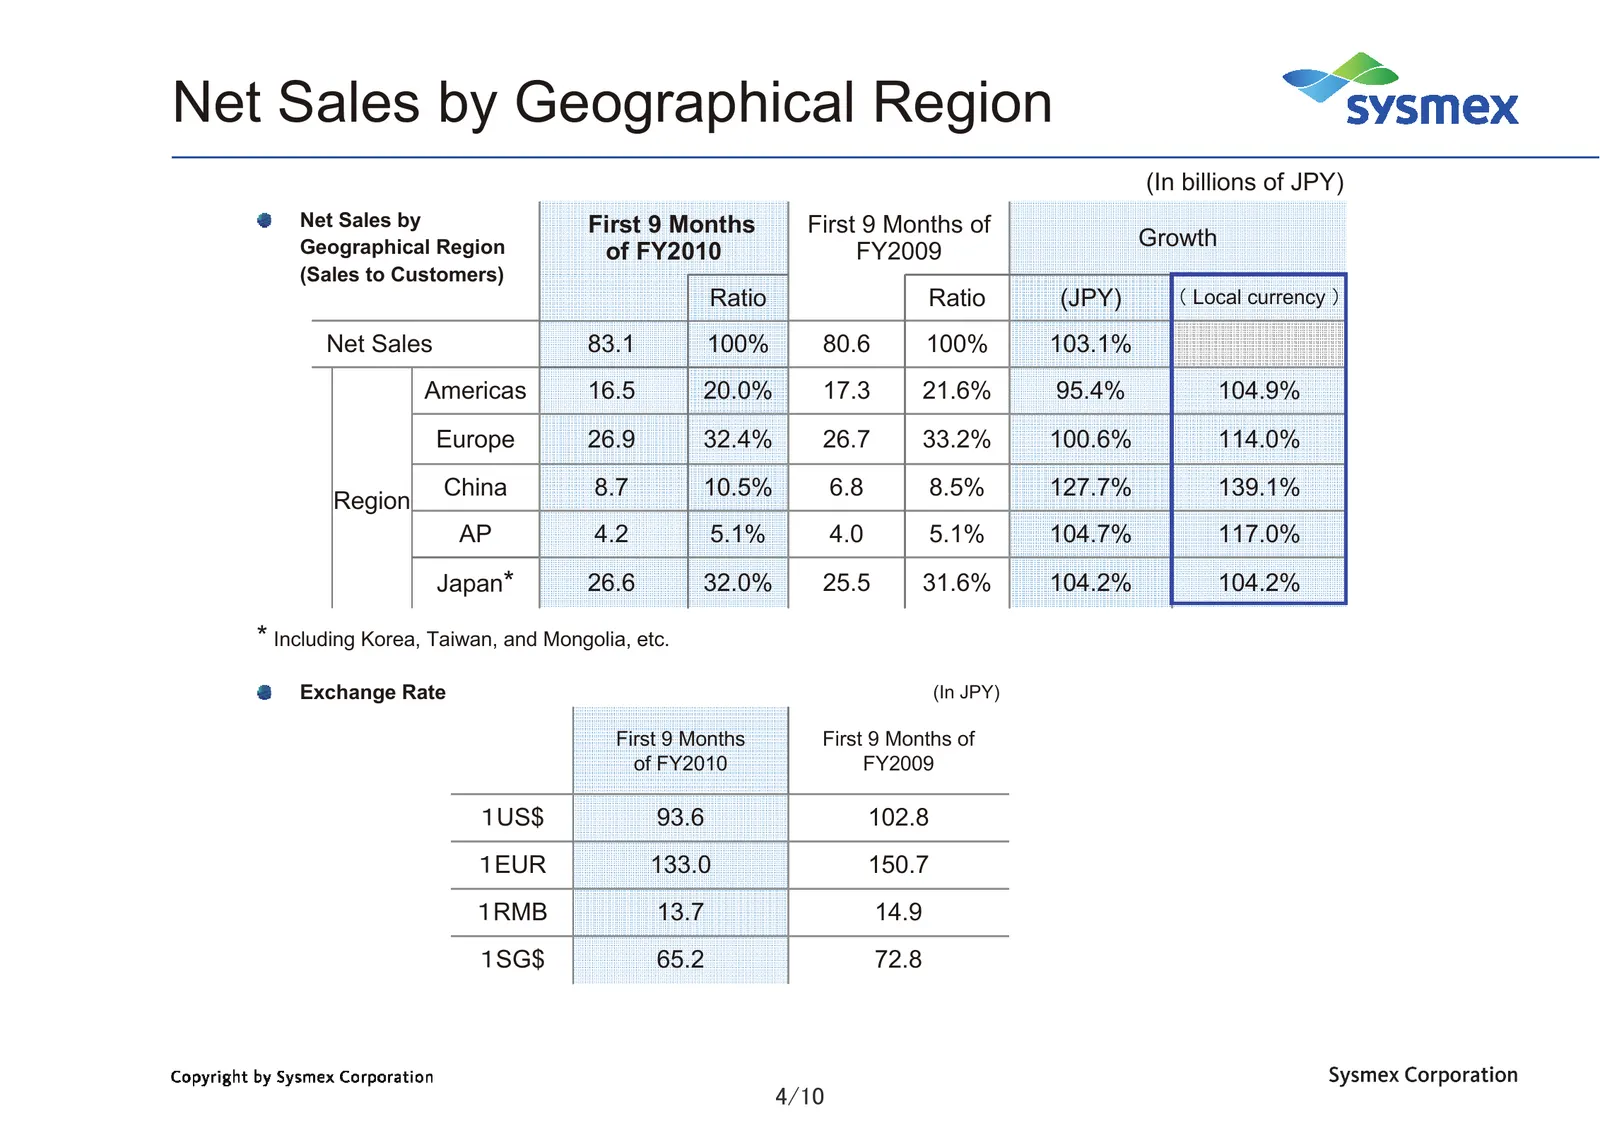
Slide 5: Net Sales by Geographical Region
Net Sales by Geographical Region (In billions of JPY) Net Sales by First 9 Months First 9 Months of Geographical Region Growth of FY2010 FY2009 (Sales to Customers) Ratio Ratio (JPY) ( Local currency ) Net Sales 83.1 100% 80.6 100% 103.1% Americas 16.5 20.0% 17.3 21.6% 95.4% 104.9% Europe 26.9 32.4%
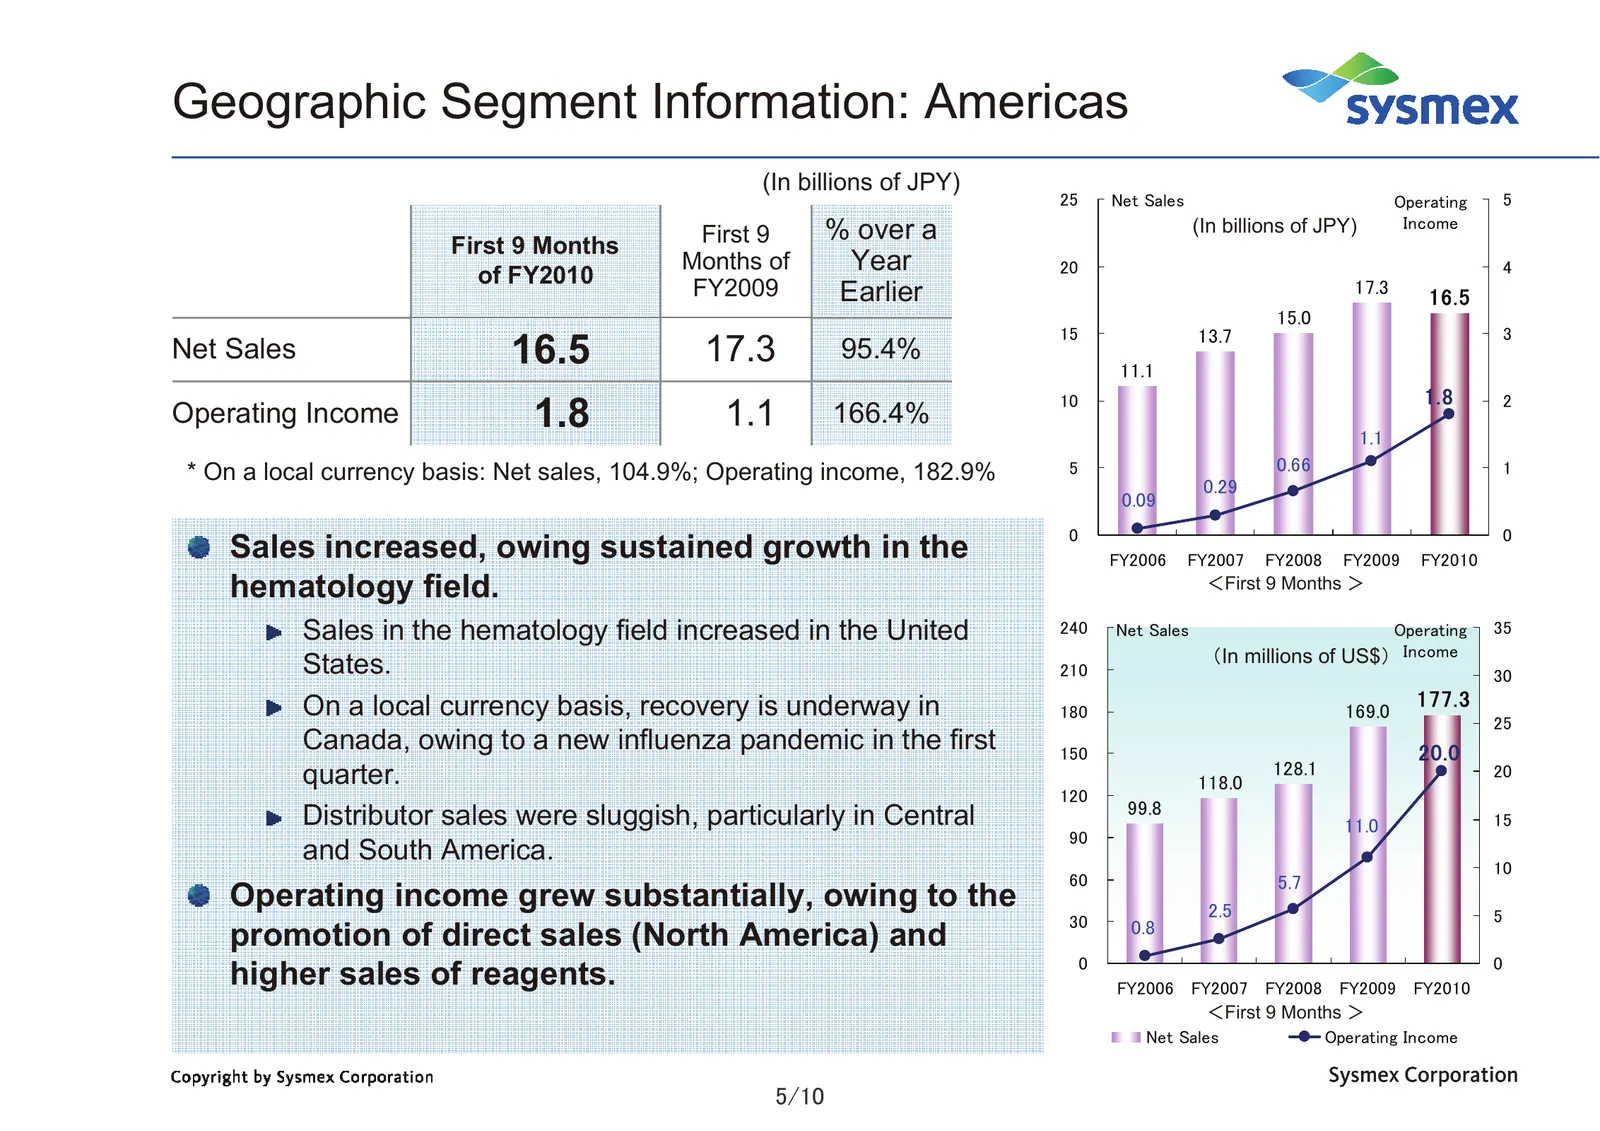
Slide 6: Geographic Segment Information: Americas
Geographic Segment Information: Americas (In billions of JPY) 25 Net Sales Operating 5 First 9 % over a (In billions of JPY) Income First 9 Months of FY2010 Months of Year 20 4 FY2009 Earlier 17.3 16.5 15.0 15 13.7 3 Net Sales 16.5 17.3 95.4% 11.1 1.8 Operating Income 1.8 1.1 166.4% 10 1.1 2 * On a
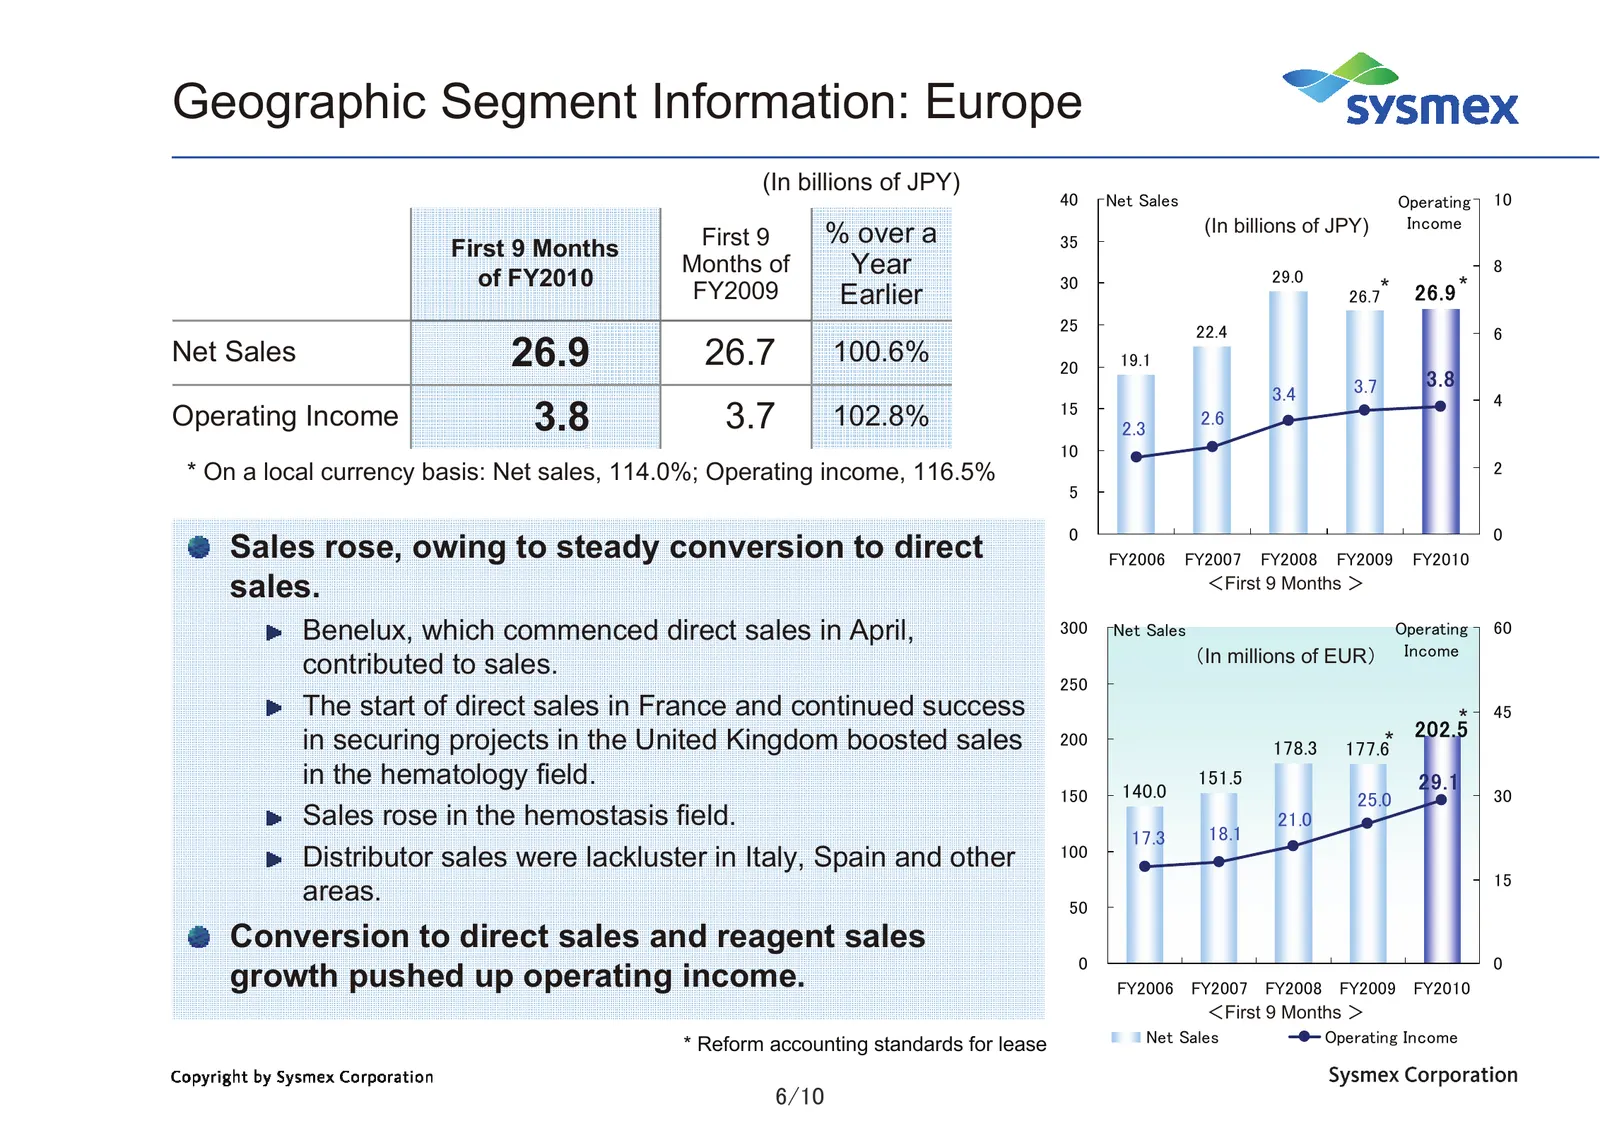
Slide 7: Geographic Segment Information: Europe
Geographic Segment Information: Europe (In billions of JPY) 40 Net Sales Operating 10 (In billions of JPY) Income First 9 Months First 9 % over a 35 of FY2010 Months of Year 29.0 8 FY2009 Earlier 30 26.7* 26.9 * 25 22.4 6 Net Sales 26.9 26.7 100.6% 20 19.1 3.8 3.4 3.7 4 Operating Income 3.8 3.7 102.
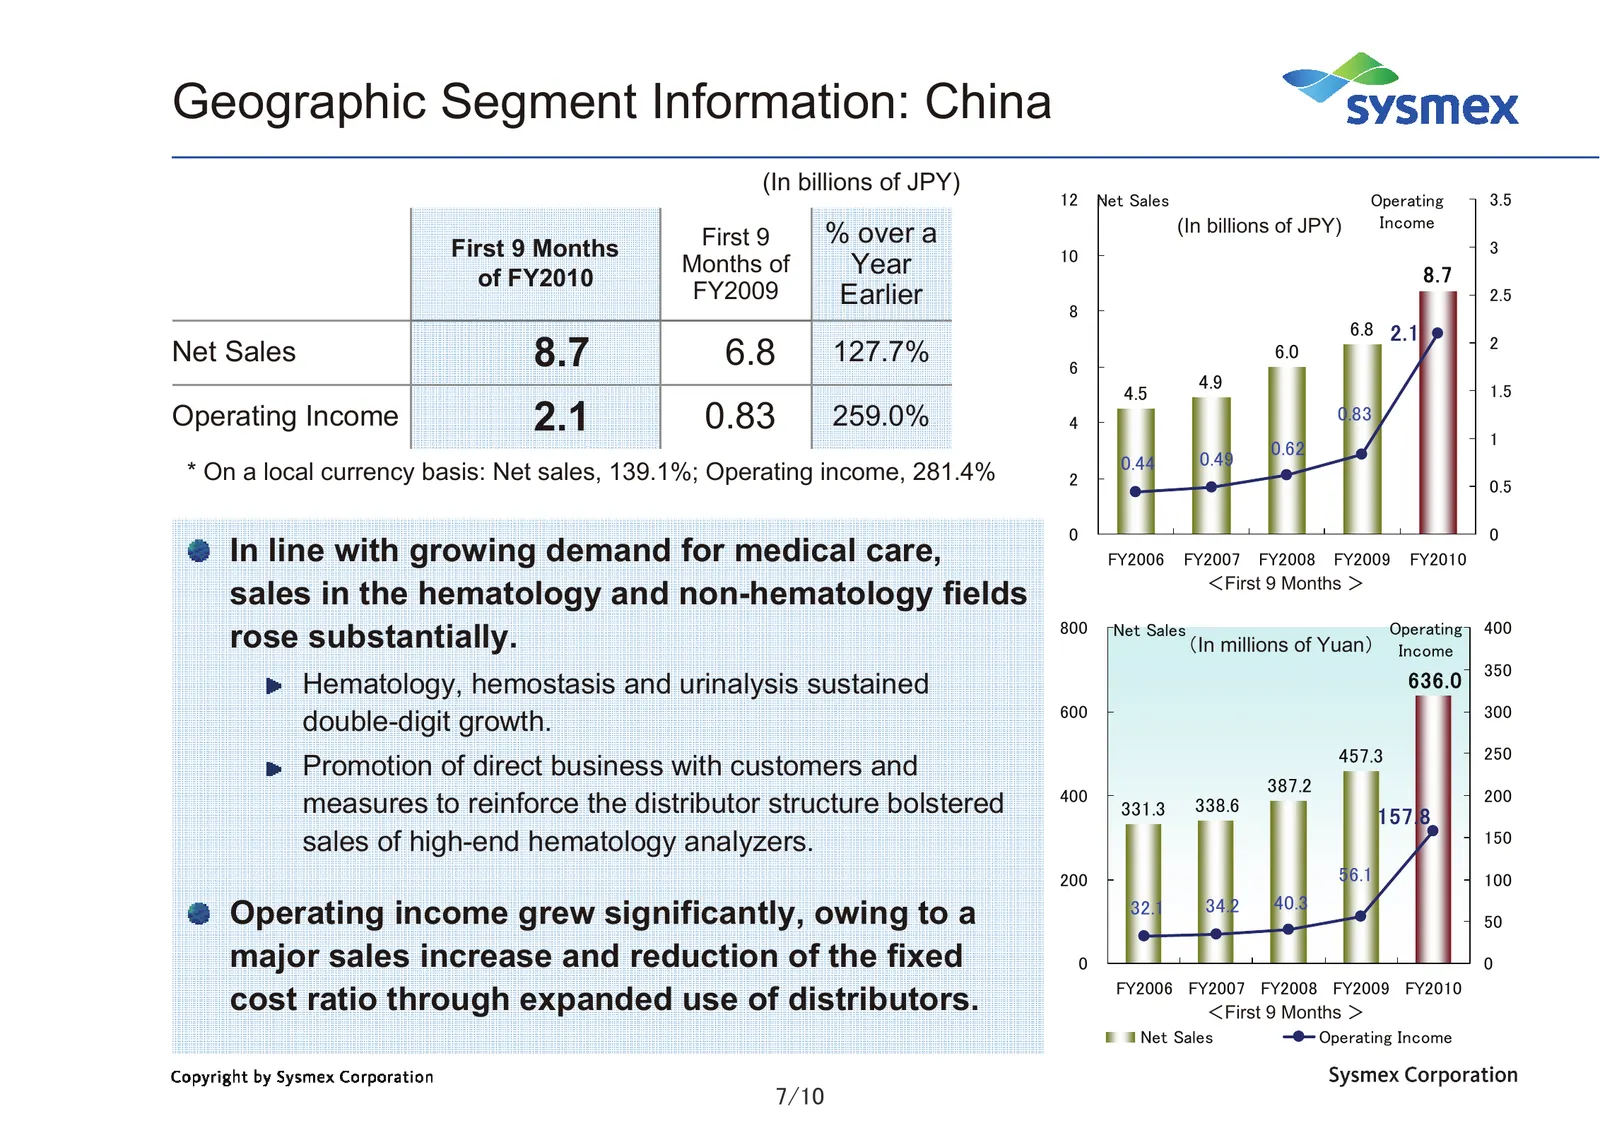
Slide 8: Geographic Segment Information: China
Geographic Segment Information: China (In billions of JPY) 12 Net Sales Operating 3.5 (In billions of JPY) Income First 9 Months First 9 % over a 3 10 of FY2010 Months of Year 8.7 FY2009 Earlier 2.5 8 6.8 2.1 Net Sales 8.7 6.8 127.7% 6 6.0 2 4.9 1.5 4.5 Operating Income 2.1 0.83 259.0% 4 0.83 1 0.62
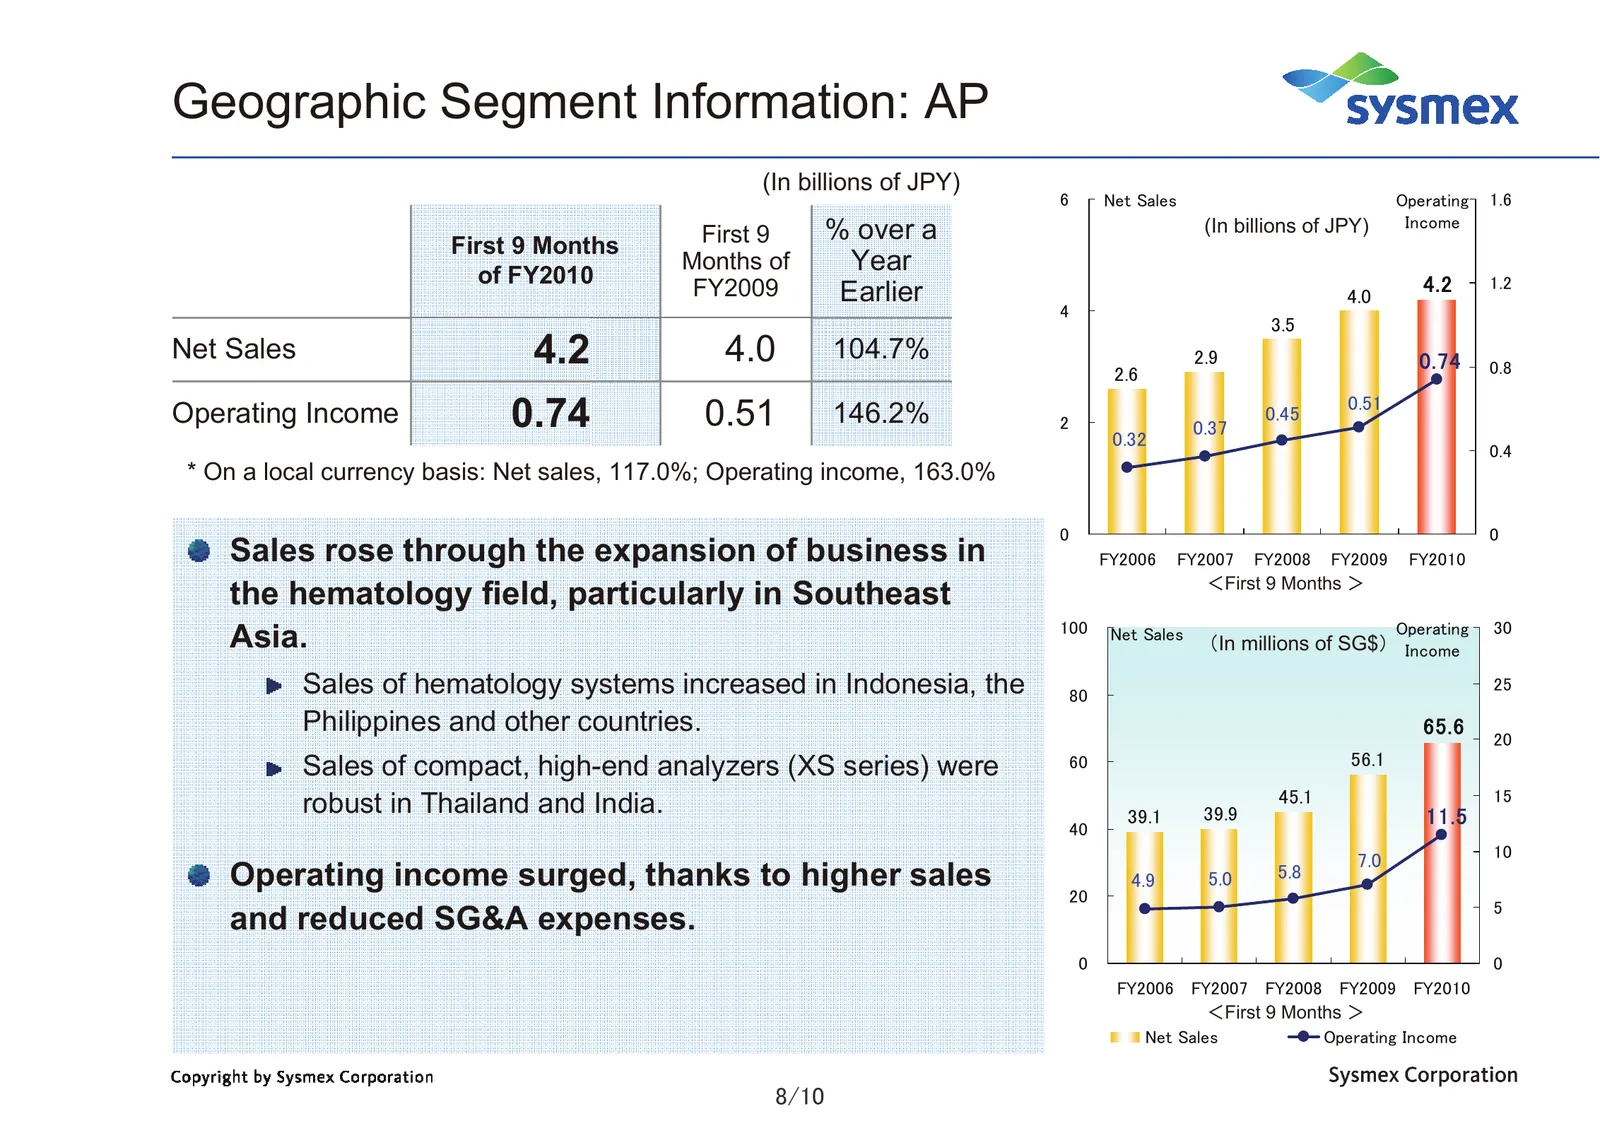
Slide 9: Geographic Segment Information: AP
Geographic Segment Information: AP (In billions of JPY) 6 Net Sales Operating 1.6 Income First 9 % over a (In billions of JPY) First 9 Months of FY2010 Months of Year FY2009 Earlier 4.2 1.2 4.0 4 3.5 Net Sales 4.2 4.0 104.7% 2.6 2.9 0.74 0.8 Operating Income 0.74 0.51 146.2% 2 0.32 0.37 0.45 0.51 0.
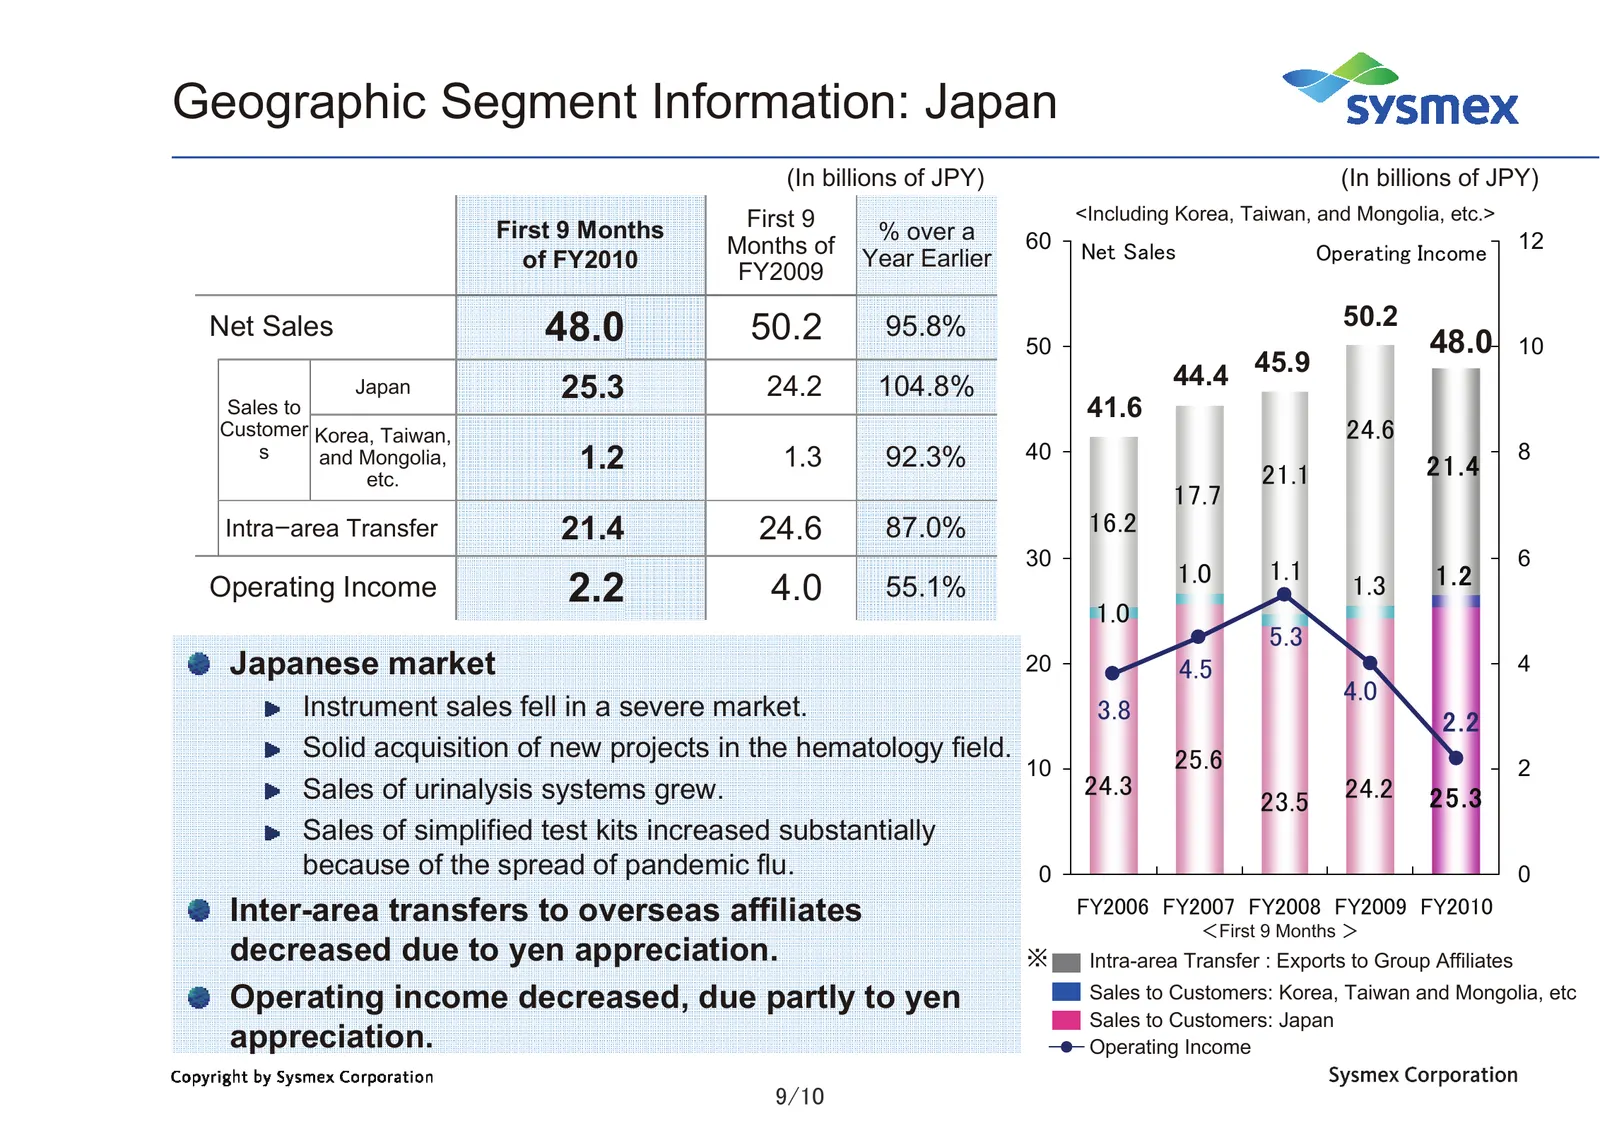
Slide 10: Geographic Segment Information: Japan
Geographic Segment Information: Japan (In billions of JPY) (In billions of JPY) First 9 <Including Korea, Taiwan, and Mongolia, etc.> First 9 Months % over a 60 12 Months of Net Sales Operating Income of FY2010 Year Earlier FY2009 50.2 Net Sales 48.0 50.2 95.8% 50 48.0 10 Japan 25.3 24.2 104.8% 44.4
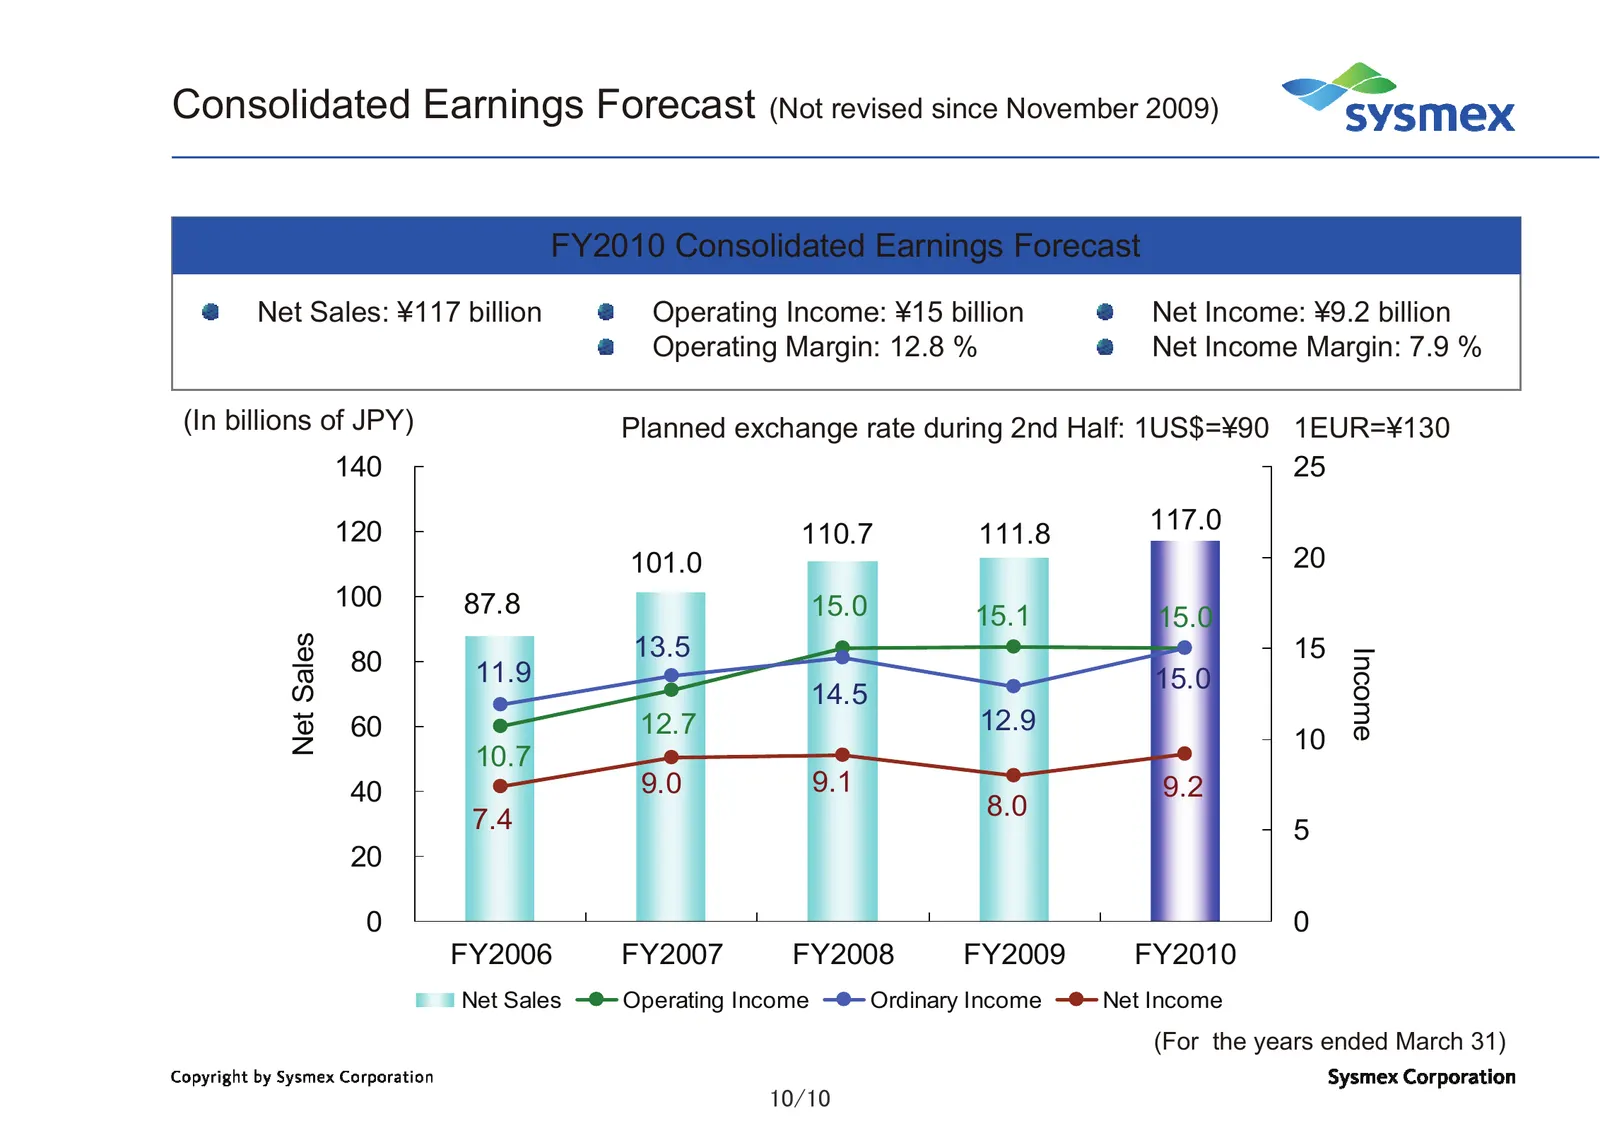
Slide 11: FY2010 Consolidated Earnings Forecast
Consolidated Earnings Forecast (Not revised since November 2009) FY2010 Consolidated Earnings Forecast Net Sales: ¥117 billion Operating Income: ¥15 billion Net Income: ¥9.2 billion Operating Margin: 12.8 % Net Income Margin: 7.9 % (In billions of JPY) Planned exchange rate during 2nd Half: 1US$=¥90
Slide 12: Contact
<Contact> IR & Corporate Communication Div. Phone: +81-78-265-0500 Email: info@sysmex.co.jp URL:
Source: Internet Archive copy of sysmex.co.jp
More decks from Sysmex Corporation
 Investor Presentation (November 2026)43 slides · Nov 10, 2026
 Q1 FY2027 Earnings Presentation33 slides · Aug 7, 2026
 Investor Presentation (2025)43 slides · 2025
 FY2011 Earnings Presentation23 slides · May 10, 2012
 FY2012 Earnings Presentation23 slides · May 10, 2012
 9M FY2012 Earnings Presentation12 slides · Feb 3, 2012