Inland Real Estate — 2008 NAREIT Annual Convention
23 slides from Inland Real Estate's conference presentation, Nov 19, 2008
Slide 1: 2008 NAREIT Annual Convention
2008 NAREIT Annual Convention November 19-21, 2008 www.inlandrealestate.com NYSE: IRC
Slide 2: Forward-Looking Statements
2 FORWARD-LOOKING STATEMENTS • These presentation materials contain forward-looking statements. Forward-looking statements are statements that are not historical, including statements regarding management's intentions, beliefs, expectations, representations, plans or predictions of the future, and a
Slide 3: IRC Snapshot Profile
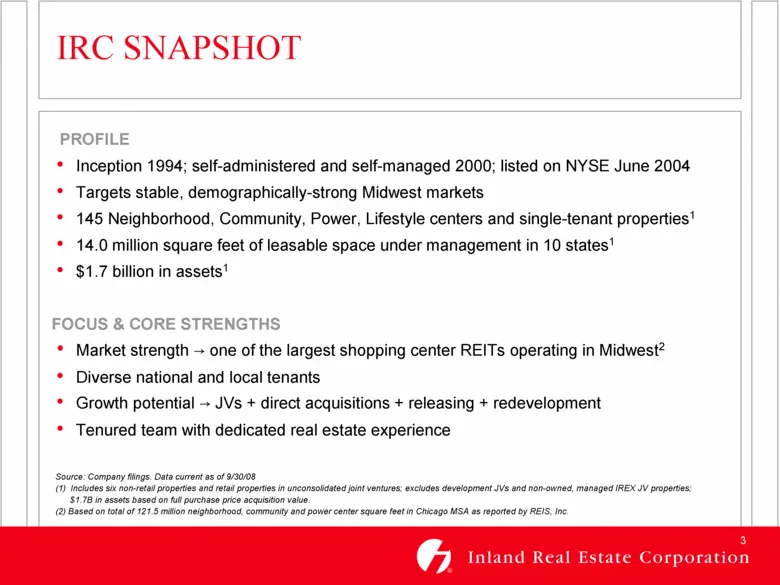
3 IRC SNAPSHOT PROFILE • Inception 1994; self-administered and self-managed 2000; listed on NYSE June 2004 • Targets stable, demographically-strong Midwest markets • 145 Neighborhood, Community, Power, Lifestyle centers and single-tenant properties1 • 14.0 million square feet of leasable space under
Slide 4: IRC Team
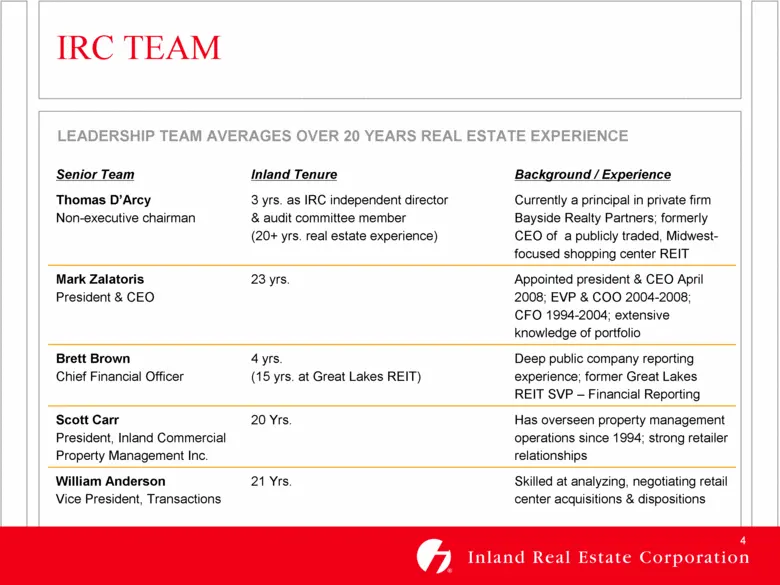
4 IRC TEAM Skilled at analyzing, negotiating retail center acquisitions & dispositions 21 Yrs. William Anderson Vice President, Transactions Has overseen property management operations since 1994; strong retailer relationships 20 Yrs. Scott Carr President, Inland Commercial Property Management Inc.
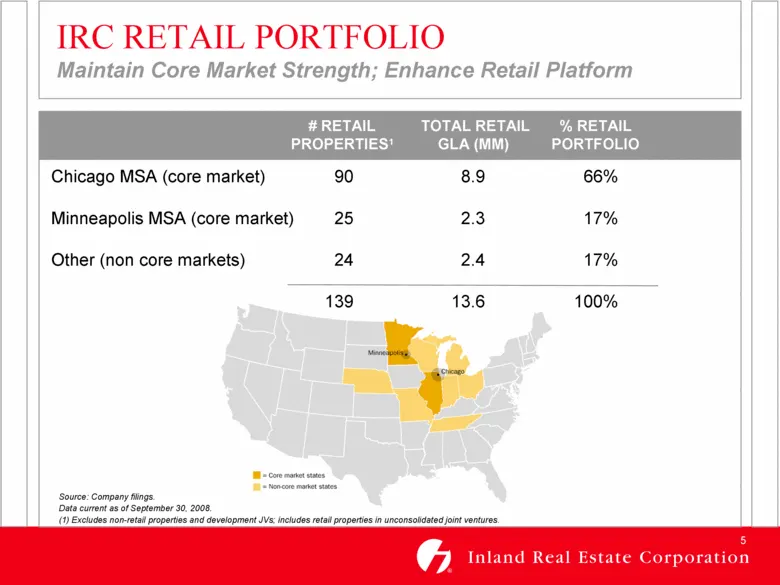
Slide 5: IRC Retail Portfolio
5 IRC RETAIL PORTFOLIO Maintain Core Market Strength; Enhance Retail Platform # RETAIL TOTAL RETAIL % RETAIL PROPERTIES1 GLA (MM) PORTFOLIO Source: Company filings. Data current as of September 30, 2008. (1) Excludes non-retail properties and development JVs; includes retail properties in unconsolid
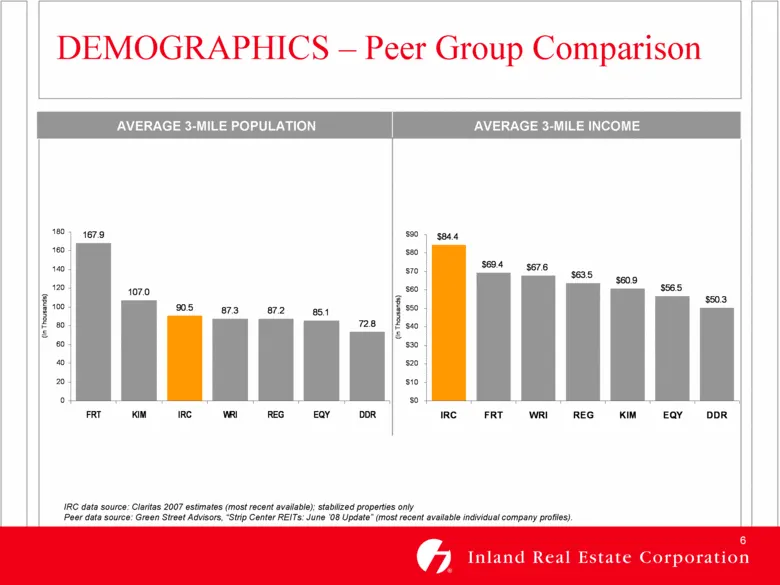
Slide 6: Demographics – Peer Group Comparison
6 DEMOGRAPHICS – Peer Group Comparison IRC data source: Claritas 2007 estimates (most recent available); stabilized properties only Peer data source: Green Street Advisors, “Strip Center REITs: June ’08 Update” (most recent available individual company profiles). AVERAGE 3-MILE INCOME AVERAGE 3-MILE
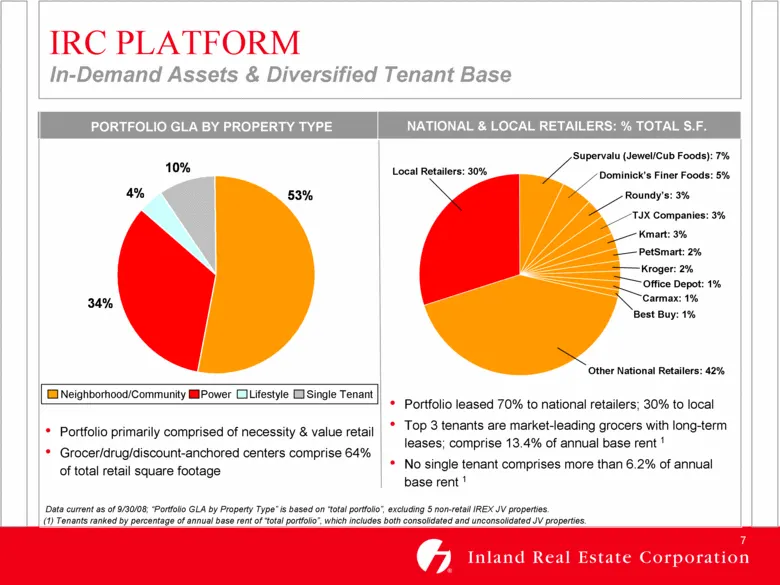
Slide 7: Portfolio GLA by Property Type; National & Local Retailers
7 PORTFOLIO GLA BY PROPERTY TYPE NATIONAL & LOCAL RETAILERS: % TOTAL S.F. IRC PLATFORM In-Demand Assets & Diversified Tenant Base • Portfolio leased 70% to national retailers; 30% to local • Top 3 tenants are market-leading grocers with long-term leases; comprise 13.4% of annual base rent 1 • No sin
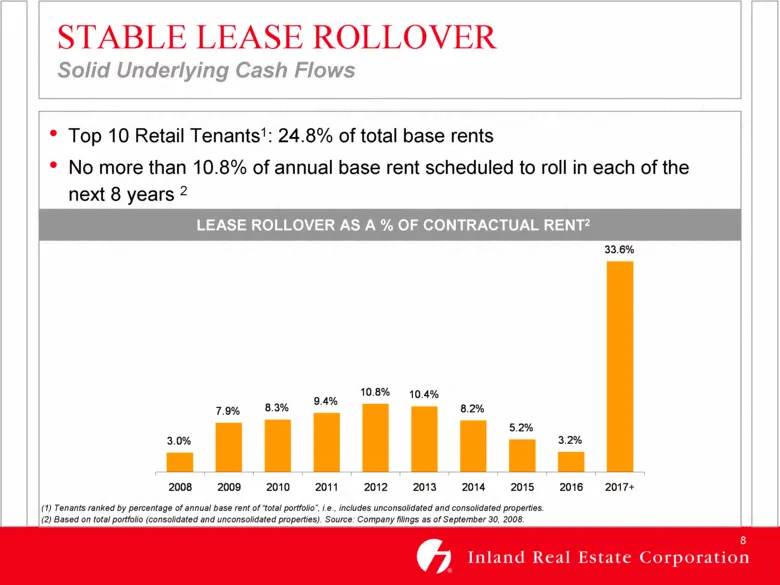
Slide 8: Stable Lease Rollover
8 STABLE LEASE ROLLOVER Solid Underlying Cash Flows • Top 10 Retail Tenants1: 24.8% of total base rents • No more than 10.8% of annual base rent scheduled to roll in each of the next 8 years 2 LEASE ROLLOVER AS A % OF CONTRACTUAL RENT2 LEASE ROLLOVER AS A % OF CONTRACTUAL RENT2 (1) Tenants ranked by
Slide 9: Rental Rate Growth
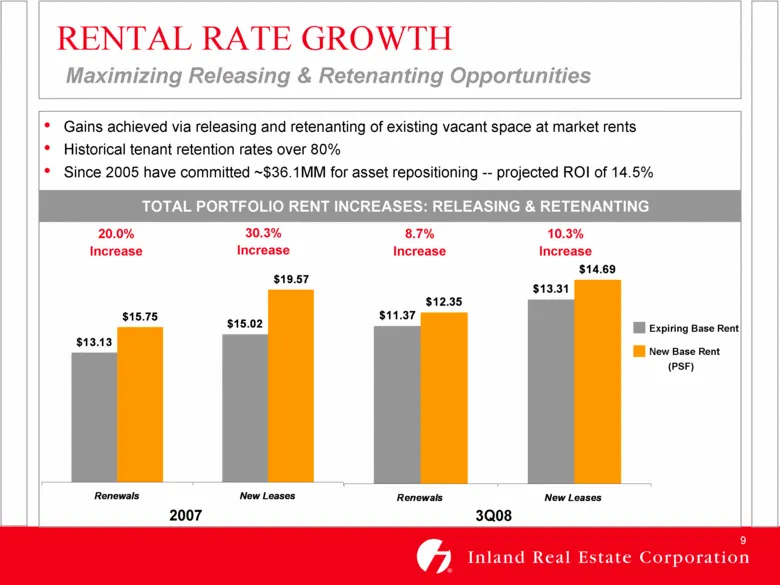
9 RENTAL RATE GROWTH Maximizing Releasing & Retenanting Opportunities • Gains achieved via releasing and retenanting of existing vacant space at market rents • Historical tenant retention rates over 80% • Since 2005 have committed ~$36.1MM for asset repositioning -- projected ROI of 14.5% RENT INCRE
Slide 10: Growth from Existing Portfolio: Asset Improvement Initiatives
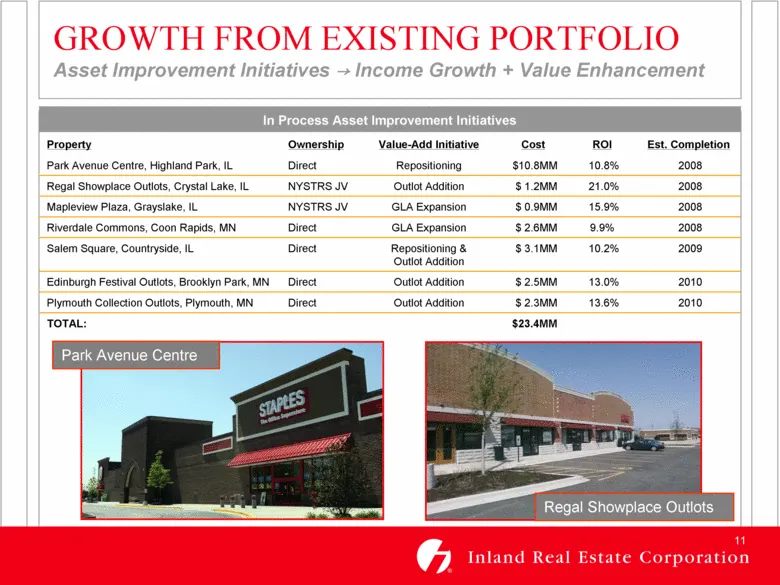
11 2008 9.9% $ 2.6MM GLA Expansion Direct Riverdale Commons, Coon Rapids, MN 2008 10.8% $10.8MM Repositioning Direct Park Avenue Centre, Highland Park, IL In Process Asset Improvement Initiatives $23.4MM $ 2.3MM $ 2.5MM $ 3.1MM $ 0.9MM $ 1.2MM Cost Direct Direct Direct NYSTRS JV NYSTRS JV Ownership
Slide 11: Critical Mass Has Its Benefits
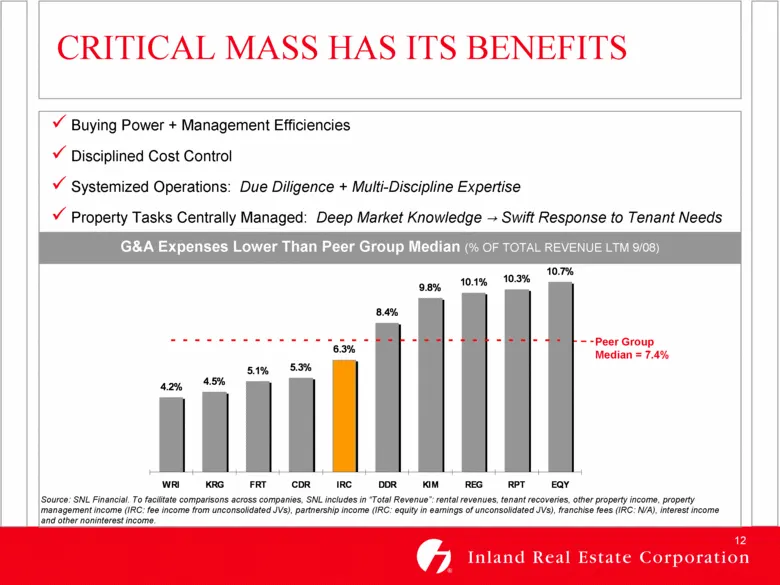
12 Source: SNL Financial. To facilitate comparisons across companies, SNL includes in “Total Revenue”: rental revenues, tenant recoveries, other property income, property management income (IRC: fee income from unconsolidated JVs), partnership income (IRC: equity in earnings of unconsolidated JVs),
Slide 12: Acquisitions Criteria
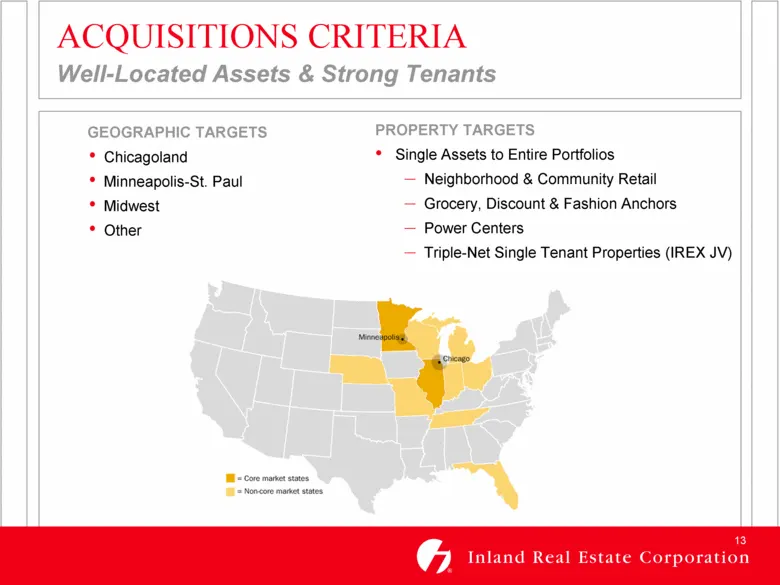
13 ACQUISITIONS CRITERIA Well-Located Assets & Strong Tenants PROPERTY TARGETS • Single Assets to Entire Portfolios – Neighborhood & Community Retail – Grocery, Discount & Fashion Anchors – Power Centers – Triple-Net Single Tenant Properties (IREX JV) GEOGRAPHIC TARGETS • Chicagoland • Minneapolis-S
Slide 13: Acquisition Opportunities Drive Growth
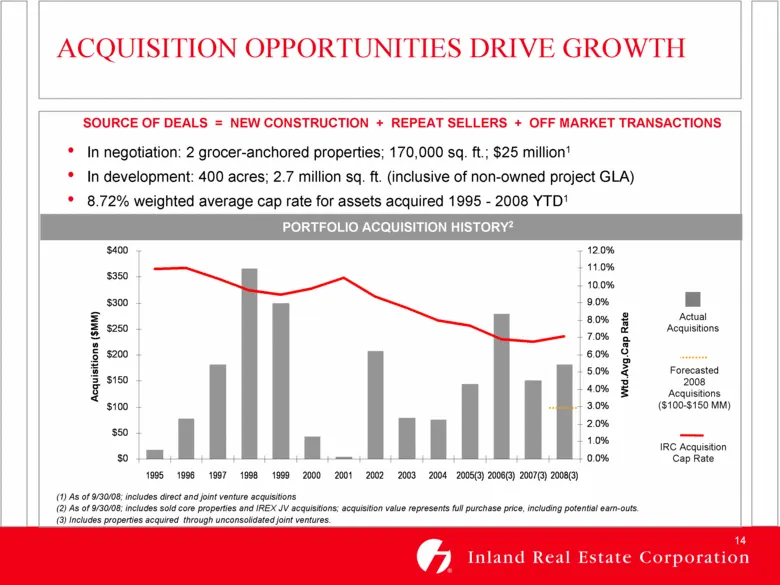
14 $0 $50 $100 $150 $200 $250 $300 $350 $400 1995 1996 1997 1998 1999 2000 2001 2002 2003 2004 2005(3) 2006(3) 2007(3) 2008(3) Acquisitions ($MM) 0.0% 1.0% 2.0% 3.0% 4.0% 5.0% 6.0% 7.0% 8.0% 9.0% 10.0% 11.0% 12.0% Wtd.Avg.Cap Rate (1) As of 9/30/08; includes direct and joint venture acquisitions (2)
Slide 14: Joint Ventures Build Value
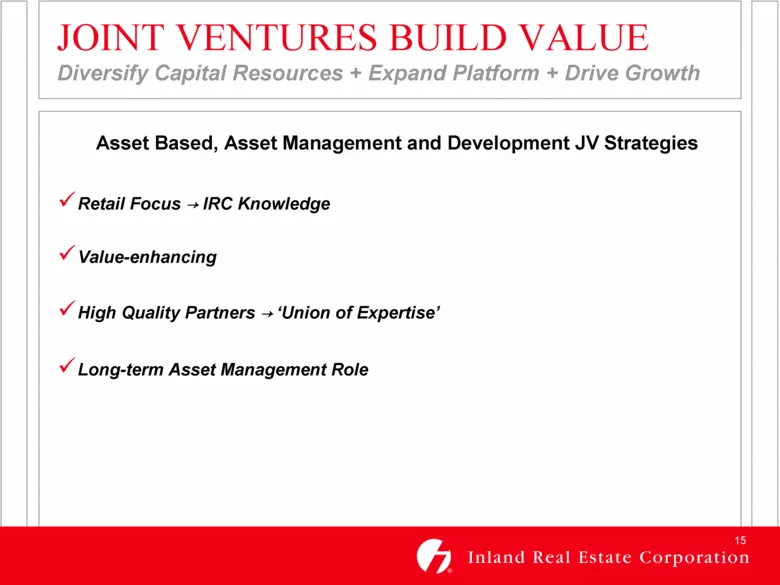
15 JOINT VENTURES BUILD VALUE Diversify Capital Resources + Expand Platform + Drive Growth Asset Based, Asset Management and Development JV Strategies Retail Focus .IRC Knowledge Value-enhancing High Quality Partners .‘Union of Expertise’ Long-term Asset Management Role
Slide 15: Joint Ventures Build Value: Asset-Based Joint Venture
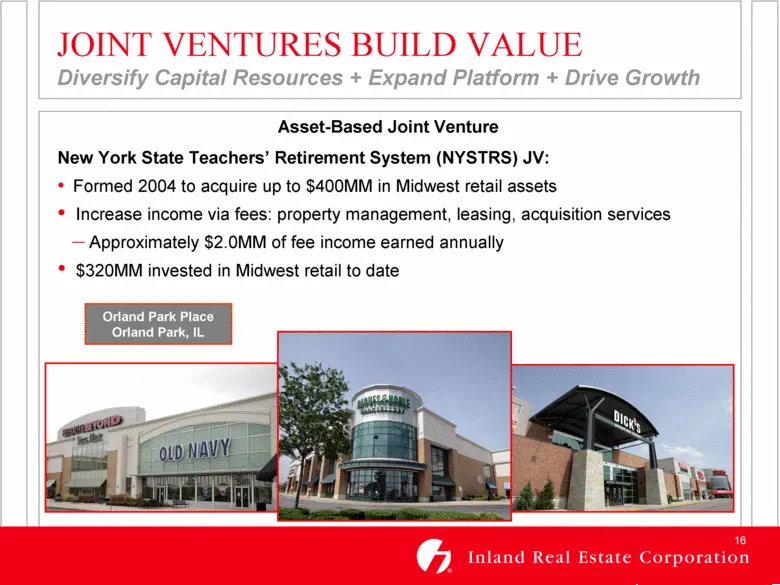
16 JOINT VENTURES BUILD VALUE Diversify Capital Resources + Expand Platform + Drive Growth Asset-Based Joint Venture New York State Teachers’ Retirement System (NYSTRS) JV: • Formed 2004 to acquire up to $400MM in Midwest retail assets • Increase income via fees: property management, leasing, acquis
Slide 16: Joint Ventures Build Value: Asset Management Joint Venture
17 JOINT VENTURES BUILD VALUE Diversify Capital Resources + Expand Platform + Drive Growth Asset Management Joint Venture Inland Real Estate Exchange Corporation (IREX): • Venture formed 9/06 to explore growth potential of 1031 exchange business • “Union of Expertise” – IRC provides acquisition / as
Slide 17: Joint Ventures Build Value: Development Joint Ventures
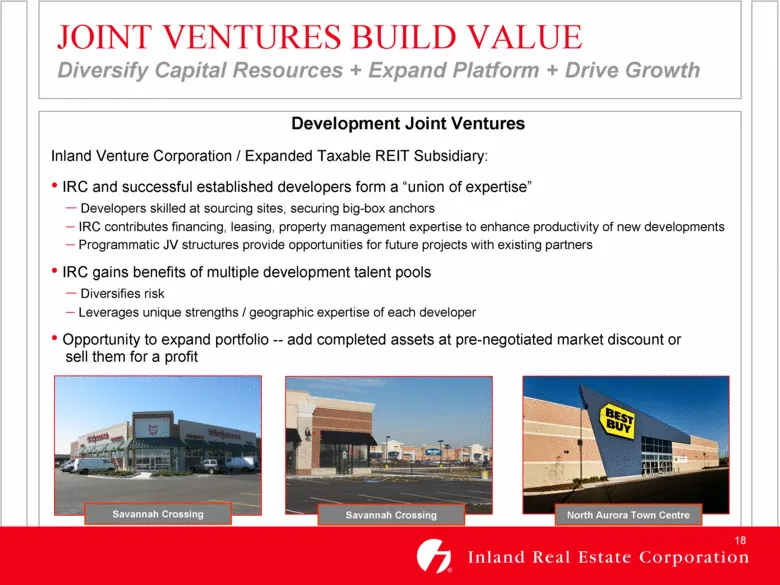
18 JOINT VENTURES BUILD VALUE Diversify Capital Resources + Expand Platform + Drive Growth Development Joint Ventures Inland Venture Corporation / Expanded Taxable REIT Subsidiary: • IRC and successful established developers form a “union of expertise” – Developers skilled at sourcing sites, securin
Slide 18: Development Joint Ventures
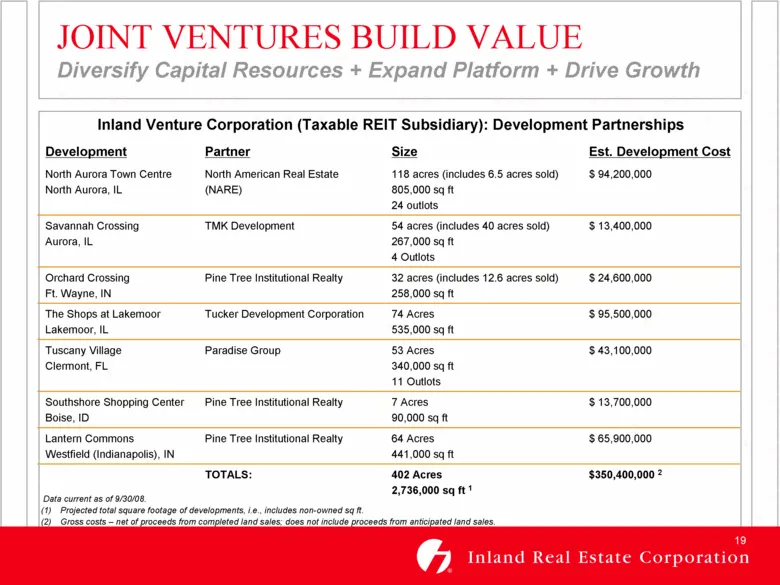
19 $ 65,900,000 64 Acres 441,000 sq ft Pine Tree Institutional Realty Lantern Commons Westfield (Indianapolis), IN $350,400,000 2 402 Acres 2,736,000 sq ft 1 TOTALS: $ 13,700,000 7 Acres 90,000 sq ft Pine Tree Institutional Realty Southshore Shopping Center Boise, ID $ 43,100,000 53 Acres 340,000 sq
Slide 19: IRC Today
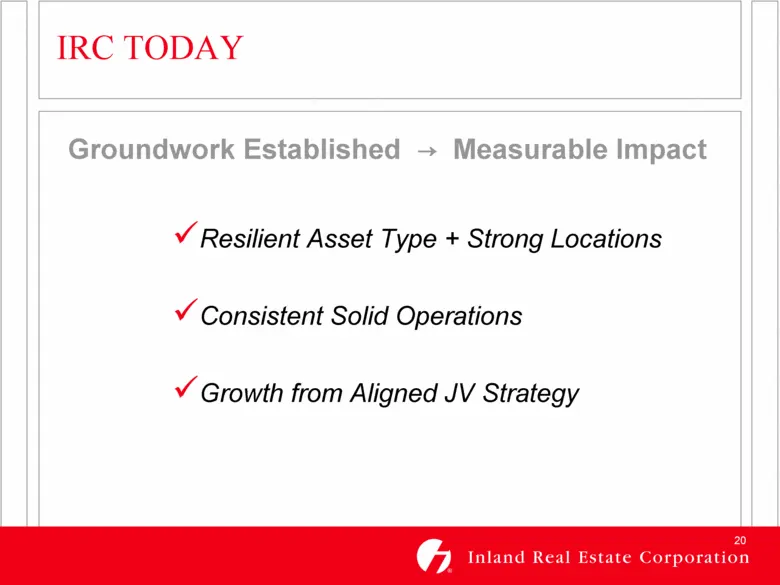
20 IRC TODAY Groundwork Established . Measurable Impact Resilient Asset Type + Strong Locations Consistent Solid Operations Growth from Aligned JV Strategy
Slide 20: IRC Financial Snapshot
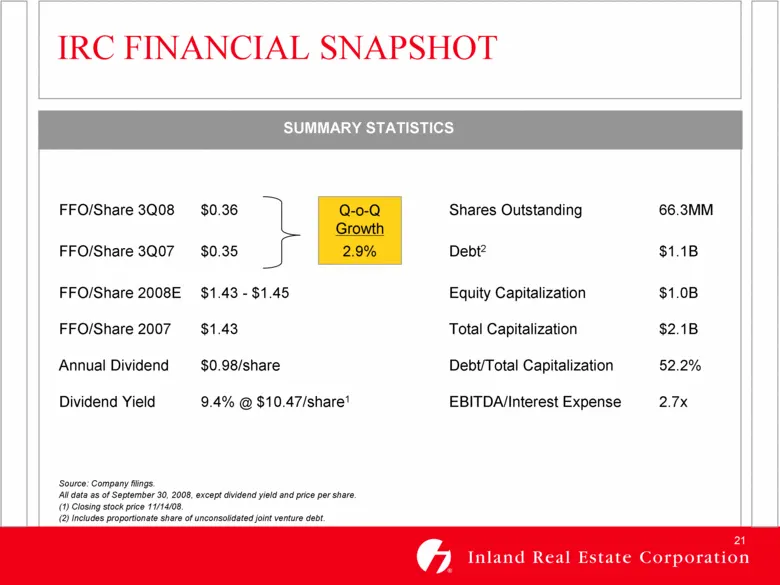
21 FFO/Share 3Q08 $0.36 Shares Outstanding 66.3MM FFO/Share 3Q07 $0.35 Debt2 $1.1B FFO/Share 2008E $1.43 - $1.45 Equity Capitalization $1.0B FFO/Share 2007 $1.43 Total Capitalization $2.1B Annual Dividend $0.98/share Debt/Total Capitalization 52.2% Dividend Yield 9.4% @ $10.47/share1 EBITDA/Interest
Slide 21: Financial Highlights
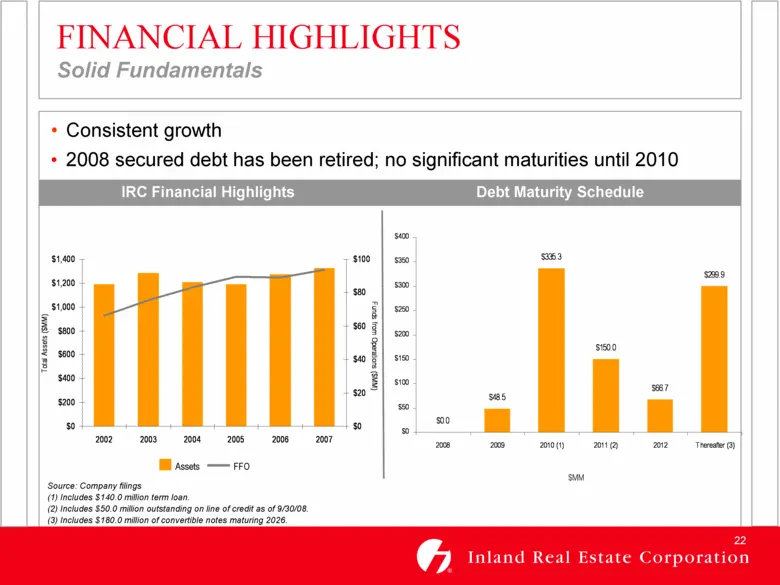
22 $0 $200 $400 $600 $800 $1,000 $1,200 $1,400 2002 2003 2004 2005 2006 2007 Total Assets ($MM) $0 $20 $40 $60 $80 $100 Funds from Operations ($MM) FINANCIAL HIGHLIGHTS Solid Fundamentals • Consistent growth • 2008 secured debt has been retired; no significant maturities until 2010 Source: Company f
Slide 22: Solid FFO & Dividend Growth
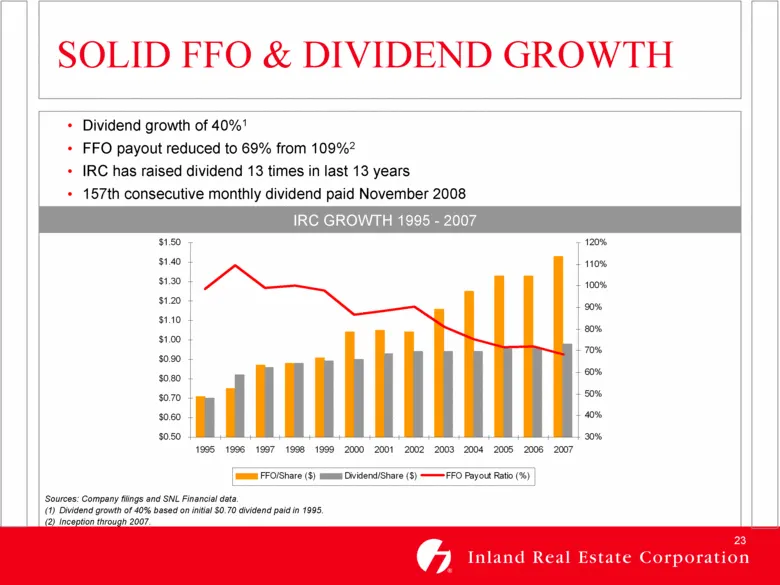
23 $0.50 $0.60 $0.70 $0.80 $0.90 $1.00 $1.10 $1.20 $1.30 $1.40 $1.50 1995 1996 1997 1998 1999 2000 2001 2002 2003 2004 2005 2006 2007 30% 40% 50% 60% 70% 80% 90% 100% 110% 120% FFO/Share ($) Dividend/Share ($) FFO Payout Ratio (%) SOLID FFO & DIVIDEND GROWTH • Dividend growth of 40%1 • FFO payout re
Slide 23: IRC Today
24 IRC TODAY Focus on Value and Necessity-Based Retail Asset Concentration in Demographically Strong Midwest Markets Solid Performance & Core Operations Growth Potential . Joint Ventures + Redevelopment + Leasing / Releasing Tenured Team
Source: SEC EDGAR · 8-K filed Nov 19, 2008
More decks from Inland Real Estate Corp
 Investor Presentation (November 2015)30 slides · Nov 17, 2015
 Investor Presentation (September 2015)29 slides · Sep 16, 2015
 Investor Presentation (June 2015)29 slides · Jun 9, 2015
 Investor Presentation (May 2015)26 slides · May 15, 2015
 Investor Presentation (February 2015)26 slides · Feb 24, 2015
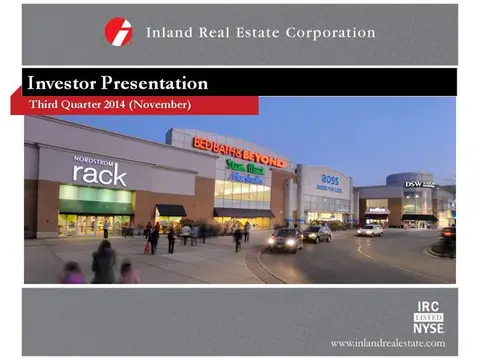 Investor Presentation (November 2014)26 slides · Nov 5, 2014