EPIQ Systems — Q1 2014 Earnings Presentation
13 slides from EPIQ Systems's earnings presentation, Apr 29, 2014

Slide 1: First Quarter 2014 Earnings Conference Call
SYSTEMS First Quarter 2014 Earnings Conference Call April 29, 2014 NASDAQ: EPIQ www.epiqsystems.com
Slide 2: Forward Looking and Cautionary Statements
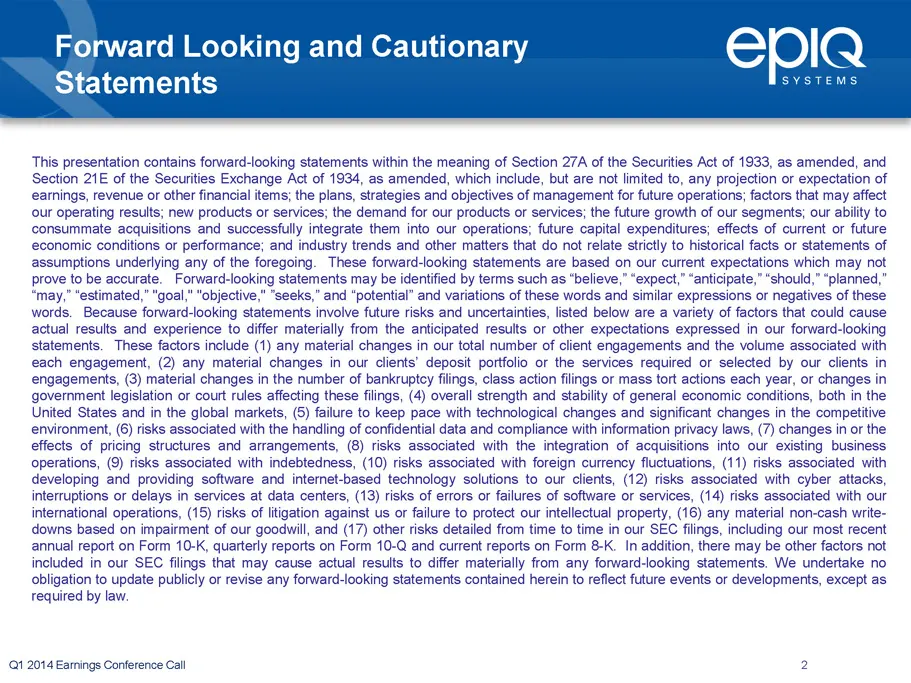
Forward Looking and Cautionary EplQ Statements SYSTEMS This presentation contains forward-looking statements within the meaning of Section 27A of the Securities Act of 1933, as amended, and Section 21E of the Securities Exchange Act of 1934, as amended, which include, but are not limited to, any pro
Slide 3: Use of non-GAAP Measures
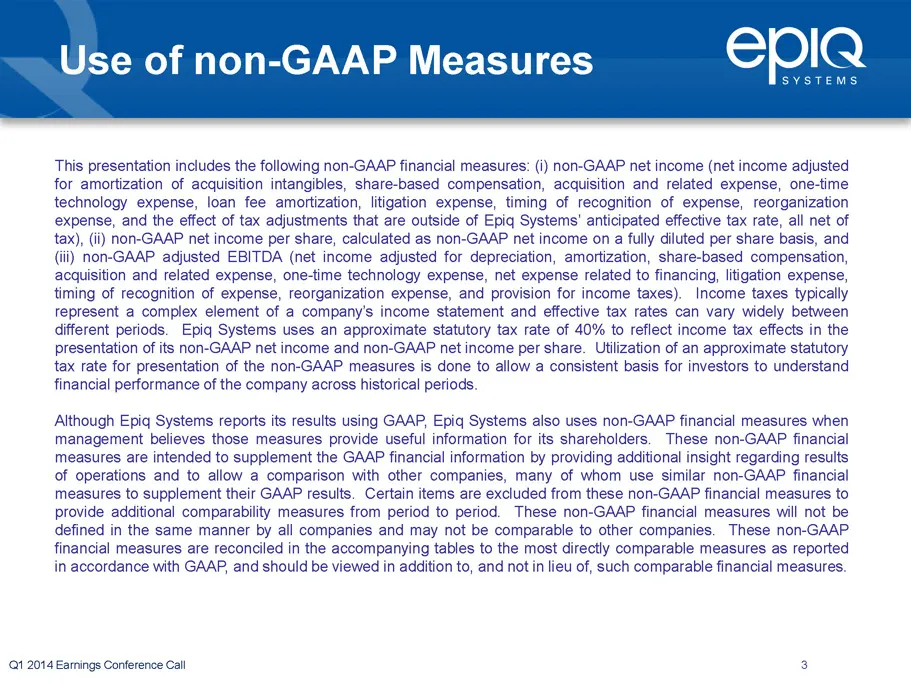
Use of non-GAAP Measures EplQ SYSTEMS This presentation includes the following non-GAAP financial measures: (i) non-GAAP net income (net income adjusted for amortization of acquisition intangibles, share-based compensation, acquisition and related expense, one-time technology expense, loan fee amort
Slide 4: Q1 Highlights
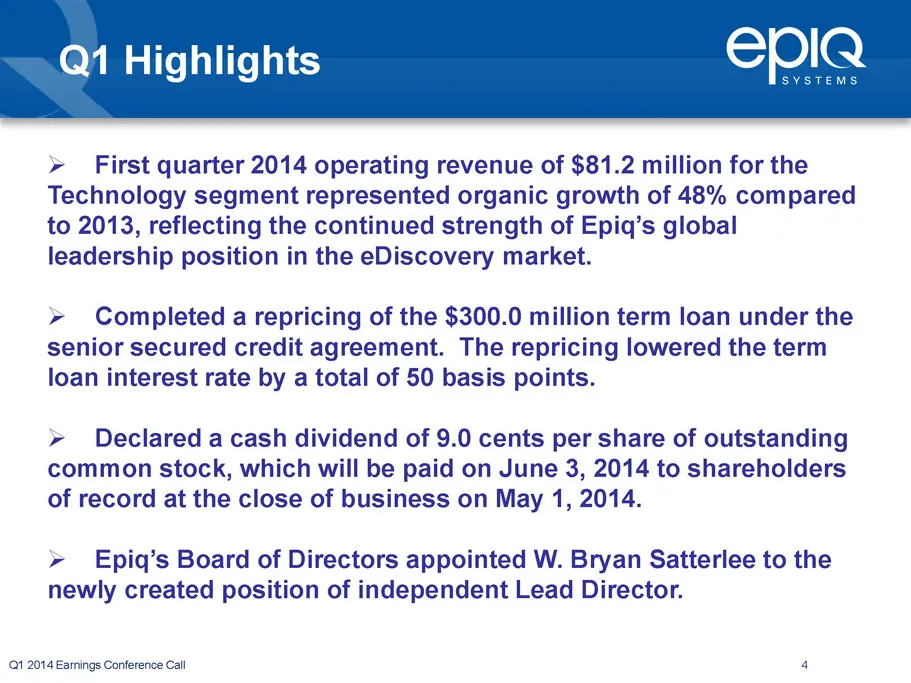
Q1 Highlights > First quarter 2014 operating revenue of $81.2 million for the Technology segment represented organic growth of 48% compared to 2013, reflecting the continued strength of Epiq’s global leadership position in the eDiscovery market. » Completed a repricing of the $300.0 million term loa
Slide 5: Financial Results
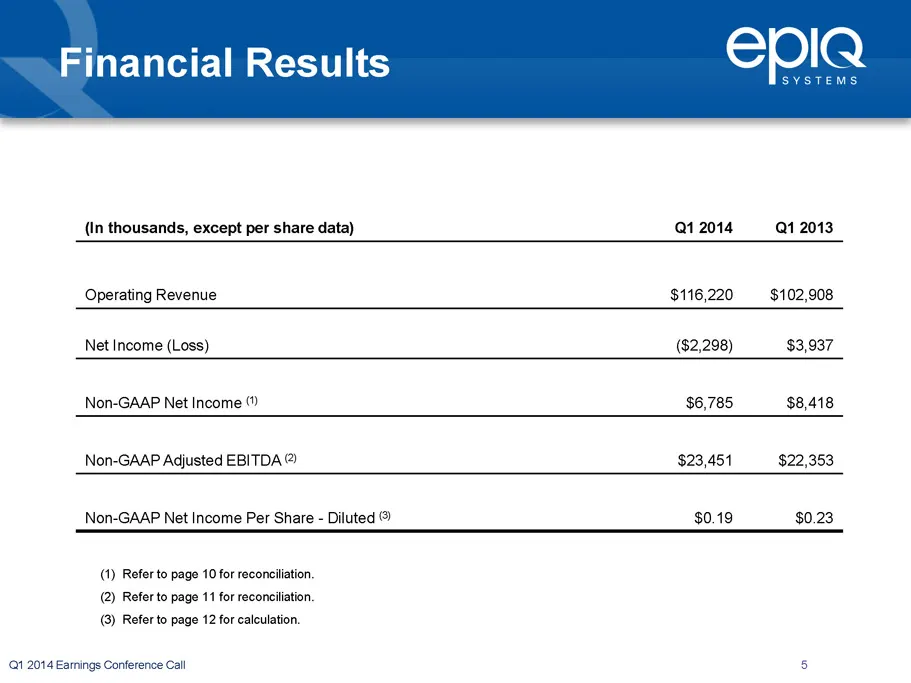
Financial Results (In thousands, except per share data) 12014 12013 Operating Revenue $116,220 $102,908 Net Income (Loss) ($2,298) $3,937 Non-GAAP Net Income (? $6,785 $8,418 Non-GAAP Adjusted EBITDA ®) $23,451 $22,353 Non-GAAP Net Income Per Share - Diluted © $0.19 $0.23 (1) Refer to page 10 for re
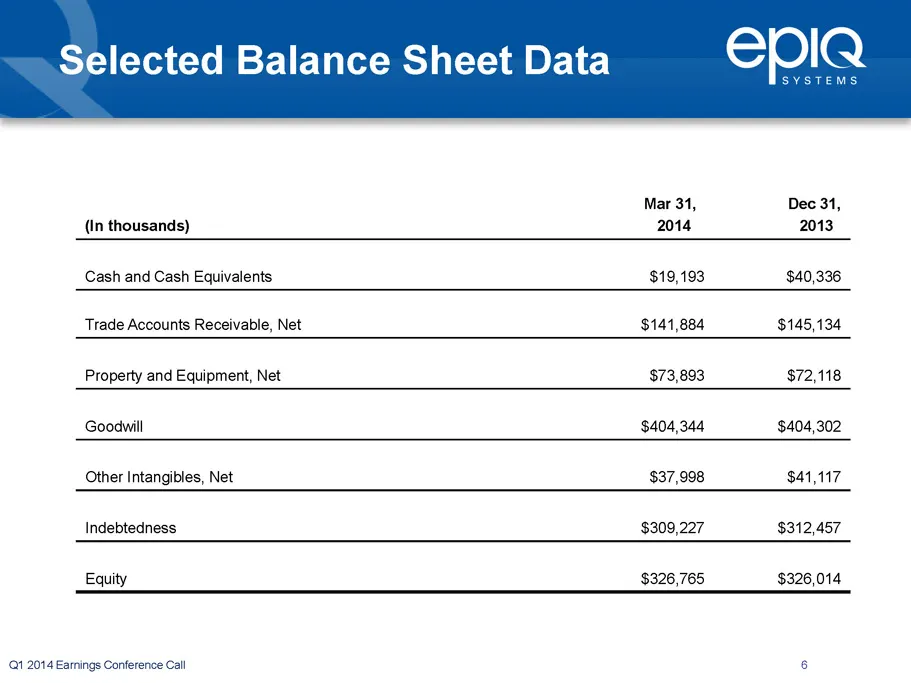
Slide 6: Selected Balance Sheet Data
Selected Balance Sheet Data epla SYSTEMS Mar 31, Dec 31, (In thousands) 2014 2013 Cash and Cash Equivalents $19,193 $40,336 Trade Accounts Receivable, Net $141,884 $145,134 Property and Equipment, Net $73,893 $72,118 Goodwill $404,344 $404,302 Other Intangibles, Net $37,998 $41,117 Indebtedness $309
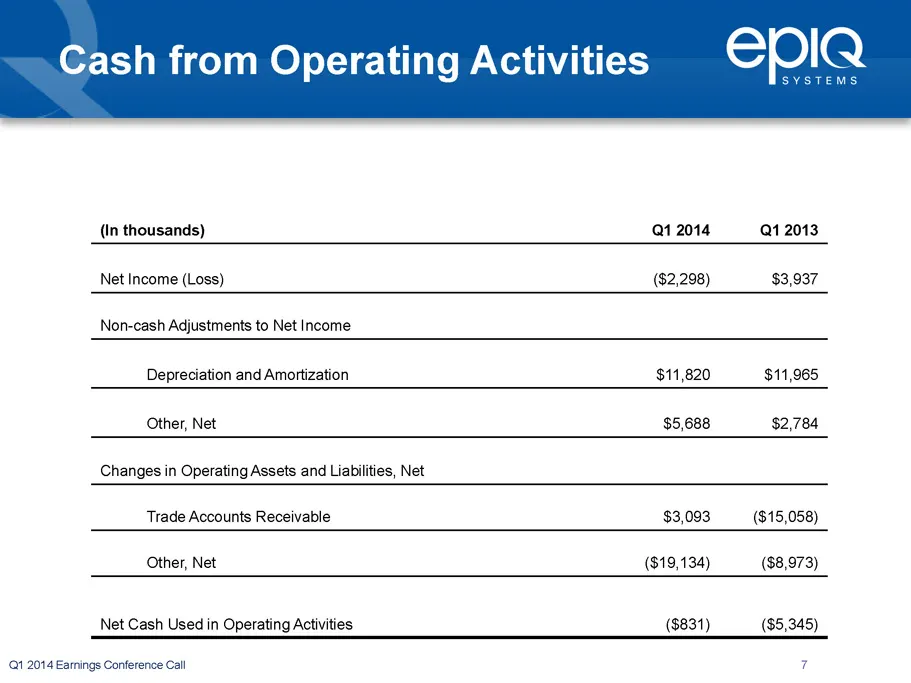
Slide 7: Cash from Operating Activities
Cash from Operating Activities epla SYSTEMS (In thousands) Q1 2014 Q1 2013 Net Income (Loss) ($2,298) $3,937 Non-cash Adjustments to Net Income Depreciation and Amortization $11,820 $11,965 Other, Net $5,688 $2,784 Changes in Operating Assets and Liabilities, Net Trade Accounts Receivable $3,093 ($1
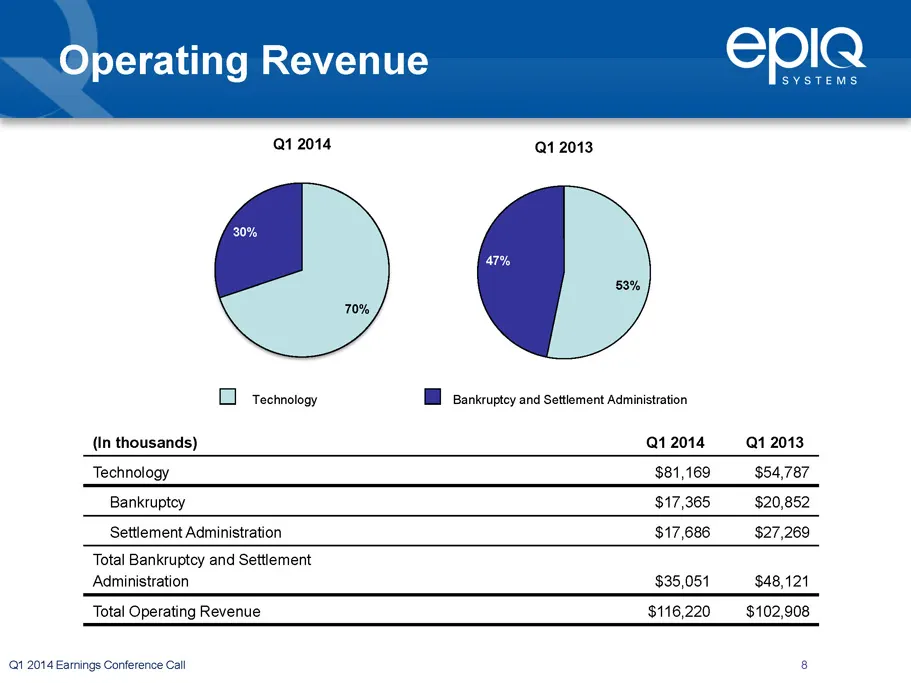
Slide 8: Operating Revenue
Operating Revenue Q1 2014 Q1 2013 technology TH Bankruptcy and Settlement Administration (In thousands) Q12014 12013 Technology $81,169 $54,787 Bankruptey $17,365 $20,852 Settlement Administration $17,686 $27,269 Total Bankruptcy and Settlement Administration $35,051 $48,121 Total Operating Revenue
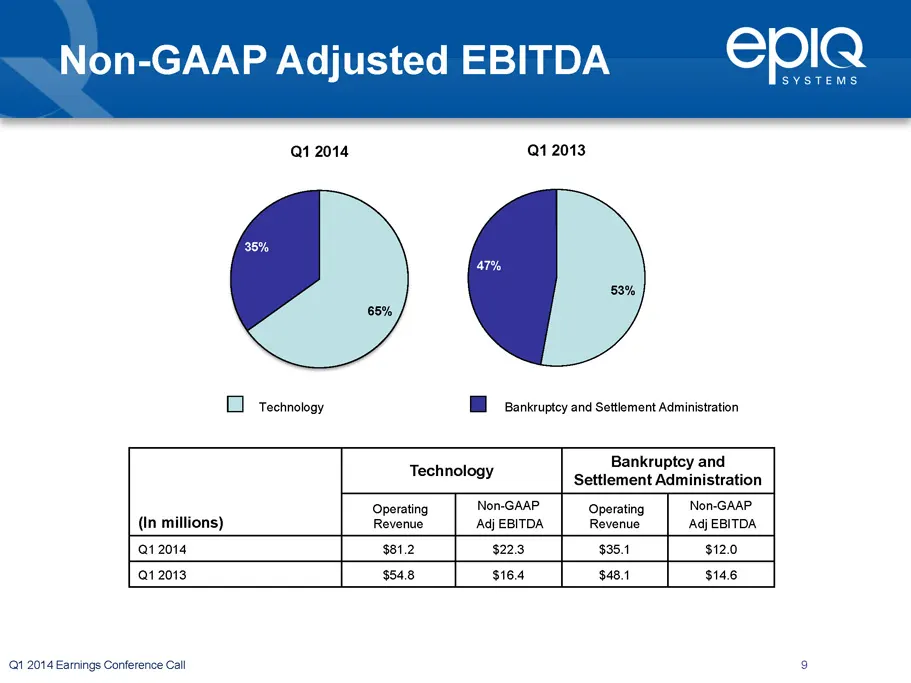
Slide 9: Non-GAAP Adjusted EBITDA
Non-GAAP Adjusted EBITDA =9© CPIQ SYSTEMS Q1 2014 Q1 2013 Technology BH Bankruptcy and Settlement Administration Technology ssomement Meinirisistion Operating NonGAae. Operating Mestoeasid (in millions) Revenue AdjEBITOA | _ Revenue Adj EBITDA Q12014 $81.2 $22.3 $35.1 $12.0 Q1 2013 $54.8 $16.4 $48.1
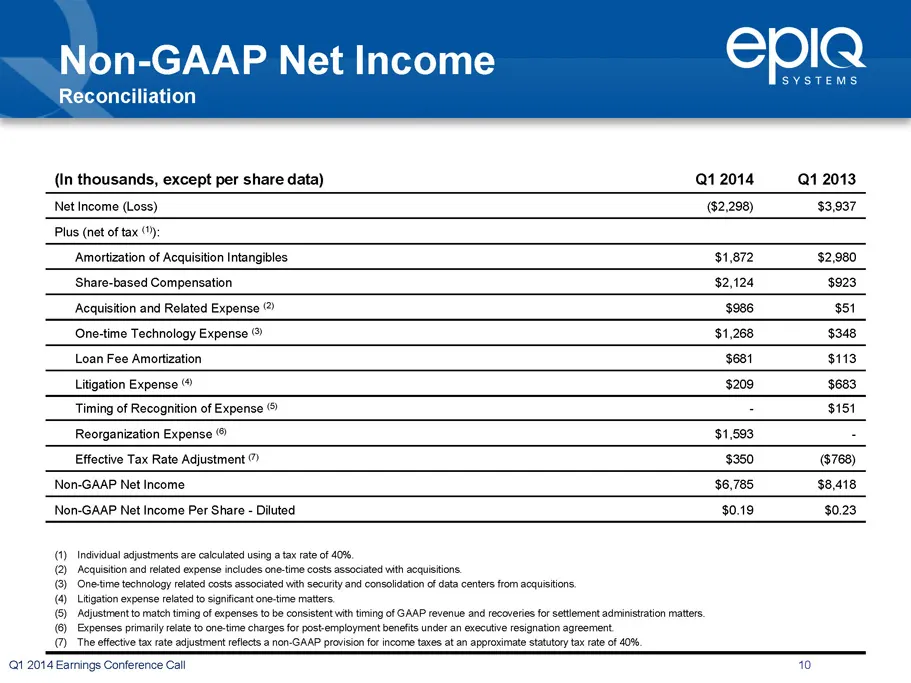
Slide 10: Non-GAAP Net Income Reconciliation
Non-GAAP Net Income Reconciliation (In thousands, except per share data) Q12014 1.2013 Net Income (Loss) ($2,298) $3,937 Plus (net of tax ‘) Amortization of Acquisition Intangibles $1,872 $2,980 Share-based Compensation $2,124 $923 Acquisition and Related Expense ) $986 ‘$51 One-time Technology Expe
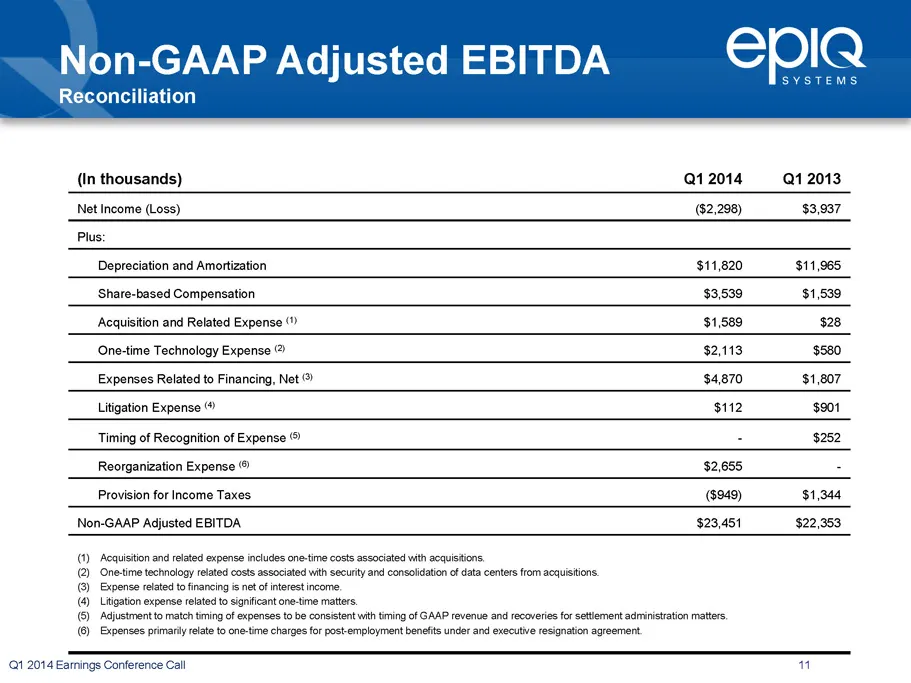
Slide 11: Non-GAAP Adjusted EBITDA Reconciliation
Non-GAAP Adjusted EBITDA Reconciliation (In thousands) Q12014 —Q12013 Net income (Loss) (82,298) $3,937 Pl Depreciation and Amortization $11,820 $11,965 ‘Share-based Compensation $3,539 $1,539 ‘Acquisition and Related Expense $1,589 $28 One-time Technology Expense 2 $2,113 $580 Expenses Related to F
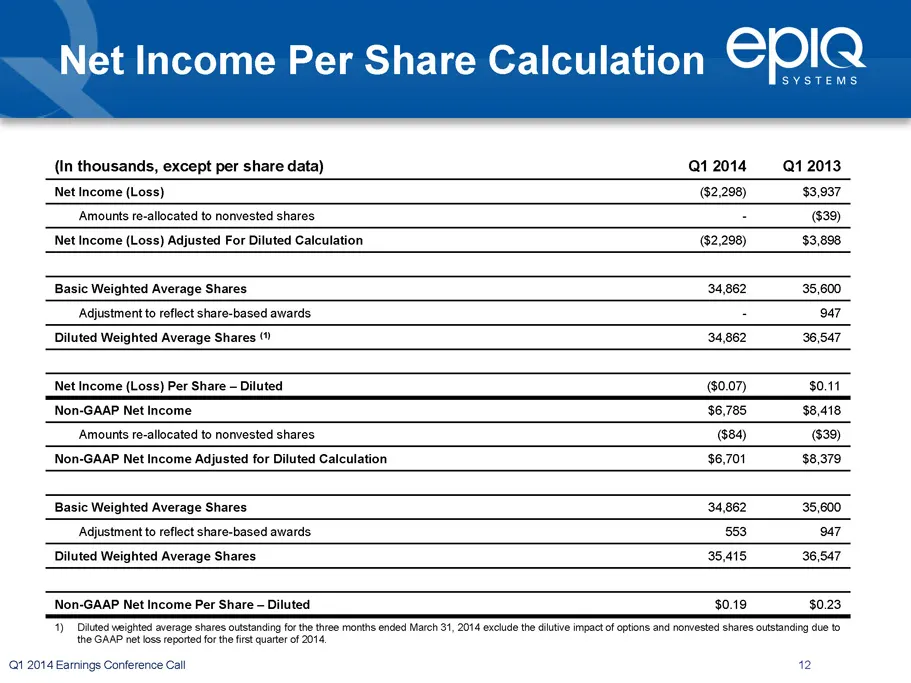
Slide 12: Net Income Per Share Calculation
Net Income Per Share Calculation EplaQ SYSTEMS (in thousands, except per share data) Q12014 _Q12013 Net income (Loss) (62,298) $3,937 “Amounts re-allocated to nonvested shares - (39) Net Income (Loss) Adjusted For Diluted Calculation ($2,298) $3,898 Basic Weighted Average Shares 34,862 35,600 Adjust

Slide 13: Investor Relations Contact
eDIQ SYSTEMS Lew Schroeber Investor Relations (913) 621-9500 IR@epigsystems.com NASDAQ: EPIQ www.epiqsystems.com
Source: SEC EDGAR · 8-K filed Apr 29, 2014
More decks from EPIQ Systems Inc
 Q2 2016 Earnings Presentation12 slides · Aug 9, 2016
 Q1 2016 Earnings Presentation12 slides · May 3, 2016
 FY2015 Earnings Presentation13 slides · Mar 1, 2016
 Q3 2015 Earnings Presentation11 slides · Nov 3, 2015
 Q2 2015 Earnings Presentation11 slides · Aug 3, 2015
 Q1 2015 Earnings Presentation11 slides · Apr 28, 2015